Article

A Survey of Organic Carbon Stocks in Mineral Soils of Eucalyptus globulus Labill. Plantations under Mediterranean Climate Conditions

1
RAIZ—Forest and Paper Research Institute, Quinta de S. Francisco, Rua José Estevão, 3800-783 Aveiro, Portugal
2
Centro de Química—Vila Real, Universidade de Trás-os-Montes e Alto Douro, 5001-911 Vila Real, Portugal
*
Author to whom correspondence should be addressed.
Forests 2024, 15(8), 1335; https://doi.org/10.3390/f15081335
Submission received: 30 June 2024 / Revised: 23 July 2024 / Accepted: 28 July 2024 / Published: 1 August 2024
(This article belongs to the Special Issue Forest Plant, Soil, Microorganisms and Their Interactions)

Abstract

:
The main aim of this study was to assess the amount of carbon (C) stored in the upper 30 cm layer of mineral soils in eucalypt plantations in Portugal, with a Mediterranean-type climate. Soil sampling data (2468 samples), field evaluations (soil profile description) and relevant information on the particle size distribution, climate, bedrock and reference soil group were accomplished. Bulk density per sample was assessed using pedo-transfer functions and soil C stock was estimated. The results showed an average of 41.2 t C ha−1 stored in the soil. In the northern regions of Portugal, the coldest and wettest areas of the country with better stand productivity, a higher soil organic carbon (SOC) is achieved (median SOC of 39.2 g kg−1 and soil C stock of 55 t ha−1) than in southern and inland regions, with a warmer and drier climate (median SOC of 15.2 g kg−1 and soil C stock of 28 t ha−1). The assessment of mean soil C stock per bedrock type revealed higher C stored in granites followed by conglomerates, coal shales and clay shales. Regarding soil type, the results showed a higher C stock in Cambisols, Leptosols and Fluvisols (>50 t C ha−1), whereas Regosols and Luvisols stored less, following the same trend presented for reference soil groups in Europe. Comparing the geographic distribution of the C stock in the upper layer of the mineral soils with the amount of C in eucalyptus stands (root and aboveground biomass—data from national forest inventory), the mineral soil pool can represent more than two-thirds of the total C stored in eucalyptus plantations in Portugal. Further studies should focus on the evolution of C stocks in eucalypt plantations during different stages of stand growth and under different management practices.

1. Introduction

Forests account for around 31% of the planet’s continental surface [1] and play an important role in regulating hydrological and carbon (C) cycles at a global level [2,3,4,5]. Forests and their derived products are key elements in mitigating global warming, acting as reservoirs and, in some cases, also as C sinks [6,7,8]. A net C sink of −7.6 ± 49 PgCO2e yr−1 was estimated for global forests, considering a balance between gross C removals (−15.6 ± 49 PgCO2e yr−1) and gross emissions from deforestation and other disturbances (8.1 ± 2.5 PgCO2e yr−1) [9]. In fact, the noticeable potential of forests for C sequestration has been extensively addressed [10,11,12,13]. Carbon stocks are dynamic and influenced by continuous processes, such as tree growth, and by discrete events, namely fires and disturbances caused by pests and diseases or land-use change [14]. Carbon pools may be gathered in five main components as described by the Intergovernmental Panel on Climate Change (IPCC): aboveground biomass (wood and leaves), belowground biomass (roots), soil C in mineral layers, soil organic layer (forest floor, dead biomass in decomposition above soil surface) and harvested wood products. These pools of the C cycle, input and output fluxes from the system, and transfers, are presented in Figure 1.
Around two-thirds of global soil C is held as soil organic C (SOC), as a result of decaying vegetation, fungi and bacteria growth and the metabolic activities of living organisms, the remainder being inorganic C [16,17]. The average SOC stocks in Europe account for 22.1 t C ha−1 in forest floors, 108 t C ha−1 in mineral soils and 578 t C ha−1 in peat soils to a 1 m depth [18]. Considering the total area covered by forest at the European scale (163 M ha), a total stock of 3.50–3.94 Pg C was estimated in forest floors and 21.4–22.7 Pg C in mineral and peat soils up to a 1 m depth.
About 36% of the Portuguese mainland is forested, with more than 800 thousand hectares occupied with eucalypt, mostly Eucalyptus globulus L. [19]. Around 50% of the total C in forest areas is stored in the soil, even if it is quite variable with region, forest type and trees’ age [20]. Some studies suggest even a higher proportion in the soil of E. globulus stands, with around 200 t C ha−1 in the soil, up to 1 m deep [21]. Also, in a six-year-old stand of E. globulus established in Arenosols, on the central coast of Portugal, the C storage in the soil and in the organic layer was estimated to be 42 to 63 t C ha−1, respectively, depending on the water and nutrient availability [22]. In Chile, the total C stocks in the aboveground and belowground biomass, forest floor and soil in E. globulus plantations were around 254 Mg ha−1 (at the end of rotation), with 30% to 50% being stored in the soil [23]. Despite the studies carried out thus far, the knowledge about the amount of C stored in soils on eucalypt stands in Portugal and its spatial distribution is still very limited. Thus, the main aim of this study is to assess the amount of C stored in Portuguese mineral topsoil (0–30 cm) in eucalypt managed forests.

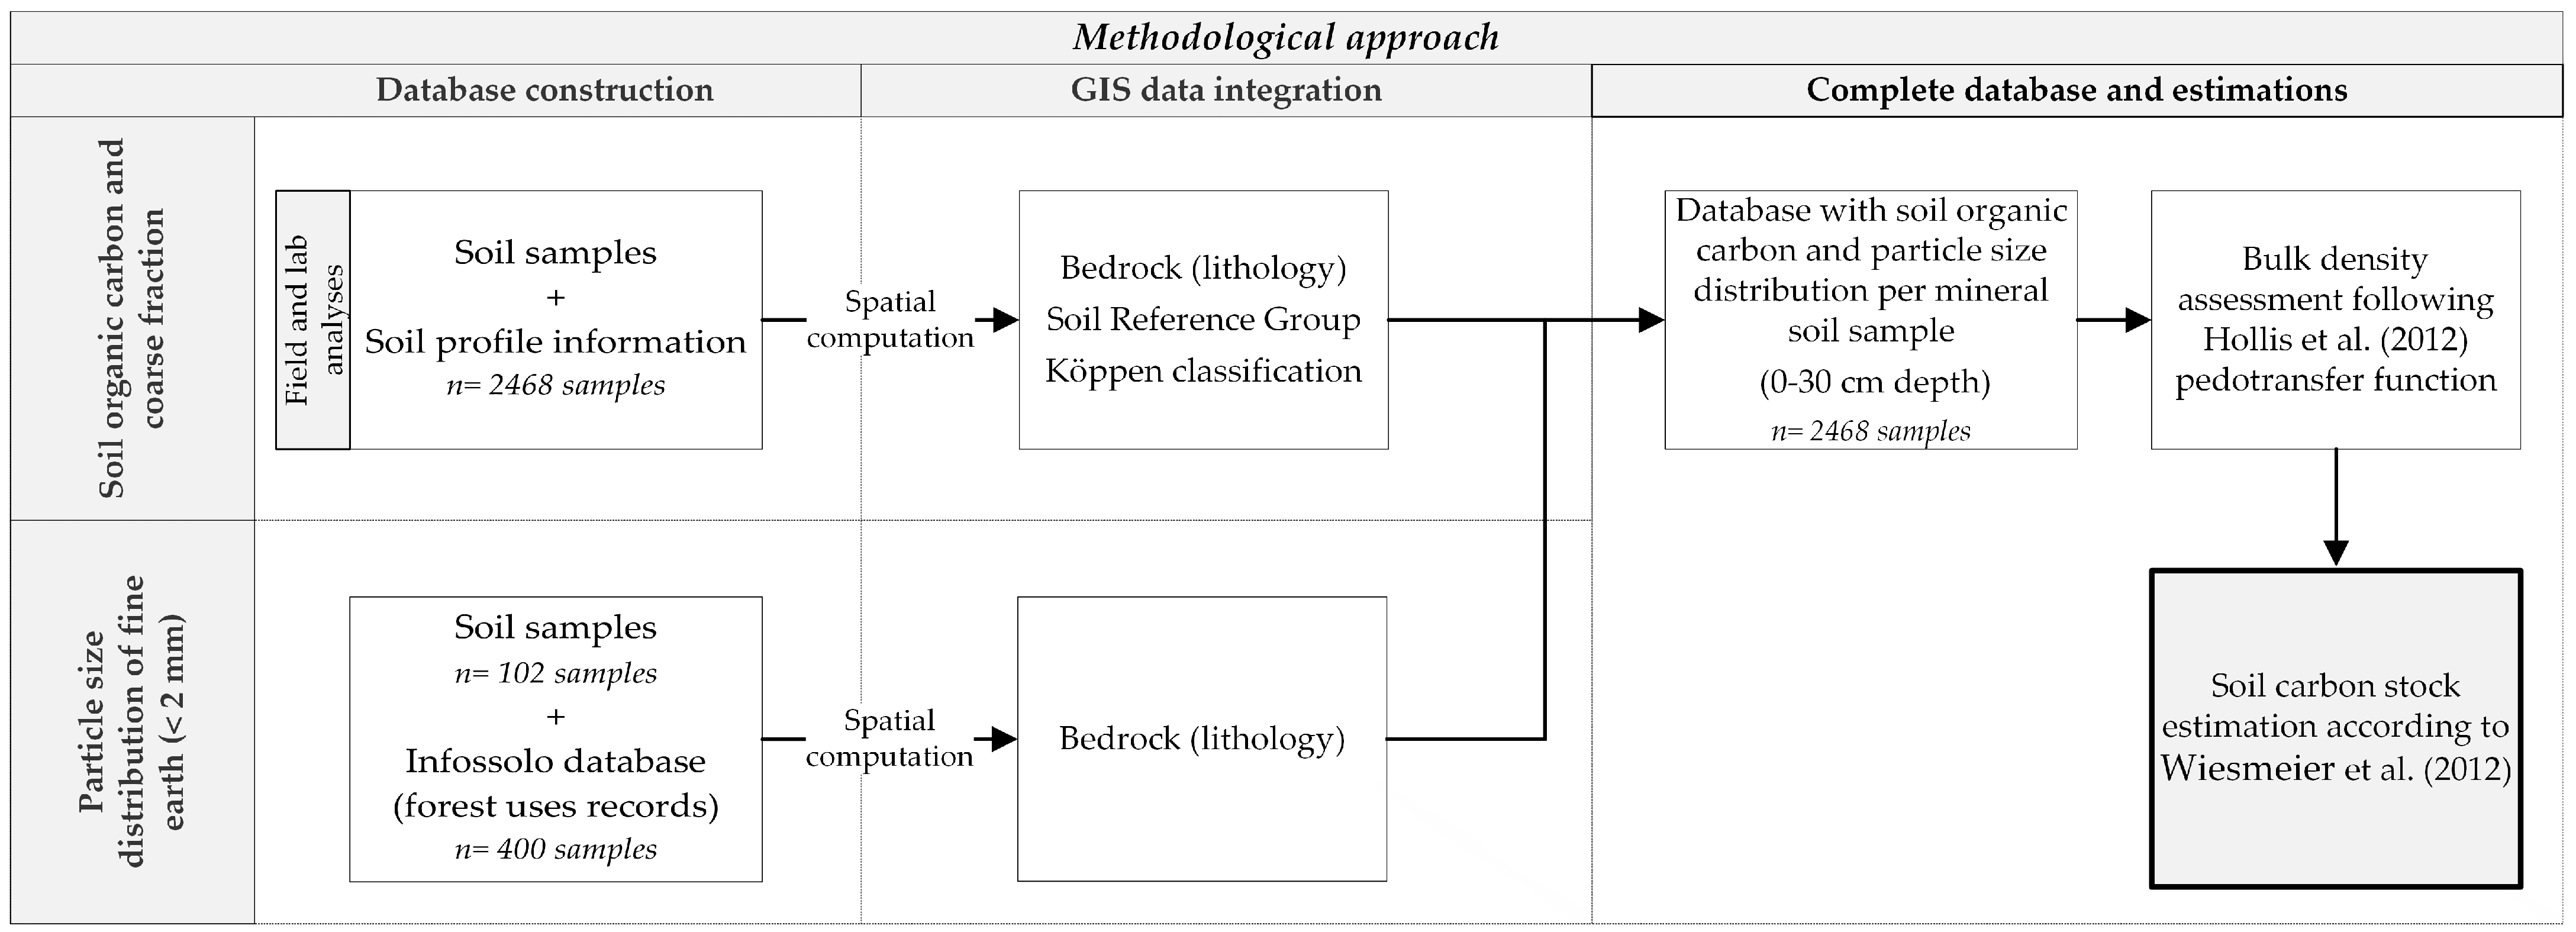
2. Materials and Methods

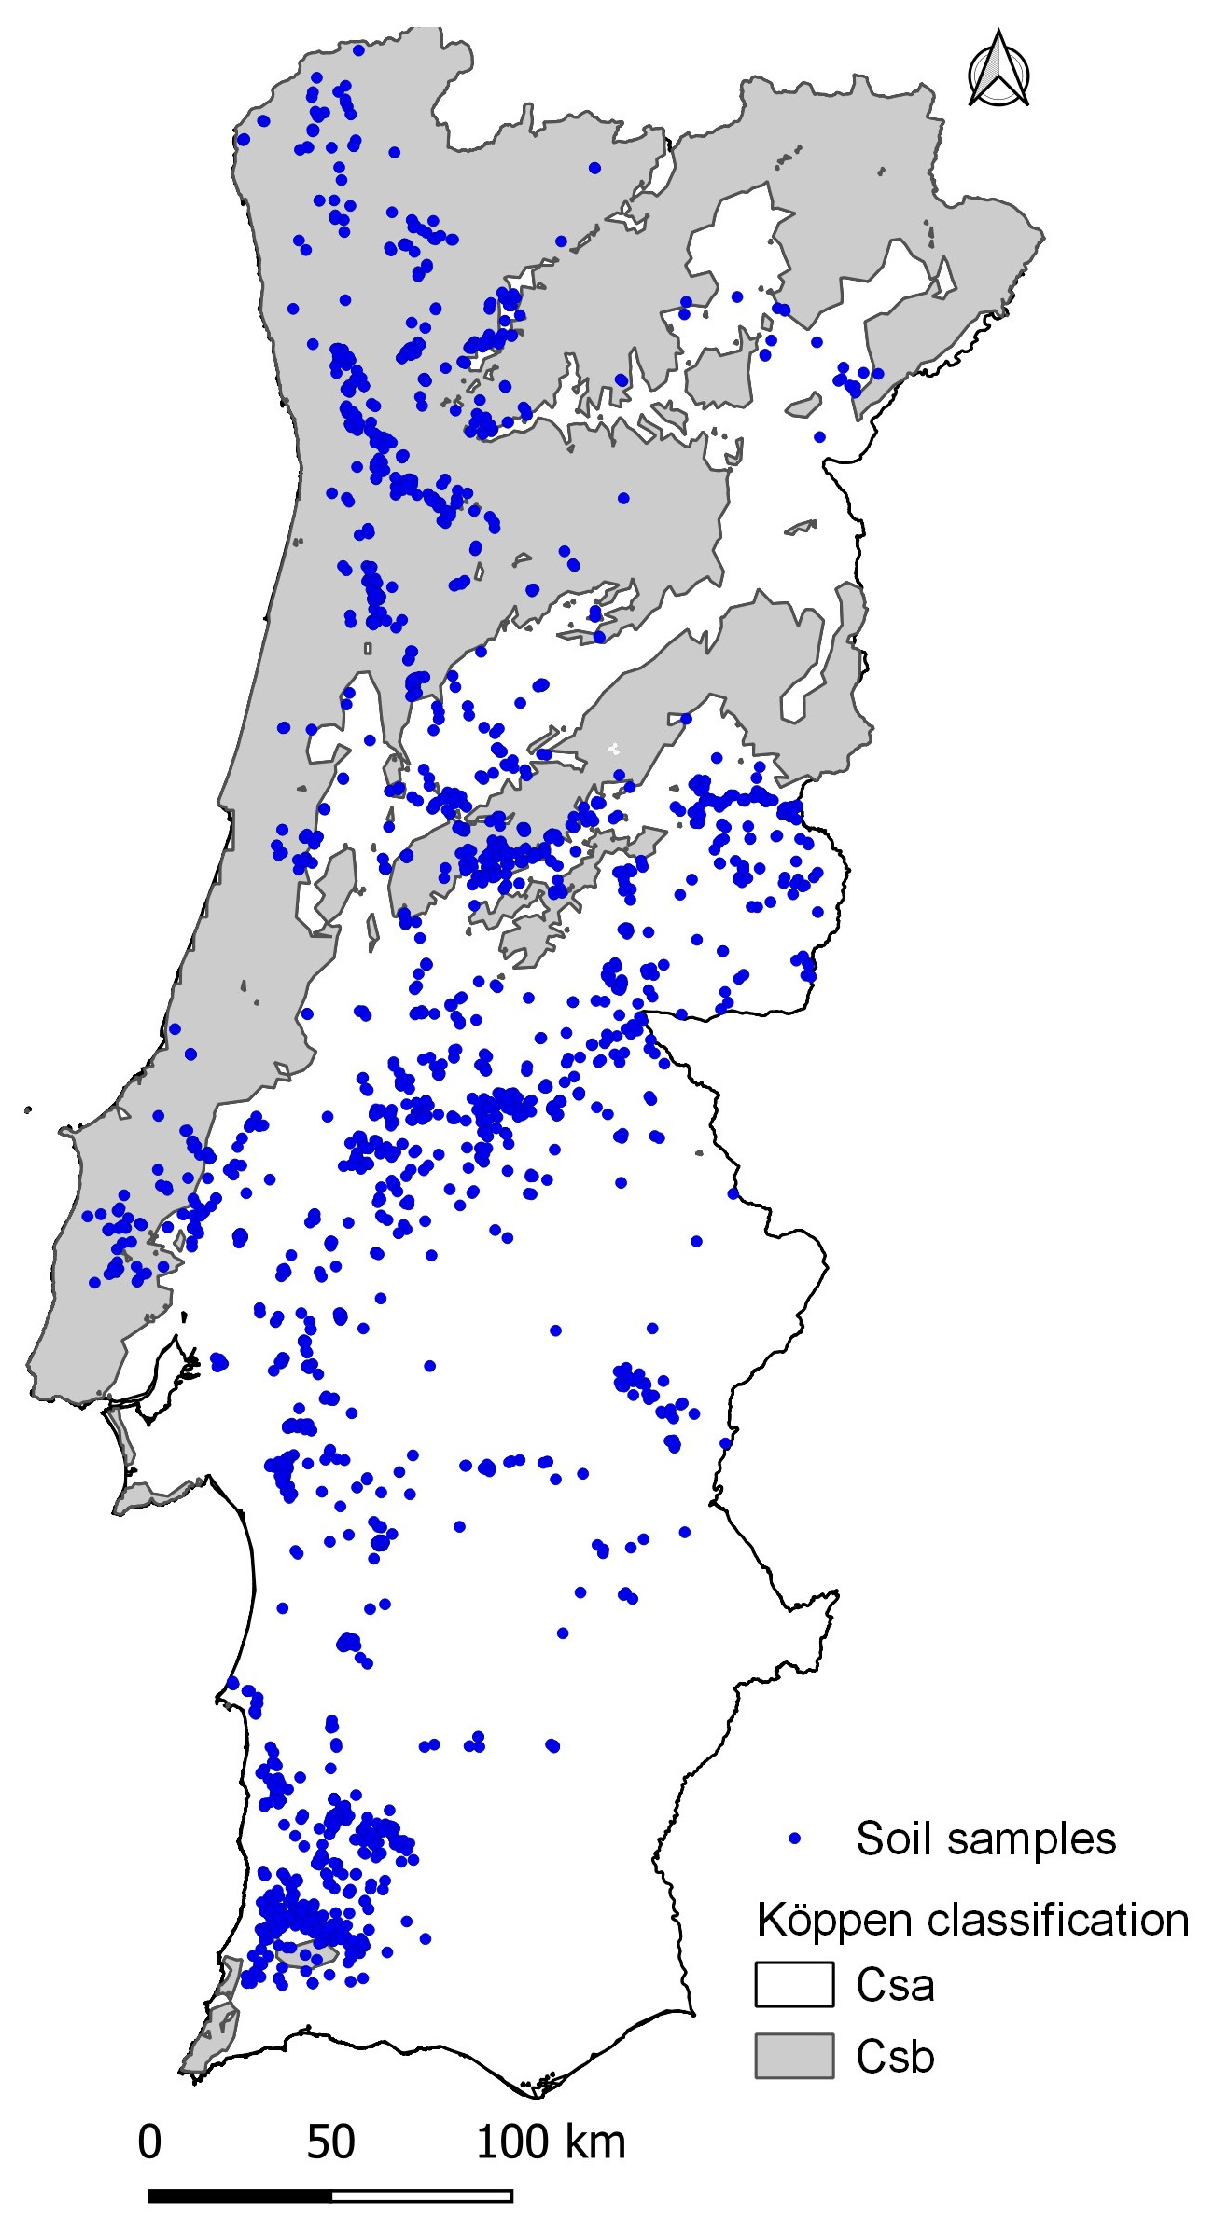
2.1. Study Area and Soil Sampling

The study area covers E. globulus plantations on Portugal’s mainland. Sampling covered different eucalypt stand ages and has been carried out since 1996 comprising 2468 soil samples (Figure 2). About 70% of the samples are under a Mediterranean-type climate with mild winters and dry warm summers and 30% under a Mediterranean-type climate with an Atlantic influence (Csa and Csb Köppen classification, respectively) [24].
In each sampling site, a composite sample was collected inside forest plantation avoiding areas close to roads, firebreaks, plantation borders or any other disturbances. Samples were composed of 15 subsamples randomly distributed in the area. All samples were taken from 0 to 30 cm of soil after removing superficial dead organic material following the IPCC guidelines [15]. For samples with soil depth of less than 30 cm, the real depth was registered and considered for the C stock estimation.
Soil profile evaluation per sampling site allowed us to estimate the relative percentage of coarse fragments of soil volume following the FSCC guidelines [25]. Additionally, according to local climate characteristics and soil profile features, a site productivity index—indicating the potential for the aboveground biomass production of E. globulus—was assigned per site. This index was derived as described by RAIZ [26] for 70% of the total soil samples collected.
Prior to C analysis, soil samples were air-dried and passed through a 2 mm sieve. SOC concentration was then determined by dry combustion following ISO 10694 [27] at accredited national laboratories.

2.2. SOC Assessment

Particle size distribution data were not available for the soil samples. Therefore, this information was extracted from the Infossolo database [28] complemented with analytical data from 102 soil samples collected in eucalypt plantations by RAIZ. The assessment of the particle size distribution of the fraction <2 mm followed the Gee and Or method [29]. From Infossolo, 400 records related to the particle size distribution of soil samples collected under forest occupation in Portugal were considered. This information of 502 records was grouped according to the bedrock type (map provided by the Portuguese Environment Agency) and was used to fill the data on coarse sand (2–0.2 mm), fine sand (0.2–0.02 mm), silt (0.02–0.002 mm) and clay (<0.002 mm) content per soil sampled.
For C stock estimation, the bulk density (BD, g cm−3) of the fine earth fraction (<2 mm) of the soil samples was determined using a pedo-transfer function [30] (Equation (1)):
B D = 0.69794 + 0.750636 ( 0.230355 × S O C ) + ( 0.0008687 × s a n d ) ( 0.0005164 × c l a y )
where SOC is the organic C concentration (g kg−1) of soil samples (fraction < 2 mm), sand (%) is the content in particles between 2 and 0.02 mm and clay (%) is the content in particles below 0.002 mm.
Carbon stock (CS, t ha−1) per sample was determined according to Equation (2) [31,32]:
C S = S O C × d e p t h × B D × 1 C f 100 × 10
where SOC is the SOC concentration (g kg−1) of soil samples (fraction < 2 mm), depth (m) is the thickness of the soil layer sampled (0–30 cm), BD is the bulk density (g cm−3) of the fraction < 2 mm and Cf is the coarse fraction (>2 mm) of the soil (%).
Finally, data from the soil sampling (2468 samples) and soil profile information (coarse fragments) were organized in a layer and processed stepwise (Figure 3): (i) layers provided by the Portuguese Environment Agency on lithology/bedrock (map 1:1,000,000), soil type according to the reference soil group [33], and Köppen classification [24] completed the information per soil sample; (ii) information on the particle size distribution of the fraction < 2 mm was completed using the mean values obtained from the Infossolo and RAIZ database per lithology/bedrock group; (iii) the BD per sample was computed using pedo-transfer functions [30]; and (iv) the C stock was estimated [32]. The main physical features of the soil samples are presented in Table 1.

2.3. Statistical Analysis

Statistical analyses were performed using Statistica, TIBCO software Inc. (Santa Clara, CA, USA), version 13.5.0.17. The medians of SOC and C stock by climate stratification (Csa and Csb) were computed and presented with percentiles 25%–75% in a boxplot. This information was complemented with the Tukey test (HSD) to check the significance of the results (p ≤ 0.05). Principal component analysis (PCA) was applied considering the following as active variables: Köppen group, SOC, soil C stock, productivity index (aboveground biomass production potential), coarse fraction (>2 mm), BD, particle size distribution, and as supplementary variables: altitude and slope. As composition data, for the particle size distribution of the fine fraction (<2 mm) an additive log-ratio transformation (alr) was applied and for the coarse fraction a logarithmic transformation [34]. Slope and altitude data were provided by ASTER-GDEM [35]. The steps in the PCA included computing the univariate statistics, covariance matrix, correlation matrix, eigenvalues and eigenvectors, degree of correlation, and projection in principal components (PCs). Prior to analysis, the database was standardized, and qualitative variables were transformed into numerical variables.

3. Results

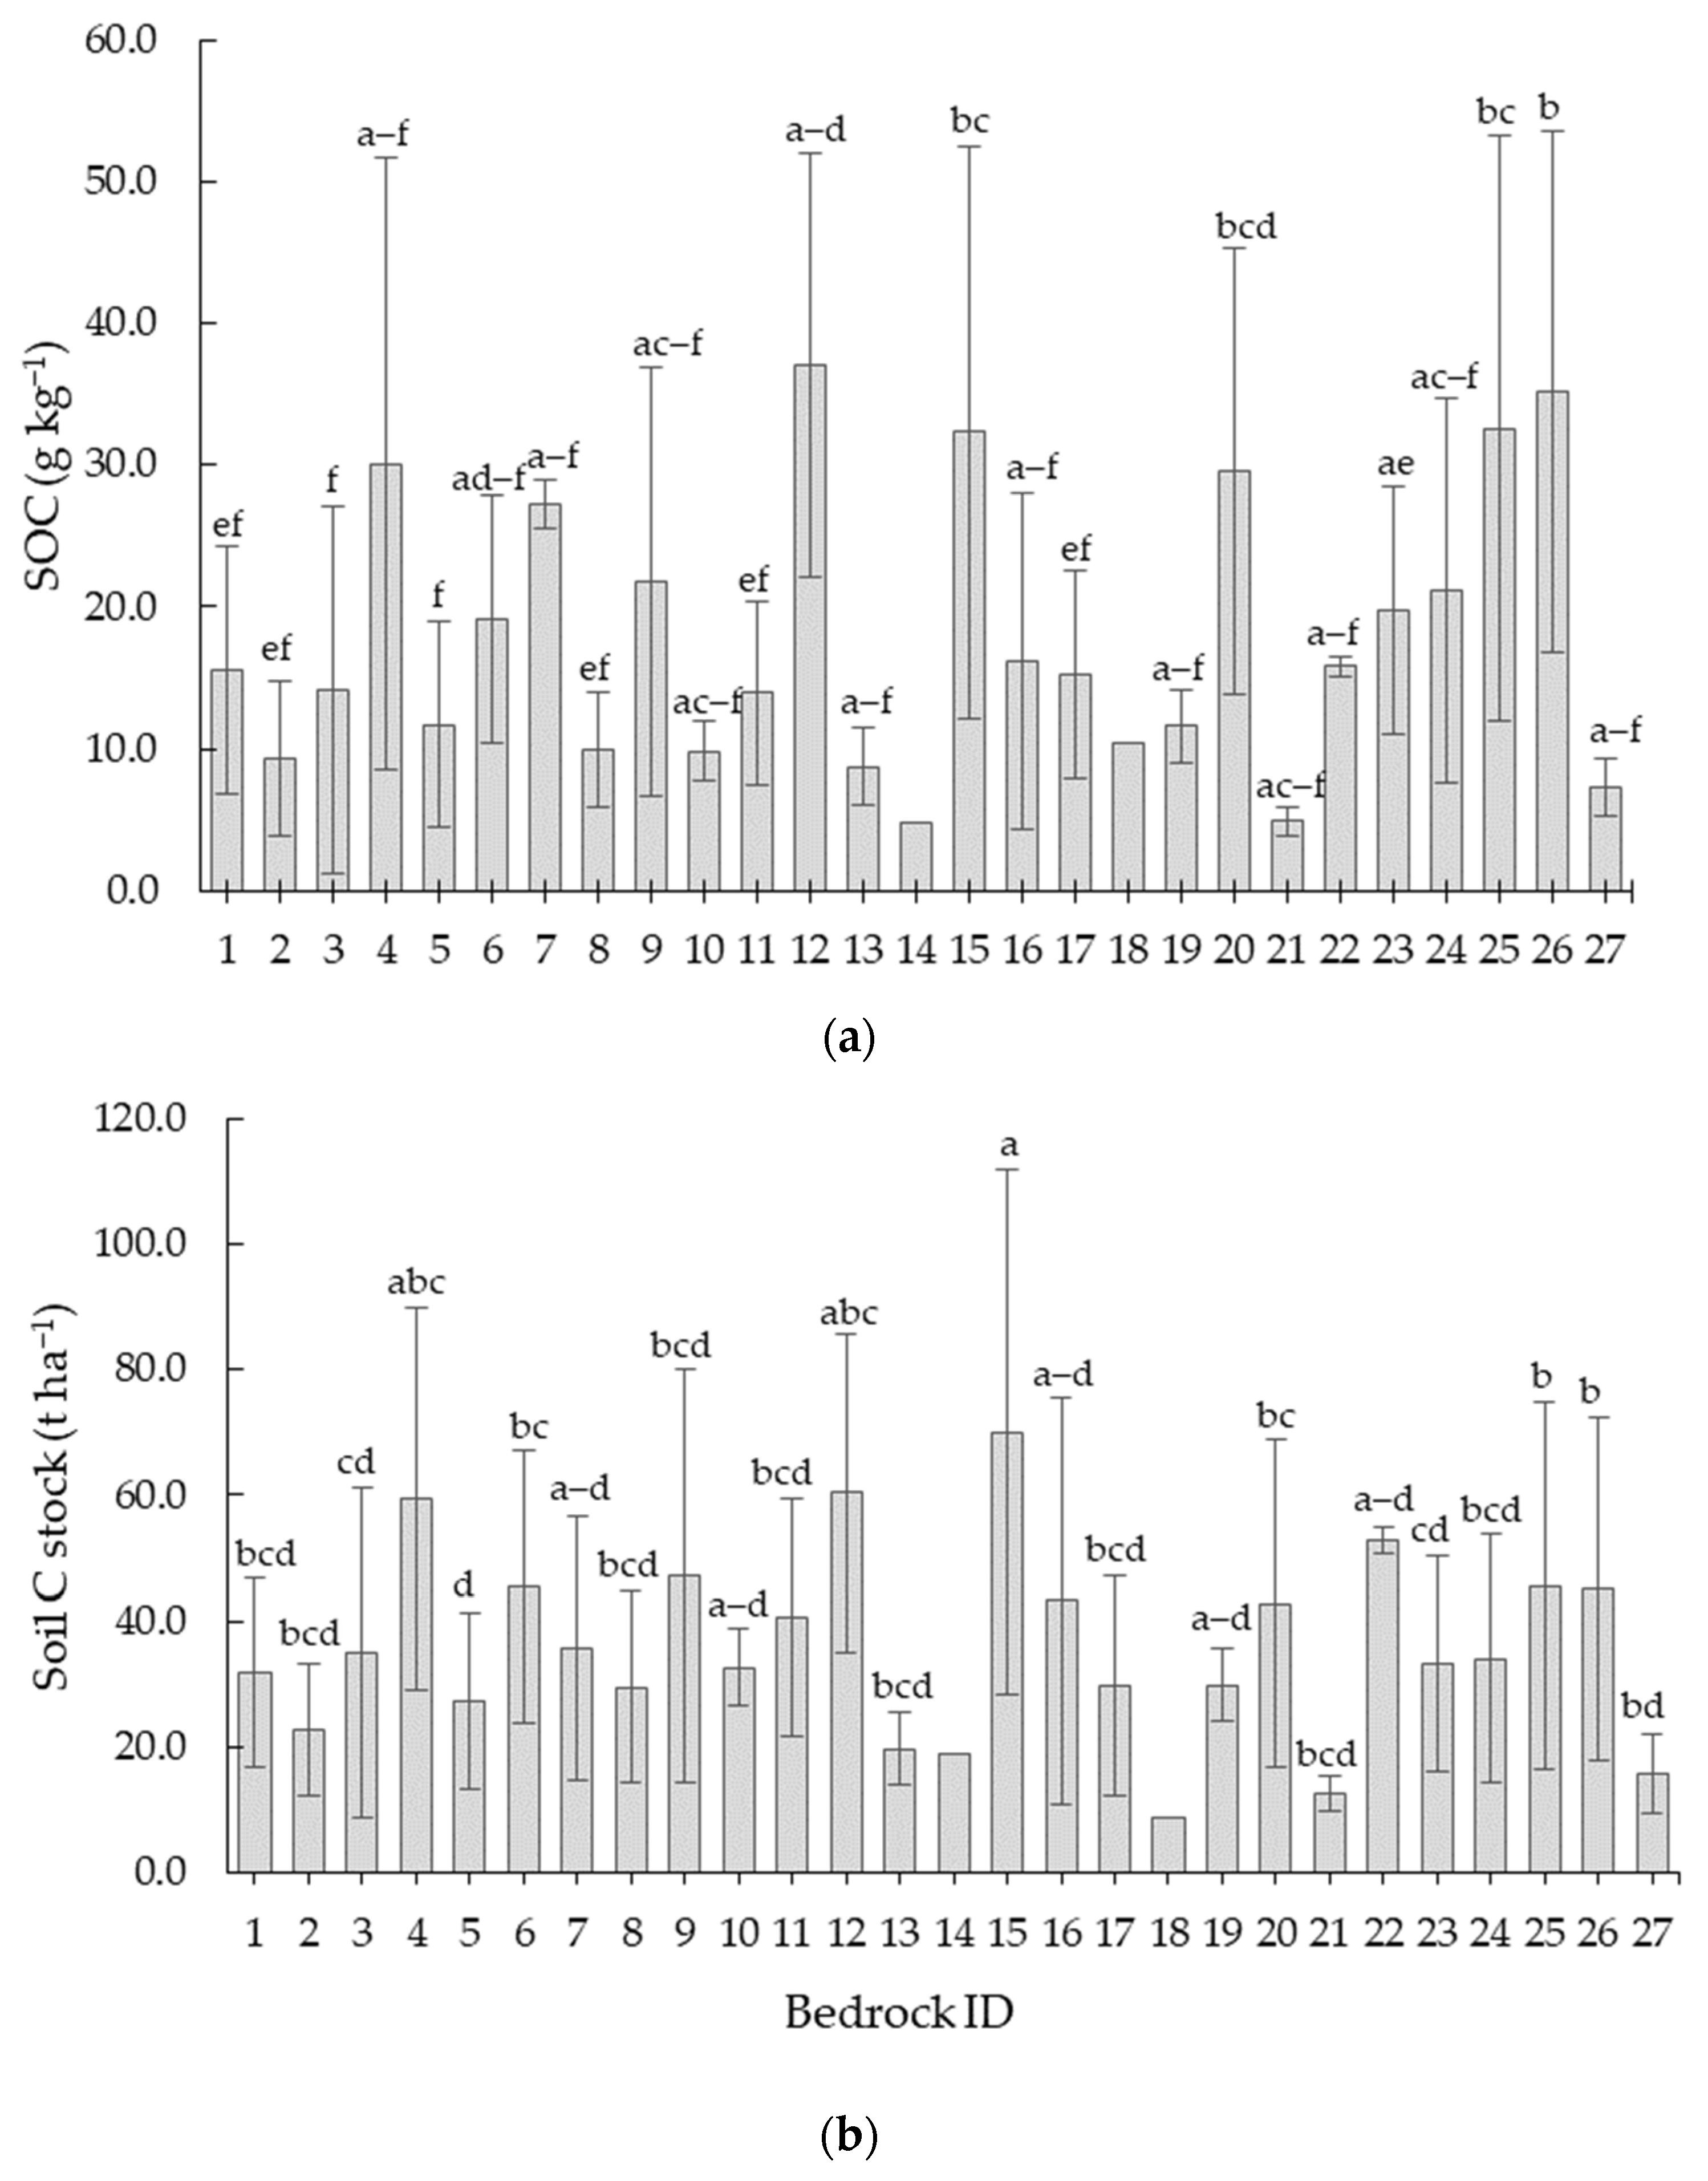
3.1. SOC and C Stock by Lithology Group (Bedrock)

The SOC ranged between 1.6 and 104.4 g kg−1. The mean SOC concentration ranged from 4.8 to 37.0 g kg−1 (Figure 4a), and the highest mean values were achieved for soil samples derived from conglomerates, coal shales and clay shales (ID12). Also, soils derived from shale, greywacke and shale–greywacke complexes (IDs 25 and 26), granites (ID15) and arcose sandstones and sandstones (ID4) presented ≥30 g kg−1. The lowest mean values were obtained for soil samples of dunes and aeolian sands (ID14), followed by quartzdiorites (ID21) and shales, quartzites and amphibolites (ID27).
The distribution of C stock by lithology group is shown in Figure 4b and ranged in average between 9.0 and 70 t ha−1. Granites and similar rocks (ID15) revealed the highest mean value, followed by conglomerates, coal shales and clay shales (ID12), arcose sandstones and sandstones (ID4) and nepheline syenites (ID22) which also presented C stocks higher than 50 t ha−1. The lowest values (<25 t ha−1) were found for sands and gravel (ID2), dolerites (ID13), dunes and aeolian sands (ID14), shales, quartzites and amphibolites (ID27), quartzdiorites (ID21) and granite porphyries (ID18). The remaining groups displayed stocks between 25 and 50 t C ha−1.

3.2. SOC and C Stock by Reference Soil Group (Soil Type)

The bulk densities (BDs), particle size distribution (fine and clay fractions), SOC in mineral 30 cm topsoil and C stocks by soil reference group are provided in Table 2. The most representative sampled groups were Leptic Cambisols (Humic), Eutric Leptosols, Umbric Podzols and Leptic Luvisols. The average BD of the sampled soils was 1.20 g cm−3 ranging between 1.01 and 1.43 g cm−3, a mean fine fraction ≥37% and a clay proportion within 9.9 and 24.0% of the total soil volume. The average SOC was 24.7 g kg−1 and allowed a mean C stock of 41.2 t ha−1. Eutric Fluvisols, Leptosols, Leptic Cambisols (Humic) and Cambic Calcisols revealed a C stock higher than 50 t ha−1; the lowest stock belonged to Leptic Calcaric Regosols, Albic Gleyic Luvisols, Chromic Leptic Luvisols, Eutric Leptic Regosols and Vertic Luvisols (C stock ≤ 25 t ha−1).

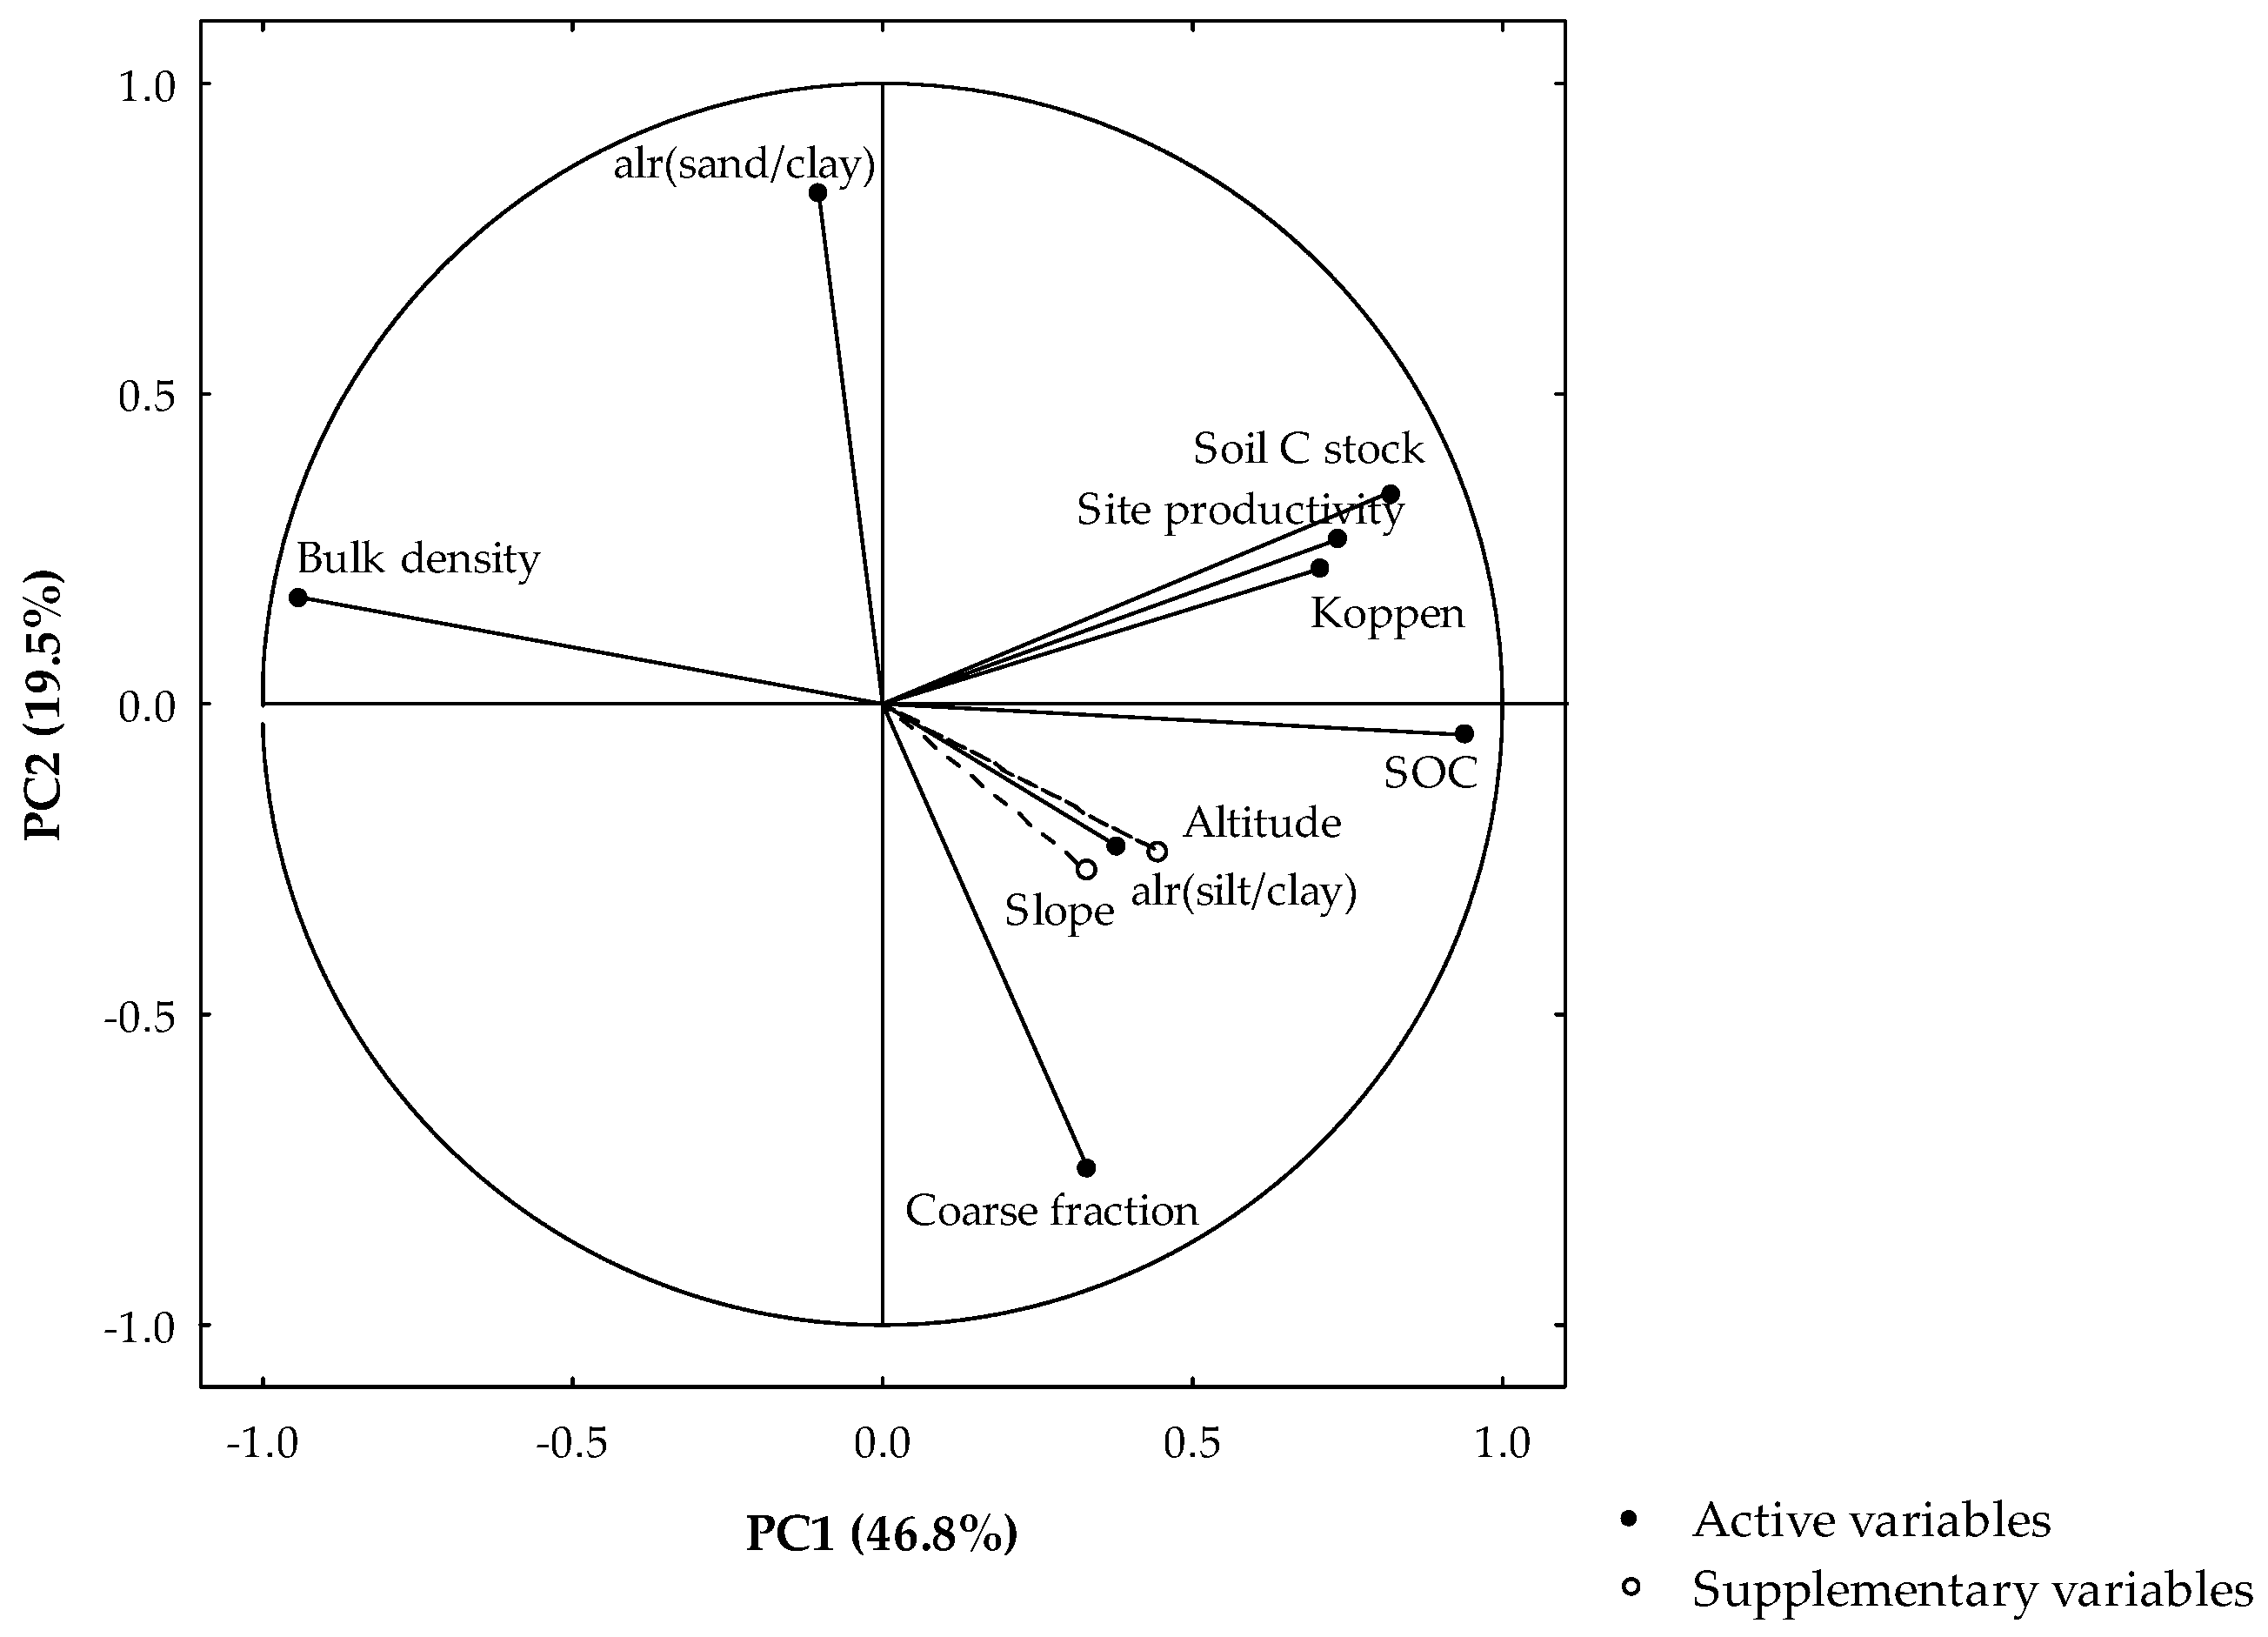
3.3. Major Drivers for Soil C Stock

To further identify the major drivers of SOC and C stock, attributes were extracted by PCA. Two principal components with eigenvalues >1 were extracted with a cumulative contribution of 66.3%, which could explain most of the results. The first principal component (PC1) had the highest contribution, accounting for 46.8%, followed by PC2 with 19.5%, respectively.
As presented in Figure 5, the SOC concentration and soil C stock were loaded in PC1 with a positive relation with Köppen classification and site productivity index (biomass production), suggesting that higher SOC concentrations and C stocks are related with better climate conditions and higher biomass production. A higher BD of soil is in opposition to the increment of SOC. The coarse fragments and the particle size distribution of fine fraction were accounted for by PC2, showing the opposition of the coarse fraction and the higher proportion of sand in the fine elements (<2 mm), suggesting that the soils studied have a higher component in fractions between 2 mm and 0.02 mm.
A box-plot with the distribution of SOC concentration and C stock according to the Köppen classification is displayed in Figure 6, following the PCA results suggesting a positive correlation between these parameters. As suspected, Csb revealed a significantly higher SOC and soil C stock than Csa. For Csb, the SOC values ranged between 27.4 (Q25) and 51.6 g kg−1 (Q75), whilst for Csa results from 9.1 (Q25) to 23.5 g kg−1 (Q75) were recorded. Concerning soil C stocks, Csb presented a median of 55 t ha−1 (38.8–80.3 t ha−1, lower and upper quartile) and Csa showed a median of around 28 t ha−1 (17.8–40.8 t ha−1, lower and upper quartile).
Apart for arcose sandstones and sandstones (ID4), the remaining groups of bedrock lithology agree with the previous box-plot, revealing that within the same bedrock type, mineral soil samples with the Csb climate type have higher C stocks than Csa (Figure 7). Focusing in the lithologies with the highest frequency of samples distributed by different climate types such as granites and similar rocks (ID 15) and shale and greywacke groups (ID 25 and 26), this is reinforced.

4. Discussion

4.1. C Stored in Eucalypt Stands and the Influence of Mediterranean Climate Conditions

Data from the last Portuguese National Forestry Inventory—2015 [19] show that the total plant biomass (above and belowground) accounts for around 19.5 t C ha−1 in pure eucalypt plantations (the majority of plantations until 12-year-old stands). This inventory is used to assess the land use land cover (LULC) and forecast wood availability and the C stored in the biomass. The data support that eucalypt plantations are one of the forestry species in Portugal that most contributes to C stored in biomass. Northern regions and the central part of Portugal are the greatest contributors to the C in total plant biomass (25.4 and 20.4 t ha−1, respectively), followed by Alentejo (15.4 t ha−1) and finally Algarve in the south of the country (11.0 t ha−1). The amount of biomass produced and the ability to store C in the aboveground biomass in eucalypt plantations has been well documented and evaluated [6,19,22,37]. Furthermore, the results also show that around 50 to 55% of plant C is stored in wood, suggesting that if management practices consider leaving leaves, branches, bark and roots in the area after harvesting, this may contribute to the conservation and increase of C in the soil. The forest floor was found to be significantly lower (less than 4% of the total) when compared with other pools and showed a large spatial variability [19,23].
Stand productivity is highly influenced by climatic and topographic variability, with temperature, precipitation and soils (physical and chemical features) being major drivers for wood biomass production [37]. Concerning the soil pool, studies found SOC concentrations in forest soils between 3 and 115 g kg−1 in the upper 20 cm of the mineral soil [18,38], in line with this study. The present results are also supported by Gómez-Rey et al. [39] who reported SOC values from 9.8 to 64.4 g kg−1 for five eucalypt plantations in Portugal across different mean annual precipitation values (500 to 2000 mm). The accumulation of C is a function of the prevailing edaphoclimatic characteristics at each site. In Portugal, two distinct climate regions are defined by the Köppen classification [24]. In the northern regions of Portugal, colder and wetter areas of the country (Csb), a higher amount of C is in stored in the soil (median SOC of 39.2 g kg−1 and soil C stock of 55 t ha−1), whereas in southern and inland regions, the climate is warmer, drier and with a very pronounced dry season (usually March to September) (Csa). As a result, productivity is lower in Csa as stated by Pereira et al. (2007), and consequently litter inputs to soils decrease and SOC also reduces (median SOC of 15.2 g kg−1 and soil C stock of 28 t ha−1). These values are in line with (but slightly lower than) IPCC references which have reported for warm temperate climate regions an average of 38 t C ha−1 (dry) and 88 t C ha−1 (moist) for mineral soils under native vegetation at a 30 cm depth [15].

4.2. SOC Stock and Soil Variability

Our study shows that eucalypt plantations in Portugal can store a substantial amount of C in soils, which is in line with other studies showing that a large amount of the total C stock is stored in the soil [40]. The present study revealed that mineral topsoil (0–30 cm) in eucalypt plantations is able to store an average of 41.2 t C ha−1, which is not out of line with the data presented in other studies that found average SOC stocks of 108 t C ha−1 in mineral soils in European forests to a 1 m depth [18] and between 11.3 and 126.3 t C ha−1 for a 0–20 cm soil depth [41].
Considering the analysis of soil C stock by the northern, central, Alentejo, and Algarve regions of the country, an average amount of C is found to be stored in the upper 30 cm of the mineral soil of 65.8, 43.4, 28.2 and 38.0 t ha−1, respectively. As expected, sites with the most favorable climatic and soil conditions for tree growth have a higher biomass production and soil C storage potential. This is in accordance with data from forest plantations including E. globulus in Chile, which revealed that 30 to 50% of the total C stock is stored in the soil (0–30 cm) [23]. Also, Scharlemann et al. [17] highlight the relevance of C stored in the topsoil (0–30 cm), which represents between 46% and 65% of the total SOC. This last study also identified differences related to climatic conditions.
Mediterranean soils are known for their variability, reduced water holding capacity, shallow horizons and high stoniness on the soil surface [42]. Therefore, storing C in the soil is essential to promote an increase in organic matter and soil quality, also mitigating the effect of climate change. Differences were found in SOC by the soil parent material (bedrock) and reference soil group. According to the FAO database, in the Mediterranean region, Cambisols prevail but Fluvisols, Luvisols and Leptosols are also common, which agrees with the main reference soil group sampled. The results showed a higher C stock in Cambisols, Leptosols and Fluvisols (>50 t C ha−1), whereas Regosols and Luvisols stored less—following the same trend presented for reference soil groups in Europe [18,43]. Similar results were found for soil samples according to the soil group reference in eucalypt plantations in northwestern Spain [10].

4.3. Methodological Considerations

This study contributes to the characterization of C stocks in soil in eucalypt managed forests. However, some limitations must be acknowledged to contextualize the findings and guide future research. Firstly, our sampling, although extensive, was limited to Portugal and may not fully capture the variability of C content across Mediterranean conditions in planted forests. Furthermore, the C stock per sampling site reflects a measurement at a single point in time and the time span of soil sampling may not provide a comprehensive understanding of soil C stocks throughout the stand growth cycle. Future research should consider implementing long-term monitoring per location and different soil layers to capture soil C changes over multiple years, thereby better elucidating temporal dynamics and the influence of management practices. Additionally, it is advisable to assess the aboveground and root biomass of eucalypt stands per location in order to establish more reliable comparisons with soil C stocks.
We also faced some analytical constraints. Ideally, BD, coarse fragments and particle size distribution should be assessed by analysis per soil sample. In this study, we used a pedo-transfer function for predicting soil BD that is applicable across all soil types within Europe with a mean percentage error of ± 11%, which introduces some uncertainty in the data [30]. However, we found values of BD around 1.20 g cm−3, being higher for Vertic Luvisols and Eutric Leptic Regosols (around 1.40 g cm−3) and lower to Eutric Fluvisols and Leptosols (around 1.02 g cm−3) which agrees with the results found for soil BD in Europe [44]. Concerning coarse fragments, we considered the data from the soil profile evaluation in the assessment of C stocks. As expected from field observations, usually, forest soils present a high stoniness as soils are pedogenetically underdeveloped [40] which is also supported by the lower amount of clay fraction in the soils. For the assessment of particle size distribution, we used laboratory results from soil samples and Infossolo data to fill the main database of the 2468 soil samples with this information. Although the results are consistent with the literature, the reliance on other databases may have introduced some uncertainty in the estimation of C stocks.
New approaches using remote sensing, machine learning, and other technologies are being tested and optimized to accurately quantify the SOC, which could represent a promising solution for C stock estimation at the management unit level, rather than a point-based analysis [45], eventually helping in the future to overcome some of the data gaps faced in this study.

4.4. The Effect of Management Practices on SOC Stock and Further Studies

The C held in the mineral topsoil (upper 30 cm layer) is often the most chemically decomposable, and the most directly exposed to natural and anthropogenic disturbances [15]; this is the reason why this study focused on this layer of mineral soil. Nevertheless, C stored in deeper soil layers can be relevant for the soil C sequestration potential in a changing forest ecosystem (e.g., afforestation and forest management). The amount and rate of organic C accumulation associated with afforestation depend on several factors such as climate, topography, soil characteristics, species and forestry management practices [38,46]. Forest management can improve C sequestration amounts, and understanding the effects of forest management is even more important in the Mediterranean area, given the current high climatic variability and disturbance events [47]. Harvesting operation and soil tillage, particularly, can lead to a reduction in soil C stocks if mitigation measures are not considered. Applying conservation practices in site preparation and leaving harvesting residues on the soil (roots, leaves, stumps and bark), for instance, and the proper management of stand growth may outweigh soil C losses over a rotation [38,47]. Management practices pursuing a canopy cover of the soil and minimizing the disturbances in soil are likely to improve the C storage [38]. Ruiz-Peinado et al. [47] reviewed the implications of different forest management practices on C sequestration (e.g., stocking, thinning, coppice, rotation period and harvesting operations) in the Mediterranean region and highlighted the need to carry out further integrated studies to investigate forest management alternatives.
This study provided estimations that can be valuable for the validation and parameterization of C models, also providing relevant information for management practices. Further studies should be conducted to assess the evolution of C stocks in eucalypt plantations during different stages of stand growth and under different management practices.

5. Conclusions

Across the country, we assessed the ability of forests soils to store C under a wide range of bedrock and reference soil groups. The SOC assessed in the first 30 cm of mineral soils in eucalypt plantations ranged between 1.6 and 104.4 g kg−1. The total soil stocks averaged 41.2 t C ha−1 and were clearly influenced by climate conditions. Better conditions for tree growth, warm temperatures and higher annual precipitation (Csb) lead to a higher stand productivity as supported by the national forest inventory. This results in a higher input of litter in the soil and higher C stocks. Comparing different C pools and considering the amount of C stored in plant biomass according to the most recent national inventory [19], the relevance of the C stock in the upper 30 cm of the mineral soil is recognized, which may represent more than 65% the total C retention (considering soil and plant biomass pools).
While acknowledging that this study presented some methodological limitations, the data compiled, and the methodological approach used in this study contribute to the establishment of a forest soil C baseline and highlights the importance of soil and its conservation for C sequestration. Given the relevance of soil to the total C stock in eucalyptus plantations, special attention should be addressed to the management practices that may affect this organic C pool, and further studies should include long-term monitoring and time-dynamic assessment to provide new insights on C sequestration strategies.

Author Contributions

Conceptualization, A.Q., S.F., D.F. and J.C.; methodology, A.Q., S.F. and J.C.; software, A.Q.; validation, J.C.; formal analysis, A.Q.; investigation, A.Q., D.F. and S.F.; writing—original draft preparation, A.Q.; writing—review and editing, A.Q., D.F., S.F. and J.C.; visualization, A.Q.; supervision, J.C.; project administration, A.Q.; funding acquisition, S.F. All authors have read and agreed to the published version of the manuscript.

Funding

This research received no external funding.

Data Availability Statement

The raw data supporting the conclusions of this article may be made available by the authors upon request.

Acknowledgments

The authors would like to thank João Rocha and André Duarte for their assistance in spatial layers completion. We also thank the RAIZ team that has being performing soil profile evaluation, currently coordinated by Cláudio Teixeira, for the information provided; and finally, thanks are due to all the RAIZ colleagues that helped in building the soil database by carrying out soil sampling over time.

Conflicts of Interest

The authors declare no conflicts of interest.

References

  1. FAO. The State of the World’s Forests 2020. Forests, Biodiversity and People; UNEP: Rome, Italy, 2020. [Google Scholar] [CrossRef]
  2. Sheil, D.; Murdiyarso, D. How forests attract rain: An examination of a new hypothesis. BioScience 2009, 59, 341–347. [Google Scholar] [CrossRef]
  3. Ellison, D.; Futter, M.N.; Bishop, K. On the forest cover-water yield debate: From demand- to supply-side thinking. Glob. Chang. Biol. 2012, 18, 806–820. [Google Scholar] [CrossRef]
  4. Ellison, D.; Morris, C.E.; Locatelli, B.; Sheil, D.; Cohen, J.; Murdiyarso, D.; Gutierrez, V.; van Noordwijk, M.; Creed, I.F.; Pokorny, J.; et al. Trees, forests and water: Cool insights for a hot world. Glob. Environ. Chang. 2017, 43, 51–61. [Google Scholar] [CrossRef]
  5. Sheil, D. Forests, atmospheric water and an uncertain future: The new biology of the global water cycle. For. Ecosyst. 2018, 5, 19. [Google Scholar] [CrossRef]
  6. Arroja, L.; Dias, A.C.; Capela, I. The role of Eucalyptus globulus forest and products in carbon sequestration. Climat. Chang. 2006, 74, 123–140. [Google Scholar] [CrossRef]
  7. Strandberg, G.; Chen, J.; Fyfe, R.; Kjellström, E.; Lindström, J.; Poska, A.; Zhang, Q.; Gaillard, M.-J. Did the Bronze Age deforestation of Europe affect its climate? A regional climate model study using pollen-based land cover reconstructions. Clim. Past 2023, 19, 1507–1530. [Google Scholar] [CrossRef]
  8. Barnes, M.L.; Zhang, Q.; Robeson, S.M.; Young, L.; Burakowski, E.A.; Oishi, A.C.; Stoy, P.C.; Katul, G.; Novick, K.A. A century of reforestation reduced anthropogenic warming in the Eastern United States. Earth’s Future 2024, 12, e2023EF003663. [Google Scholar] [CrossRef]
  9. Harris, N.L.; Gibbs, D.A.; Baccini, A.; Birdsey, R.A.; de Bruin, S.; Farina, M.; Fatoyinbo, L.; Hansen, M.C.; Herold, M.; Houghton, R.A.; et al. Global maps of twenty-first century forest carbon fluxes. Nat. Clim. Chang. 2021, 11, 234–240. [Google Scholar] [CrossRef]
  10. Gómez-García, E.; Biging, G.; García-Villabrille, J.D.; Crecente-Campo, F.; Castedo-Dorado, F.; Rojo-Alboreca, A. Cumulative continuous predictions for bole and aboveground woody biomass in Eucalyptus globulus plantations in northwestern Spain. Biomass Bioenergy 2015, 77, 155–164. [Google Scholar] [CrossRef]
  11. Scalenghe, R.; Celi, L.; Costa, G.; Laudicina, V.A.; Santoni, S.; Vespertino, D.; La Mantia, T. Carbon stocks in a 50 year old Eucalyptus camaldulensis stand in Sicily, Italy. South. For. J. For. Sci. 2015, 77, 263–267. [Google Scholar] [CrossRef]
  12. Infante-Amate, J.; Iriarte-Goñi, I.; Aguilera, E. Historical changes in biomass carbon stocks in the Mediterranean (Spain, 1860–2010). Anthropocene 2023, 44, 100416. [Google Scholar] [CrossRef]
  13. Mo, L.; Zohner, C.M.; Reich, P.B.; Liang, J.; de Miguel, S.; Nabuurs, G.; Renner, S.S.; Hoogen, J.V.D.; Araza, A.; Herold, M.; et al. Integrated global assessment of the natural forest carbon potential. Nature 2023, 624, 92–101. [Google Scholar] [CrossRef]
  14. Aalde, H.; Gonzalez, P.; Gytarsky, M.; Krug, T.; Kurz, W.A.; Ogle, S.; Raison, J.; Schoene, D.; Ravindranath, N.H.; Elhassan, N.G.; et al. Forest land. IPCC Guidel. Natl. Greenh. Gas Invent. 2006, 4, 1–83. [Google Scholar]
  15. IPCC. IPCC Guidelines for National Greenhouse Gas Inventories; Institute for Global Environmental Strategies (IGES): Hayama, Japan, 2006. [Google Scholar]
  16. Batjes, N.H. Total carbon and nitrogen in the soils of the world. Eur. J. Soil Sci. 1996, 47, 151–163. [Google Scholar] [CrossRef]
  17. Scharlemann, J.P.; Tanner, E.V.; Hiederer, R.; Kapos, V. Global soil carbon: Understanding and managing the largest terrestrial carbon pool. Carbon Manag. 2014, 5, 81–91. [Google Scholar] [CrossRef]
  18. De Vos, B.; Cools, N.; Ilvesniemi, H.; Vesterdal, L.; Vanguelova, E.; Carnicelli, S. Benchmark values for forest soil carbon stocks in Europe: Results from a large scale forest soil survey. Geoderma 2015, 251–252, 33–46. [Google Scholar] [CrossRef]
  19. ICNF. IFN6—Principais Resultados—Relatório Sumário; Instituto da Conservação da Natureza e das Florestas: Lisboa, Portugal, 2019. [Google Scholar]
  20. Dias, A.C.; Martins, M.C.; Arroja, L.; Capela, I. Management of Forest Resources in the Perspective of the Kyoto Protocol. CARBOCENTRO Project Report; Universidade de Aveiro: Aveiro, Portugal, 2004. [Google Scholar]
  21. Fabião, A.; Madeira, M.; Steen, E. Root mass in plantations of Eucalyptus globulus in Portugal in relation to soil characteristics. Arid Land Res. Manag. 1987, 1, 185–194. [Google Scholar]
  22. Madeira, M.V.; Fabião, A.; Pereira, J.S.; Araújo, M.C.; Ribeiro, C. Changes in carbon stocks in Eucalyptus globulus Labill. Plantations induced by different water and nutrient availability. For. Ecol. Manag. 2002, 171, 75–85. [Google Scholar] [CrossRef]
  23. Olmedo, G.F.; Guevara, M.; Gilabert, H.; Montes, C.R.; Arellano, E.C.; Barría-Knopf, B.; Gárate, F.; Mena-Quijada, P.; Acuña, E.; Bown, H.E.; et al. Baseline of Carbon Stocks in Pinus radiata and Eucalyptus spp. Plantations of Chile. Forests 2020, 11, 1063. [Google Scholar] [CrossRef]
  24. Köppen, W. Grundriss der Klimakunde; Walter de Gruyter: Berlin, Germany, 1931. [Google Scholar]
  25. FSCC. Manual IIIa: Sampling and Analysis of Soil. ICP Forests. In Methods and Criteria for Harmonized Sampling, Assessment, Monitoring and Analysis of the Effects of air Pollution on Forests; UN/ECE ICP Forests Programme Coordinating Centre: Hamburg, Germany, 2006. [Google Scholar]
  26. RAIZ. Vinte Anos a Criar Conhecimento Para a Bioeconomia de Base Florestal 1996–2016. 2019. Available online: https://20-anos-de-i-d-do-raiz-1996-2016 (accessed on 19 January 2024).
  27. ISO 10694; Soil Quality—Determination of Organic and Total Carbon After dry Combustion (Elementary Analysis). International Organization for Standardization: Geneva, Switzerland, 1995.
  28. Ramos, T.B.; Horta, A.; Gonçalves, M.C.; Pires, F.P.; Duffy, D.; Martins, J.C. The INFOSOLO database as a first step towards the development of a soil information system in Portugal. CATENA 2017, 158, 390–412. [Google Scholar] [CrossRef]
  29. Gee, G.W.; Or, D. Particle-size analysis. In Methods of soil Analysis, Part 4. Physical Methods; Dane, J.H., Topp, G.C., Eds.; SSSA Book Ser. 5; SSSA: Madison, WI, USA, 2002; pp. 255–294. [Google Scholar]
  30. Hollis, J.M.; Hannam, J.; Bellamy, P.H. Empirically-derived pedotransfer functions for predicting bulk density in European soils. Eur. J. Soil Sci. 2012, 63, 96–109. [Google Scholar] [CrossRef]
  31. Ogle, S.M.; Breidt, F.J.; Eve, M.D.; Paustian, K. Uncertainty in estimating land-use and management impacts on soil organic carbon storage for U.S. agricultural lands between 1982 and 1997. Glob. Chang. Biol. 2003, 9, 1521–1542. [Google Scholar] [CrossRef]
  32. Wiesmeier, M.; Spörlein, P.; Geuß, U.; Hangen, E.; Haug, S.; Reischl, A.; Schilling, B.; von Lützow, M.; Kögel-Knabner, I. Soil organic carbon stocks in southeast Germany (Bavaria) as affected by land use, soil type and sampling depth. Glob. Chang. Biol. 2012, 18, 2233–2245. [Google Scholar] [CrossRef]
  33. SROA. Carta de Solos Reprodução da Carta Apresentada à FAO—1971; Agência Portuguesa do Ambiente, I.P.: Amadora, Portugal, 2010. [Google Scholar]
  34. Gonçalves, J.A.; Morgado, A. Use of the SRTM DEM as a geo-referencing tool by elevation matching. Int. Arch. Photogramm. Remote Sens. Spat. Inf. Sci. 2008, 37, 879–883. [Google Scholar]
  35. Aitchison, J. The single principle of compositional data analysis, continuing fallacies, confusions and misunderstandings and some suggested remedies. In Proceedings of the CoDaWork’08, Girona, Spain, 27–30 May 2008; pp. 1–28. [Google Scholar]
  36. IUSS Working Group WRB. World Reference Base for Soil Resources 2014 International Soil Classification System for Naming Soils and Creating Legends for Soil Maps; World Soil Resources Reports No. 106; FAO: Rome, Italy, 2015. [Google Scholar]
  37. Pereira, J.; Mateus, J.; Aires, L.; Pita, G.; Pio, C.; David, J.S.; Andrade, V.; Banza, J.; David, T.S.; Paço, T.A.; et al. Net ecosystem carbon exchange in three contrasting Mediterranean ecosystems—The effect of drought. Biogeosciences 2007, 4, 791–802. [Google Scholar] [CrossRef]
  38. Lal, R. Forest soils and carbon sequestration. For. Ecol. Manag. 2005, 220, 242–258. [Google Scholar] [CrossRef]
  39. Gómez-Rey, M.; Madeira, M.; González-Prieto, S.; Coutinho, J. Soil C and N dynamics within a precipitation gradient in Mediterranean eucalypt plantations. Plant Soil 2010, 336, 157–171. [Google Scholar] [CrossRef]
  40. Mayer, M.; Prescott, C.E.; Abaker, W.E.A.; Augusto, L.; Cécillon, L.; Ferreira, G.W.D.; James, J.; Jandl, R.; Katzensteiner, K.; Laclau, J.-P.; et al. Tamm Review: Influence of forest management activities on soil organic carbon stocks: A knowledge synthesis. For. Ecol. Manag. 2020, 466, 118–127. [Google Scholar] [CrossRef]
  41. Baritz, R.; Seufert, G.; Montanarella, L.; Van Ranst, E. Carbon concentrations and stocks in forest soils of Europe. For. Ecol. Manag. 2010, 260, 262–277. [Google Scholar] [CrossRef]
  42. Rodeghiero, M.; Rubio, A.; Díaz-Pinés, E.; Romanyà, J.; Marañón-Jiménez, S.; Levy, G.J.; Fernandez-Getino, A.P.; Sebastià, M.T.; Karyotis, T.; Chiti, T.; et al. Soil carbon in Mediterranean ecosystems and related management problems. In Soil Carbon in Sensitive European Ecosystems; Jandl, R., Rodeghiero, M., Olsson, M., Eds.; John Wiley & Sons Ltd.: Hoboken, NJ, USA, 2011; pp. 175–218. [Google Scholar] [CrossRef]
  43. IUSS Working Group WRB. World Reference Base for Soil Resources; First Update; FAO: Rome, Italy, 2006. [Google Scholar]
  44. Panagos, P.; De Rosa, D.; Liakos, L.; Labouyrie, M.; Borrelli, P.; Ballabio, C. Soil bulk density assessment in Europe. Agric. Ecosyst. Environ. 2024, 364, 108907. [Google Scholar] [CrossRef]
  45. Fu, P.; Clanton, C.; Demuth, K.M.; Goodman, V.; Griffith, L.; Khim-Young, M.; Maddalena, J.; LaMarca, K.; Wright, L.A.; Schurman, D.W.; et al. Accurate Quantification of 0–30 cm Soil Organic Carbon in Croplands over the Continental United States Using Machine Learning. Remote Sens. 2024, 16, 2217. [Google Scholar] [CrossRef]
  46. de Rigo, D.; Bosco, C.; San-Miguel-Ayanz, J.; Houston Durrant, T.; Barredo, J.I.; Strona, G.; Caudullo, G.; Di Leo, M.; Boca, R. Forest resources in Europe: An integrated perspective on ecosystem services, disturbances and threats. In European Atlas of Forest Tree Species; JRC103181; Publication Office of the European Union: Luxembourg, 2016; pp. 8–19. [Google Scholar]
  47. Ruiz-Peinado, R.; Bravo-Oviedo, A.; López-Senespleda, E.; Bravo, F.; Río, M. Forest management and carbon sequestration in the Mediterranean region: A review. For. Syst. 2017, 26, eR04S. [Google Scholar] [CrossRef]
Figure 1. Generalized carbon cycle showing the flows of carbon between the five C pools for agriculture, forestry and other land use ecosystems [15].
Forests 15 01335 g001
Figure 2. Soil sampling sites in eucalyptus plantations, Portugal (Csa—Mediterranean-type climate with mild winters and dry warm summers; Csb—Mediterranean-type climate with an Atlantic influence).
Forests 15 01335 g002
Figure 3. Methodological approach applied for soil carbon stock estimation: soil collection and analysis, relevant information completion (particle size distribution, bulk density, climate, bedrock and reference soil group) and C stock calculation [30,32].
Forests 15 01335 g003
Figure 4. Mean SOC content (a) and C stock (b), and standard deviation in soil samples (0–30 cm depth) by lithology group (bedrock ID presented in Table 1). Significant differences are denoted by different letters (Tukey’s test, p ≤ 0.05).
Forests 15 01335 g004
Figure 5. Spatial ordination resulting from the principal components analysis (PCA) for soil samples features and climate attributes (PC1: 3.74, variance explained: 46.8%; PC2: 1.56, variance explained: 19.5%).
Forests 15 01335 g005
Figure 6. Median, upper and lower quartiles of soil organic carbon content (g kg−1) and carbon stock (t ha−1) in mineral soil samples (0–30 cm depth) according to the climate Köppen classification (Csa—Mediterranean-type climate with mild winters and dry warm summers; Csb—Mediterranean-type climate with an Atlantic influence). Within each variable, significant differences among climate classification are denoted by small and capital letters (Tukey’s test, p ≤ 0.05).
Forests 15 01335 g006
Figure 7. Mean and standard deviation of carbon stock (t ha−1) in mineral soil samples (0–30 cm depth) by lithology group and climate classification of Köppen (Csa—Mediterranean-type climate with mild winters and dry warm summers; Csb—Mediterranean-type climate with an Atlantic influence) (Lithology ID in Table 1 and number of soil samples in italics above graph bars). Within each bedrock ID, significant differences among climate classification are denoted by * and ** (Tukey’s test, p ≤ 0.05).
Forests 15 01335 g007
Table 1. Number of samples (N) and mean physical characterization of soil samples by lithology group (bedrock).
Bedrock IDBedrockN Particle Size Distribution (%)
Coarse
Fraction
(>2 mm)
Fine
Fraction
(<2 mm)
Fine
Fraction (<2 mm) Classes
Bulk Density
(g cm−3)
Coarse
Sand
Fine
Sand
SiltClay
1Alluvium2935.964.129.736.824.29.41.28
2Sands and gravel1734.066.030.441.615.812.21.36
3Sands, pebbles, poorly consolidated sandstones, clays29825.274.850.427.513.09.11.32
4Arcose sandstones and sandstones935.065.055.526.68.09.91.18
5Sandstones, more or less marly limestones, sands, gravel, clays27831.968.155.526.68.09.91.35
6Sandstones, conglomerates, limestones, dolomitic limestones, marly limestones, marls3430.969.163.322.16.28.31.26
7Basalts250.349.743.525.011.719.81.15
8Limestones, dolomitic limestones, marly limestones, marls1129.071.086.111.20.42.31.38
9Plateau gravel pits, Beira Baixa arches, sandstones, limestones2429.470.643.132.313.511.01.24
10Conglomerates, sandstones, white limestones, reddish marls517.083.031.732.613.222.51.34
11Conglomerates, sandstones, limestones, dolomitic limestones, marly limestones, marls3620.179.931.732.613.222.51.29
12Conglomerates, coal shales, clay shales943.856.225.123.430.920.61.07
13Dolerites444.555.543.525.011.719.81.36
14Dunes and aeolian sands110.090.050.047.40.91.71.45
15Granites and similar rocks22527.772.346.831.112.49.71.15
16Red sandstones (from Silves), conglomerates, marls, limestones generally dolomitic330.769.331.732.613.222.51.27
17Metavolcanites3933.266.833.225.325.715.91.28
18Granite porphyries161.838.246.831.112.49.71.35
19Quartziferous porphyries231.069.048.231.612.18.11.34
20Quartzites6451.248.822.835.424.617.11.14
21Quartzdiorites440.559.559.624.08.57.91.44
22Nepheline syenites213.087.046.831.112.49.71.28
23Clay shale, greywacke, sandstone43846.453.627.226.122.824.01.22
24Schists, amphibolites, mica schists, greywacke quartzites, carbonate rocks, gneisses1941.758.323.540.222.513.91.23
25Shale, greywacke22850.349.728.938.119.413.61.14
26Shale, greywacke (shale–greywacke complex)68246.553.522.732.230.914.31.10
27Shales, quartzites, amphibolites448.052.047.324.312.815.71.39
Table 2. Number of samples (N), mean and quartiles (25% and 75%) of physical properties, SOC and C stocks (0–30 cm depth) according to the reference soil group ([36], * previous classification reference [33]).
Reference Soil GroupNBulk Density
(g cm−3)
Fine Fraction
(<2 mm) (%)
Clay Fraction
(<0.002 mm) (%)
SOC
(g kg−1)
C Stock
(t ha−1)
MeanQ25Q75MeanQ25Q75MeanQ25Q75MeanQ25Q75MeanQ25Q75
Cambic Calcisols221.221.161.2973.869.085.013.98.322.521.714.328.453.739.567.2
Chromic Cambisols301.291.231.3670.758.483.416.38.322.514.89.818.436.924.549.0
Leptic Calcaric Regosols/Calcaric Chromic Cambisols *71.361.271.4357.756.056.09.99.99.910.85.517.422.713.236.9
Dystric Cambisols361.341.311.4169.562.085.010.19.79.711.46.013.728.513.435.4
Eutric Cambisols991.361.311.4169.862.081.710.89.19.910.46.013.026.315.334.3
Leptic Cambisols (Humic)7511.060.971.1257.240.072.313.19.714.341.630.252.363.839.684.0
Eutric Fluvisols31.010.931.1856.056.056.09.99.99.952.525.665.990.750.7110.7
Eutric Leptosols/Eutric Lithosols *6641.211.141.3153.641.663.317.514.324.022.112.027.030.617.041.0
Leptic Ferric Luvisols/Ferric Luvisols *281.261.171.3550.951.752.019.113.624.017.09.322.928.418.837.9
Albic Gleyic Luvisols101.381.361.4077.169.090.011.79.113.68.46.49.821.314.328.6
Leptic Luvisols/Orthic Luvisols *2441.221.171.2857.651.266.721.624.024.019.814.123.736.423.746.5
Chromic Leptic Luvisols /Rhodochromic Luvisols *91.261.201.3037.630.040.015.613.617.116.713.122.419.111.730.4
Calcic Chromic Luvisols151.291.221.3669.560.078.415.19.422.515.38.220.237.723.859.8
Vertic Luvisols31.431.411.4452.052.052.011.77.913.64.84.45.210.69.811.5
Umbric Podzols/Orthic Podzols *5421.341.281.4271.662.085.09.99.19.912.15.815.529.817.036.4
Leptosols/Rankers *21.021.011.0261.049.772.311.79.713.645.845.845.883.968.499.4
Plintic Luvisols11.32--60.0--24.0--10.8--25.7--
Eutric Leptic Regosols11.41--90.0--9.9--6.4--17.4--
Endosalic Gleysols/Gleyic Solonchaks *11.35--95.0--9.9--10.5--40.5--
Disclaimer/Publisher’s Note: The statements, opinions and data contained in all publications are solely those of the individual author(s) and contributor(s) and not of MDPI and/or the editor(s). MDPI and/or the editor(s) disclaim responsibility for any injury to people or property resulting from any ideas, methods, instructions or products referred to in the content.

