Article

YOLOTree-Individual Tree Spatial Positioning and Crown Volume Calculation Using UAV-RGB Imagery and LiDAR Data

1
College of Information Science and Technology & Artificial Intelligence, Nanjing Forestry University, Nanjing 210037, China
2
State Key Laboratory of Tree Genetics and Breeding, Key Laboratory of Tree Breeding and Cultivation of State Forestry Administration, Research Institute of Forestry, Chinese Academy of Forestry, Beijing 100091, China
3
Institute of Forest Resource Information Techniques, Chinese Academy of Forestry, Beijing 100091, China
4
Department of Landscape Architecture, College of Architecture and Urban Planning, Tongji University, Shanghai 200092, China
*
Authors to whom correspondence should be addressed.
These authors contributed equally to this work.
Forests 2024, 15(8), 1375; https://doi.org/10.3390/f15081375
Submission received: 17 June 2024 / Revised: 26 July 2024 / Accepted: 30 July 2024 / Published: 6 August 2024
(This article belongs to the Special Issue Panoptic Segmentation of Tree Scenes from Mobile LiDAR Data)

Abstract

:
Individual tree canopy extraction plays an important role in downstream studies such as plant phenotyping, panoptic segmentation and growth monitoring. Canopy volume calculation is an essential part of these studies. However, existing volume calculation methods based on LiDAR or based on UAV-RGB imagery cannot balance accuracy and real-time performance. Thus, we propose a two-step individual tree volumetric modeling method: first, we use RGB remote sensing images to obtain the crown volume information, and then we use spatially aligned point cloud data to obtain the height information to automate the calculation of the crown volume. After introducing the point cloud information, our method outperforms the RGB image-only based method in 62.5% of the volumetric accuracy. The A b s o l u t e E r r o r of tree crown volume is decreased by 8.304. Compared with the traditional 2.5D volume calculation method using cloud point data only, the proposed method is decreased by 93.306. Our method also achieves fast extraction of vegetation over a large area. Moreover, the proposed YOLOTree model is more comprehensive than the existing YOLO series in tree detection, with 0.81% improvement in precision, and ranks second in the whole series for m A P 50 - 95 metrics. We sample and open-source the TreeLD dataset to contribute to research migration.

1. Introduction

The study of vegetation remote-sensing image processing is very valuable. Numerous downstream applications are derived from it, including vegetation area segmentation [1,2], individual tree extraction [3,4], and vegetation density research [5,6]. Researchers have been able to model individual trees with point clouds for individual tree extraction [7]. The calculation of tree canopy volume plays a great role in the evaluation of the management and actual monitoring of plantations, which can create conditions for the accurate calculation of the living vegetation volume and carbon storage of vegetation, and can be used as an indicator for comprehensively evaluating the ecological benefits of urban and forest areas. We found that using only vegetation phenotype information from point cloud LiDAR scans is insufficient for modeling the internal structure of tree crowns. This directly leads to volume underestimation when employing existing voxel-based modeling methods based on point clouds, as they do not sample points within the crown’s interior. To address this issue, we propose complementing the volume estimation using ellipsoidal geometric modeling, while ignoring internal structural details. Since internal crown structure is irrelevant for volume calculations, this assumption proves effective for computing crown volumes. For crown shape, we utilize remote-sensing imagery to capture maximum crown dimensions and assume it as the base, which aligns with the growth morphology of Chinese Catalpa bungei C.A.Mey. Additionally, we observe variations in catalpa tree growth due to factors such as pruning and environmental conditions, resulting in diverse shapes (tall and thin, short and thick). We employ morphological curvature for selection and calculate crown volumes using two different modeling approaches, effectively fitting crown profile information for different growth forms. Our goal is to come up with a deep learning method that can solve this problem at a lower computational cost. However, processing data in a direct point cloud is often associated with significant computational and financial expenses. Images with extremely high-spatial resolution information are frequently needed for remote-sensing individual tree extraction. The two primary types of mainstream UAV data acquisition forms are: (1) passive remote sensing data, which is represented by RGB and hyperspectral images; (2) 3D stereo point cloud data obtained by LiDAR scanning. RGB photos are less expensive and can help with band redundancy in hyperspectral images during monoculture extraction at the same aircraft height. LiDAR data describe the three-dimensional structure of vegetation but lack spectral information. Combining two distinct data dimensions can be useful in both two- and three dimensions and compliment one another.
Thus, we suggest that the required parameters can be obtained by pre-processing the data using RGB-UAV remote-sensing imagery and combining it with LiDAR point cloud data positioning. This can reduce the cost of rowan tree canopy volume calculation by avoiding the arithmetic consumption associated with direct spatial data processing. But to do this, a more precise technique for individual tree crown volume extraction and spatial localization is needed. Recent years have seen significant advancements in the use of deep learning in remote-sensing image processing [8]. Traditional machine learning approaches require a laborious feature analysis procedure, which is eliminated by deep learning. The branch of target detection is necessary for both localization and crown volume extraction. The end-to-end YOLO series (You Only Look Once) are the current bounding-box-based target detection techniques. This series is currently the most mainstream algorithm framework for object detection, and is widely used in real-time detection. In this research, we address the need for more precise range extraction and suggest a novel network YOLOTree to do so.
In order to verify the accuracy of proposed network for crown range extraction, we selected the rowan artificial forest area in Jiaozuo City, Henan Province ( 34 ° 53 60 N, 113 ° 09 00 E) as the study area to create the dataset TreeLD for individual-tree localization and crown range extraction (The area is shown in Figure 1). Jiaozuo is rich in vegetation resources with a warm climate, and the catalpa trees there have a good growth posture, which provides a good source of data for rowan tree adults at different growth stages. Catalpa tree is native to China and is a tree of the genus Catalpa in the family Ziweiidae. It is a small tree ranging between 8–12 m in height. Its leaves are triangular-ovate or ovate-oblong, 6–15 cm long, up to 8 cm wide, apically long acuminate, base truncate, broadly cuneate or cordate. The site has a rich vegetation resource, a warm climate and has a favorable growth pattern, providing catalpa trees with different growth stages for study. Our RGB imagery was acquired by low altitude remote sensing from a large aircraft flying at an altitude of about 2500 m, with a spatial resolution of 0.6 m, and at a speed of 500 to 700 km per hour. Our point cloud data were generated from LiDAR scanning. We unify the relative coordinates of the RGB image with the horizontal plane of the point cloud data through spatial correlation operations, which facilitates us to obtain the canopy height information in LiDAR. Meanwhile, in order to verify the compatibility extraction capability of our model, we compared different publicly available remote sensing datasets and achieved good results.

2. Related Work

2.1. The Development of Target Detection Method

Currently, an increasing number of scholars are using object detection neural networks for object extraction work. These networks have shown good results in various fields such as crowds, pests, vegetation, and automobiles. Representative object detection algorithms can be broadly categorized into two major types. The first type is the two-stage extraction structure, with the R-CNN series neural networks as representatives. The second type is the individual-stage end-to-end neural networks, with the YOLO series as representatives.
In the early stages of object detection development, Girshick et al. [9] proposed the R-CNN network. Its network architecture can be divided into two stages. First, a separate network is used to train the candidate box generation network, and then a region selection network is used to adjust the position parameters to obtain the final prediction results. This was also the first introduction of CNN into the field of object detection. However, due to the need to train a separate SVM classifier for each category and then use a regressor to regress the bounding boxes for each category, the classification and bounding box prediction, which should have been related, were separated. This affected the speed of network training and inference. Subsequently, Girshick et al. [10] optimized and proposed the Faster R-CNN structure, which combines feature extraction, proposal extraction, bounding box regression, and classification together, greatly improving overall performance, especially in detection speed.
However, it is still fundamentally a two-stage network. There remained a pressing need for an individual-stage network that is easy to train and deploy, leading to the birth of the YOLO series. YOLOv1 [11] directly predicts detection outputs based on regression, achieving an end-to-end object detection method. It detects all the bounding boxes at the same time, and unifies the detection steps. The YOLOv3 [12] series integrates a deeper Darknet-53 backbone network, replacing all max-pooling layers with fully connected layers, and adding Residual connections, making feature extraction more accurate. In addition, it introduces the precedent of multi-scale prediction for the first time, improving the weakness in detecting small objects.
Then in 2020, YOLOv4, proposed by Bochkovskiy et al. [13], attempted to find the best balance by experimenting with many variations classified as bag-of-freebies and bag-of-specials. Bag-of-freebies refers to methods that only change training strategies and increase training costs without increasing inference time, with data augmentation being the most common. On the other hand, bag-of-specials refers to methods that slightly increase inference costs but significantly improve accuracy. YOLOv5, maintained by over 250 developers, introduces five different parameter size versions of network structures. YOLOv7 [14] introduces the concept of model scaling based on concatenation, where standard scaling techniques such as depth scaling lead to changes in the ratio between the input and output channels of transition layers, which in turn reduces the hardware usage of the model. YOLOv8 is anchor-free, reducing the number of box predictions and speeding up non-maximum suppression (NMS). Additionally, YOLOv8 uses mosaic augmentation during training. YOLOv9 [15] introduces Programmable Gradient Information (PGI) and strengthens deep supervision and multi-scale feature extraction during network training through the GELAN main branch.

2.2. The Development of Point Cloud Method

With the advancement of 3D acquisition technologies, an increasing number of scholars are dedicating themselves to the study of three-dimensional spatial data. These irregular 3D spatial information datasets have empowered various industries, including 3D depth prediction [16], 3D shape classification [17,18,19], remote sensing urban extraction [20,21], irregular volume calculation [22], and more.
Three-dimensional data are typically stored in unstructured formats, posing challenges for deep learning in handling such irregular data. Some studies employ projection techniques to project point cloud data into different dimensions for multi-view learning, which can be used for shape classification and volume calculation. Other scholars utilize graph convolutions to handle non-structural information in point cloud data, predicting connections between information. For instance, some researchers use it for training individual-tree modeling. In terms of deep neural networks for volume calculation, Daniel et al. [23] proposed a method called VoxNet, which reliably achieves 3D object recognition. Additionally, the ShapeNet network proposed by Wu et al. [24] learns the point cloud distribution of various 3D shapes. However, these methods for processing point clouds still face the challenge of high time complexity. As resolution increases, computational and memory resource requirements grow exponentially. Such costs are evidently unacceptable for tasks like volume calculation in artificial forest individual-tree populations. Therefore, we propose a new method to bypass the direct processing of point cloud data, instead leveraging the implicit spatial information for individual-tree volume calculation.

3. The Proposed Work

This section will present our work in two parts. First, we will show our workflow in detail. Then, we will analyse our proposed network model on a principle level.

3.1. Our Work

Our work can be summarised in two main steps (Flowchart is shown in Figure 2): firstly, individual tree crown extraction is performed using UAV RGB images to obtain crown volume and spatial location information of individual trees. We compare several deep learning target detection methods and propose the novel network architecture YOLOTree for accurate extraction of individual tree crowns. (Step 1 is shown in Figure 3) Next, we selected sample trees for crown volume calculation and used the location information provided by the programme to locate the point cloud data by coordinates to obtain the crown height. In order to ensure that the spatial resolution of the UAV image matches that of the point cloud data, we conducted a spatial alignment exercise to unify the magnitude, facilitating subsequent canopy volume calculations (Step 2 is shown in Figure 4). We first mapped the point cloud data to the Z-axis to obtain the monoki top view, and then calculated the mapping relationship between the pixels in the RGB image of the UAV and the actual spatial distance through the programme and applied it to the top view to obtain the appropriate tree point cloud data.

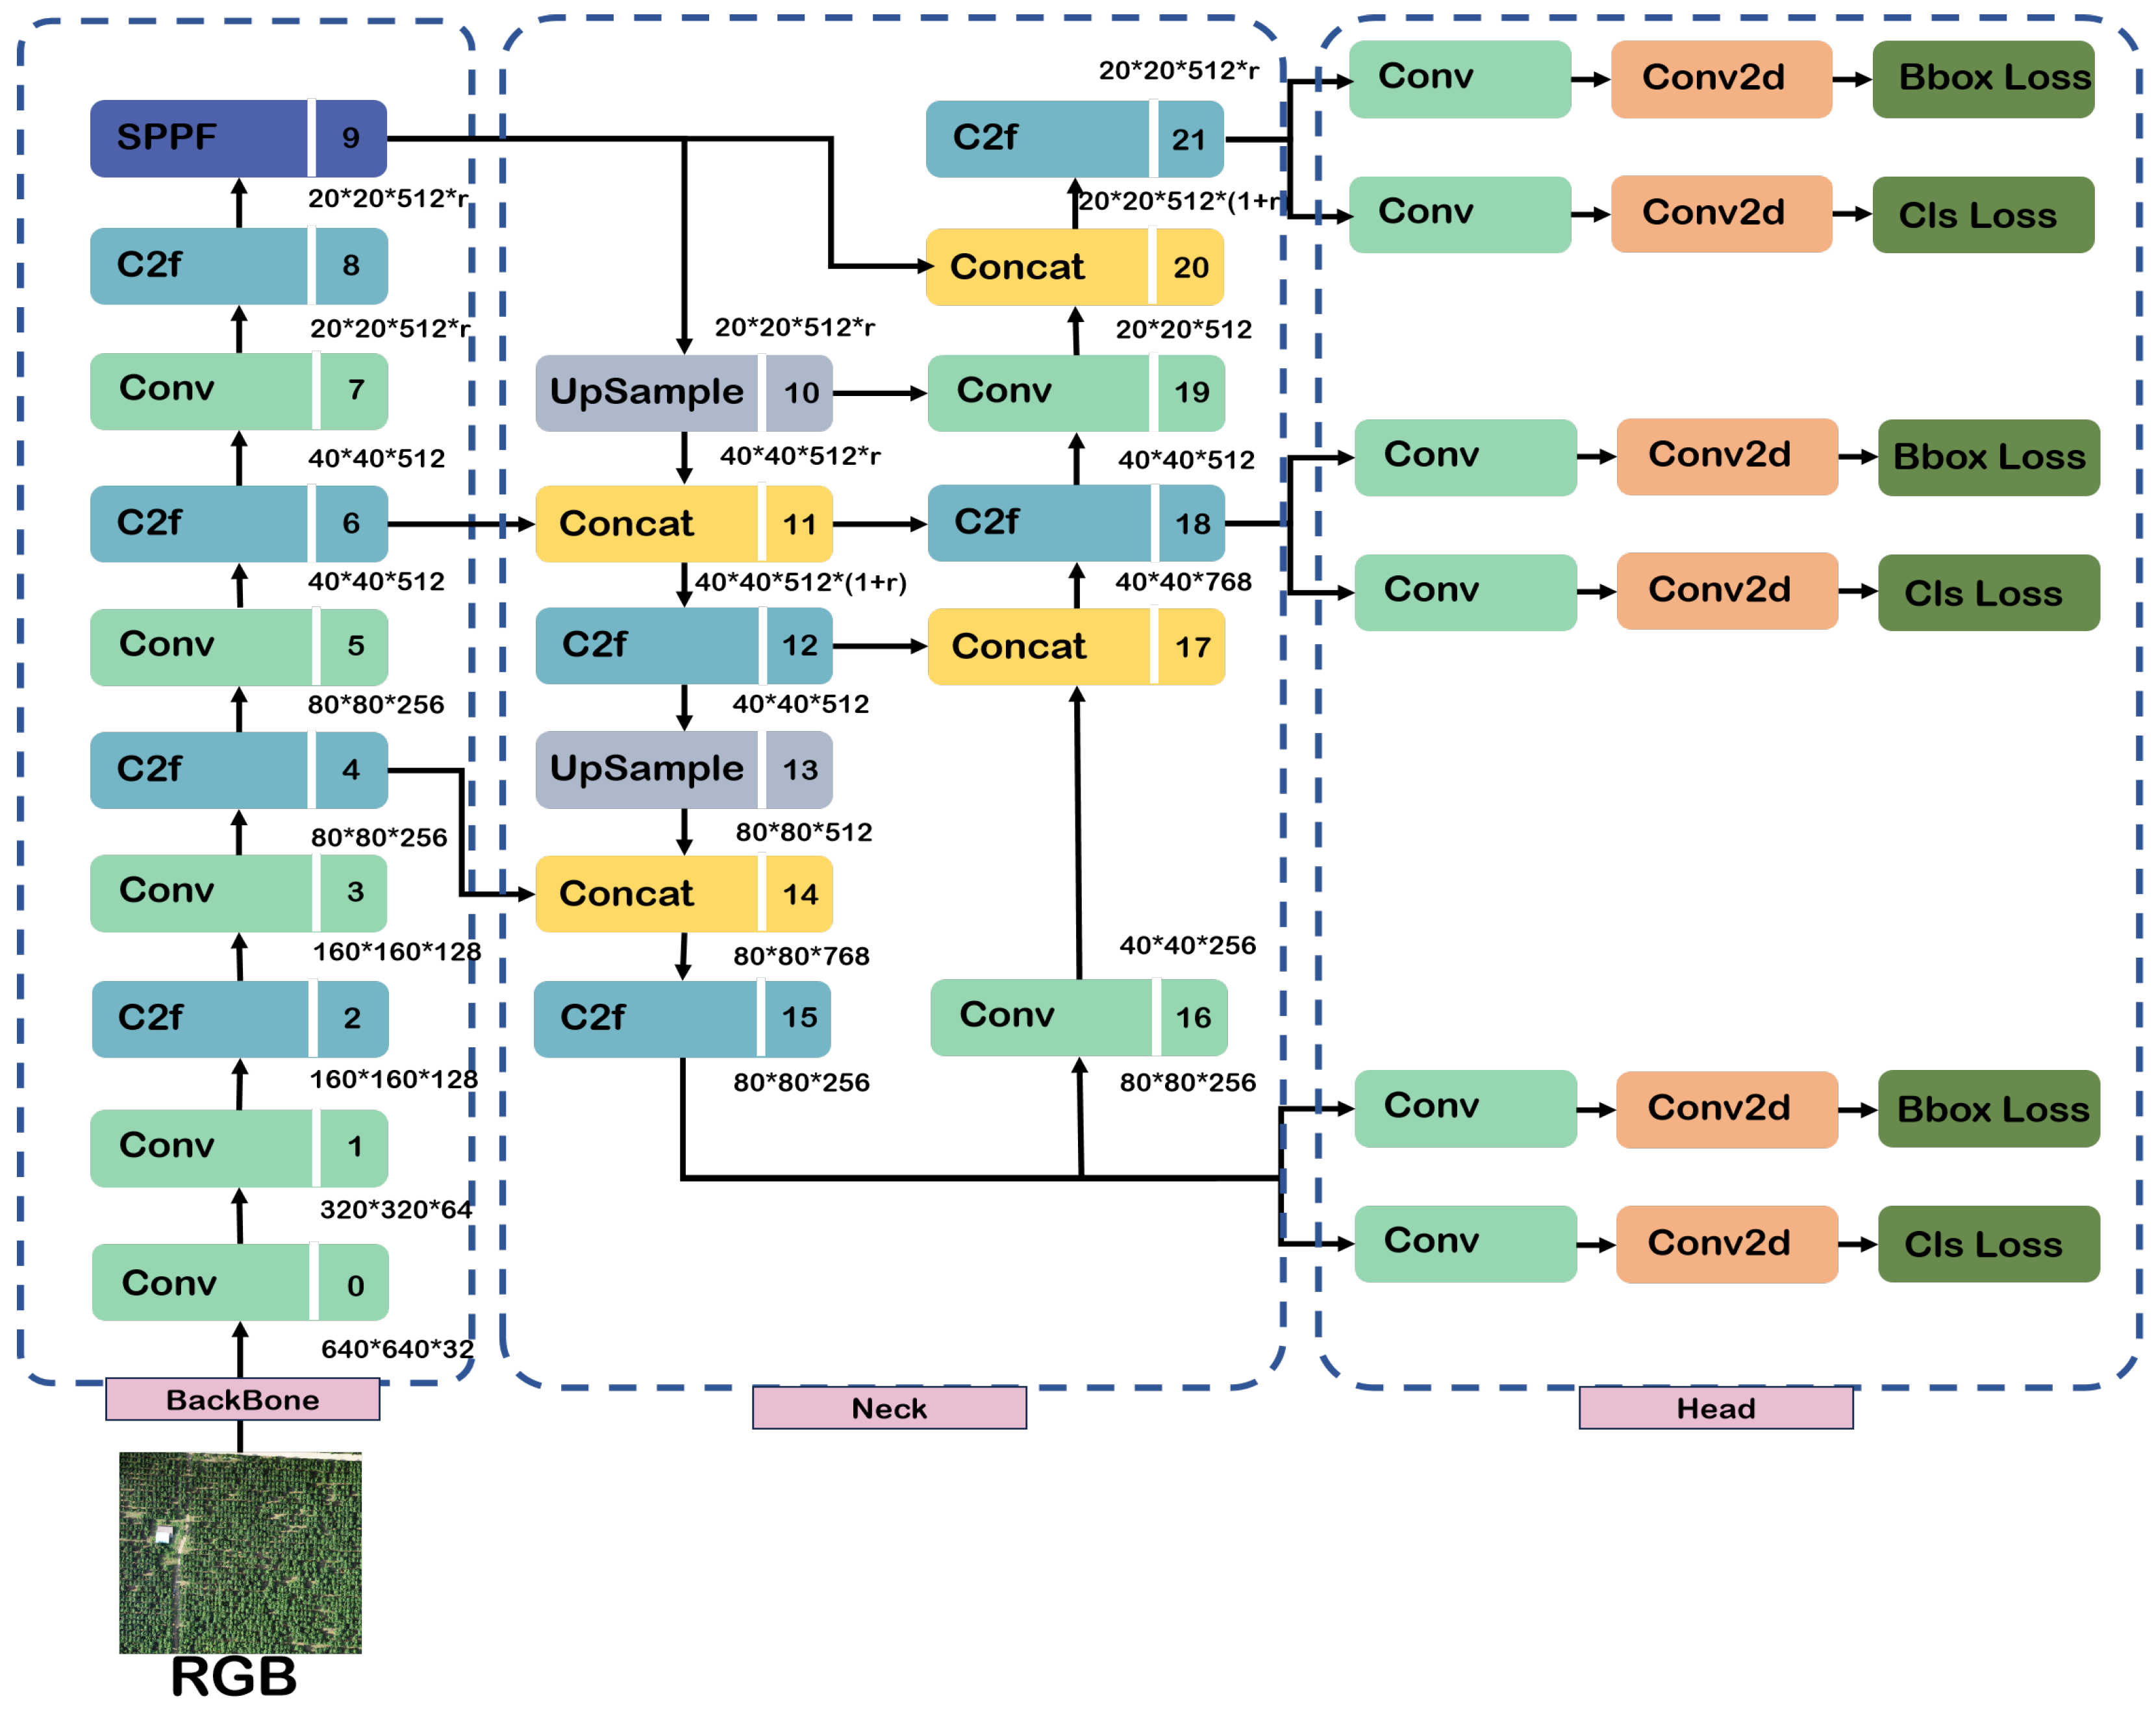
3.2. The Overview of YOLOv8

YOLOv8 (You Only Look Once version 8), as a significant advancement in the field of object detection, (The structure is shown in Figure 5) has achieved notable improvements in accuracy and speed through overall architectural optimization and innovation. It considers the multi-scale characteristics of objects, using three detection layers at different scales to accommodate objects of various sizes. This multi-scale strategy effectively handles targets of different sizes and proportions, enhancing the model’s detection accuracy for a variety of objects. Its comprehensive design includes three main parts: Backbone, Neck, and Head, each of which plays a crucial role in the final performance of the model. (1) The Backbone efficiently extracts multi-scale features, ensuring the model’s perceptual capability across different scales, including modules like Conv, C2f, and SPPF (Spatial Pyramid Pooling-Fast); (2) The Neck, through the integration of a feature pyramid network and a path aggregation network, enhances the multi-scale fusion of features and the transfer of contextual information, improving the model’s detection accuracy; (3) The Head adopts a decoupled head strategy, responsible for target classification, bounding box regression, and confidence assessment in the prediction layers, and outputs precise detection results through the technique of non-maximum suppression.
The integrated design and optimization of these three parts have made YOLOv8 perform excellently in various complex scenarios, making it a significant achievement in the field of object detection. To accommodate different hardware devices and application scenarios, it is available in five versions: n, s, m, l, and x. These models vary in width and depth parameters, leading to variations in the number of parameters and resource consumption. As model scale increases, both parameter count and resource consumption rise, contributing to progressively improved detection performance. We selected YOLOv8n as our baseline model due to its relatively lower parameter count and resource efficiency, making it an ideal starting point for research and experimentation. By comparing performance differences among models, we can more comprehensively understand the strengths and weaknesses of the model, thus guiding subsequent model improvements and optimizations.

3.3. Overview of Proposed YOLOTree

The accurate identification of individual trees in forested areas presents challenges due to mutual shading among trees, which can obscure or connect parts of tree crowns, complicating separation. Furthermore, individual tree detection often requires high-resolution images to clearly capture the details of individual trees. However, high-resolution image processing is challenging, consumes a lot of computing resources, and requires the algorithm to handle complex backgrounds, occlusions, and diverse features to ensure detection accuracy.
To address the challenges of low accuracy and the common issue of detecting clumps of trees in RGB images, alongside the need for model light-weighting, we propose the YOLOTree object detection model based on YOLOv8 (The structure is shown in Figure 6). This model aims to fully explore the potential for identifying individual trees against complex forest backgrounds.
Firstly, it employs multi-scale feature fusion to effectively integrate high-level semantic information with detailed low-level features. Enhancements to the FPN (Feature Pyramid Network) bolster the model’s detection performance across varied scales. Secondly, to enhance feature expression capabilities, we introduce the EMA(Efficient Multi-Scale Attention) mechanism and design the C2f_EMA module to replace the original C2f module, effectively adjusting the receptive field.

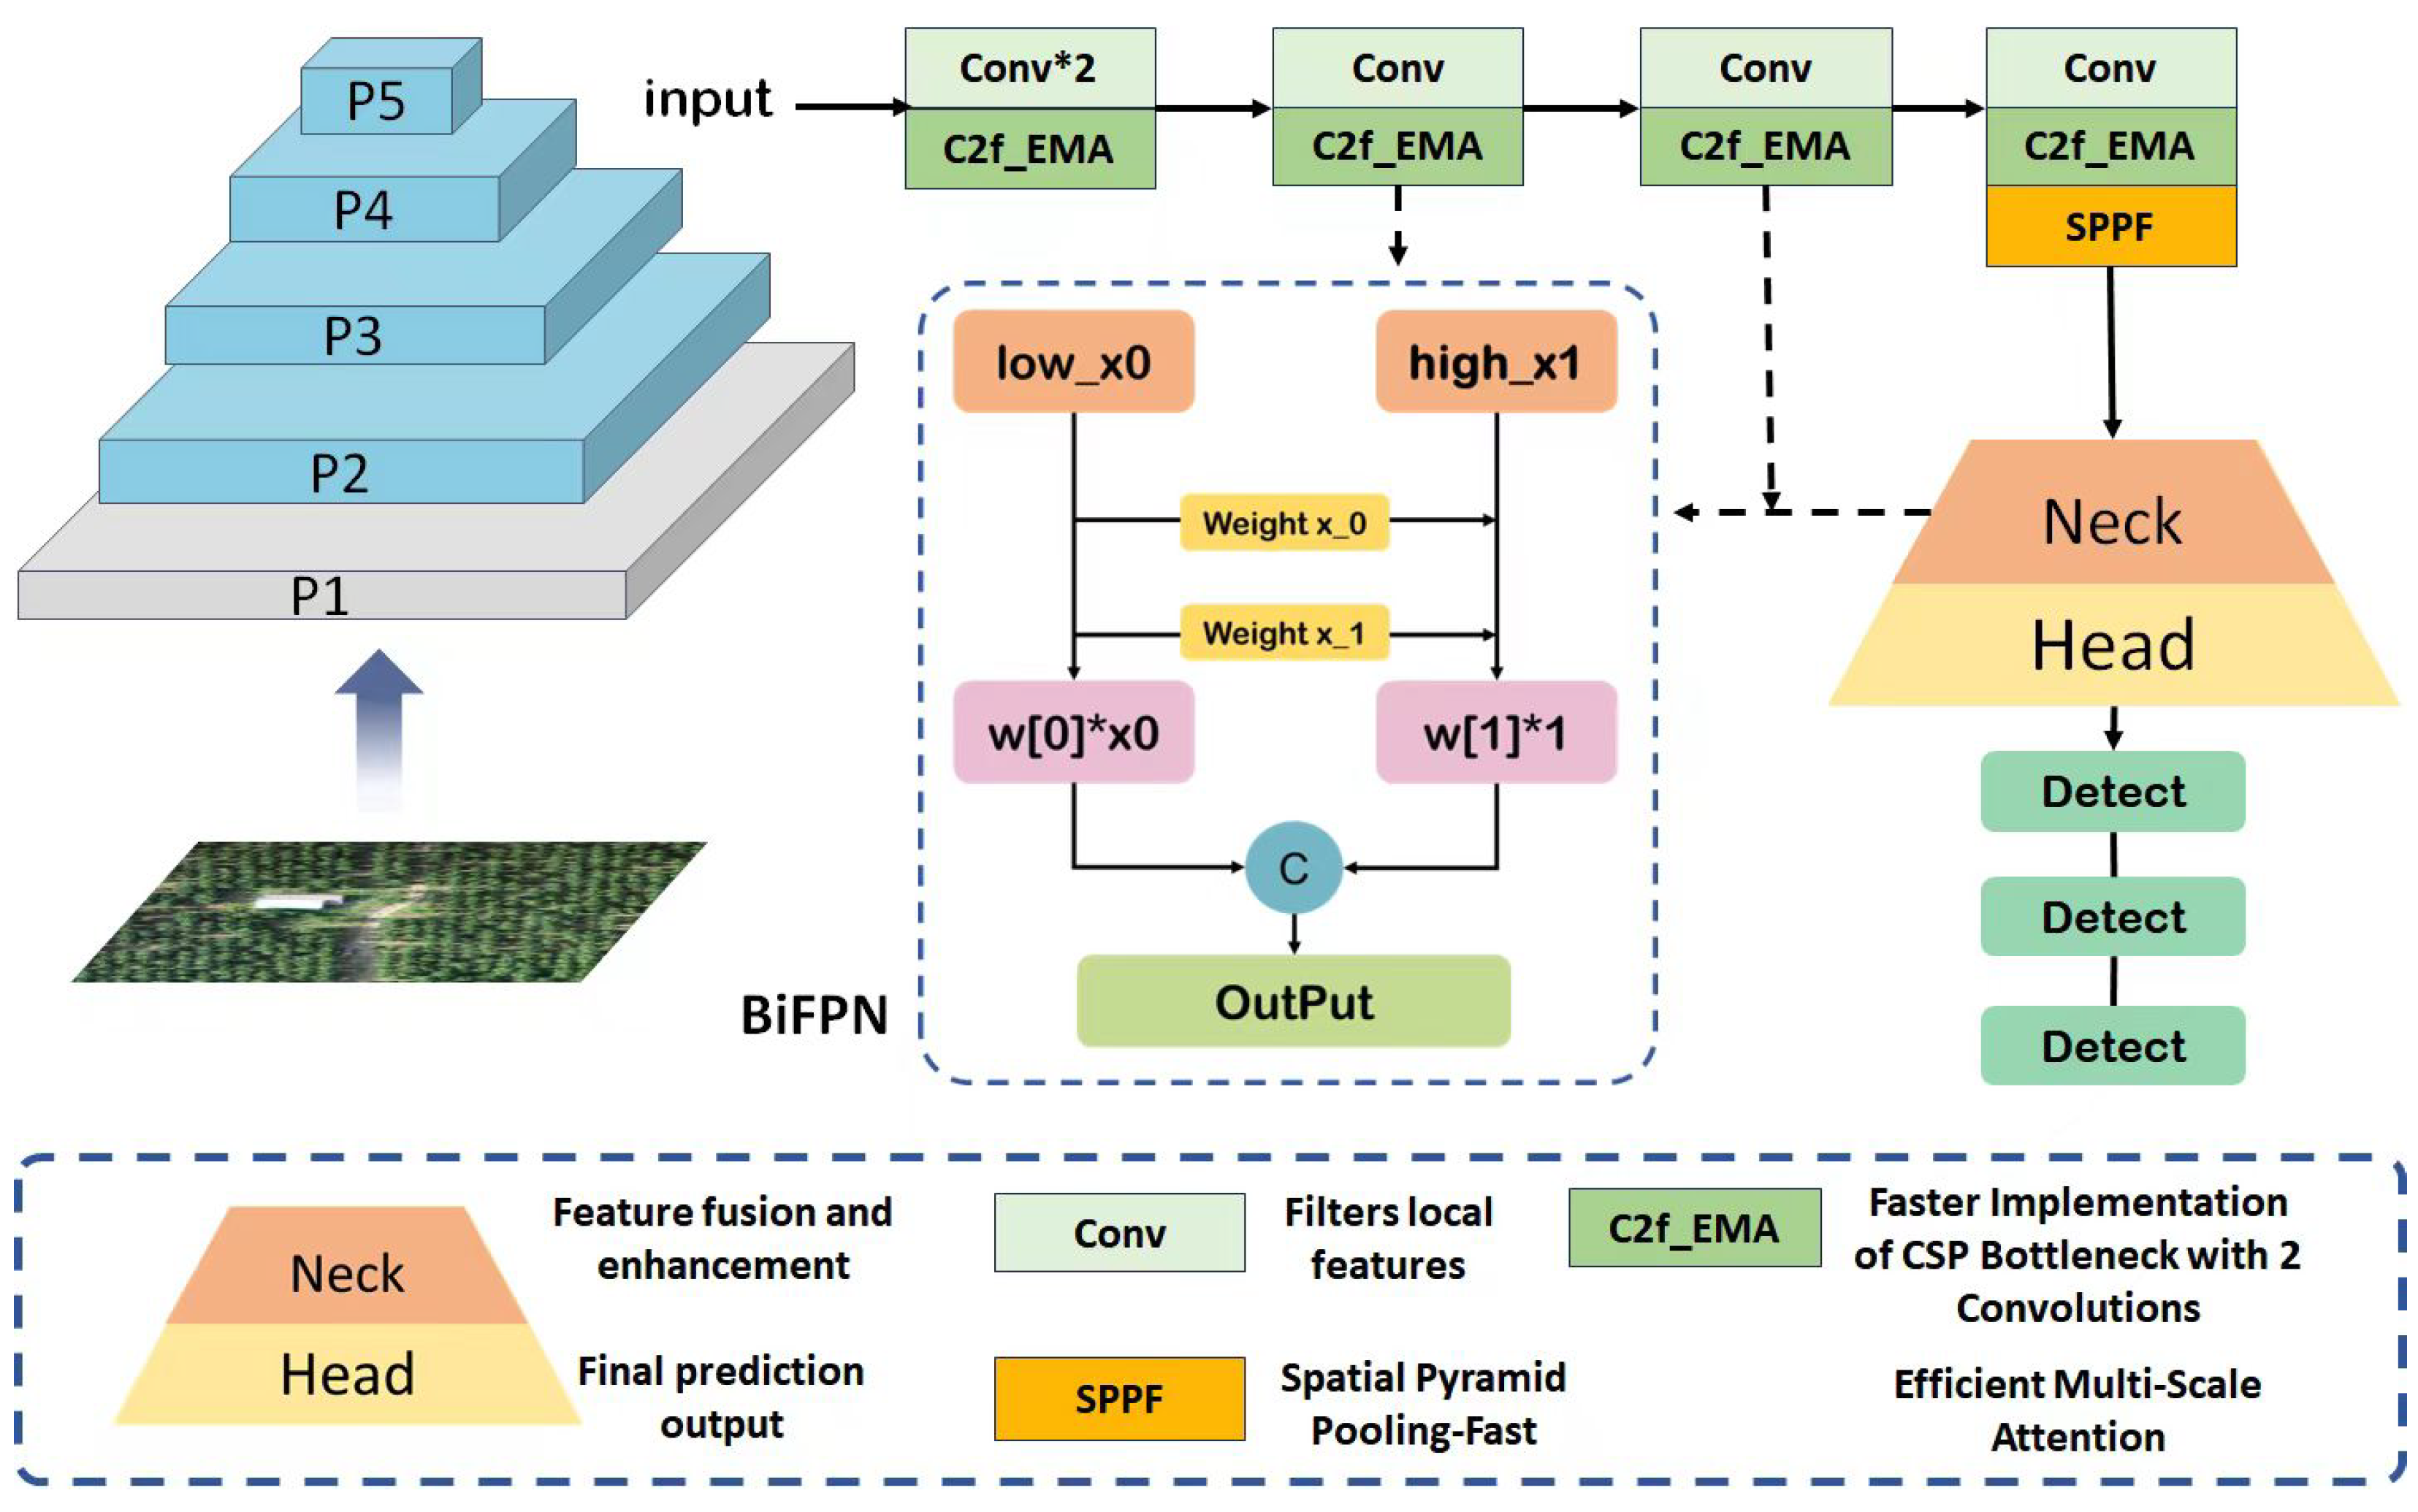
3.4. Multiscale Feature Fusion

Multiscale feature fusion plays a crucial role in the field of computer vision, aiming to integrate feature maps from different levels and scales to enable detection models to better perceive and understand target information at various scales. This integration results in more comprehensive and rich feature representations. During the process of multiscale feature fusion, feature maps of different levels and resolutions correspond to different receptive fields and semantic levels of feature representations. Shallow features are upsampled to match the resolution of deeper features, and then weighted concatenation is performed, allowing fine-grained details captured by shallow layers and semantic information captured by deep layers to complement each other, generating enhanced feature representations. Ultimately, the fused feature maps are used for target detection through the detection head. This process assists models in individual tree detection tasks by overcoming common issues such as target scale variations and occlusions, thereby improving detection accuracy and robustness.
We propose a multiscale feature fusion method based on Bidirectional Feature Pyramid Network (BiFPN) [25]. Building upon the FPN, this network introduces bidirectional connections and multi-level feature fusion mechanisms. It establishes forward and backward connections between feature maps at different levels for adaptive feature fusion. In our model, the division of feature maps is based on the network’s hierarchical structure and the resolution of each layer’s feature maps. Specifically, the feature maps are divided into shallow features and deep features. Shallow feature maps come from the early stages of the network and have higher resolution but lower semantic information. In contrast, deep features come from the later stages of the network, containing abstract semantic information but fewer spatial details. To fuse feature maps from different levels, shallow features are upsampled to match the resolution of deep features. These feature maps are processed by the three main parts of YOLOv8 and the BiFPN module. Through specific hierarchical division and multiscale feature fusion, the model effectively performs object detection across different resolutions and semantic levels.
By considering the scale and semantic information of input feature maps, BiFPN introduces trainable weight parameters. When the model is incorporated into the overall network structure, its forward and backward propagation processes automatically compute the loss function and the gradients of the weights concerning the loss function. The optimiser then updates the parameters based on the gradients, minimising the loss function. This process is repeated multiple times until the model converges or the predefined number of training iterations is reached. During feature fusion, BiFPN employs a weighted sum approach to generate the fused feature map P i l + 1 from the l-layer feature map P i l :
P i l + 1 = w j × r e s i z e ( P i l ) w j + ε ,
where i represents the set of feature layers involved in the feature fusion, w j denotes the weight of the j-th input feature layer, reflecting its importance in the fusion process, and r e s i z e adjusts the size of the input feature layers to ensure consistency in feature size. The constant ε is usually a very small value, generally in the range of 10 4 to 10 6 , used to prevent division by zero when computing normalised weights.

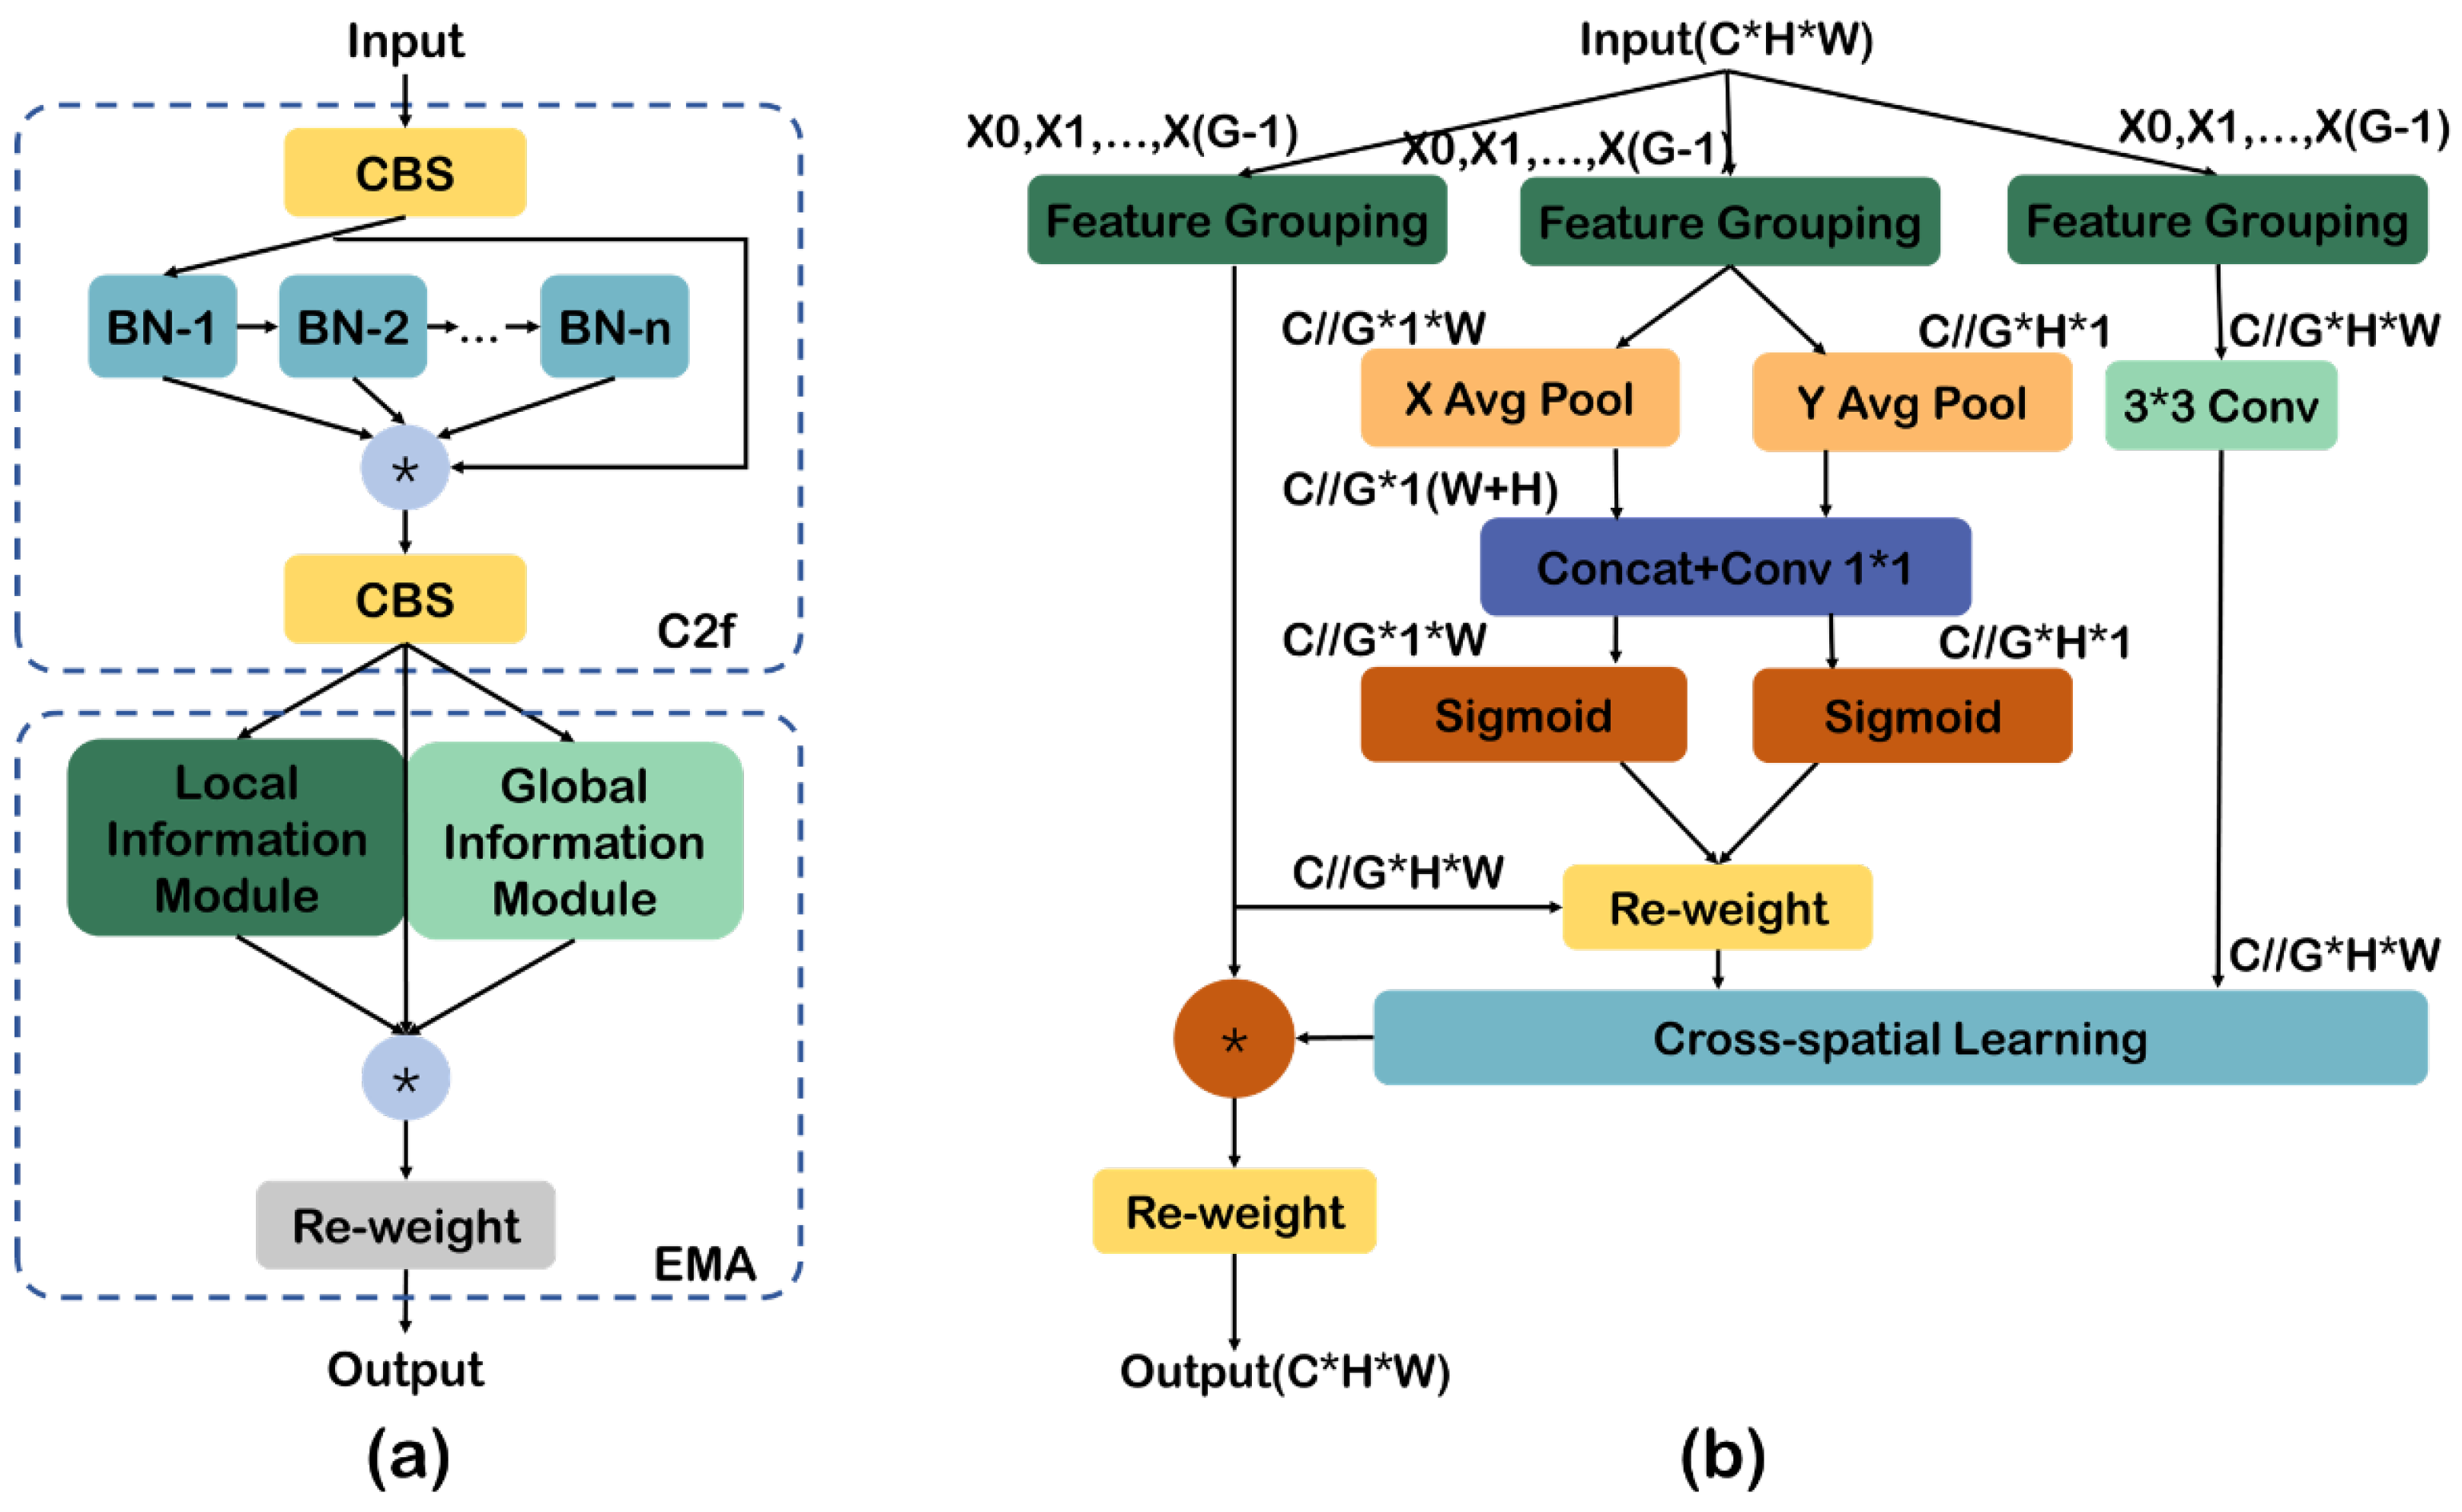
3.5. The C2F _EMA Module

In remote sensing images, particularly against complex backgrounds like forests, the boundaries between trees are often blurred, making it difficult to distinguish targets from the background. The model struggles to extract small targets of interest from large images. To address these issues, we have introduced the EMA attention mechanism (The structure is shown in Figure 7b) and reengineered the C2f module in YOLOv8, designing the C2f_EMA module (The flowchart is shown in Figure 7a). The C2f module performs initial feature extraction, it integrates CBS (ConBnSiLU) for normalization. After normalization, the features are split into two branches. One branch is passed directly to the output, while the other branch is processed through multiple BN (BottleNeck) modules. The BN module first reduces dimensions using a 3 × 3 convolution kernel, then performs convolution computation before directly outputting. In this process, the number of channels is halved to reduce network parameters. This bottleneck structure allows the network to efficiently capture complex patterns, maintaining low computational complexity while enhancing model performance and representation capability. Finally, the results of both parts are concatenated along the channel dimension, increasing the network’s capacity to express input features. The EMA module captures multi-scale feature information through parallel convolutions and global average pooling, reweighting features with attention mechanisms to enhance their representation. By combining the efficient feature extraction capabilities of C2f with the parallel convolutional attention mechanism of EMA (illustrated in Figure 8), we achieve better extraction and detection of key information in images, thereby improving the accuracy of individual tree detection.
EMA [26] is an attention mechanism used to enhance the performance of convolutional neural networks. It reshapes the depth of each layer’s feature map into batch dimensions and employs parallel substructures. This method segments the feature map into multiple sub-feature maps, each undergoing parallel convolution operations. These are then subjected to global average pooling to obtain attention weights. This approach not only avoids excessive sequential processing and deep depths but also ensures a more uniform distribution of spatial semantic features within each feature group. The module combines global information encoding and cross-dimensional interaction to capture pixel-level pairing relationships, aiming to retain information from each channel while reducing computational overhead. Through these innovative methods, the EMA module reduces computational burden while enhancing feature representation capability, thus performing well across various computer vision tasks. In the EMA module, these substructures are realised through a grouping operation. Given an input feature map X ϵ R C / / G H W with C channels, partitioned into G groups, each group contains C / / G channels. Each sub-feature has the same spatial dimensions, allowing different semantic representations to be learned within each sub-feature group.
To capture multi-scale spatial information, the module employs three parallel sub-networks to extract attention weight descriptors for grouped feature maps. Two parallel branches are located in a 1 × 1 branch, and one is in a 3 × 3 branch, recalibrating channel weights for each parallel branch and further aggregating the output features of the two parallel branches to capture pixel-level pairing relationships.
  • Two parallel subnetworks process the input feature map. Each of these subnetworks contains a 1 × 1 convolution layer that performs convolution operations on the feature map of each branch, adjusting the channel weights.
  • Global average pooling is applied to each grouped feature map in both horizontal and vertical dimensions to obtain two sets of vectors. The aim is to aggregate spatial dimension information into a single vector to capture global spatial information. The vectors obtained from horizontal and vertical pooling are then concatenated to form a new feature vector. This new feature vector combines global information from both horizontal and vertical directions.
  • A 1 × 1 convolution is applied to the concatenated feature vector to adjust its dimensions, generate new feature representations, and perform a Softmax operation to normalize the weights.
  • The output features of the two parallel branches are further processed and aggregated. The aggregated feature map contains both global and local information from the two parallel branches.
Through learning and optimization during the training process, each pixel in the feature map is assigned an attention weight based on its global information and contribution in different directions.
For the grouped feature map X ϵ R C / / G H W , where H and W are the height and width, respectively, the output of the 1 × 1 branches is first globally average-pooled separately. This operation averages the entire feature map along spatial positions along a specific dimension, converting information from each channel into a vector. When globally average-pooling along the horizontal dimension, the information of each channel is transformed into a set of average values along the vertical dimension, summarizing positional information along the vertical dimension. For a height H, the pooling output of C is represented as:
Z H C / / G ( i ) = 1 W j = 0 W X C / / G ( i , j ) ,
where ( i , j ) represents positional information, and X c denotes the feature value of channel C at that position. Similarly, when performing global average pooling along the vertical dimension, it can be transformed to capture positional information along the horizontal dimension. This ensures that the information of each channel encompasses the positional information along the horizontal dimension. When the width is W, the pooled output of channel C is represented as:
Z W C / / G ( j ) = 1 H j = 0 H X C / / G ( i , j ) ,
Concatenate the two feature vectors obtained above along the channel dimension. The concatenated feature vector, denoted as Z ϵ R C / / G ( H + W ) is then subjected to a 1 × 1 convolutional operation to yield a new feature vector:
f o u t c ( i , j ) = k = 1 c w c , k × Z ( H , W ) k ( i , j ) + b c μ c σ c 2 + ε × r c + β c ,
where, k represents the input channels, c represents the output channels, and b denotes the bias for the output channels. Batch normalization is applied, with μ representing the mean and ε introduced to prevent division by zero. The parameters r and β represent trainable scaling and shifting parameters, respectively. The weight matrix generated through the aforementioned steps can reflect the importance of each channel and spatial information. We utilize this weight matrix to reweight the original input feature map, adjusting the response values for each channel and spatial position.
By using convolutional kernels and pooling operations of different sizes, information is extracted from image features at different scales (or resolutions) to capture various features in the image, from details to global information. This approach enhances the model’s detection and recognition performance.
The primary purpose of a 1 × 1 convolution is to alter dimensionality by changing the number of channels in the feature map, merging all channel information of each pixel into a new channel. In contrast, a 3 × 3 convolution is mainly used to capture local spatial information: it extracts features within a local area, increasing the model’s receptive field and contextual understanding. Although it increases computational load, the effect on capturing detail information is significant and can be used in conjunction with different sizes of convolutional kernels to extract multi-scale features. To further enhance feature representation, we employ a process of cross-dimensional reshaping and rearrangement. Specifically, the feature map is reshaped and rearranged to the batch dimension by transposing the channel and batch dimensions. This allows the network to treat channels as independent samples, thus enabling the extraction of more complex and informative features. The reshaped feature map is then divided into multiple sub-feature groups, each with the same spatial dimensions, allowing different semantic representations to be learned within each group. Following the reshaping, the outputs of the 1 × 1 and 3 × 3 branches are subjected to global average pooling separately, encoding global spatial information to form a new input and enhancing the global and local dependencies of feature expression. The model captures both global information and local information during the feature extraction process. This dual capture enhances the feature representation capability and improves detection accuracy.
Cross-Spatial Learning enhances pixel-level attention in high-level feature maps by aggregating information across different spatial dimensions, capturing pixel-level pairing relationships and global context. This method combines channel and spatial information, forming a richer feature representation, and enhances model performance in image classification and object detection tasks. Finally, joint activation, after combining channel features, involves weighting and combining two spatial attention maps to generate the final output feature map. This feature map retains the dimensions of the input feature map and contains richer spatial and channel information. The weights are determined through a global average pooling operation that reduces each feature map to a single vector, effectively summarizing spatial information. This vector is subsequently passed through a fully connected layer to generate the attention weights. These weights are optimized during the training process, enabling the model to dynamically assign importance to different spatial attention maps. This process ensures the final feature map retains the dimensions of the input feature map while incorporating richer spatial and channel information, thereby enhancing model performance in image classification and object detection tasks.
Considering that the Sigmoid function may encounter issues such as gradient vanishing, we have improved the activation function by introducing Leaky ReLu. The formula as follows:
L e a k y R e L u ( x ) = x i f ( x > 0 ) a x i f ( x < = 0 ) ,
in this function, a is a very small constant that can effectively prevent the neuron death problem associated with LeLU.
Leaky ReLU is to address the issue of potential neuron death caused by standard ReLU, by introducing a small negative slope. This improvement enhances training effectiveness and boosts model stability.

4. Experiments

In this section, we will introduce the details of our experiment and the result we have achieved. Our code is available at: https://github.com/luotiger123/YOLOtree.

4.1. Experiments Details and Datasets

We trained our model using the following training environment: Our graphics card model is NVIDIA GeForce RTX 3080Ti GPU (16GB VRAM). It is a product of NVIDIA Corporation based in Santa Clara, CA, USA. Our official driver version is 546.80. The processor model we used is 12th Gen Intel(R) Core(TM) i9-12900H. We utilized the PyTorch 1.12 deep learning framework developed by Facebook’s team in Menlo Park, California, USA, for training our model. All networks are trained using official source code, with each training session lasting 100 epochs. Most networks leverage weights pretrained on ImageNet. Comparisons are made at similar scales, but this does not imply equal parameter counts. For example, YOLOv8 and YOLOv9, each available in five sizes, are evaluated using the lightest size. We compare the models’ ability to extract tree crown canopies on TreeLD and further test our model’s capability for small object extraction and localization in remote sensing scenes using the classic datasets Carpk and Visdrone. We measure our model’s extraction capabilities using precision, recall, mAP50, and mAP95 to assess performance. Here are the definition of four indicators:
precision = TP TP + FP × 100 % ,
recall = TP TP + FN × 100 % ,
mAP 50 = 1 N i = 1 N AP i 0.5 × 100 % ,
mAP 95 = 1 N i = 1 N AP i 0.95 × 100 % ,
where TP denotes the number of correctly predicted positive instances. FP denotes the number of incorrectly predicted positive instances. FN represents the number of positive instances incorrectly predicted as negative. N denotes the total number of classes. AP i 0.5 denotes Average Precision at IoU threshold of 0.5 for class(i). These four metrics, respectively, measure the p r e c i s i o n , r e c a l l , and average precision at different IoU thresholds, comprehensively evaluating the performance of the model in object detection tasks.

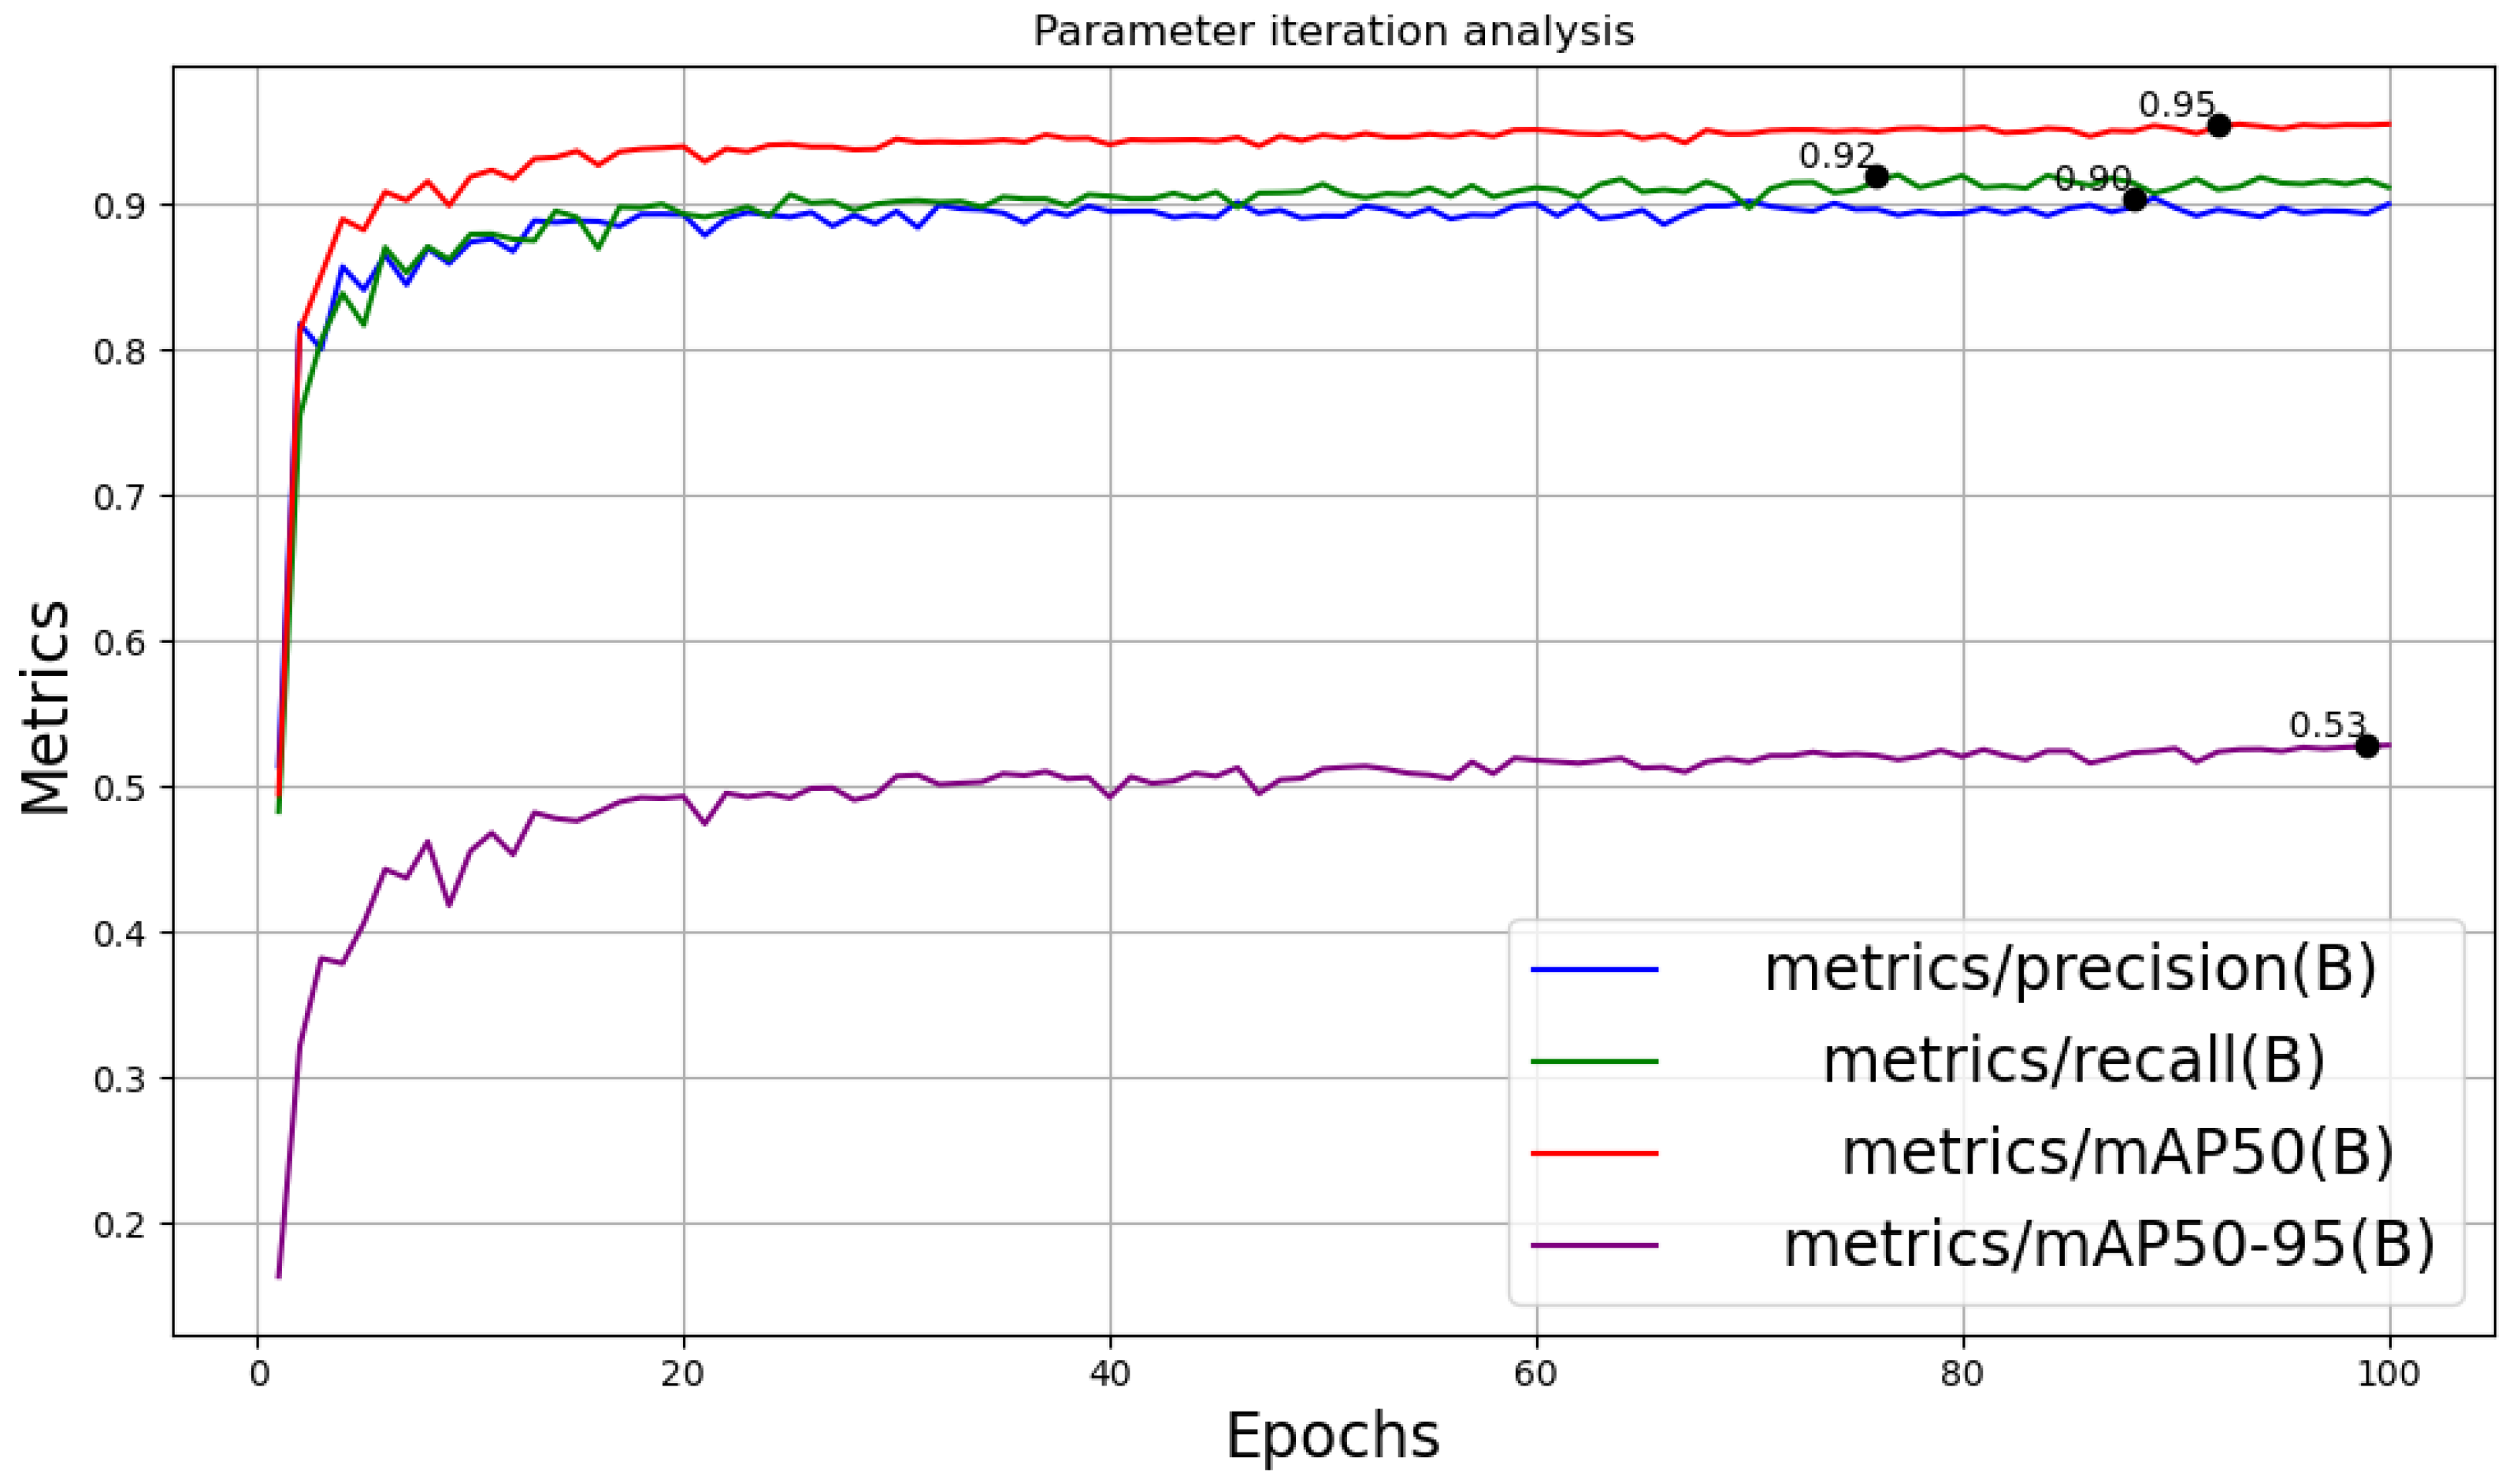
4.2. Quantitative Comparison Results

We compared our proposed YOLOTree with the state-of-the-art YOLO series models, including YOLOv9, YOLOv8, YOLOv7, YOLOv5, and YOLOv3, on three datasets: TreeLD, Visdrone, and Carpk. Additionally, we compared them with the two-stage object detection network Faster-RCNN. All datasets were randomly partitioned to ensure fair comparisons, with 80% of images used for training, 10% for validation, and 10% for testing. The quantitative comparison results are presented in Table 1. It is noteworthy that we selected the lightest model from the official source code for our experiments. Since the lightweight model of YOLOv9 is not open-sourced, we opted for a mid-sized model to conduct comparative experiments.
By incorporating the more efficient parallel convolution module CF2_EMA, our model YOLOTree achieved improvement in individual-tree extraction. On the TreeLD dataset, our model exhibited significant enhancement. With an equivalent parameter scale, our model achieved a p r e c i s i o n score of 90.52%, a r e c a l l score of 91.14%, and m A P 50 and m A P 50 - 95 scores of 95.53% and 52.84%, respectively, which were the highest among all models comprehensively. This indicates that our model not only accurately locates individual trees but also correctly identifies their contour information, demonstrating strong adaptability in individual-tree extraction. Even in comparison with YOLOv9, which has a large parameter count and very long training time, our model only slightly lagged behind in r e c a l l and m A P 50 indicators, further highlighting its superiority. In the Carpk dataset, our model maintained its advantage with a p r e c i s i o n indicator of 98.93%, a r e c a l l indicator of 98.35%, and an m A P 50 - 95 indicator of 83.13%, leading among multiple models. While in the m A P 50 indicator, YOLOv9 scored 99.40 and our model scored 99.22%, showing a minimal difference. Despite YOLOv9’s significant lead in the multi-category detection VisDrone dataset, its training cost is nearly several times that of other lightweight models. It cannot be ignored that the parameter size of YOLOv9 is 20 Mb, and the parameter size of YOLOTree model is 3 Mb. Such costs are unacceptable for rapid modeling of forest vegetation. Obviously, our model has the advantage of being lightweight and has more comprehensive performance. Under equivalent parameter conditions, our model outperforms existing YOLO models.
We also conducted ablation experiments on the model, embedding the EMA module into different stages of the baseline model to obtain different quantitative effects. We selected YOLOv8 at different scales for the ablation experiments, as shown in Table 2. The increase in model scale has little effect on performance improvement but significantly increases the number of parameters and computational load.
We integrated the proposed C2f_EMA module into the backbone, neck, and detection stages of the model. The results show that while embedding the C2f_EMA module in the neck and detection stages slightly improves some metrics, it does not significantly improve overall performance and increases both the number of parameters and computational load. However, embedding it in the backbone can moderately improve precision while maintaining high recall, with a moderate increase in the number of parameters and computational load, demonstrating a good balance.
The improved model YOLOTree, with the C2f_EMA module embedded in the backbone and additional feature fusion, performs excellently in terms of p r e c i s i o n , r e c a l l , m A P 50 , and m A P 50 - 95 , with values of 90.5%, 91.1%, 95.5%, and 52.8%. Our model achieved high precision, and other performance indices were also highly competitive, making the overall performance of our model strong. Moreover, compared to other YOLOv8 models, YOLOTree has relatively lower parameter and computational loads. In summary, while maintaining high performance, YOLOTree exhibits lower complexity and parameter count, making it more advantageous for individual-tree detection applications.
Additionally, we conducted an analysis of the sensitivity of the model to the four parameters involved. We recorded the metrics of the model for each iteration, as shown in Figure 9. It is evident that each metric gradually converges to its peak value. We marked the peak results for each metric. It can be observed that our model converges quickly, with all metrics reaching their optimal levels around the 20th iteration. The fitting is very good, and all metrics exhibit stable convergence.

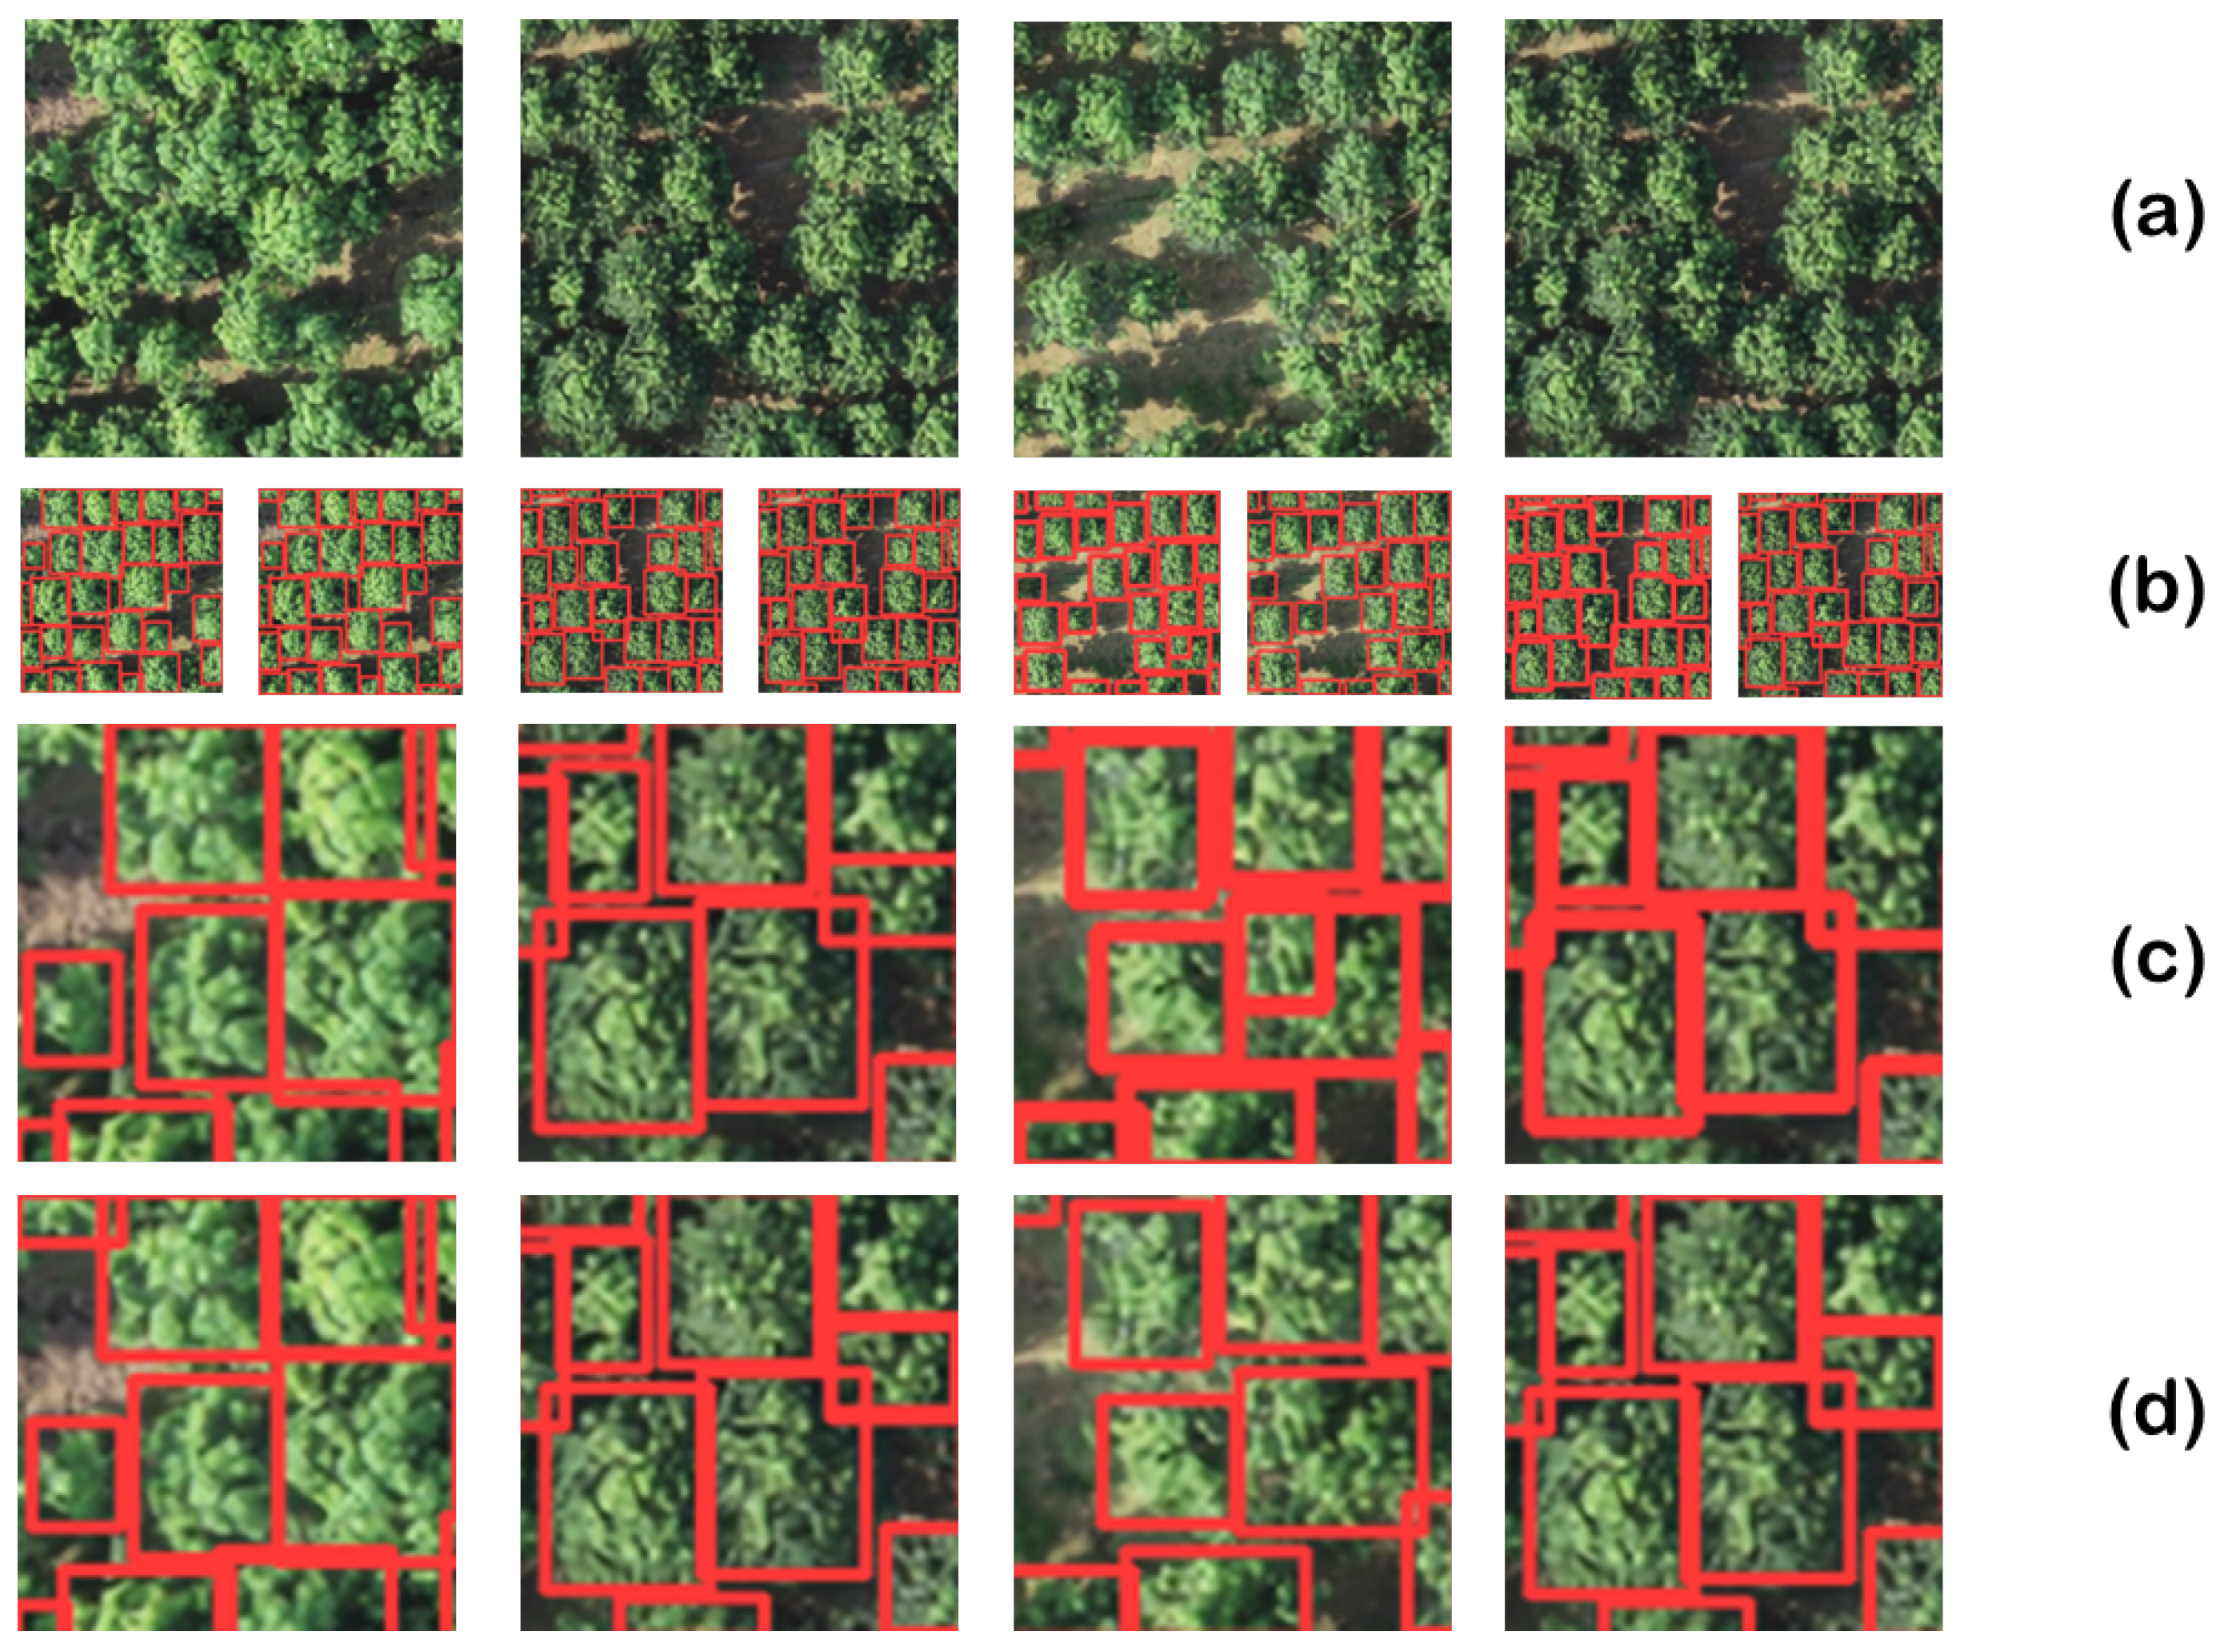
4.3. Visualization Comparison

In this section, we analyze the visual comparison results between models. As illustrated in Figure 10, YOLOTree outperforms YOLOv8 and YOLOv9 in individual-tree recognition tasks. By introducing the EMA module, we emphasize the target detection ability in small fields of view. Therefore, our model can capture small targets within edges, whereas v8 and v9 may have omissions in certain scenarios. Compared to V3 and V7, our model comprehensively captures information for each individual tree (The result is shown in Figure 11). V3 and V7, on the other hand, often fail to capture even the most prominent tree features in some scenes due to their sensitivity to scale changes, rendering them unable to adapt to the interspecies heterogeneity of individual trees.

5. Application

In this section, we will discuss the practical application of the model in calculating the volume of individual trees, with Jiaozuo City’s plantation selected as our study site. Compared to existing mainstream point cloud volume calculation methods, our model has achieved improved accuracy.

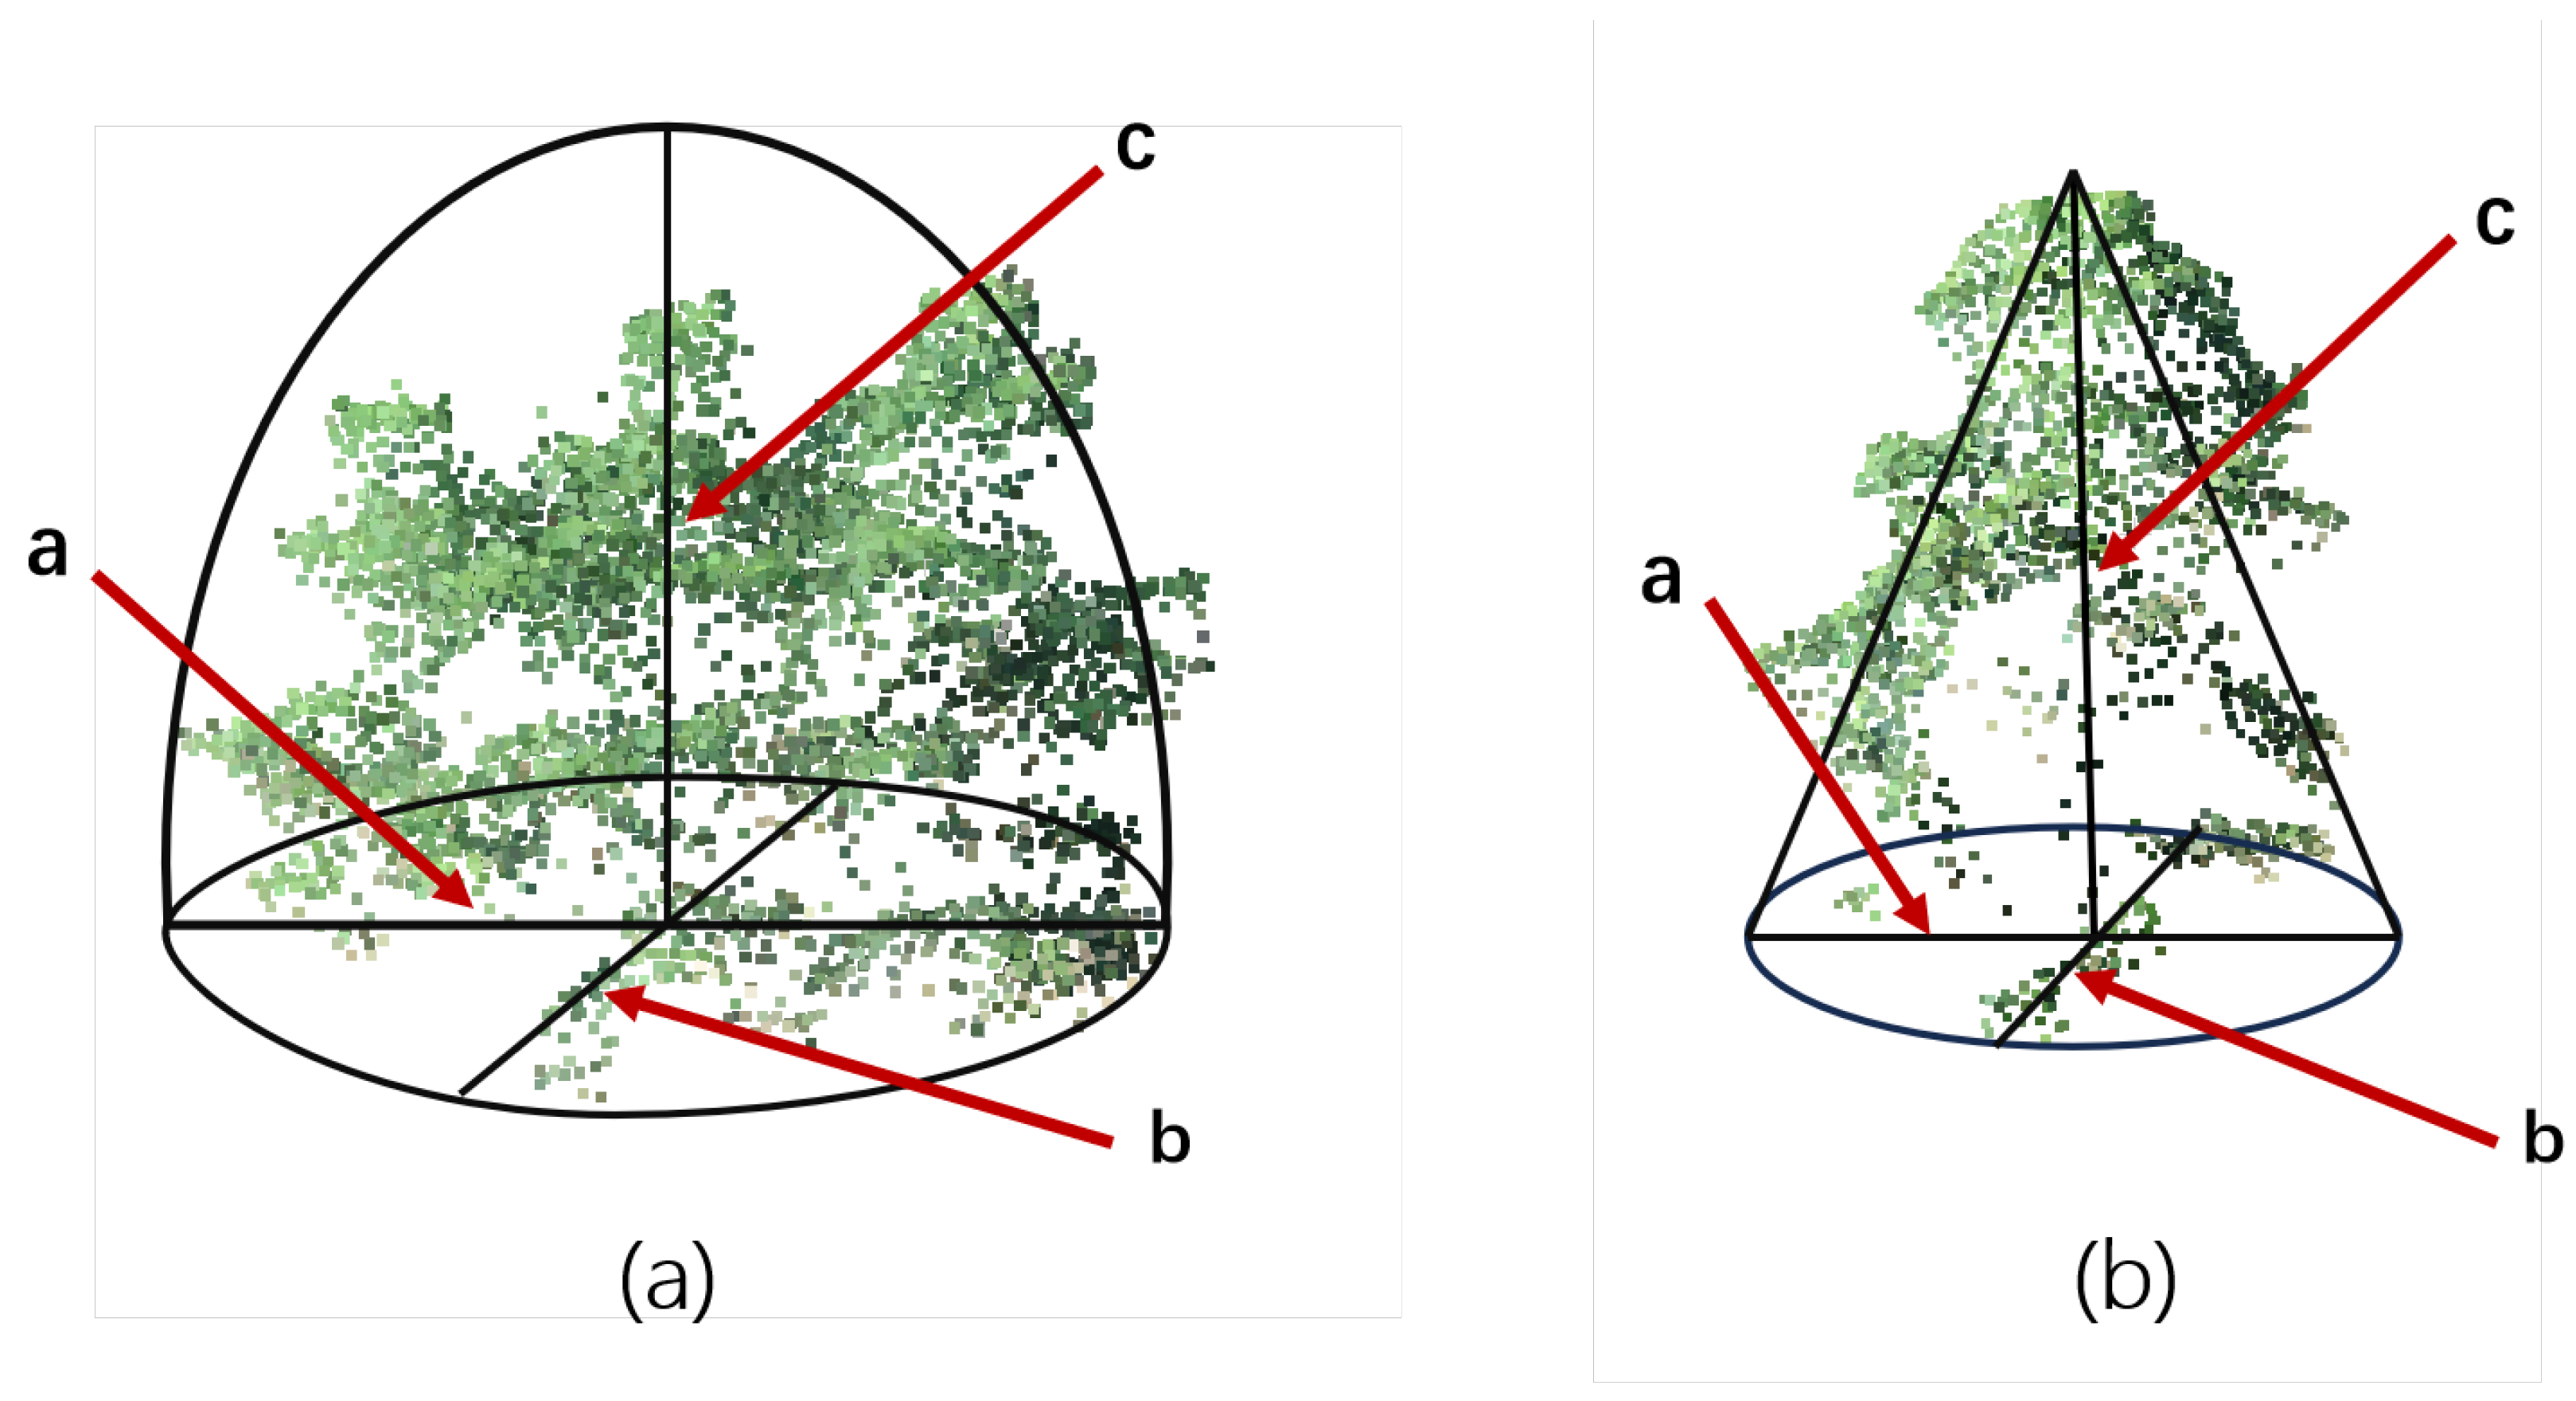
5.1. Modeling of the Canopy Volume Calculation for Catalpa Trees

Scholars typically define the canopy volume as the space covered by the tree canopy, which includes the trunk, leaves, branches, and the gaps within the canopy. For large deciduous trees like catalpas, characterized by their sturdy branches and broad canopies, their crown tops present as semi-ellipsoidal shapes with varying degrees of flatness. Therefore, the volume of an ellipsoid can be used as an approximation to model the canopy volume of catalpa trees (Illustration as shown in Figure 12). An ellipsoid is a surface in three-dimensional space, consisting of all points that satisfy the following equation:
x 2 a 2 + y 2 b 2 + z 2 c 2 = 1 ,
where a, b, and c are real numbers, representing the lengths of the semi-axes of the ellipsoid along the three coordinate axes.
Given that the remote sensing image of the tree presents an elliptical projection on the horizontal plane, we can establish a spatial coordinate system centered on this elliptical surface. Using the proposed YOLOTree, we can obtain the major and minor axes a and b of this ellipse. By then locating coordinates in the point cloud for individual trees, we can obtain height information c. This allows us to derive the formula for calculating the canopy volume:
V = 2 3 π × a × b × c ,
thus, we can approximate the volume of the catalpa tree canopies, but there are some special cases to consider.
We observed that some catalpa trees do not exhibit a semi-ellipsoidal form but rather approximate the characteristics of an elliptical cone. Therefore, for these catalpa trees, we can apply a similar modeling technique by using the canopy projection area as the horizontal plane to establish a spatial coordinate system, resulting in the following volume formula:
V = 1 3 π × a × b × c ,
The selection of two modeling methods depends on the variation in crown curvature; it is also possible to classify the models by training a classifier, although this introduces additional computational load. We have analyzed the major morphological characteristics of the plantation area, and based on empirical values, we consider a curvature greater than 0.05 as semi-ellipsoidal and less than 0.05 as elliptical conical [27]. Our experimental analysis shows that our model achieves high accuracy.

5.2. Existing Point Cloud Volume Calculation Methods and Error Analysis

At present, academics often use two mainstream ideas in dealing with point cloud data volume calculation: the first is to use the voxel method to calculate the point cloud volume. Its main idea is to build an octree in the point cloud space, the space is divided into uniform eight cubes of equal size, by adjusting the depth of the octree, you can control the stereo and then divided into eight smaller stereo, and so on recursively. The points in the cubes where there is a point cloud are considered valid cubes, and vice versa, and the final volume of the object is obtained by adding and summing the volumes of the valid cubes. This is widely used in volume modelling [28]. However, it encounters some problems in monoclinic modelling, as can be seen in the redundancy and shrinkage of volumes under octagonal cubic spaces constructed at different depths. The redundancy is due to the fact that at coarse granularity, as shown in Figure 13a, there will be many edge points that are diffused into an individual effective cubic, and the cubic volume is not small at that granularity. In addition, they are used in the summation volume calculation, introducing a positive error. Secondly, the volume reduction is mainly due to the fact that the canopy point cloud has only canopy surface data and cannot sample the inner canopy. At fine granularity, as shown in Figure 13b, there will be some inner space ignored, which leads to a smaller volume prediction. Therefore, we weight the computation of the two different sampling methods at the same strength to make the volume converge to Ground Truth to some extent. We consider the sum of the two critical depths of the method as the Ground Truth of the volume of an individual tree.
The second method is to use the 2.5D information of the point cloud for volume calculation. Specifically, the model is projected onto the Z-axis horizontal plane, parallel hexahedra are constructed by setting the edge length parameter of the smallest parallel hexahedron, the heat map of the projection’s height difference is used, and the volume of these hexahedra are finally summed up. This approach tends to introduce a large error due to ignoring the contour information of the real model, and its computational results are biased because it constructs the hexahedra using the extreme difference in heights, and the contour of the canopy determines that it will not completely cover the entire space of the hexahedron. Our subsequent experiments proved this point.
Thus, we proposed a new way of modelling the volume of an individual tree, using RGB images from remote sensing images to obtain the contour parameters of an individual tree, as for the height information can be obtained either by counting the average height of plantation forests or by locating specific point cloud data. Our experiments prove that the latter can substantially improve the individual wood extraction accuracy, which is inevitable because catalpa trees grow in different body shapes and are affected by different environmental factors such as light, which can lead to different heights of the trees. To summarise, our method circumvents the computational cost of directly processing point cloud data while delivering high accuracy.

5.3. Visualisation and Quantitative Analysis of Results

Our experiment was carried out in a plantation forest in Jiaozuo City, where we selected and counted 574 individual trees, and obtained individual tree data from the area in the form of LiDAR sampling and UAV remote sensing photography. At the same time, we measured the height of individual trees in the area using a tape measure and calculated the combined individual tree height for remote sensing estimation. We selected eight catalpa trees from both areas for individual wood volume modelling application and comparison. Table 3 exhibits the results of individual wood modelling calculations for different models. V(2.5D) represents volume calculated using the 2.5D parallelepiped method. V(left) represents the coarse granularity left boundary case of OcTree, while V(right) represents the fine granularity right boundary case of OcTree. V(rs) indicates volume estimated using two-dimensional remote sensing images and average tree height. V(ours) represents volume estimated using two-dimensional images and point cloud tree height. V(GT) represents the actual modeled volume. In the case of these eight trees, our model outperforms using only RGB images for five of them. We use a metrics Absolute Error to measure them. The formula is as follows:
A b s o l u t e E r r o r = i = 1 n V i P r e V i G T ,
where V p r e denotes the prediction of the proposed method, V G T represents the Ground Truth. n denotes the numbers of samples.
By calculating the Absolute Error and summing them up for both methods, the error introduced by incorporating point clouds is 18.736, while using only RGB images results in an error of 27.704. The results indicate that our model outperforms other methods in most cases. With the introduction of point cloud data, the predicted individual-tree volume shows a significant improvement in accuracy compared to using only remote sensing data.
Figure 14 and Figure 15 present the process of these models in calculating individual tree canopy volume. We completed the complete individual-wood canopy volume modelling process by combining the 2D remote sensing images to predict the canopy crown parameters with the point cloud data. By introducing the YOLOTree model, we improved the accuracy of the model for the extraction of tree crown width and the spatial positioning of individual trees. This helps to further accurate volume calculations. Comparing these methods, we can see the computational simplicity of our model as well as the accuracy of the results. This is further evidence of our outstanding contribution to the field of individual-tree canopy volume modelling.

6. Discussion

This study introduced the YOLOTree model, which integrates UAV-RGB imagery and LiDAR point cloud data for more accurate spatial positioning and crown volume calculation of individual trees. Regarding the issue of missing points within tree crowns due to the point cloud LiDAR scans mentioned earlier, we confirmed this through error analysis and experimental validation. Our geometric modeling-based assumption evidently provides volume estimates closer to the Ground Truth of crown volumes compared to direct voxel-based methods. Despite our assumption neglecting internal structural information of the crowns, it appears that such structural loss has a minimal impact on volume accuracy. Therefore, selectively ignoring its structural details in crown volume modeling is feasible, considering the efficiency gains achieved outweigh this loss. Compared to traditional methods based on an individual data source, our model demonstrated significant improvements in accuracy and real-time performance. Particularly, the model effectively enhanced target detection accuracy and robustness in tasks involving individual tree detection in complex forest backgrounds, thanks to the introduction of multi-scale feature fusion and the EMA attention mechanism.
The YOLOTree model holds significant potential for practical applications, especially in forestry resource management [29] and urban greenery monitoring [30]. For instance, accurate canopy volume data can help forestry managers assess forest health and devise more effective tree planting and maintenance plans. Additionally, the methods from this study can support urban planners in designing green spaces by providing data to optimize urban greening structures and improve urban ecological environments. It can provide an effective approach for the accurate calculation of Living Vegetation Volume (LVV) and carbon stock, which contributes to a comprehensive evaluation of the ecological benefits of urban green spaces.
The multi-scale feature fusion strategy proposed in this study, particularly the use of the BiFPN network, offers a new solution for high-precision target detection in complex backgrounds. BiFPN enhances the integration of features at different scales by establishing bidirectional connections between feature maps, which is crucial for improving model performance on trees of various sizes and shapes. Furthermore, the introduction of the EMA attention mechanism further optimized feature expression, enhancing the model’s ability to recognize issues of occlusion and connectivity between individual trees in forests.
Although the YOLOTree model excels in detecting individual trees and calculating their volume, training and optimizing the model still pose some challenges. Firstly, acquiring high-quality point cloud and RGB data requires expensive equipment and complex data preprocessing steps. Future research could explore more economical data collection methods or develop more efficient data-processing algorithms. Additionally, enhancing the model’s generalizability is an important direction for future research, including testing and optimizing the model in different types of forest environments and extending its applicability to other tree species.

7. Conclusions

In this paper, we propose a method that combines two-dimensional RGB remote sensing imagery with three-dimensional point cloud data to address the challenges of canopy volume calculation modeling for Chinese catalpa trees. Meanwhile, we also create and release a new dataset TreeLD for individual-tree canopy detection in remote sensing. This comprehensive resource fills a crucial gap in data support for individual-tree research. Compared to traditional methods, our approach not only simplifies complex computational procedures but also enhances accuracy. In 62.5% of cases, the introduction of point clouds outperforms using solely RGB data, with an accuracy improvement of 30.71%. Compared with traditional method using 2.5D point cloud data only, the proposed method exhibits an improvement of 83.03%. Furthermore, the newly proposed YOLOTree architecture boosts precision in individual-tree canopy extraction by 0.81% and demonstrates superior performance across multiple datasets, solidifying its position as a leading solution. We also conducted downstream applications in the artificial forests of Jiaozuo City with promising results. While achieving the above results, our model provides a good direction for the calculation of canopy volume, which provides a valuable study for the evaluation of ecological benefits of urban forest greening.

Author Contributions

T.L.: Writing—original draft, Methodology. S.R.: Writing—original draft, Formal analysis. W.M.: Data sampling—validation, Experiment supervision, Technical support. Q.S.: Experiment design—execution, Algorithm optimization, Hardware support. Z.C.: Data processing, Experiment. H.Z.: Quantitative analysis, Experiment. J.X.: Visualization, Software. X.W.: Investigation, Experiment. W.G.: Experiment analysis. Q.C.: Data curation, Formal analysis. J.Y.: Supervision, figure—verification, editing. D.W.: Supervision, Writing—review editing. All authors have read and agreed to the published version of the manuscript.

Funding

This research was funded by Fundamental Research Funds for the Central Nonprofit Research Institution of CAF (CAFYBB2022ZB002) and in part by China Scholarship Council (CSC) funded overseas cooperation projects, innovative talents international cooperation training projects, No. 202306260335, and in part by Ministry of Education Humanities and Social Sciences Youth Fund Project, No. 23YJC760149.

Data Availability Statement

Dataset available on request from the authors.

Conflicts of Interest

The authors declare no conflict of interest.

References

  1. Cheng, Y.; Lan, S.; Fan, X.; Tjahjadi, T.; Jin, S.; Cao, L. A dual-branch weakly supervised learning based network for accurate mapping of woody vegetation from remote sensing images. Int. J. Appl. Earth Obs. Geoinf. 2023, 124, 103499. [Google Scholar] [CrossRef]
  2. Xu, S.; Zhou, K.; Sun, Y.; Yun, T. Separation of Wood and Foliage for Trees From Ground Point Clouds Using a Novel Least-Cost Path Model. IEEE J. Sel. Top. Appl. Earth Obs. Remote Sens. 2021, 14, 6414–6425. [Google Scholar] [CrossRef]
  3. de Paula Pires, R.; Olofsson, K.; Persson, H.J.; Lindberg, E.; Holmgren, J. Individual tree detection and estimation of stem attributes with mobile laser scanning along boreal forest roads. ISPRS J. Photogramm. Remote Sens. 2022, 187, 211–224. [Google Scholar] [CrossRef]
  4. Wu, Y.; Yang, H.; Mao, Y. Detection of the Pine Wilt Disease Using a Joint Deep Object Detection Model Based on Drone Remote Sensing Data. Forests 2024, 15, 869. [Google Scholar] [CrossRef]
  5. de Oliveira, L.E.; Yamasaki, T.N.; Janzen, J.G.; Gualtieri, C. Effects of vegetation density on flow, mass exchange and sediment transport in lateral cavities. J. Hydrol. 2024, 632, 130910. [Google Scholar] [CrossRef]
  6. Luo, T.; Gao, W.; Belotserkovsky, A.; Nedzved, A.; Deng, W.; Ye, Q.; Fu, L.; Chen, Q.; Ma, W.; Xu, S. VrsNet—Density map prediction network for individual tree detection and counting from UAV images. Int. J. Appl. Earth Obs. Geoinf. 2024, 131, 103923. [Google Scholar] [CrossRef]
  7. Xu, S.; Sun, X.; Yun, J.; Wang, H. A New Clustering-Based Framework to the Stem Estimation and Growth Fitting of Street Trees From Mobile Laser Scanning Data. IEEE J. Sel. Top. Appl. Earth Obs. Remote Sens. 2020, 13, 3240–3250. [Google Scholar] [CrossRef]
  8. Zhu, X.; Wang, R.; Shi, W.; Liu, X.; Ren, Y.; Xu, S.; Wang, X. Detection of Pine-Wilt-Disease-Affected Trees Based on Improved YOLO v7. Forests 2024, 15, 691. [Google Scholar] [CrossRef]
  9. Girshick, R.; Donahue, J.; Darrell, T.; Malik, J. Rich feature hierarchies for accurate object detection and semantic segmentation. arXiv 2014, arXiv:1311.2524. [Google Scholar]
  10. Ren, S.; He, K.; Girshick, R.; Sun, J. Faster R-CNN: Towards Real-Time Object Detection with Region Proposal Networks. arXiv 2016, arXiv:1506.01497. [Google Scholar] [CrossRef]
  11. Redmon, J.; Divvala, S.; Girshick, R.; Farhadi, A. You Only Look Once: Unified, Real-Time Object Detection. arXiv 2016, arXiv:1506.02640. [Google Scholar]
  12. Redmon, J.; Farhadi, A. YOLOv3: An Incremental Improvement. arXiv 2018, arXiv:1804.02767. [Google Scholar]
  13. Bochkovskiy, A.; Wang, C.Y.; Liao, H.Y.M. YOLOv4: Optimal Speed and Accuracy of Object Detection. arXiv 2020, arXiv:2004.10934. [Google Scholar]
  14. Wang, C.Y.; Bochkovskiy, A.; Liao, H.Y.M. YOLOv7: Trainable bag-of-freebies sets new state-of-the-art for real-time object detectors. arXiv 2022, arXiv:2207.02696. [Google Scholar]
  15. Wang, C.Y.; Yeh, I.H.; Liao, H.Y.M. YOLOv9: Learning What You Want to Learn Using Programmable Gradient Information. arXiv 2024, arXiv:2402.13616. [Google Scholar]
  16. Yuan, W.; Gu, X.; Dai, Z.; Zhu, S.; Tan, P. NeW CRFs: Neural Window Fully-connected CRFs for Monocular Depth Estimation. arXiv 2022, arXiv:2203.01502. [Google Scholar]
  17. Charles, R.Q.; Su, H.; Kaichun, M.; Guibas, L.J. PointNet: Deep Learning on Point Sets for 3D Classification and Segmentation. In Proceedings of the 2017 IEEE Conference on Computer Vision and Pattern Recognition (CVPR), Honolulu, HI, USA, 21–26 July 2017; pp. 77–85. [Google Scholar] [CrossRef]
  18. Fu, L.; Zhang, D.; Ye, Q. Recurrent Thrifty Attention Network for Remote Sensing Scene Recognition. IEEE Trans. Geosci. Remote Sens. 2021, 59, 8257–8268. [Google Scholar] [CrossRef]
  19. Yu, Y.; Fu, L.; Cheng, Y.; Ye, Q. Multi-view distance metric learning via independent and shared feature subspace with applications to face and forest fire recognition, and remote sensing classification. Knowl.-Based Syst. 2022, 243, 108350. [Google Scholar] [CrossRef]
  20. Wen, C.; Sun, X.; Li, J.; Wang, C.; Guo, Y.; Habib, A. A deep learning framework for road marking extraction, classification and completion from mobile laser scanning point clouds. ISPRS J. Photogramm. Remote Sens. 2019, 147, 178–192. [Google Scholar] [CrossRef]
  21. Xu, S.; Wang, R.; Zheng, H. Road Curb Extraction From Mobile LiDAR Point Clouds. IEEE Trans. Geosci. Remote Sens. 2017, 55, 996–1009. [Google Scholar] [CrossRef]
  22. Meng, X.; Wang, T.; Cheng, D.; Su, W.; Yao, P.; Ma, X.; He, M. Enhanced Point Cloud Slicing Method for Volume Calculation of Large Irregular Bodies: Validation in Open-Pit Mining. Remote Sens. 2023, 15, 5006. [Google Scholar] [CrossRef]
  23. Maturana, D.; Scherer, S. VoxNet: A 3D Convolutional Neural Network for real-time object recognition. In Proceedings of the 2015 IEEE/RSJ International Conference on Intelligent Robots and Systems (IROS), Hamburg, Germany, 28 September–2 October 2015; pp. 922–928. [Google Scholar] [CrossRef]
  24. Chang, A.X.; Funkhouser, T.; Guibas, L.; Hanrahan, P.; Huang, Q.; Li, Z.; Savarese, S.; Savva, M.; Song, S.; Su, H.; et al. ShapeNet: An Information-Rich 3D Model Repository. arXiv 2015, arXiv:1512.03012. [Google Scholar]
  25. Tan, M.; Pang, R.; Le, Q.V. EfficientDet: Scalable and Efficient Object Detection. arXiv 2020, arXiv:1911.09070. [Google Scholar]
  26. Ouyang, D.; He, S.; Zhang, G.; Luo, M.; Guo, H.; Zhan, J.; Huang, Z. Efficient Multi-Scale Attention Module with Cross-Spatial Learning. In Proceedings of the ICASSP 2023—2023 IEEE International Conference on Acoustics, Speech and Signal Processing (ICASSP), Rhodes Island, Greece, 4–10 June 2023; IEEE: Piscataway, NJ, USA, 2023. [Google Scholar] [CrossRef]
  27. Moorthy, I.; Miller, J.R.; Hu, B.; Jimenez Berni, J.A.; Zarco-Tejada, P.J.; Li, Q. Extracting tree crown properties from ground-based scanning laser data. In Proceedings of the 2007 IEEE International Geoscience and Remote Sensing Symposium, Barcelona, Spain, 23–28 July 2007; pp. 2830–2832. [Google Scholar] [CrossRef]
  28. Hao, W.; Li, Y.; Xie Hong Wei, P.D.; Gao, J.; Zhao Zhang, R. A Voxel-Based Multiview Point Cloud Refinement Method via Factor Graph Optimization. In Proceedings of the Pattern Recognition and Computer Vision 2023, Xiamen, China, 13–15 October 2023; pp. 234–245. [Google Scholar]
  29. Yun, T.; Li, J.; Ma, L.; Zhou, J.; Wang, R.; Eichhorn, M.P.; Zhang, H. Status, advancements and prospects of deep learning methods applied in forest studies. Int. J. Appl. Earth Obs. Geoinf. 2024, 131, 103938. [Google Scholar] [CrossRef]
  30. Wang, Q.; Hu, C.; Wang, H.; Wang, R.; Xie, Y.; Zhao, Y. Semantic segmentation of urban land classes using a multi-scale dataset. Int. J. Remote Sens. 2024, 45, 653–675. [Google Scholar] [CrossRef]
Figure 1. Study area ( 34 ° 53 59.9905 N, 113 ° 09 00.0057 E).
Forests 15 01375 g001
Figure 2. Flowchart of our work.
Forests 15 01375 g002
Figure 3. Flowchart of Crown Extractor.
Forests 15 01375 g003
Figure 4. Steps of Spatial Correlation.
Forests 15 01375 g004
Figure 5. The structure of YOLOv8.
Forests 15 01375 g005
Figure 6. The structure of proposed YOLOTree.
Forests 15 01375 g006
Figure 7. The flowchart of proposed method. (a) Represents the flowchart of C2F_EMA module, (b) Represents the details of the EMA mechanism.
Forests 15 01375 g007
Figure 8. The flowchart of parallel convolutions. The left figure is a sequence diagram, and the right figure is a flowchart of parallel convolutions.
Forests 15 01375 g008
Figure 9. Parameter iteration analysis.
Forests 15 01375 g009
Figure 10. Visual Comparison Results of YOLOTree with YOLOv9 and v8. (a) Represents the original input RGB image, (b) Visualization results, left for other models, right for YOLOTree, (c) Visualization results details of other models, (d) YOLOTree results details.
Forests 15 01375 g010
Figure 11. Visual Comparison Results of YOLOTree with YOLOv7 and v3. (a) Represents the original input RGB image, (b) Visualization results, left for other models, right for YOLOTree, (c) Visualization results details of other models, (d) YOLOTree results details.
Forests 15 01375 g011
Figure 12. The Modeling of canopy volume. (a) Represents a semi-ellipsoidal shape. (b) Represents an elliptical cone. In these figures, a , b , c represent the major axis, minor axis, and height of the tree canopy respectively.
Forests 15 01375 g012
Figure 13. Error Analyze. (a) represents the coarse granularity Octree. (b) represents the fine granularity Octree. The red circles are used to highlight the details of the error.
Forests 15 01375 g013
Figure 14. Visualisation of canopy volume calculation in Sample area 1. (a) UAV-RGB imagery, with red boxes predicted by YOLOTree. (b) the captured canopy projection map. (c) the 2.5D projection map with colours reflecting height changes. (d) coarse-grained octree voxel map. (e) a fine-grained octree sketch.
Forests 15 01375 g014
Figure 15. Visualisation of canopy volume calculation in Sample area 2. (a) UAV-RGB imagery, with red boxes predicted by YOLOTree. (b) the captured canopy projection map. (c) the 2.5D projection map with colours reflecting height changes. (d) coarse-grained octree voxel map. (e) a fine-grained octree sketch.
Forests 15 01375 g015
Table 1. Quantitative Comparison of YOLO Series Models on Three Datasets.
ModelDatasetPrecision/% Recall/% mAP50/% mAP50-95/%
YOLOv3TreeLD88.7792.8293.2346.60
YOLOv5 90.4491.7895.5851.95
YOLOv7 89.8490.894.7349.91
YOLOv8 89.7191.2295.3352.93
YOLOv9 90.1390.3295.0453.96
Faster-RCNN 83.9494.9683.94/
YOLOTree(ours) 90.5291.1495.5352.84
YOLOv3CarPK97.3494.3197.6568.64
YOLOv5 98.2795.7598.5068.20
YOLOv7 98.4196.6599.3670.76
YOLOv8 98.9897.6999.3881.35
YOLOv9 98.7398.2799.4083.04
Faster-RCNN 88.9691.7792.03/
YOLOTree(ours) 98.9398.3599.2283.13
YOLOv5VisDrone34.0734.0732.6617.81
YOLOv8 43.2931.7031.8318.37
YOLOv9 55.1342.6544.5327.13
YOLOTree(ours) 44.0832.0032.1118.59
Note: Bold font indicates the best performance metrics.
Table 2. Ablation study on TreeLD.
ModelE_neckE_detectE_backboneBiFPNPrecision/% Recall/% mAP50/% mAP50-95/% Parameters/MbGFLOPs
YOLOv8n 89.891.4 95.352.93.08.1
YOLOv8s 90.591.095.653.211.128.4
YOLOv8m 89.991.495.453.225.878.7
YOLOv8n 89.791.295.352.93.08.3
YOLOv8s 89.690.995.152.811.229.3
YOLOv8n 89.591.095.052.53.08.2
YOLOv8n 90.590.595.352.73.08.4
YOLOTree 90.591.195.552.83.08.4
Note: Bold font indicates the best performance metrics.
Table 3. Calculation table for volume of individual tree.
TreeV(2.5D)V(Left)V(Right)V(GT)V(Ours)V(rs)
146.64336.41614.70425.5628.4227.68
220.56617.0246.77611.99.536.37
338.4326.68811.30418.99620.8814.93
431.49922.089.25615.66819.4712.84
526.58319.5847.70413.64415.1612.44
618.41712.8645.4889.17613.6715.04
730.5122.089.43215.75614.8510.32
820.57314.8486.10410.47611.389.02
Note: Bold font indicates the best performance metrics.
Disclaimer/Publisher’s Note: The statements, opinions and data contained in all publications are solely those of the individual author(s) and contributor(s) and not of MDPI and/or the editor(s). MDPI and/or the editor(s) disclaim responsibility for any injury to people or property resulting from any ideas, methods, instructions or products referred to in the content.

