
Effects of Mixing Hippophae rhamnoides and Pinus tabuliformis on Ecosystem Carbon, Nitrogen, and Phosphorus Sequestration and Storage Capacity in the Loess Hilly Region, China

Abstract
:1. Introduction
2. Materials and Methods
2.1. Site Description
2.2. Experimental Material
2.3. Sampling and Laboratory Analyses
2.4. Data Processing
2.4.1. Biomass of the Tree Layer
2.4.2. C, N, P Stocks and Sequestration Rate
2.5. Statistical Analysis
3. Results
3.1. The Tree Biomass
3.2. C, N, and P Contents
3.2.1. Tree and Litter Layers
3.2.2. Soil Layer
3.3. Effects of Mixed Afforestation on C, N, and P Stocks
3.3.1. Tree Layer
3.3.2. Litter Layer
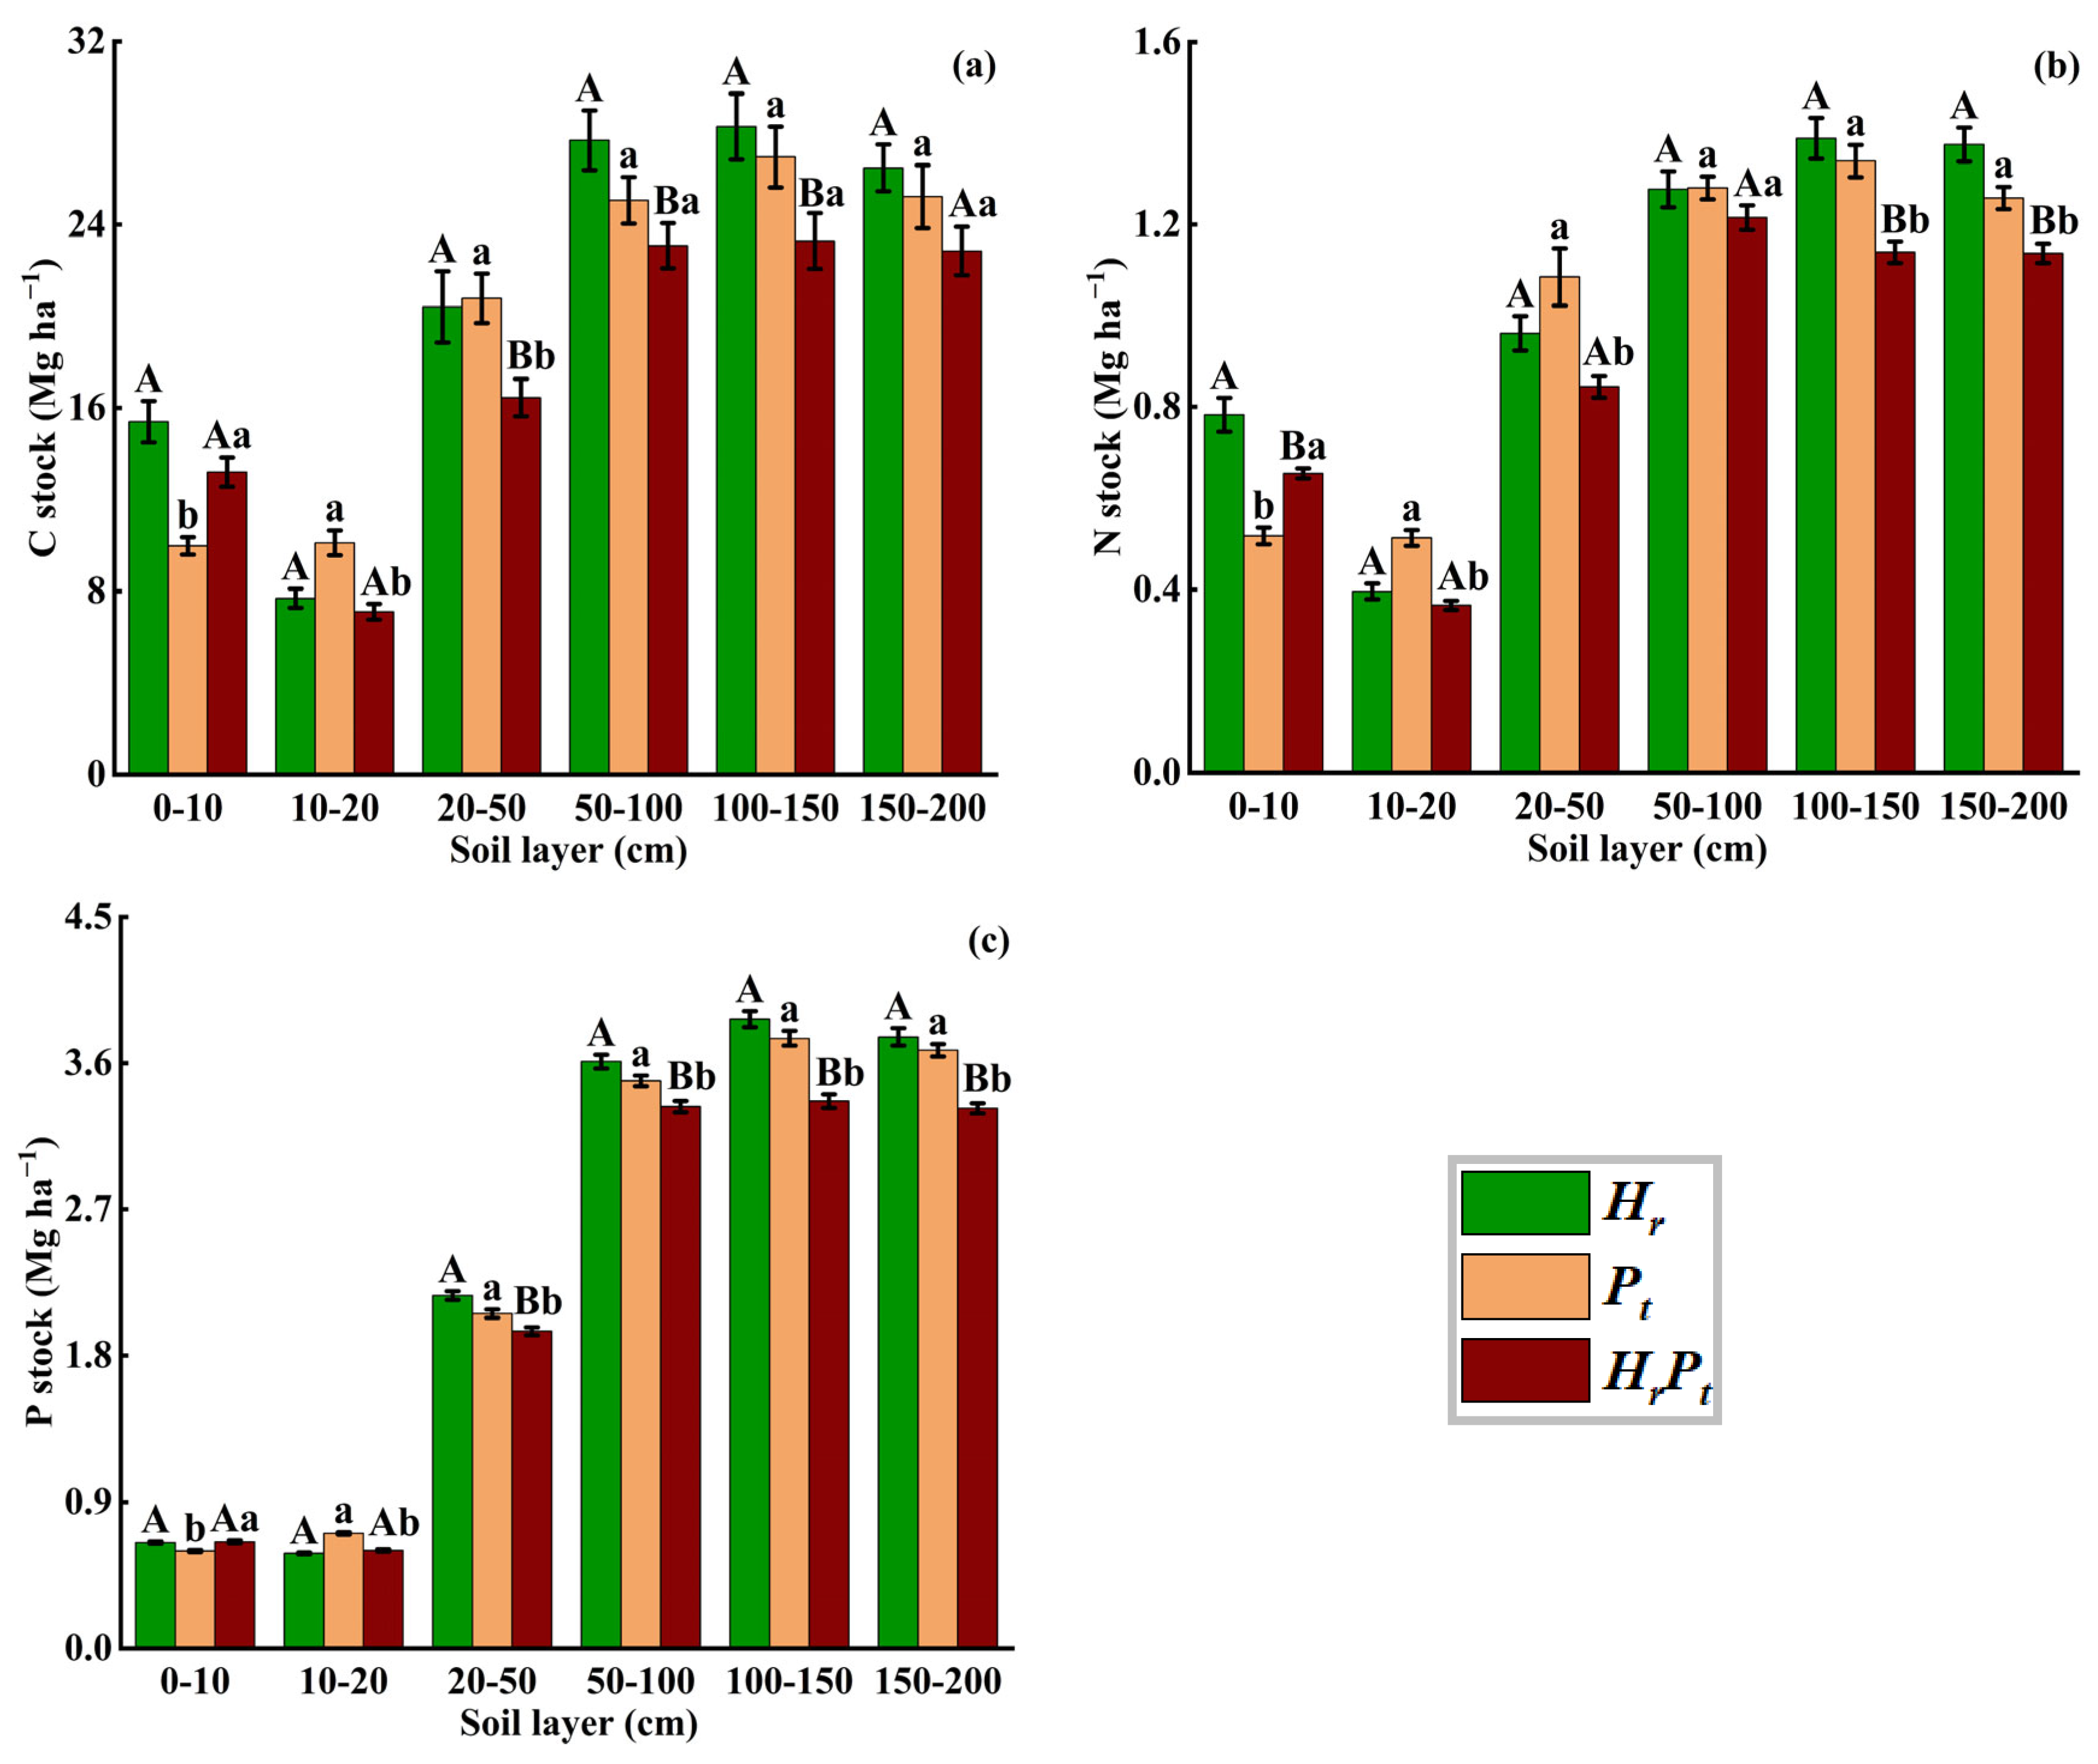
3.3.3. Soil Layer
3.3.4. C, N, and P Stocks and Distribution Patterns in the Plantation Ecosystem
3.4. Factors Correlated with the C, N, and P Stocks, and the Relationships of C, N, and P in Stocks
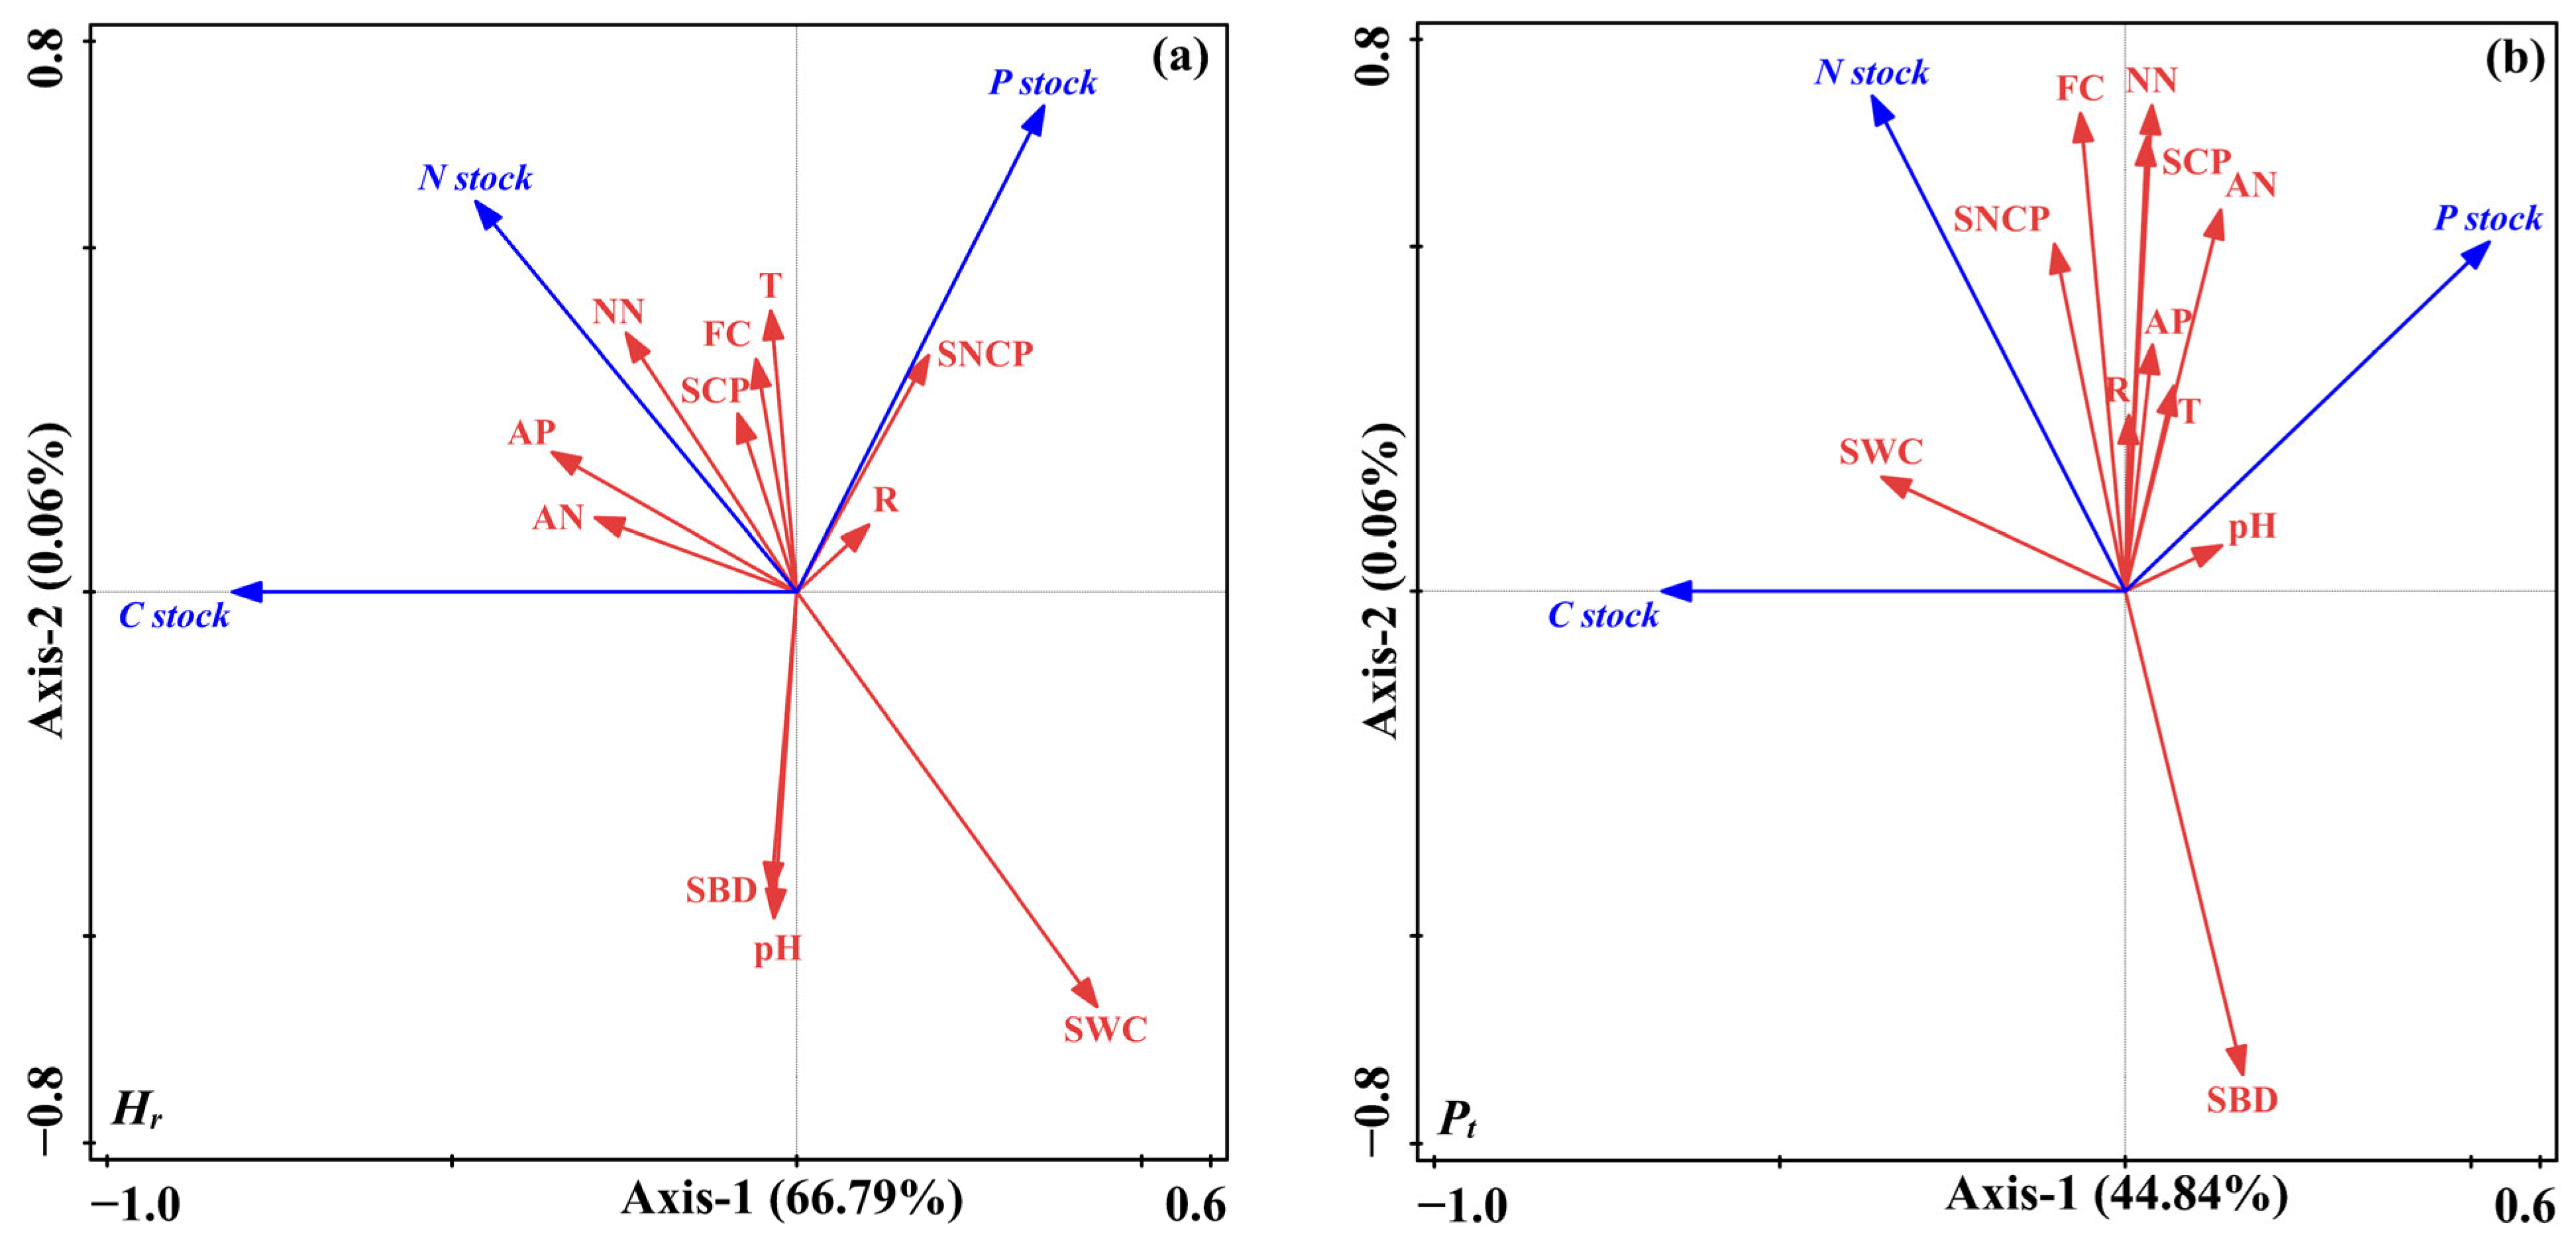
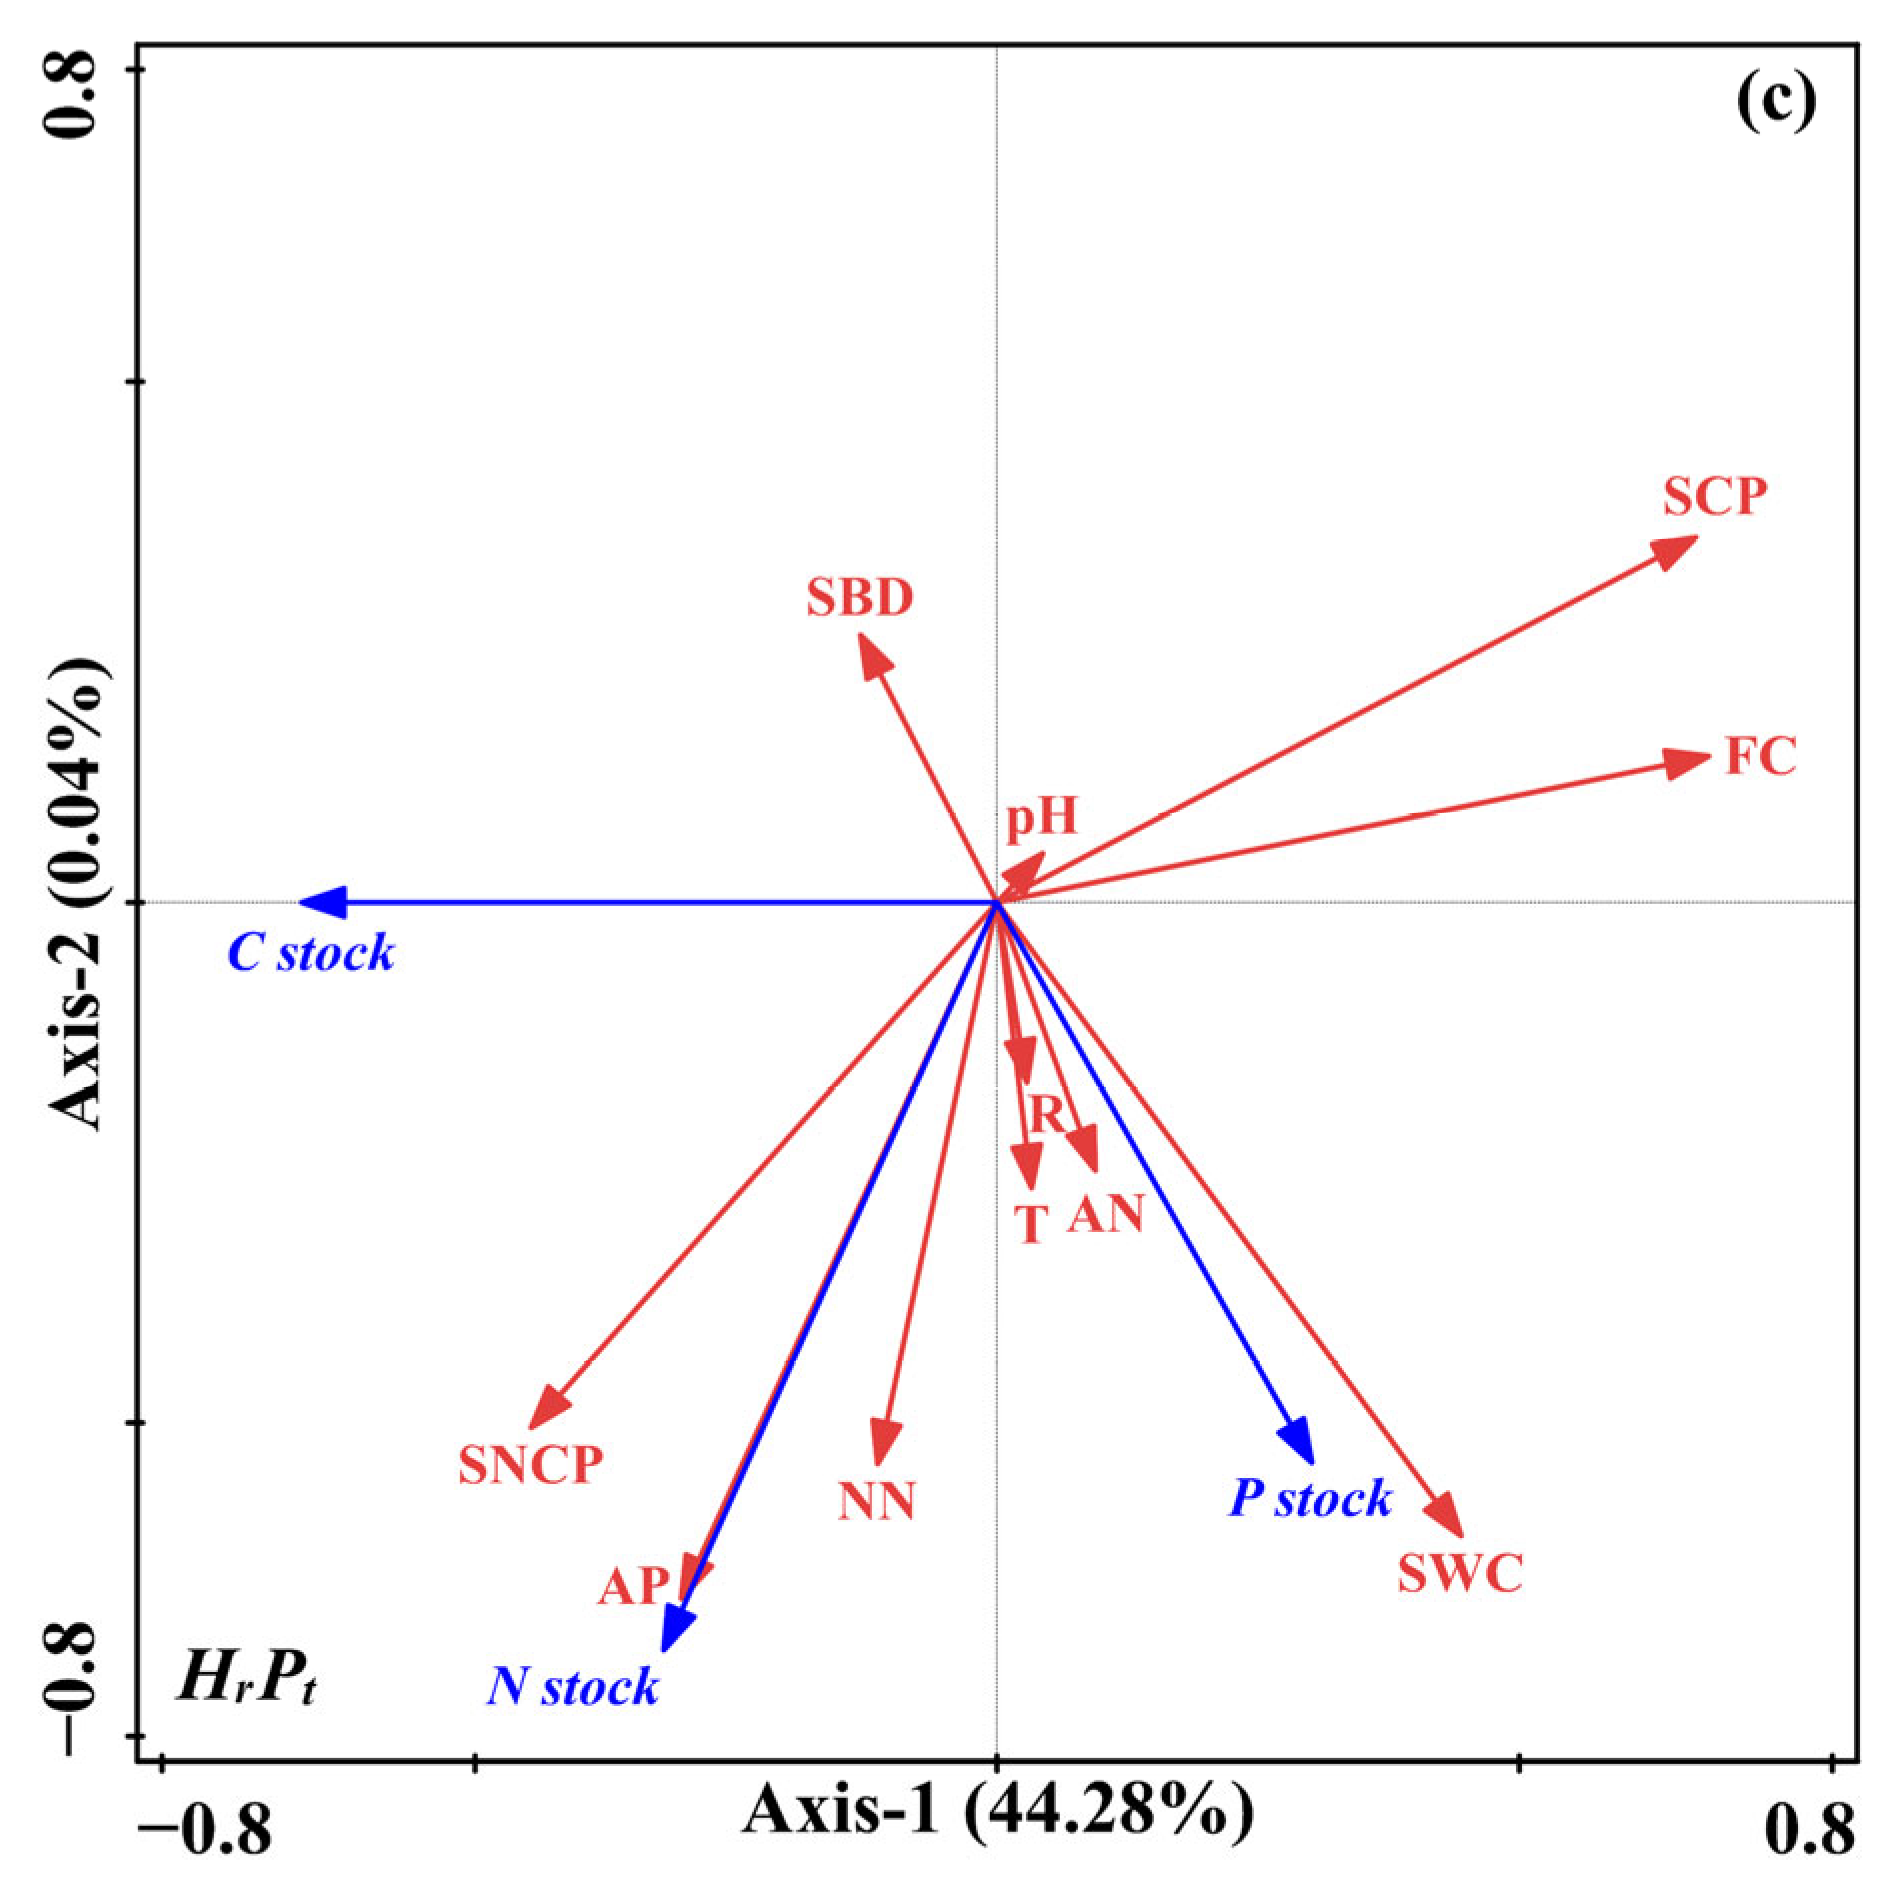
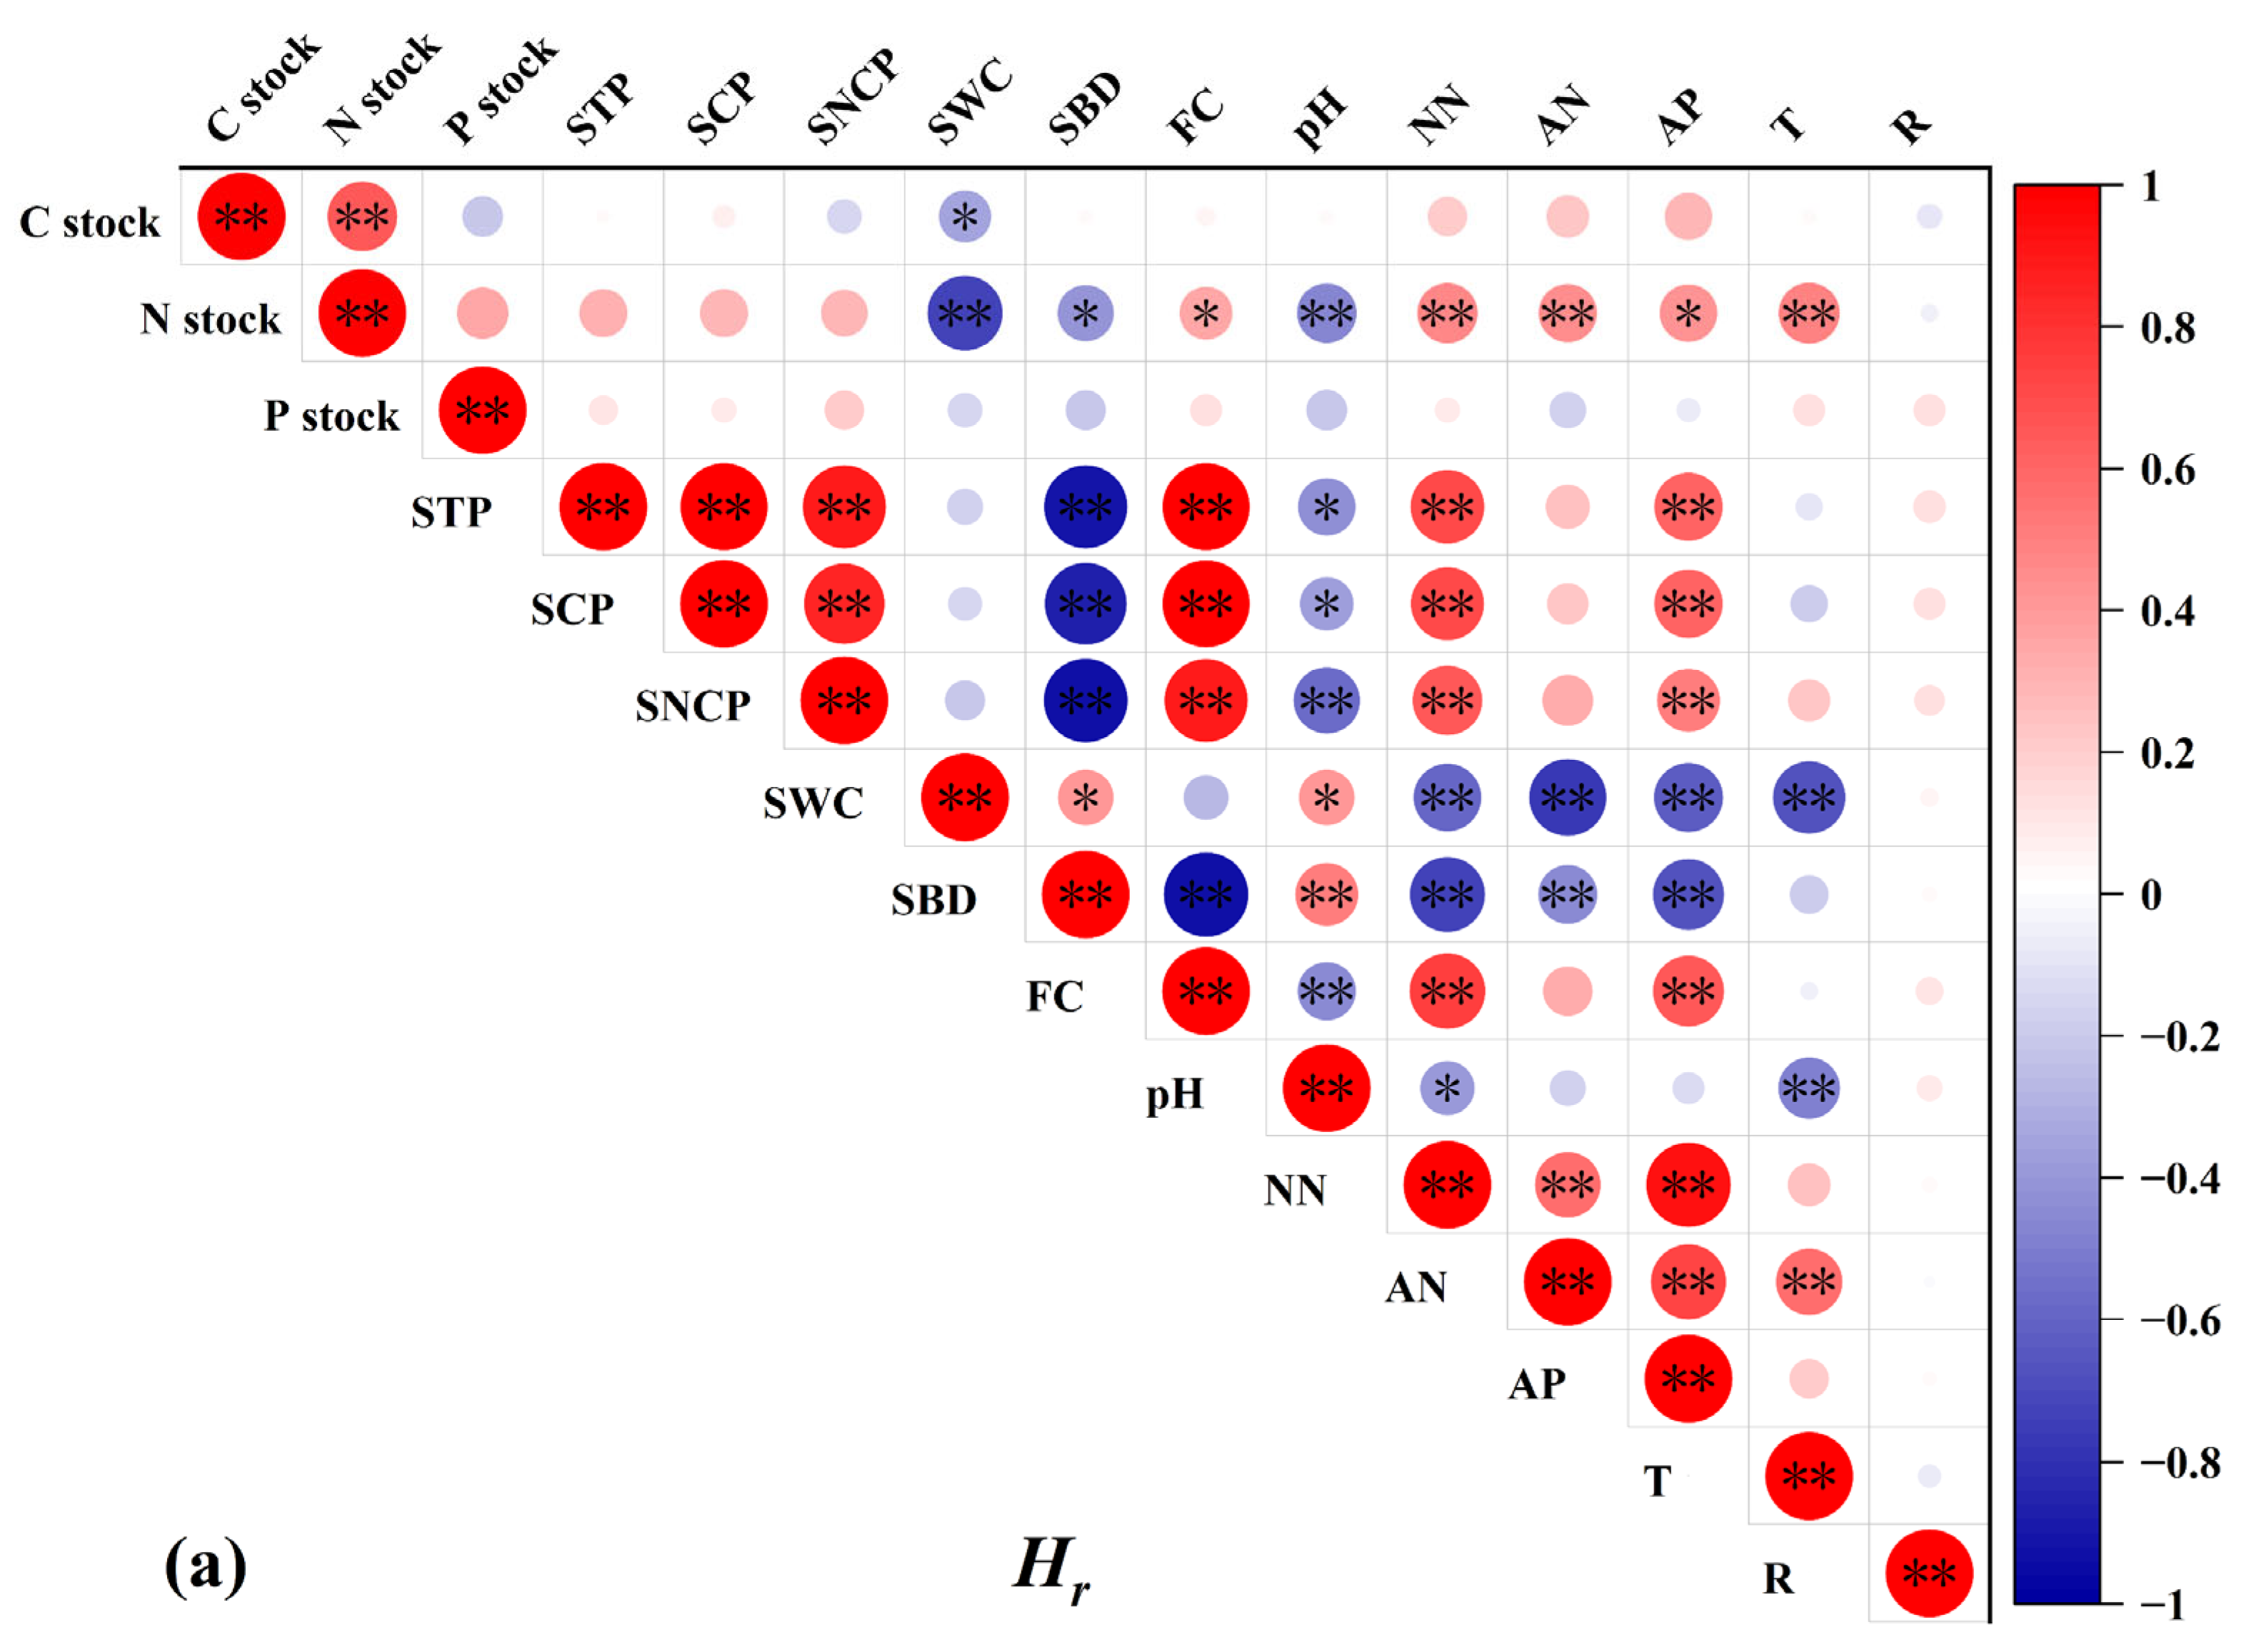
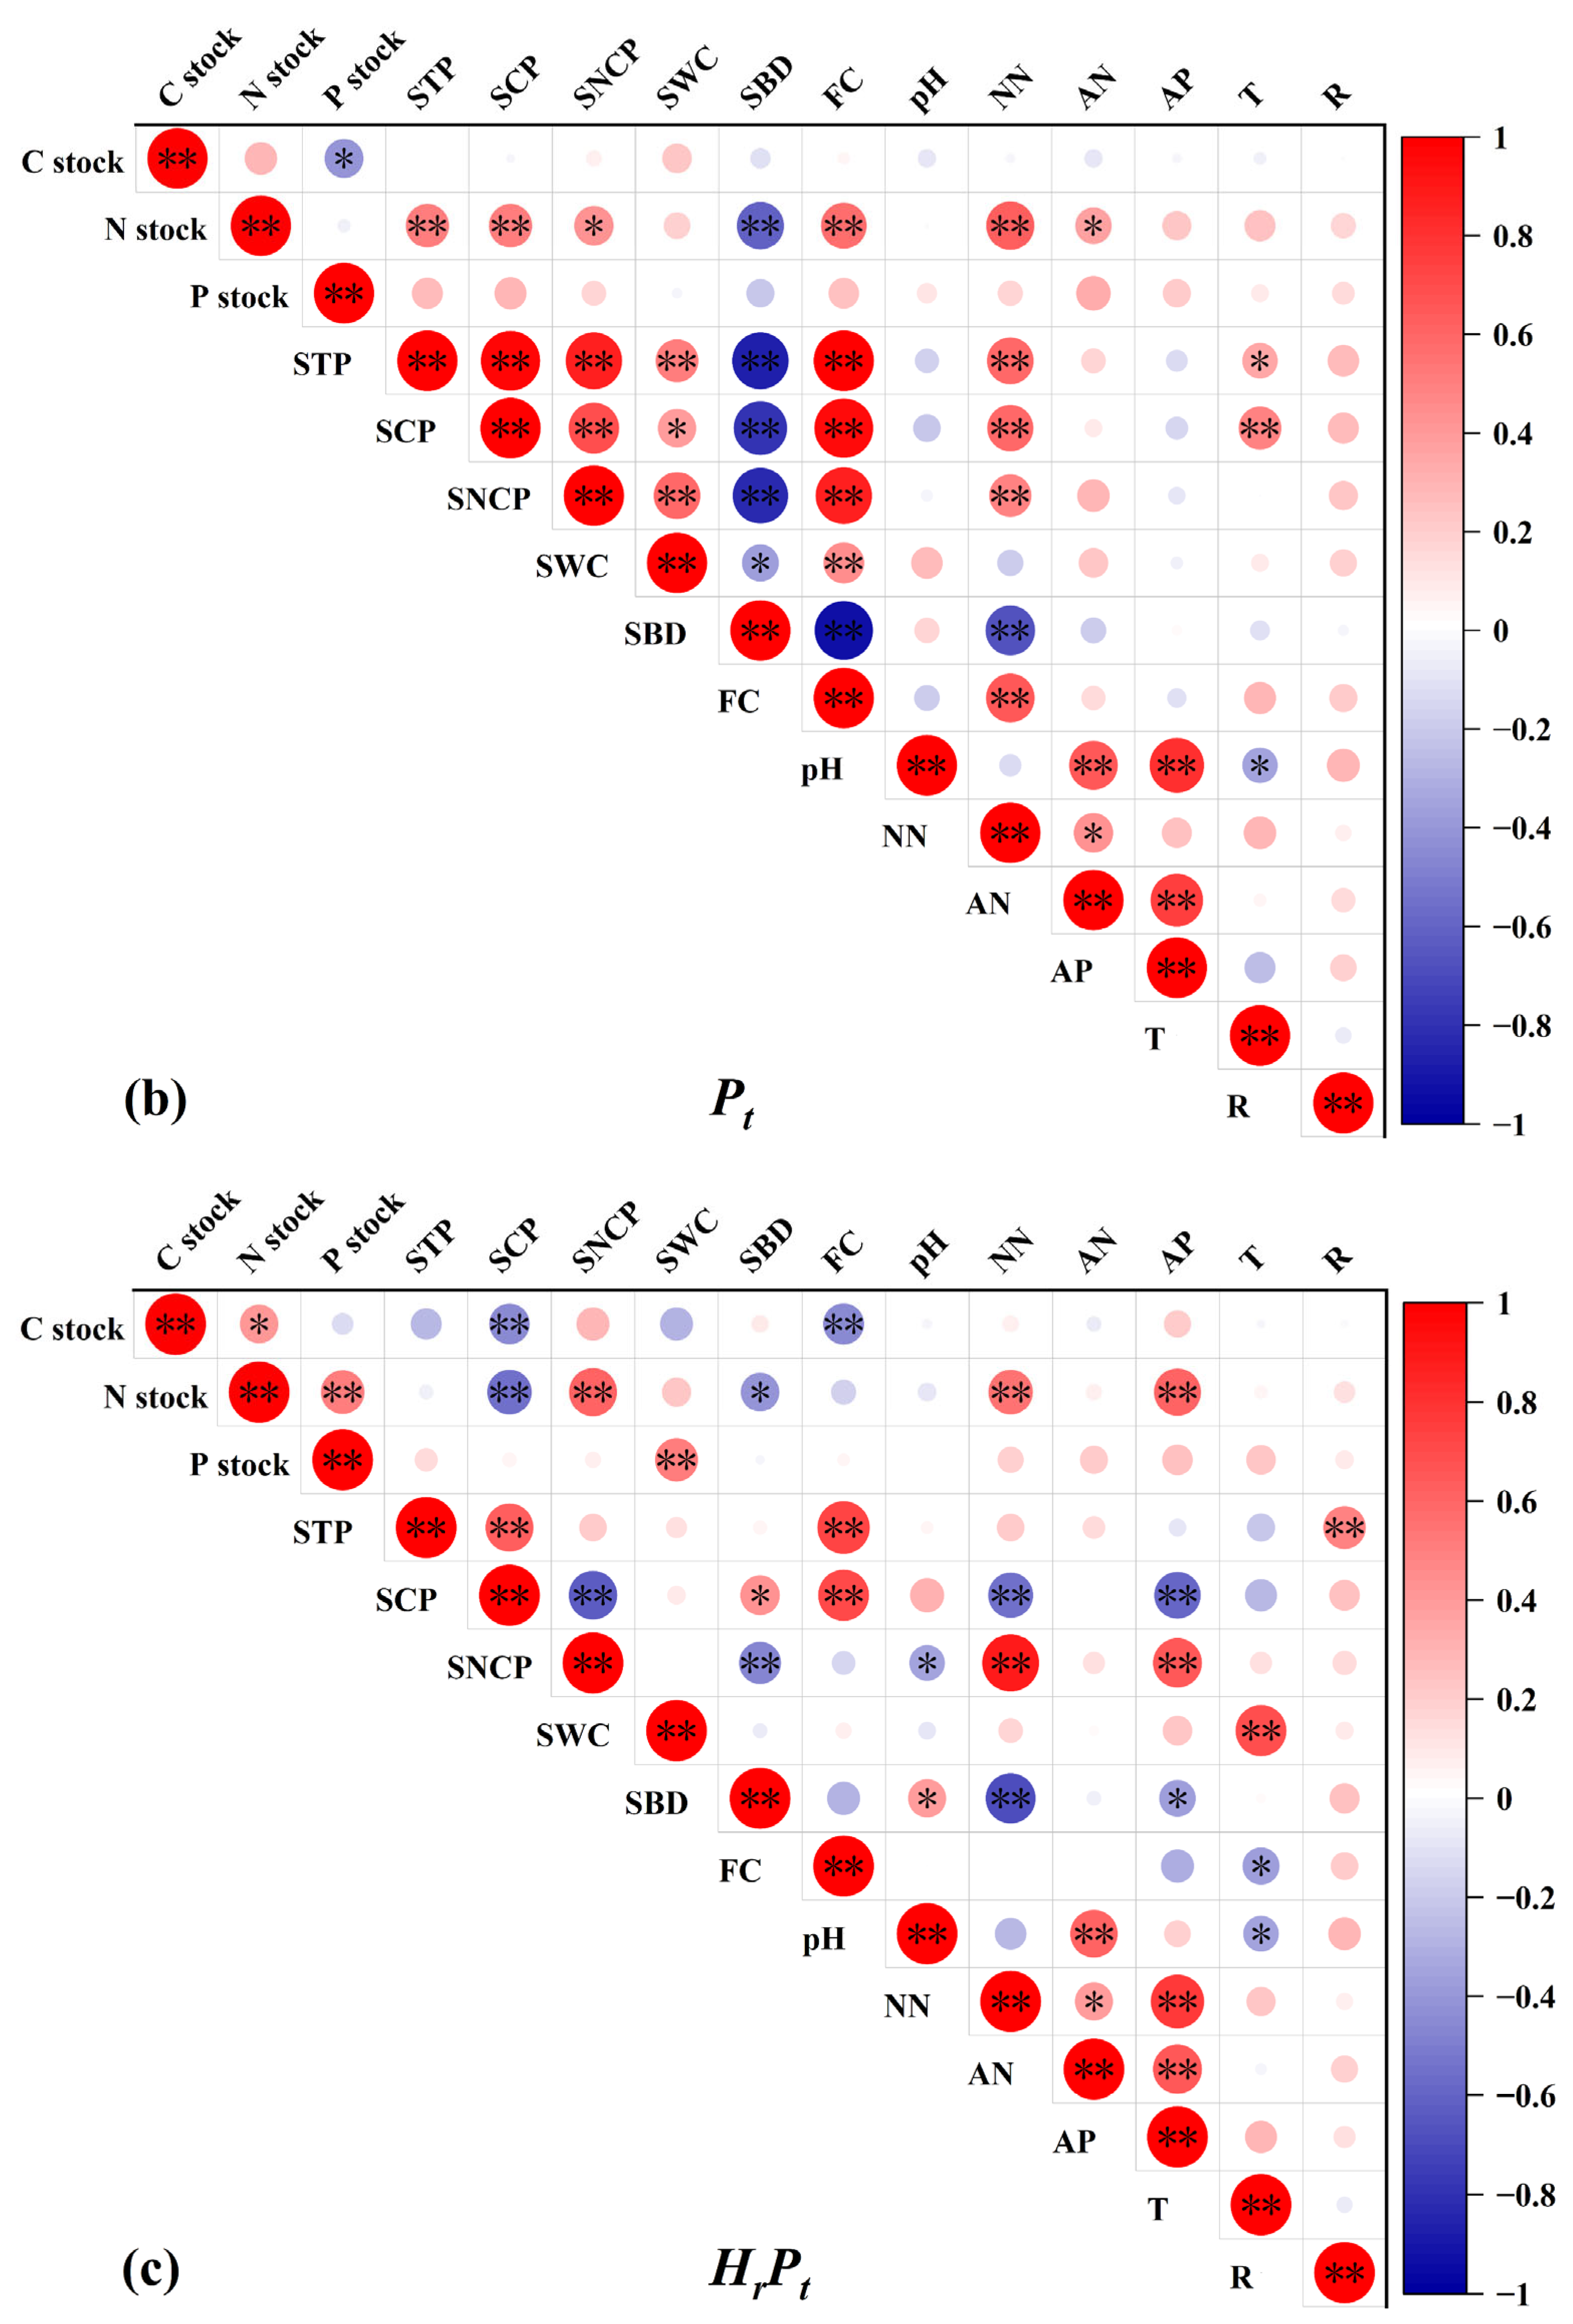
3.4.1. Relationships of C, N, and P in Stocks and Soil Physicochemical Properties
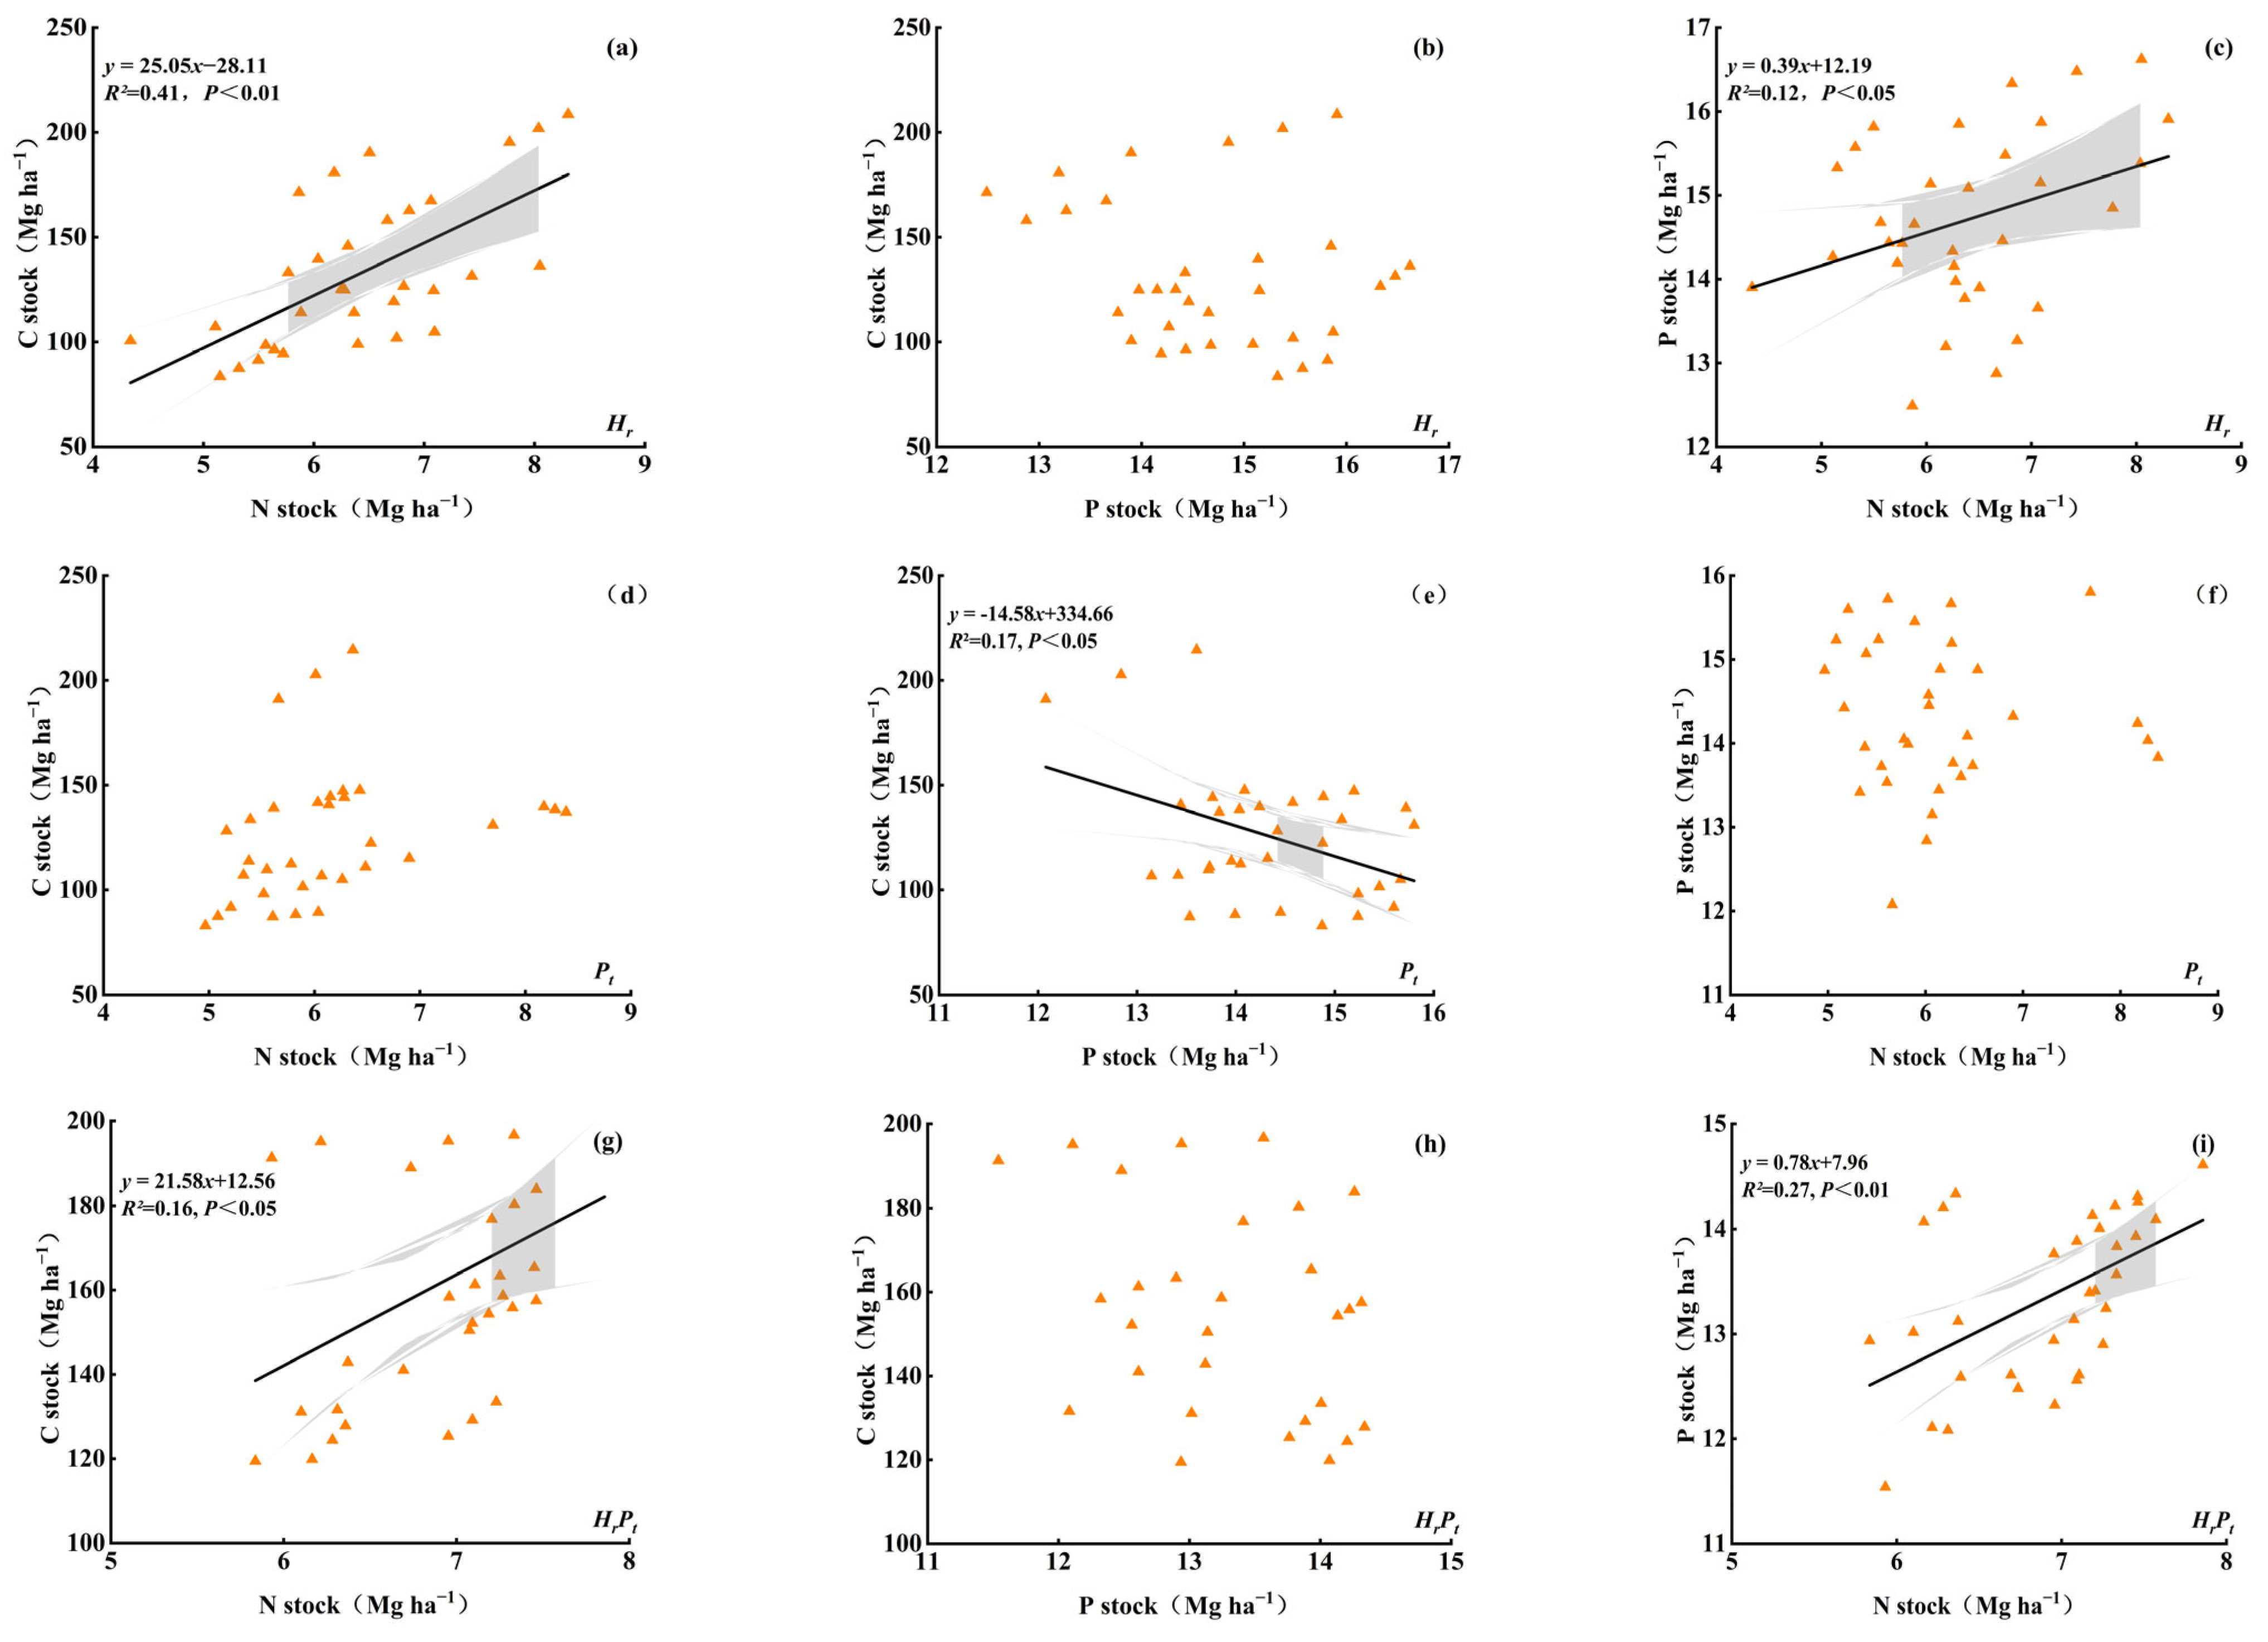
3.4.2. Regression Relationships of C, N, and P in Stocks
3.5. C, N, and P Sequestration Rate
4. Discussion
4.1. Effects of Mixed Afforestation on C, N, and P Stocks
4.2. Effects of Mixed Afforestation on C, N, and P Stocks Distribution Pattern
4.3. Factors Controlling C, N, and P Stocks after Mixed Afforestation
4.4. Effects of Mixed Afforestation on C, N, and P Sequestration Rate
5. Conclusions
Author Contributions
Funding
Data Availability Statement
Conflicts of Interest
References
- Cai, Y.; Chang, S.X. Disturbance Effects on Soil Carbon and Greenhouse Gas Emissions in Forest Ecosystems. Forests 2020, 11, 297. [Google Scholar] [CrossRef]
- Yu, S.; Yang, J.; Norghauer, J.M.; Yang, J.; Yang, B.; Zhang, H.; Li, X. Soil Carbon and Nitrogen Stocks and Their Influencing Factors in Different-Aged Stands of Sand-Fixing Caragana korshinskii in the Mu Us Desert of Northwest China. Forests 2024, 15, 1018. [Google Scholar] [CrossRef]
- Nolander, C.; Lundmark, R. A Review of Forest Ecosystem Services and Their Spatial Value Characteristics. Forests 2024, 15, 919. [Google Scholar] [CrossRef]
- Lu, S.B.; Chen, Y.M.; Sardans, J.; Pen, J.S. Ecological stoichiometric comparison of plant-litter-soil system in mixed-species and monoculture plantations of Robinia pseudoacacia, Amygdalus davidiana, and Armeniaca sibirica in the Loess Hilly Region of China. For. Ecosyst. 2023, 10, 14. [Google Scholar] [CrossRef]
- Voigtlaender, M.; Brandani, C.B.; Caldeira, D.R.M.; Tardy, F.; Bouillet, J.P.; Gonçalves, J.L.M.; Moreira, M.Z.; Leite, F.P.; Brunet, D.; Paula, R.R.; et al. Nitrogen cycling in monospecific and mixed-species plantations of Acacia mangium and Eucalyptus at 4 sites in Brazil. For. Ecol. Manag. 2019, 436, 56–67. [Google Scholar] [CrossRef]
- Deng, L.; Shangguan, Z.P. Afforestation Drives Soil Carbon and Nitrogen Changes in China. Land Degrad. Dev. 2017, 28, 151–165. [Google Scholar] [CrossRef]
- Ji, Y.R.; Zhang, P.; Shen, H.L. Competition intensity affects growing season nutrient dynamics in Korean pine trees and their microhabitat soil in mixed forest. For. Ecol. Manag. 2023, 539, 15. [Google Scholar] [CrossRef]
- Yan, J.; Huang, X.; Su, X.; Zhang, W.; Gao, G.; You, Y. Introducing N2-Fixing Tree Species into Eucalyptus Plantation in Subtropical China Alleviated Carbon and Nitrogen Constraints within Soil Aggregates. Forests 2022, 13, 2102. [Google Scholar] [CrossRef]
- Wang, S.; Fan, J.; Ge, J.M.; Wang, Q.M.; Fu, W. Discrepancy in tree transpiration of Salix matsudana, Populus simonii under distinct soil, topography conditions in an ecological rehabilitation area on the Northern Loess Plateau. For. Ecol. Manag. 2019, 432, 675–685. [Google Scholar] [CrossRef]
- Nickmans, H.; Collet, C.; Bonal, D.; Verheyen, K.; Ponette, Q. Tree size and local neighbourhood affect foliar nutrient content in a mixed plantation of beech (Fagus sylvatica) and maple (Acer pseudoplatanus). For. Ecol. Manag. 2017, 400, 159–172. [Google Scholar] [CrossRef]
- Wu, X.; Niu, Y.B.; Xun, M.Y.; Jin, J.Y.; Tang, Y.K.; Chen, Y.M. Soil Carbon, Nitrogen, and Phosphorus Storages and Their Stoichiometry Due to Mixed Afforestation with Hippophae rhamnoides in the Loess Hilly Region, China. Forests 2021, 12, 1718. [Google Scholar] [CrossRef]
- Zhang, J.-T.; Chen, T. Effects of mixed Hippophae rhamnoides on community and soil in planted forests in the Eastern Loess Plateau, China. Ecol. Eng. 2007, 31, 115–121. [Google Scholar] [CrossRef]
- Wu, X.; Niu, Y.B.; Chen, Y.M.; Dong, C.G.; Qiao, Y.N. Carbon, Nitrogen and Phosphorus Stoichiometry Characteristies in Leaf, Litter and Soil at Mixed Forests of Hippophae rhamnoides in the Loess Hilly Region of China. J. Soil Water Conserv. 2021, 35, 8. (In Chinese) [Google Scholar] [CrossRef]
- Li, Z.W.; Zhang, G.H.; Geng, R.; Wang, H.; Zhang, X.C. Land use impacts on soil detachment capacity by overland flow in the Loess Plateau, China. Catena 2015, 124, 9–17. [Google Scholar] [CrossRef]
- Geng, Z.C.; Jia, H.T. Soil Science, 2nd ed.; Science Press: Beijing, China, 2020. [Google Scholar]
- Smal, H.; Ligęza, S.; Pranagal, J.; Urban, D.; Pietruczyk-Popławska, D. Changes in the stocks of soil organic carbon, total nitrogen and phosphorus following. For. Ecol. Manag. 2019, 451, 12. [Google Scholar] [CrossRef]
- Liu, Y.C.; Wang, Q.F.; Yu, G.R.; Zhu, X.J.; Hu, Z.M. Ecosystems carbon storage and carbon sequestration potential of two main tree species for the Grain for Green Project on China’s hilly Loess Plateau. Acta Ecol. Sin. 2011, 31, 4277–4286. (In Chinese) [Google Scholar] [CrossRef]
- Ai, Z.M.; Chen, Y.M.; Cao, Y. Storage and allocation of carbon and nitrogen in Robinia pseudoacacia plantation at different ages in the loess hilly region, China. Chin. J. Appl. Ecol. 2014, 25, 333–341. [Google Scholar] [CrossRef]
- El-Hussieny, S.A.; Ismail, I.M. Role of Avicennia marina (Forssk.) Vierh. of south Sinai, Egypt in atmospheric CO2 sequestration. Int. J. Sci. Res 2015, 6, 1935–1946. [Google Scholar]
- You, Y.M.; Huang, X.M.; Zhu, H.G.; Liu, S.R.; Liang, H.W.; Wen, Y.G.; Wang, H.; Cai, D.X.; Ye, D. Positive interactions between Pinus massoniana and Castanopsis hystrix species in the uneven-aged mixed plantations can produce more ecosystem carbon in subtropical China. For. Ecol. Manag. 2018, 410, 193–200. [Google Scholar] [CrossRef]
- Feng, Y.H.; Schmid, B.; Loreau, M.; Forrester, D.; Fei, S.L.; Zhu, J.X.; Tang, Z.Y.; Zhu, J.L.; Hong, P.B.; Ji, C.J.; et al. Multispecies forest plantations outyield monocultures across a broad range of conditions. Science 2022, 376, 865–868. [Google Scholar] [CrossRef] [PubMed]
- Li, X.W.; Sun, K.; Li, F.Y. Variation in leaf nitrogen and phosphorus stoichiometry in the nitrogen-fixing Chinese sea-buckthorn (Hippophae rhamnoides L. subsp sinensis Rousi) across northern China. Ecol. Res. 2014, 29, 723–731. [Google Scholar] [CrossRef]
- Jiang, P.P.; Cao, Y.; Chen, Y.M.; Zhao, Y.P. N and P stoichiometric characteristics of leaves, litter, and soil for three dominant tree species in the Shaanxi Province. Acta Ecol. Sin. 2017, 37, 443–454. (In Chinese) [Google Scholar] [CrossRef]
- Fang, X.M.; Zhang, X.L.; Zong, Y.Y.; Zhang, Y.; Wan, S.Z.; Bu, W.S.; Chen, F.S. Soil phosphorus functional fractions and tree tissue nutrient concentrations influenced by stand density in subtropical Chinese fir plantation forests. PLoS ONE 2017, 12, 17. [Google Scholar] [CrossRef] [PubMed]
- Rog, I.; Tague, C.; Jakoby, G.; Megidish, S.; Yaakobi, A.; Wagner, Y.; Klein, T. Interspecific Soil Water Partitioning as a Driver of Increased Productivity in a Diverse Mixed Mediterranean Forest. J. Geophys. Res. Biogeosci. 2021, 126, 22. [Google Scholar] [CrossRef]
- Rog, I.; Hilman, B.; Fox, H.; Yalin, D.; Qubaja, R.; Klein, T. Increased belowground tree carbon allocation in a mature mixed forest in a dry versus a wet year. Glob. Change Biol. 2024, 30, 15. [Google Scholar] [CrossRef] [PubMed]
- Brunn, M.; Krüger, J.; Lang, F. Experimental drought increased the belowground sink strength towards higher topsoil organic carbon stocks in a temperate mature forest. Geoderma 2023, 431, 10. [Google Scholar] [CrossRef]
- Marron, N.; Epron, D. Are mixed-tree plantations including a nitrogen-fixing species more productive than monocultures? For. Ecol. Manag. 2019, 441, 242–252. [Google Scholar] [CrossRef]
- Tumber-Dávila, S.J.; Schenk, H.J.; Du, E.Z.; Jackson, R.B. Plant sizes and shapes above and belowground and their interactions with climate. N. Phytol. 2022, 235, 1032–1056. [Google Scholar] [CrossRef]
- Tang, Y.K.; Wang, L.N.; Zhou, Y.; Geng, X.Q.; Deng, X.; Zhang, Z.L. Drought decreases symbiotic nitrogen fixation and nitrogen transfer in a Populus tomentosa-Hippophae rhamnoides mixed plantation on the semiarid Loess Plateau, China. For. Ecol. Manag. 2024, 558, 9. [Google Scholar] [CrossRef]
- Pereira, A.P.D.; Santana, M.C.; Zagatto, M.R.G.; Brandani, C.B.; Wang, J.T.; Verma, J.P.; Singh, B.K.; Cardoso, E. Nitrogen-fixing trees in mixed forest systems regulate the ecology of fungal community and phosphorus cycling. Sci. Total Environ. 2021, 758, 13. [Google Scholar] [CrossRef] [PubMed]
- Guo, J.H.; Feng, H.L.; McNie, P.; Liu, Q.Y.; Xu, X.; Pan, C.; Yan, K.; Feng, L.; Goitom, E.A.; Yu, Y.C. Species mixing improves soil properties and enzymatic activities in Chinese fir plantations: A meta-analysis. Catena 2023, 220, 10. [Google Scholar] [CrossRef]
- Zhao, J.Y.; Li, X.Y.; Li, S.Y.; Liu, Y.; Zhang, J.D.; Fan, J.G. Soil Organic Carbon Storage and Vertical Distribution of Carbon and Nitrogen under Different Forest Types in the Laotudingzi Mountain of Liaoning. J. Northeast For. Univ. 2016, 44, 65–68+78. (In Chinese) [Google Scholar] [CrossRef]
- Zhou, G.Y.; Xu, S.; Ciais, P.; Manzoni, S.; Fang, J.Y.; Yu, G.R.; Tang, X.L.; Zhou, P.; Wang, W.T.; Yan, J.H.; et al. Climate and litter C/N ratio constrain soil organic carbon accumulation. Natl. Sci. Rev. 2019, 6, 746–757. [Google Scholar] [CrossRef] [PubMed]
- Yang, M.; Yang, D.; Yu, X. Soil microbial communities and enzyme activities in sea-buckthorn (Hippophae rhamnoides) plantation at different ages. PLoS ONE 2018, 13, 15. [Google Scholar] [CrossRef] [PubMed]
- Wang, X.; Bi, Y.L.; Wang, Y.; Tian, Y.; Li, Q.; Du, X.P.; Guo, Y. Effects of Planting Density of Hippophae rhamnoides and Inoculation of AMF on Understory Vegetation Growth and Soil Improvement. Sci. Silvae Sin. 2023, 59, 138–149. (In Chinese) [Google Scholar] [CrossRef]
- Li, J.W.; Li, M.Y.; Dong, L.B.; Wang, K.B.; Liu, Y.L.; Hai, X.Y.; Pan, Y.J.; Lv, W.W.; Wang, X.Z.; Shangguan, Z.P.; et al. Plant productivity and microbial composition drive soil carbon and nitrogen sequestrations following cropland abandonment. Sci. Total Environ. 2020, 744, 10. [Google Scholar] [CrossRef]
- Crowther, T.W.; Riggs, C.; Lind, E.M.; Borer, E.T.; Seabloom, E.W.; Hobbie, S.E.; Wubs, J.; Adler, P.B.; Firn, J.; Gherardi, L.; et al. Sensitivity of global soil carbon stocks to combined nutrient enrichment. Ecol. Lett. 2019, 22, 936–945. [Google Scholar] [CrossRef] [PubMed]
- Zhang, X.B.; Zhang, Z.H.; Lu, X.K. Responses of soil microbial carbon use efficiency to elevated nitrogen deposition in forest ecosystems. Adv. Earth Sci. 2023, 38, 999–1014. (In Chinese) [Google Scholar] [CrossRef]
- Luo, Y.Q.; Ahlström, A.; Allison, S.D.; Batjes, N.H.; Brovkin, V.; Carvalhais, N.; Chappell, A.; Ciais, P.; Davidson, E.A.; Finzi, A.C.; et al. Toward more realistic projections of soil carbon dynamics by Earth system models. Glob. Biogeochem. Cycle 2016, 30, 40–56. [Google Scholar] [CrossRef]
- Lehmann, J.; Kleber, M. The contentious nature of soil organic matter. Nature 2015, 528, 60–68. [Google Scholar] [CrossRef] [PubMed]
- Yu, Z.J.; Wang, K.B.; Li, J.W.; Shangguan, Z.P.; Deng, L. Mixed plantations have more soil carbon sequestration benefits than pure plantations in China. For. Ecol. Manag. 2023, 529, 9. [Google Scholar] [CrossRef]
- Forrester, D.I. The spatial and temporal dynamics of species interactions in mixed-species forests: From pattern to process. For. Ecol. Manag. 2014, 312, 282–292. [Google Scholar] [CrossRef]
- Qin, F.C.; Yang, F.C.; Ming, A.G.; Jia, H.Y.; Zhou, B.J.; Xiong, J.F.; Lu, J.K. Mixture enhances microbial network complexity of soil carbon, nitrogen and phosphorus cycling in Eucalyptus plantations. For. Ecol. Manag. 2024, 553, 11. [Google Scholar] [CrossRef]


| Sample Plots | Tree Species | Tree Height (m) | DBH/DGH (cm) | Crown Diameter of (EW × SN/m × m) | Area of Sample Plot (m × m) |
|---|---|---|---|---|---|
| HrPt | Hippophae rhamnoides | 3.08 ± 0.14 | 5.43 ± 0.33 | (2.01 ± 0.09) × (2.04 ± 0.11) | 20 × 20 |
| Pinus tabuliformis | 4.01 ± 0.17 | 7.11 ± 0.48 | (2.62 ± 0.12) × (2.60 ± 0.14) | 20 × 20 | |
| Hr | Hippophae rhamnoides | 3.46 ± 0.12 | 5.96 ± 0.33 | (2.40 ± 0.12) × (2.29 ± 0.11) | 20 × 20 |
| Pt | Pinus tabuliformis | 3.69 ± 0.09 | 7.43 ± 0.27 | (2.96 ± 0.12) × (3.36 ± 0.11) | 20 × 20 |
| Soil Layer (cm) | Sample Plots | STP (%) | SCP (%) | SNCP (%) | SWC (%) | SBD (g cm−3) | FC (%) | pH | NN (g kg−1) | AN (g kg−1) | AP (g kg−1) |
|---|---|---|---|---|---|---|---|---|---|---|---|
| 0–10 | Hr | 0.545 | 0.424 | 12.140 | 0.086 | 1.204 | 19.175 | 8.390 | 0.931 | 1.841 | 0.614 |
| Pt | 0.515 | 0.383 | 13.240 | 0.104 | 1.138 | 17.942 | 8.800 | 0.213 | 1.863 | 0.310 | |
| HrPt | 0.519 | 0.382 | 13.710 | 0.072 | 1.225 | 17.141 | 8.319 | 0.389 | 1.493 | 0.406 | |
| 10–20 | Hr | 0.553 | 0.424 | 12.980 | 0.094 | 1.127 | 19.470 | 8.297 | 0.357 | 1.980 | 0.410 |
| Pt | 0.471 | 0.360 | 11.100 | 0.082 | 1.345 | 15.287 | 8.877 | 0.258 | 1.860 | 0.355 | |
| HrPt | 0.518 | 0.394 | 12.340 | 0.089 | 1.172 | 18.211 | 8.400 | 0.335 | 1.407 | 0.367 | |
| 20–50 | Hr | 0.457 | 0.348 | 10.830 | 0.082 | 1.423 | 14.326 | 8.497 | 0.224 | 1.487 | 0.323 |
| Pt | 0.477 | 0.369 | 10.790 | 0.099 | 1.355 | 15.447 | 8.898 | 0.147 | 1.733 | 0.304 | |
| HrPt | 0.503 | 0.386 | 11.660 | 0.088 | 1.281 | 16.562 | 8.500 | 0.152 | 1.268 | 0.366 | |
| 50–100 | Hr | 0.468 | 0.351 | 11.690 | 0.101 | 1.386 | 14.626 | 8.593 | 0.295 | 1.394 | 0.343 |
| Pt | 0.484 | 0.363 | 12.100 | 0.104 | 1.368 | 15.509 | 8.995 | 0.123 | 1.725 | 0.346 | |
| HrPt | 0.529 | 0.421 | 10.860 | 0.094 | 1.294 | 18.081 | 8.490 | 0.166 | 1.364 | 0.364 | |
| 100–150 | Hr | 0.467 | 0.358 | 10.840 | 0.104 | 1.486 | 14.361 | 8.680 | 0.256 | 1.265 | 0.350 |
| Pt | 0.445 | 0.335 | 11.020 | 0.098 | 1.440 | 13.669 | 9.020 | 0.112 | 1.971 | 0.316 | |
| HrPt | 0.512 | 0.401 | 11.130 | 0.065 | 1.266 | 17.517 | 8.530 | 0.146 | 1.547 | 0.274 | |
| 150–200 | Hr | 0.492 | 0.383 | 10.930 | 0.105 | 1.418 | 15.857 | 8.790 | 0.128 | 1.171 | 0.337 |
| Pt | 0.448 | 0.340 | 10.840 | 0.092 | 1.400 | 14.061 | 9.100 | 0.103 | 1.697 | 0.361 | |
| HrPt | 0.515 | 0.403 | 11.220 | 0.070 | 1.250 | 17.881 | 8.650 | 0.112 | 1.359 | 0.286 |
| Sample Plots | Component | Allometric Equation | R2 |
|---|---|---|---|
| Hr | Leaf Stem Root | WL = 0.006 (D2H)0.8403 | 0.986 |
| WS = 0.0302 (D2H)0.9474 | 0.990 | ||
| WR = 0.0119 (D2H)0.9501 | 0.957 | ||
| Pt | Leaf Stem Root | WL = 0.05 (D2H)0.6308 | 0.989 |
| WS = 0.0485 (D2H)0.8510 | 0.993 | ||
| WR = 0.0298 (D2H)0.7866 | 0.994 | ||
| HrPt(Hr) | Leaf Stem Root | WL = 0.0193 (D2H)0.7608 | 0.840 |
| WS = 0.0477 (D2H)0.8526 | 0.986 | ||
| WR = 0.0293 (D2H)0.8025 | 0.953 | ||
| HrPt(Pt) | Leaf | WL = 0.0262 (D2H)0.7727 | 0.967 |
| Stem | WS = 0.048 (D2H)0.8494 | 0.997 | |
| Root | WR = 0.0301 (D2H)0.7767 | 0.990 |
| Component | Sample Plots | C (g kg−1) | N (g kg−1) | P (g kg−1) | C:N | C:P | N:P |
|---|---|---|---|---|---|---|---|
| Leaf | Hr | 487.15 ± 10.55 a | 35.06 ± 0.57 a | 1.79 ± 0.04 a | 13.91 ± 0.21 a | 275.44 ± 6.29 a | 19.79 ± 0.34 a |
| HrPt(Hr) | 475.29 ± 6.13 a | 35.12 ± 0.54 a | 1.83 ± 0.04 a | 13.57 ± 0.11 a | 263.29 ± 4.54 a | 19.44 ± 0.36 a | |
| Pt | 549.08 ± 10.57 a | 10.97 ± 0.34 b | 0.82 ± 0.03 b | 54.69 ± 2.36 a | 729.77 ± 26.37 a | 13.57 ± 0.27 a | |
| HrPt(Pt) | 531.64 ± 7.40 a | 12.40 ± 0.27 a | 0.99 ± 0.05 a | 43.88 ± 1.32 b | 569.04 ± 20.57 b | 13.15 ± 0.41 a | |
| Stem | Hr | 491.20 ± 5.09 a | 16.43 ± 0.72 b | 1.03 ± 0.06 a | 31.62 ± 1.28 a | 517.86 ± 22.08 a | 16.64 ± 0.64 b |
| HrPt(Hr) | 472.52 ± 11.99 a | 17.88 ± 0.54 a | 0.96 ± 0.05 a | 27.15 ± 0.98 a | 516.96 ± 19.65 a | 19.31 ± 0.58 a | |
| Pt | 545.97 ± 5.56 a | 4.14 ± 0.32 a | 0.37 ± 0.02 a | 157.19 ± 10.15 a | 1536.07 ± 57.65 a | 11.47 ± 0.97 a | |
| HrPt(Pt) | 537.29 ± 4.46 a | 4.17 ± 0.30 a | 0.37 ± 0.02 a | 152.26 ± 9.90 a | 1553.78 ± 65.78 a | 11.65 ± 0.90 a | |
| Root | Hr | 483.58 ± 10.55 a | 29.94 ± 1.02 a | 0.69 ± 0.04 a | 16.57 ± 0.48 b | 798.89 ± 57.05 a | 47.84 ± 2.88 a |
| HrPt(Hr) | 488.34 ± 10.89 a | 25.25 ± 1.39 b | 0.69 ± 0.03 a | 35.79 ± 9.89 a | 751.05 ± 34.62 a | 39.07 ± 2.74 b | |
| Pt | 474.17 ± 9.89 a | 5.76 ± 0.23 a | 0.58 ± 0.02 b | 90.05 ± 5.80 a | 865.58 ± 42.83 a | 10.29 ± 0.56 a | |
| HrPt(Pt) | 473.96 ± 12.46 a | 6.54 ± 0.33 a | 0.62 ± 0.03 a | 81.38 ± 5.56 a | 850.67 ± 58.62 a | 10.91 ± 0.52 a | |
| Litter layer | Hr | 458.64 ± 5.98 A | 25.18 ± 0.53 A | 1.12 ± 0.03 A | 18.36 ± 0.27 A | 416.34 ± 10.16 A | 22.72 ± 0.50 A |
| Pt | 527.93 ± 7.50 a | 7.18 ± 0.31 b | 0.49 ± 0.02 b | 77.86 ± 3.44 a | 1129.73 ± 41.20 a | 14.74 ± 0.32 b | |
| HrPt | 431.38 ± 17.09 Ab | 21.31 ± 1.06 aB | 0.91 ± 0.03 aB | 21.32 ± 0.74 Ab | 482.50 ± 20.02 Ab | 23.49 ± 1.06 Aa |
| Soil Layer (cm) | Sample Plots | C Content (g kg−1) | N Content (g kg−1) | P Content (g kg−1) | C:N | C:P | N:P |
|---|---|---|---|---|---|---|---|
| 0–10 | Hr | 12.79 ± 0.75 A | 0.65 ± 0.03 A | 0.54 ± 0.01 A | 19.61 ± 0.62 A | 23.71 ± 1.40 A | 1.20 ± 0.05 A |
| Pt | 8.78 ± 0.33 b | 0.45 ± 0.02 b | 0.53 ± 0.01 a | 19.59 ± 0.60 a | 16.86 ± 0.74 b | 0.87 ± 0.04 b | |
| HrPt | 10.78 ± 0.52 Aa | 0.53 ± 0.01 Aa | 0.54 ± 0.01 Aa | 20.43 ± 1.13 Aa | 20.17 ± 0.88 Aa | 1.01 ± 0.03 Aa | |
| 10–20 | Hr | 6.83 ± 0.37 A | 0.35 ± 0.02 A | 0.52 ± 0.01 A | 19.55 ± 0.55 A | 13.16 ± 0.68 A | 0.68 ± 0.03 A |
| Pt | 7.52 ± 0.40 a | 0.38 ± 0.01 a | 0.53 ± 0.01 a | 19.92 ± 0.95 a | 14.43 ± 0.89 a | 0.73 ± 0.03 a | |
| HrPt | 6.06 ± 0.29 Ab | 0.31 ± 0.01 Ab | 0.51 ± 0.01 Aa | 19.34 ± 0.71 Aa | 11.94 ± 0.65 Ab | 0.61 ± 0.02 Ab | |
| 20–50 | Hr | 4.78 ± 0.36 A | 0.23 ± 0.01 A | 0.51 ± 0.01 A | 20.92 ± 0.91 A | 9.40 ± 0.67 A | 0.44 ± 0.02 A |
| Pt | 5.11 ± 0.27 a | 0.27 ± 0.02 a | 0.51 ± 0.01 a | 22.19 ± 3.10 a | 10.18 ± 0.58 a | 0.53 ± 0.03 a | |
| HrPt | 4.28 ± 0.21 Ab | 0.22 ± 0.01 Ab | 0.51 ± 0.01 Aa | 20.04 ± 1.23 Aa | 8.51 ± 0.48 Aa | 0.43 ± 0.01 Ab | |
| 50–100 | Hr | 3.99 ± 0.19 A | 0.18 ± 0.01 A | 0.52 ± 0.01 A | 22.20 ± 1.11 A | 7.74 ± 0.41 A | 0.36 ± 0.01 A |
| Pt | 3.66 ± 0.15 a | 0.19 ± 0.00 a | 0.51 ± 0.00 a | 19.63 ± 0.78 a | 7.23 ± 0.34 a | 0.37 ± 0.01 a | |
| HrPt | 3.57 ± 0.15 Aa | 0.19 ± 0.00 Aa | 0.51 ± 0.01 Aa | 18.92 ± 0.68 Aa | 6.97 ± 0.31 Aa | 0.37 ± 0.01 Aa | |
| 100–150 | Hr | 3.81 ± 0.19 A | 0.19 ± 0.01 A | 0.52 ± 0.01 A | 20.64 ± 0.99 A | 7.38 ± 0.42 A | 0.36 ± 0.01 A |
| Pt | 3.74 ± 0.18 a | 0.19 ± 0.00 a | 0.52 ± 0.01 a | 20.33 ± 1.09 a | 7.28 ± 0.41 a | 0.36 ± 0.01 a | |
| HrPt | 3.68 ± 0.19 Aa | 0.18 ± 0.00 Aa | 0.53 ± 0.01 Aa | 20.32 ± 0.98 Aa | 6.95 ± 0.38 Aa | 0.34 ± 0.01 Aa | |
| 150–200 | Hr | 3.73 ± 0.14 A | 0.19 ± 0.01 A | 0.53 ± 0.01 A | 19.34 ± 0.71 A | 7.13 ± 0.33 A | 0.37 ± 0.01 A |
| Pt | 3.60 ± 0.20 a | 0.18 ± 0.00 a | 0.53 ± 0.01 a | 19.92 ± 1.02 a | 6.91 ± 0.42 a | 0.34 ± 0.01 a | |
| HrPt | 3.66 ± 0.17 Aa | 0.18 ± 0.00 Aa | 0.53 ± 0.00 Aa | 20.04 ± 0.84 Aa | 6.90 ± 0.32 Aa | 0.34 ± 0.01 Aa |
| Plantation Ecosystem | Sample Plots | C Stock (Mg ha−1) | N Stock (Mg ha−1) | P Stock (Mg ha−1) |
|---|---|---|---|---|
| Vegetation layer | Hr | 4.89 ± 0.05 B | 0.22 ± 0.004 B | 0.01 ± 0.0003 B |
| Pt | 5.26 ± 0.06 b | 0.06 ± 0.002 b | 0.005 ± 0.0001 b | |
| HrPt | 53.68 ± 0.62 Aa | 1.50 ± 0.03 Aa | 0.08 ± 0.001 Aa | |
| Soil layer (0–200 cm) | Hr | 127.24 ± 6.19 A | 6.17 ± 0.16 A | 14.70 ± 0.18 A |
| Pt | 120.54 ± 5.58 a | 6.08 ± 0.16 a | 14.32 ± 0.16 a | |
| HrPt | 107.83 ± 4.88 Ba | 5.40 ± 0.08 Bb | 13.26 ± 0.14 Bb | |
| Ecosystem | Hr | 132.14 ± 6.18 B | 6.40 ± 0.16 B | 14.71 ± 0.18 A |
| Pt | 125.80 ± 5.59 b | 6.14 ± 0.15 b | 14.33 ± 0.16 a | |
| HrPt | 161.50 ± 4.94 Aa | 6.90 ± 0.09 Aa | 13.34 ± 0.14 Bb |
| Sample Plots | C (Mg ha−1 year−1) | N (Mg ha−1 year−1) | P (Mg ha−1 year−1) | |
|---|---|---|---|---|
| Ecosystem | Hr | 8.81 ± 0.41 B | 0.43 ± 0.01 B | 0.98 ± 0.01 A |
| Pt | 8.39 ± 0.37 b | 0.41 ± 0.01 b | 0.96 ± 0.01 a | |
| HrPt | 10.77 ± 0.33 Aa | 0.46 ± 0.01 Aa | 0.89 ± 0.01 Bb |
Disclaimer/Publisher’s Note: The statements, opinions and data contained in all publications are solely those of the individual author(s) and contributor(s) and not of MDPI and/or the editor(s). MDPI and/or the editor(s) disclaim responsibility for any injury to people or property resulting from any ideas, methods, instructions or products referred to in the content. |
© 2024 by the authors. Licensee MDPI, Basel, Switzerland. This article is an open access article distributed under the terms and conditions of the Creative Commons Attribution (CC BY) license (https://creativecommons.org/licenses/by/4.0/).
Share and Cite
Yu, W.; Jiang, R.; Wei, X.; Luan, X.; Chen, Y.; Ma, B.; Wu, X.; Niu, Y.; Chen, Y. Effects of Mixing Hippophae rhamnoides and Pinus tabuliformis on Ecosystem Carbon, Nitrogen, and Phosphorus Sequestration and Storage Capacity in the Loess Hilly Region, China. Forests 2024, 15, 1382. https://doi.org/10.3390/f15081382
Yu W, Jiang R, Wei X, Luan X, Chen Y, Ma B, Wu X, Niu Y, Chen Y. Effects of Mixing Hippophae rhamnoides and Pinus tabuliformis on Ecosystem Carbon, Nitrogen, and Phosphorus Sequestration and Storage Capacity in the Loess Hilly Region, China. Forests. 2024; 15(8):1382. https://doi.org/10.3390/f15081382
Chicago/Turabian StyleYu, Wenwei, Rumeng Jiang, Xiaolan Wei, Xinlong Luan, Yueyan Chen, Baohong Ma, Xu Wu, Yaobin Niu, and Yunming Chen. 2024. "Effects of Mixing Hippophae rhamnoides and Pinus tabuliformis on Ecosystem Carbon, Nitrogen, and Phosphorus Sequestration and Storage Capacity in the Loess Hilly Region, China" Forests 15, no. 8: 1382. https://doi.org/10.3390/f15081382