Article

Photosynthesis and Latex Burst Characteristics in Different Varieties of Rubber Trees (Hevea brasiliensis) under Chilling Stress, Combing Bark Tensile Property and Chemical Component Analysis

1
Rubber Research Institute, Chinese Academy of Tropical Agricultural Sciences, Haikou 571101, China
2
Hainan Danzhou Agro-Ecosystem National Observation and Research Station, Danzhou 571737, China
*
Authors to whom correspondence should be addressed.
Forests 2024, 15(8), 1408; https://doi.org/10.3390/f15081408 (registering DOI)
Submission received: 5 July 2024 / Revised: 6 August 2024 / Accepted: 9 August 2024 / Published: 11 August 2024

Abstract

:
Rubber trees (Hevea brasiliensis) serve as the primary source of natural rubber. Their native habitat is characterized by warm and humid conditions, so they are particularly sensitive to low temperatures. Under such stress, latex burst can cause severe damage to rubber trees, which is due to the uniqueness of their economically productive parts. In order to establish a correlation between young and mature rubber trees and provide a novel prospective for investigating the mechanisms of latex burst and chilling resistance in rubber trees, the chlorophyll contents, photosynthesis, and chlorophyll fluorescence parameters in four varieties of one-year-old rubber tree seedlings were analyzed under artificially simulated chilling stress. The latex burst characteristics were subsequently recorded. A comprehensive statistical analysis of the chilling-resistance rank was conducted using the membership function method and the combination weighting method. Meanwhile, chemical compositions and tensile properties of barks from two-year-old twigs of mature rubber trees were ascertained. A correlation analysis between chilling resistance, chemical compositions, and tensile properties was performed to identify any interrelationships among them. The results showed that the number and the total area of latex-burst positions in variety Reken628 seedlings were greater than those in other varieties, and the lowest number and total area of latex-burst positions were observed in variety RRIM600 and variety PR107, respectively. With the exception of variety GT1, nectar secretion was noted in all other varieties of rubber tree seedlings under chilling stress. The chilling resistance of the four varieties decreased in the following order: variety GT1 > variety RRIM600 > variety PR107 > variety Reken628. The chilling resistance was strongly (p < 0.001) negatively correlated with cellulose content and acid-insoluble lignin content, respectively. The total area of latex burst was significantly (p < 0.001) and positively correlated with holocellulose content and maximum load, respectively. Furthermore, this study also provides new insights into the mechanism of nectar secretion induced by low temperatures and its association with the chilling resistance of rubber trees.

1. Introduction

The rubber tree (Hevea brasiliensis.) is a perennial tree crop native to the Amazon rainforest in Brazil. Rubber trees produce high-quality rubber in commercial quantities, accounting for more than 98% [1] of the world’s natural rubber supply. Despite the fact that rubber tree plantations were constructed successfully between 18° N and 24° N in the south of China on a large scale in the 1950s, chilling injury remains a significant challenge for the rubber tree growing industry, particularly during the winter and early spring seasons [2]. Rubber tree plantations situated on the edge of the tropics and in the southern subtropics of China necessitate the cultivation of cold-resistance rubber trees. Though the rubber tree is chilling-tolerant to a certain extent, it is susceptible to cold damage under conditions of intolerable temperatures or excessive chilling accumulation. Within their respective habitats, various plant species exhibit distinct optimal temperatures for photosynthesis. The optimal temperature for photosynthesis in rubber trees lies between 25 °C and 30 °C. When subjected to temperatures below 10 °C, the photosynthetic activity of rubber trees ceases [2]. The sucrose produced through photosynthesis serves as the unique precursor for rubber biosynthesis in the laticifers [3]. Low temperatures impede all biochemical reactions involved in photosynthesis [4]. Upon cessation of photosynthesis in the rubber tree, the plant maintains its metabolic activity by respiring stored starch and other photosynthetic carbohydrates, despite persistent chilling stress. Moreover, the rubber tree’s inability to synthesize new photosynthetic compounds weakens its cold resistance. This susceptibility is further exacerbated by alterations in pigment composition and shifts in the protein, lipid, and fatty acid profiles of plant cell membranes, as well as variations in the abundance of these chemical components. Consequently, chilling injuries to rubber trees are unavoidable. Exposure to chilling stress can induce leaf necrosis, shriveled branches, and latex bursts throughout the tree. The trunk bark burst resulting from this stress not only leads to bark necrosis but also precipitates secondary disease and pest damage to rubber trees [5,6,7,8]. These factors collectively contribute to a decline in the resistance of rubber trees and an escalation of economic loss.
Rubber latex is synthesized in laticifers, which are differentiated from the cambium. These laticifers form an anastomosed network structure and are arranged in rings parallel to the vascular cambium following maturation [9]. When rubber trees are subjected to chilling temperatures, the outer bark layers cool more rapidly than the xylem and exhibit significant tensile strength in the tangential direction. This leads to cracks forming along the radical surface of the outer bark when exposed to abrupt drops in temperature, causing laticifers to break. The latex then flows between the bark and the xylem, where the pressure is lower, subsequently condensing into colloids. If the expansive force of the latex and colloids is less than the tension that the bark can withstand, the colloids remain within the bark. Conversely, if the expansive force exceeds this tension, the bark bursts, allowing the latex to escape from the tree through fissures [10]. Therefore, the tensile property of the bark is a crucial factor influencing bark burst in rubber trees under chilling stress.
The mechanical properties of plant tissues are largely determined by the arrangement of fibers in cell walls [11]. The cell wall must possess the ability to withstand high tensile stresses, either permitting elastic deformation in response to changes in turgor pressure or providing sufficient extensibility to accommodate elongation [12]. As an active and dynamic organelle, the cell wall is composed of a considerable amount of the polysaccharide cellulose. In addition to cellulose, the primary cell wall also contains a three-dimensional network of hemicellulose, pectin, and glycoproteins. The secondary wall, which originates from the thickening of the primary wall, is typically impregnated with lignin [13]. Plant cell walls exhibit marked variations in composition and structure across different cell types, developmental stages, and species. Thus, the composition and structure of the cell wall can be flexibly modified during various biological processes, in response to different stresses and to meet specific functional requirements [14].
The constitution and structure of the cell wall affect the physical and mechanical properties of plants. Furthermore, changes in cell wall components can impact photosynthetic parameters under abiotic stresses [15]. The economic yield of rubber trees is derived from their bark, which also experiences the latex burst caused by chilling stress. By establishing a correlation between the chemical components of the bark and its physical properties, we can better understand the mechanisms behind the latex burst under chilling stress. Moreover, we can verify changes in bark components among different varieties of rubber trees that affect photosynthetic parameters under chilling stress. In order to ensure the feasibility of the simulation experiment, we utilized one-year-old budded rubber trees to withstand the chilling stress. Twigs from two-year-old mature rubber trees were harvested for the measurement of bark physical properties and chemical component analysis. This study aimed to determine the variations in chlorophyll content, photosynthetic parameters, and chlorophyll fluorescence parameters across different rubber tree varieties under chilling stress. Utilizing the membership function method and the combination weighting method, we determined the order of chilling resistance among four varieties of rubber trees. Notably, the bark latex burst conditions exhibited variations in chilling resistance across these varieties when subjected to chilling stress. We constructed a correlation matrix based on the comprehensive evaluation value of different varieties, considering factors such as their total latex burst areas, their bark physical properties, and their chemical components. The connection between one-year-old budded rubber trees and mature trees was made to reveal the mechanism underlying latex burst in rubber trees under chilling stress.

2. Materials and Methods

2.1. Experimental Design and Treatment

One-year-old budded rubber tree seedlings and mature rubber trees (thirteen years old) were cultivated in the National Tropical Plants Germplasm Resource Center—Rubber Tree. Prior to application of chilling stress, these one-year-old budded seedlings were maintained in the nursery of the same center under natural conditions (temperature range of 23–29 °C), located at coordinates 19°30′50.4″ N, 109°29′31.2″ E, and an altitude of 168.7 m. The varieties of rubber trees examined in this study included PR107, RRIM600, Reken628 and GT1. Seedlings with similar growth characteristics were subjected to chilling treatments (16/4 °C, day/night), under a photoperiod of 12 h, relative humidity of 80%, and light intensity of 100 μm m−2 s−1. On the 0, 1st, 3rd, and 5th days of the chilling treatment, photosynthetic pigment contents (Chl a, Chl b, T chl, and carotenoid), chlorophyll fluorescence, and photosynthesis parameters were measured in leaves from the same stories. Rubber tree phenotypes were observed daily during the chilling treatment, and the representations of latex burst were recorded from emergence to the termination of the treatment. Healthy two-year-old rubber tree twigs (with 5 plants per variety) exhibiting similar growth were collected for bark tensile property and chemical component measurement.

2.2. Photosynthetic Pigment Content Determination

Photosynthetic pigment contents were determined on the 0, 1st, 3rd, and 5th days of the chilling treatment, following the experimental guidance [16]. Each sample (0.05 g) was placed in a 15 mL centrifuge tube containing a 15 mL intermixture solution (acetone/ethanol/ultra-pure water = 4.5:4.5:1), then incubated in the dark at room temperature for 24 h (shaking several times) until the leaves turned white. Subsequently, absorbance readings of the extract solution were obtained using a UV/VIS spectrophotometer (PGENERAL T6 Newcentury, Beijing, China).

2.3. Chlorophyll Fluorescence Parameter Examination

The parameters of chlorophyll fluorescence were examined on fully expanded leaves from the same storey in rubber trees using a portable pulse-modulated fluorescence instrument (PAM-2500, WALZ, Effeltrich, Germany), according to the operation manual. The rubber trees underwent a 30 min dark adaptation period prior to measuring the initial fluorescence (Fo) with the fluorescence instrument. Following a saturating pulse, the maximum fluorescence (Fm) was obtained, which facilitated the calculation of the potential quantum photochemical efficiency of PSII [Fv/Fm = (Fm − Fo)/Fm]. At the same time, the actual photochemical yield of PSII (ΦPSII) was determined using the equation ΦPSII = (Fm’ −₌ Fs)/Fm’, where Fm’ represents the maximum fluorescence of light-adapted leaves and Fs denotes the stable fluorescence.

2.4. Photosynthetic Parameter Measurement

Net photosynthetic rate (Pn), stomatal conductance (Gs), intercellular CO2 concentration (Ci), and transpiration rates (Tr) were concurrently measured for leaves from the same storey using a portal photosynthesis system (Li-6400, LI-COR BioSciences, Lincoln, NE, USA). The leaf chamber ensured a controlled environment with a constant photosynthetic photon flux density (PPFD) of 100 μmol m−2 s−1, CO2 concentration ranging between 360 and 380 μmol mol−1, and a consistent leaf temperature of 25 ± 1 °C throughout the measurement procedure.

2.5. The Area of Latex Burst Determination

The area of the latex burst was ascertained using an electronic digital caliper. The diameter of the dot-shaped latex burst location and the side lengths of the runner-shaped location were recorded. The area was subsequently calculated based on these data.

2.6. Tensile Property Test

Bark tensile property tests were conducted on dog-bone samples (n ≥ 10) using a universal testing machine (50KN CMT5504, MTS Systems Co., Ltd., Shenzhen, China), with control provided by the Power Test_Dooc software (Power Test_Dooc V3.6, Shenzhen, China), following our previous methodology [17]. The test velocity was set at 1.5 mm min−1 with a gauge length of 200 mm. A minimum of 10 replicates (from 5 plants) were tested for each rubber tree variety.

2.7. Chemical Composition Analysis of Rubber Tree Bark

All the composition analyses were conducted on duplicate samples, following the nitric acid-ethanol and GB/T standard measurement methods. The content of pectin (GB/T 10742-2008) [18], cellulose [19], acid-insoluble lignin (GB/T 2677.8-1994) [20], and holocellulose (GB/T 2677.10-1995) [21] in the samples was determined.

2.8. Statistical Analysis

With the exception of the tensile property test, all experiments were conducted in triplicate. Data analysis was performed using a one-way ANOVA test, with significant statistical differences between mean values of indicators determined by running Duncan’s multiple range test in Excel 2021 at a significance level of p < 0.05. The membership function value of the indicator and the entropy weight of the indicator were calculated using Excel 2021. The Spearman correlation between chilling resistance, latex burst sensitivities, and their physiological and mechanical parameters was constructed using Origin 2021.
Combination weights were ascertained as previously described [22].
The method of the membership function value was employed to conduct a comprehensive evaluation of the chilling resistance across various physiological indicators. The corresponding formulas are as follows:
U(Xij) = (xmax − xij)/(xmax − xmin)
Vj = x ¯ j / σ j
Wvj = Vj / V j
D M = j = 1 n [ U X i j W v j ]
where U(Xij) is the membership function value of the j-th comprehensive indicator in variety i, xij is the value of the j-th indicator in variety i, and xmax and xmin represent the maximum and minimum values of the j-th indicator, respectively. Vj is the standard deviation coefficient of the j-th indicator, x ¯ j is the mean value of the j-th indicator, and σj represents the standard deviation of the j-th indicator. Wvj and DM stand for the weight of the j-th indicator and the comprehensive evaluation value by the membership function method.
Yij = U ( X i j ) / i = 1 n [ U ( X i j ) ]
Ej = 1 I n   n i = 1 n Y i j
Wej = 1 E j k j = 1 m E j
Wj = W v j W e j j = 1 m W v j W e j
D = [ U ( X i j )   W j ]
where Yij is the weight of the j-th indicator of the i-th variety. The modification of the Yij value refers to reference [22]. Ej represents the information entropy of the j-th indicator. Wej and Wj stand for the entropy weight of the j-th indicator and the combination weight. D is the comprehensive evaluation value obtained by the combination weighting method.

3. Results

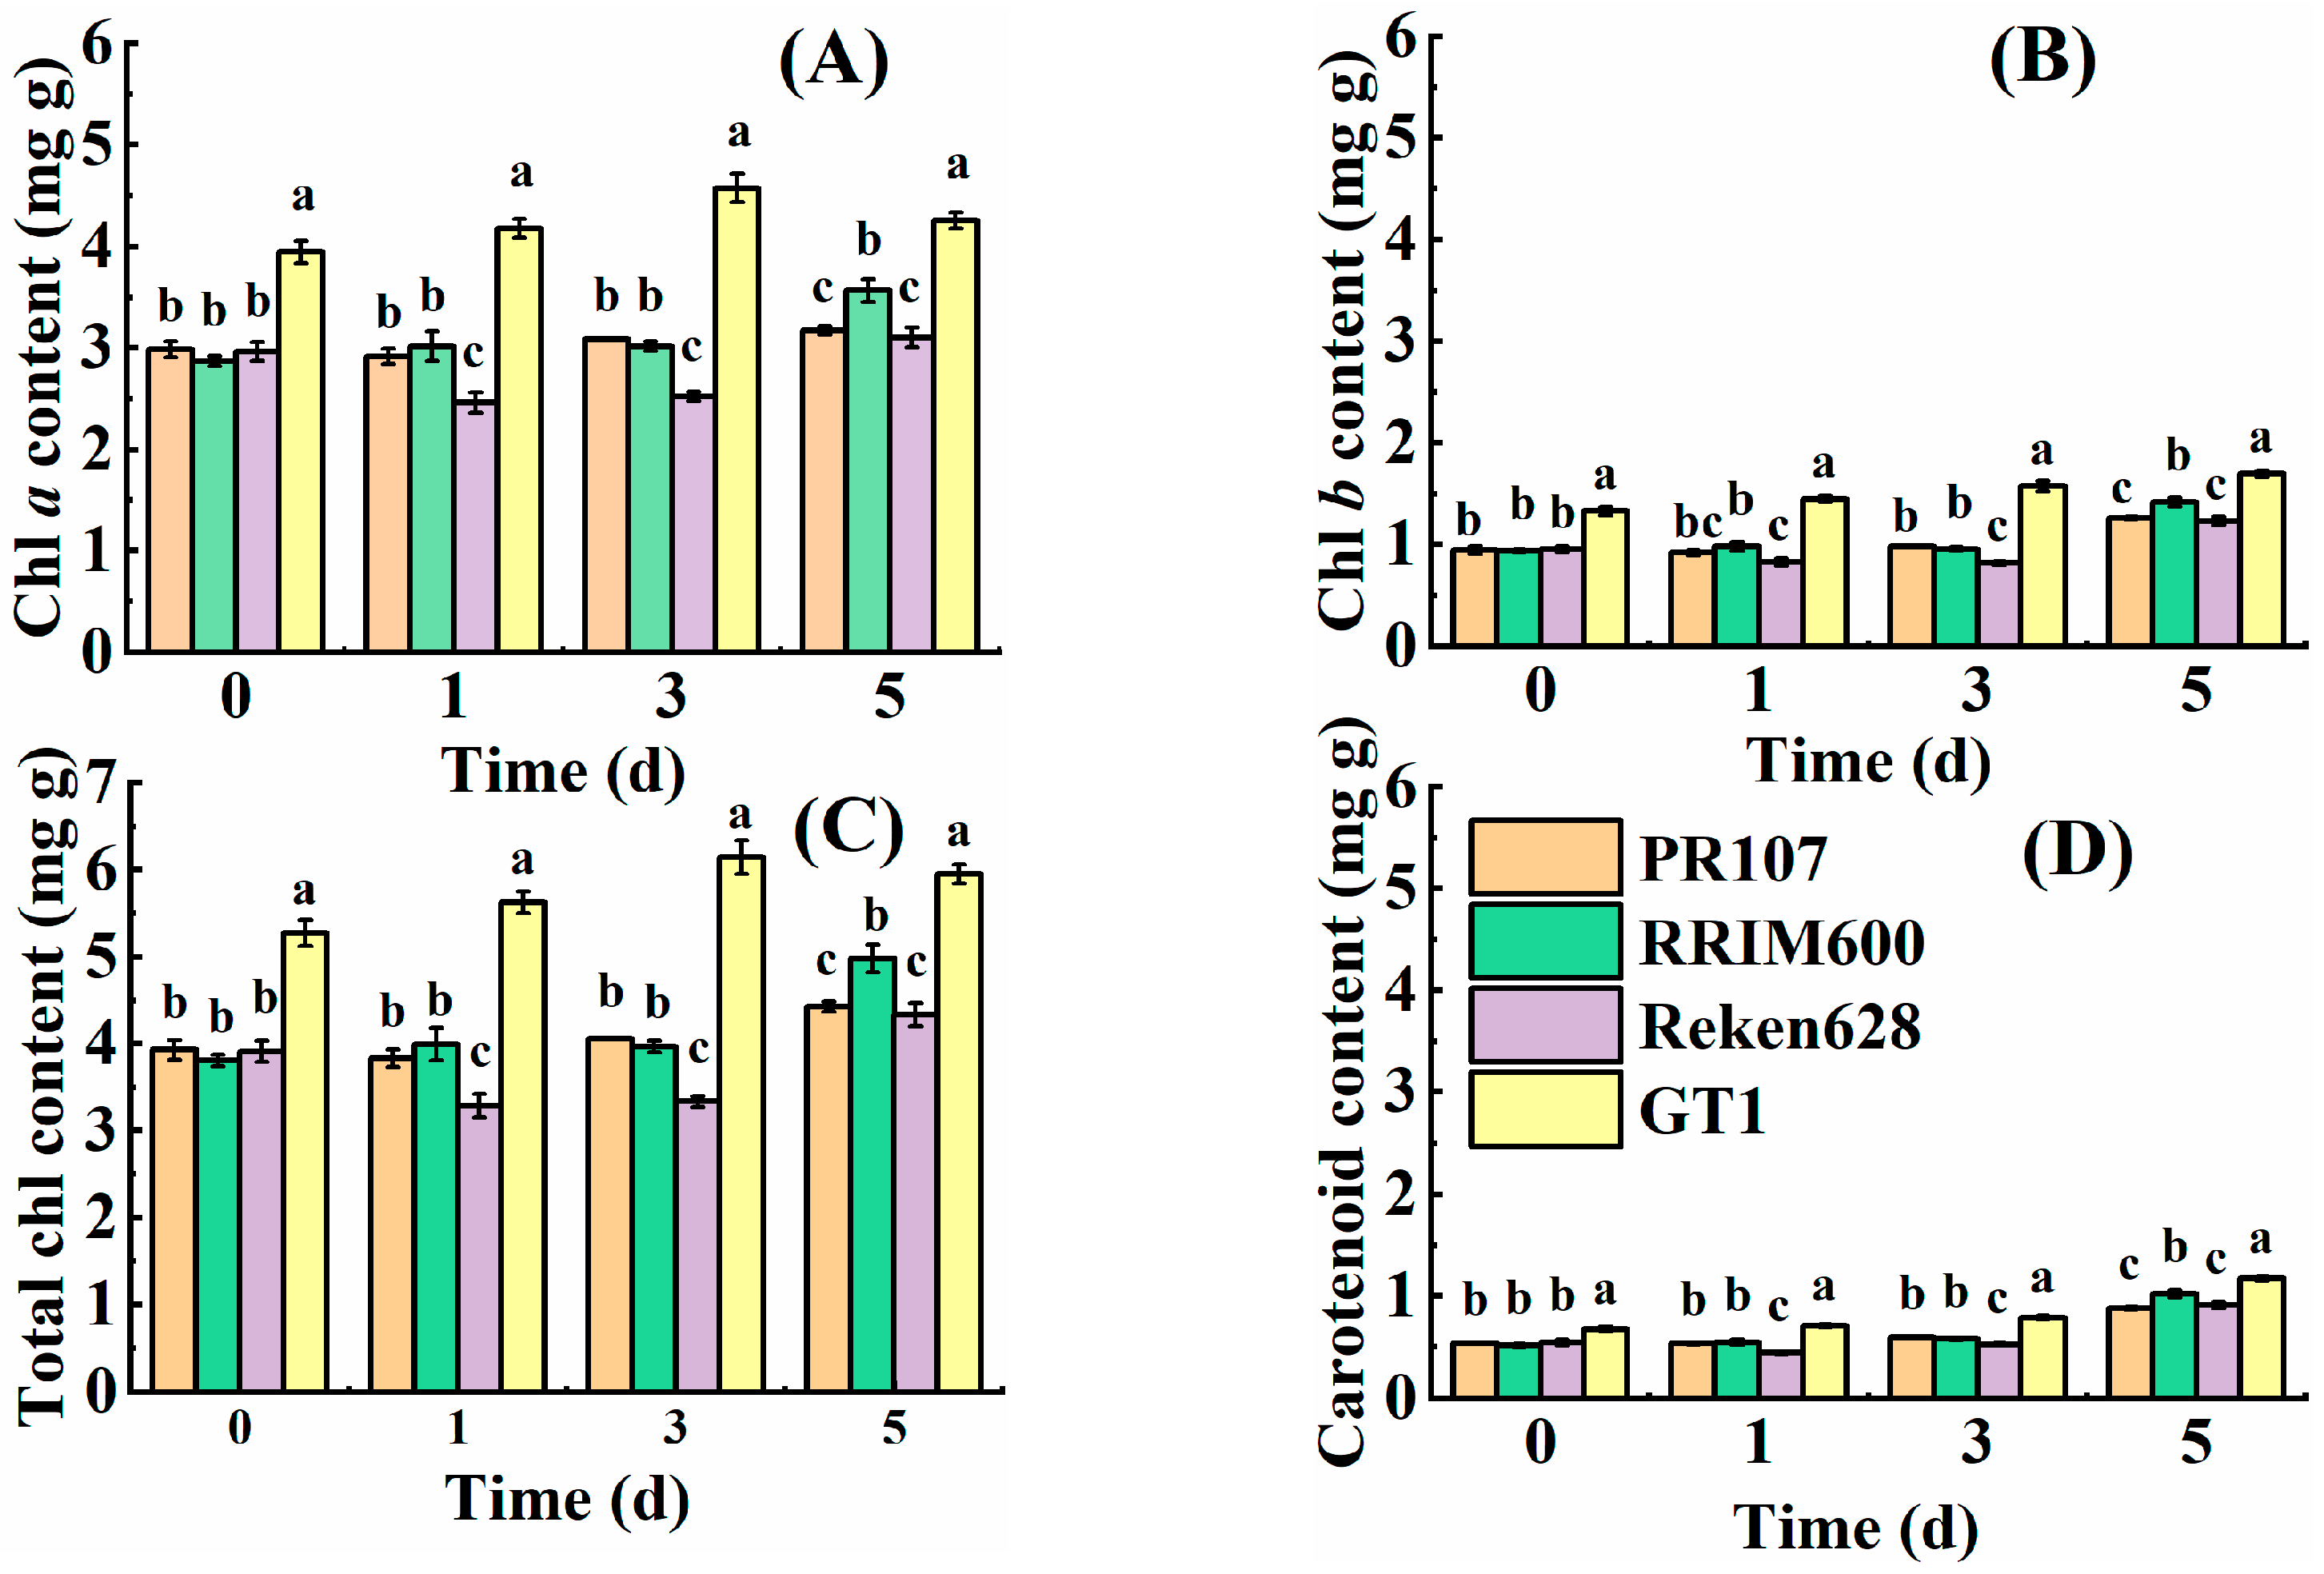
3.1. Changes in Photosynthetic Pigment Content under Chilling Stress

The analysis of experimental data revealed that the trends in photosynthetic pigment content varied among rubber tree varieties under chilling stress (Figure 1A–D). Chilling stress resulted in a gradual increase in chl b and carotenoid contents in the leaves of variety GT1 seedlings. However, exposure to chilling stress initially increased (after 1 and 3 days) and then decreased (after 5 days) the photosynthetic pigment contents (chl a, T chl) in these seedlings. During this period, the photosynthetic pigment content in the leaves of variety GT1 seedlings was significantly (p < 0.05) higher than that in the other varieties (Figure 1A–D). After 3 days of chilling stress, the highest chl a and T chl contents were observed in variety GT1, with enhancements of 15.86%, 18.34%, and 16.48%, respectively, compared to pre-stress levels. After 5 days of chilling stress, there was a significant increase in the carotenoid contents of leaves in variety PR107, variety RRIM600, variety Reken628, variety GT1 by 64.47%, 99.14%, 66.77%, and 73.93%, respectively, compared to pre-stress levels (Figure 1D). Following a 5-day period of chilling stress, the increases in chl b content were observed to be 33.02%, 51.22%, 29.67%, and 27.51% for variety PR107, variety RRIM600, variety Reken628, variety GT1, respectively, relative to their pre-stress levels. However, differences in photosynthetic pigment contents in variety PR107 and variety Reken628 were significantly (p < 0.05) lower than those of the other two varieties (Figure 1A–D).
During the chilling stress, the chlorophyll content of variety PR107 showed a trend of first decreasing and then increasing (Table 1). After 5 days of stress, except for its chlorophyll a content, the contents of other photosynthetic pigments were significantly (p < 0.05) higher than those before the stress, with the carotenoid content increasing by 64.47% compared to that before the stress. The carotenoid content of variety RRIM600 seedlings showed a continuous upward trend, while the contents of other photosynthetic pigments exhibited an up-down-up trend under chilling stress. After 5 days of stress, its photosynthetic pigment contents were significantly (p < 0.05) higher than those of 0–3 days of chilling stress. Compared with before the stress, the increase in carotenoid content after 5 days of stress was the most pronounced, reaching 99.14%. After 1 day of chilling stress, the contents of chl a, T ch, and carotenoids in variety Reken628 decreased to the lowest values during stress, and the differences were significant (p < 0.05) compared with those before stress. After 3 days of stress, the content of chlorophyll b in variety Reken628 reached the lowest value during stress, but it was not significant (p < 0.05) compared with that after 1 day of stress. After 5 days of stress, all photosynthetic pigment contents in variety Reken628 reached the highest values during stress, except for chlorophyll a, which were significantly (p < 0.05) higher than those before stress. Especially, the content of carotenoid increased by 66.77% compared with that before stress. During the chilling stress process, the content of all photosynthetic pigments in variety GT1 showed a continuous upward trend. After 5 days of chilling stress, except for the chl a content, the differences in other pigment contents compared to before the stress reached a significant (p < 0.05) level. The increase in carotenoid content was the most obvious, reaching 73.93%.

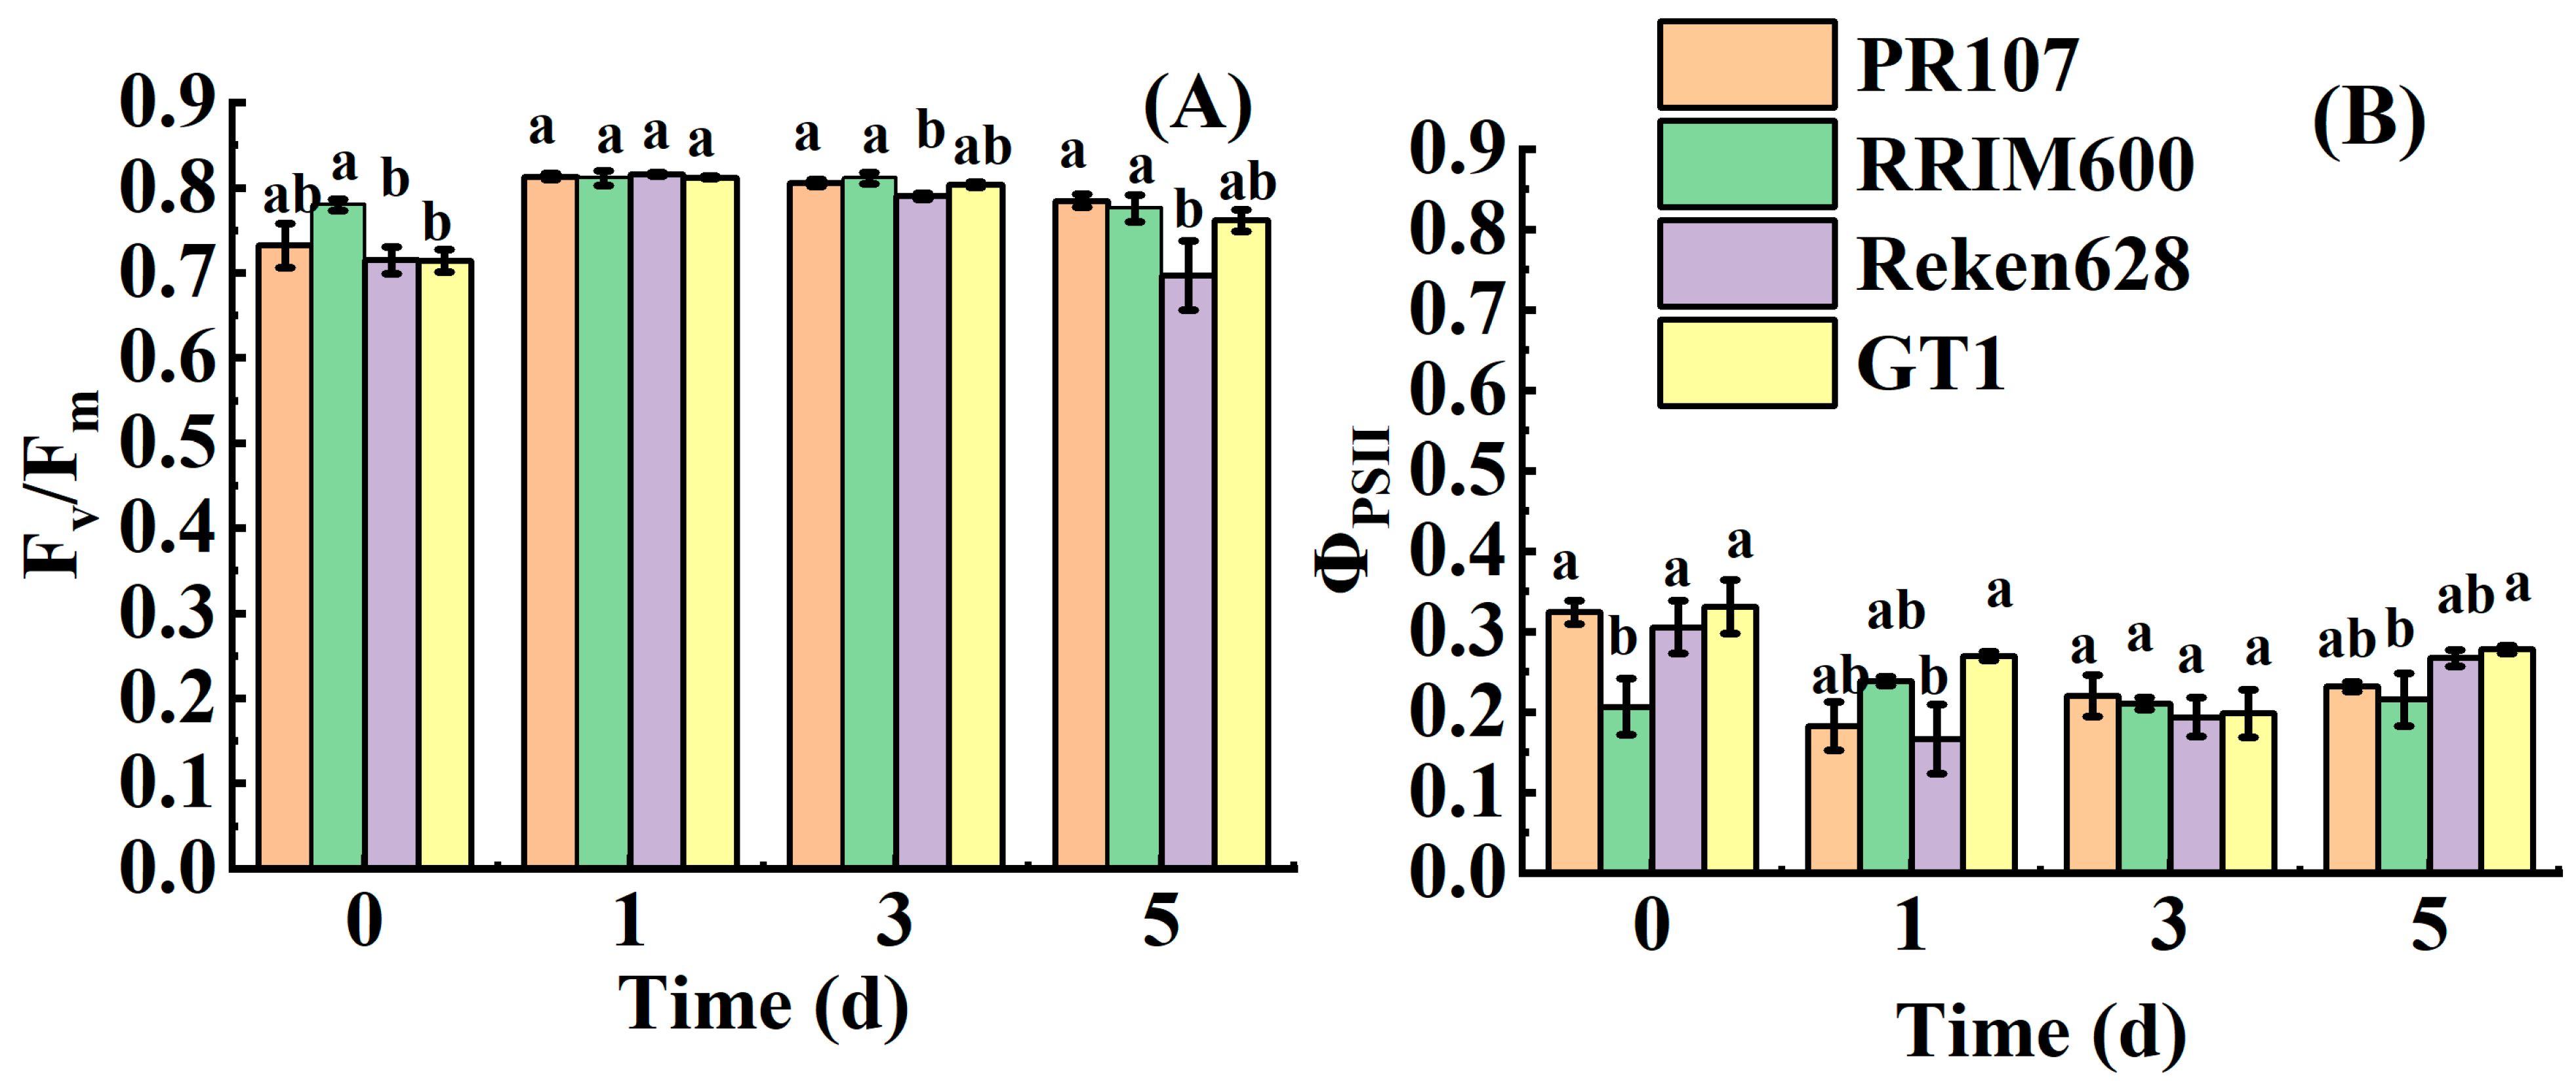
3.2. Effect of Chilling Stress on Fluorescence Parameters in Rubber Trees

After 1 day of chilling stress, the Fv/Fm values of variety PR107, variety RRIM600, variety Reken628, and variety GT1 increased by 11.09%, 4.04%, 14.14%, and 13.72%, respectively, compared to their pre-stress levels. However, these differences were not statistically significant (p < 0.05) among them (Figure 2A). After 3 days of chilling stress, the Fv/Fm value of variety RRIM600 slightly increased compared to that after 1 day of chilling stress, but those in variety PR107, variety Reken628, and variety GT1 slightly decreased by 0.93%, 3.14%, and 1.08%, respectively. In addition, the Fv/Fm value of variety Reken628 was lower than that of the other three varieties after 3 days of chilling stress, as the same statistical result was observed after 5 days of chilling stress. After 5 days of chilling stress, the Fv/Fm values in variety PR107, variety GT1 increased by 7.19% and 6.64%, respectively, while those in variety RRIM600 and variety Reken628 declined by 0.54%, 2.55%, respectively compared with them before chilling stress.
Before the chilling stress, the ΦPSII value in variety GT1 was notably higher than that in the other three varieties, but significant (p < 0.05) differences were only observed between variety GT1 and variety RRIM600 (Figure 2B). After 1 day of chilling stress, the decrease in ΦPSII values in variety PR107, variety Reken628, and variety GT1 were 43.73%, 45.53%, and 18.52%, respectively, compared with those before chilling stress. In contrast, the ΦPSII value in variety RRIM600 increased by 15.29%. The ΦPSII value in variety GT1 remained higher than that in the other three varieties after 1 day of stress exposure. Furthermore, after 3 days of chilling stress, the ΦPSII values in variety PR107 and variety Reken628 increased by 20.68% and 16.24%, respectively, while those in variety RRIM600 and variety GT1 decreased by 11.75% and 26.47%, respectively, compared to their values after 1 day of chilling stress, but there were no significant (p < 0.05) differences among them. After 5 days of chilling stress, the ΦPSII value in variety GT1 was higher than that in the other variety seedlings, with significant differences (p < 0.05) observed between variety GT1 and variety RRIM600.

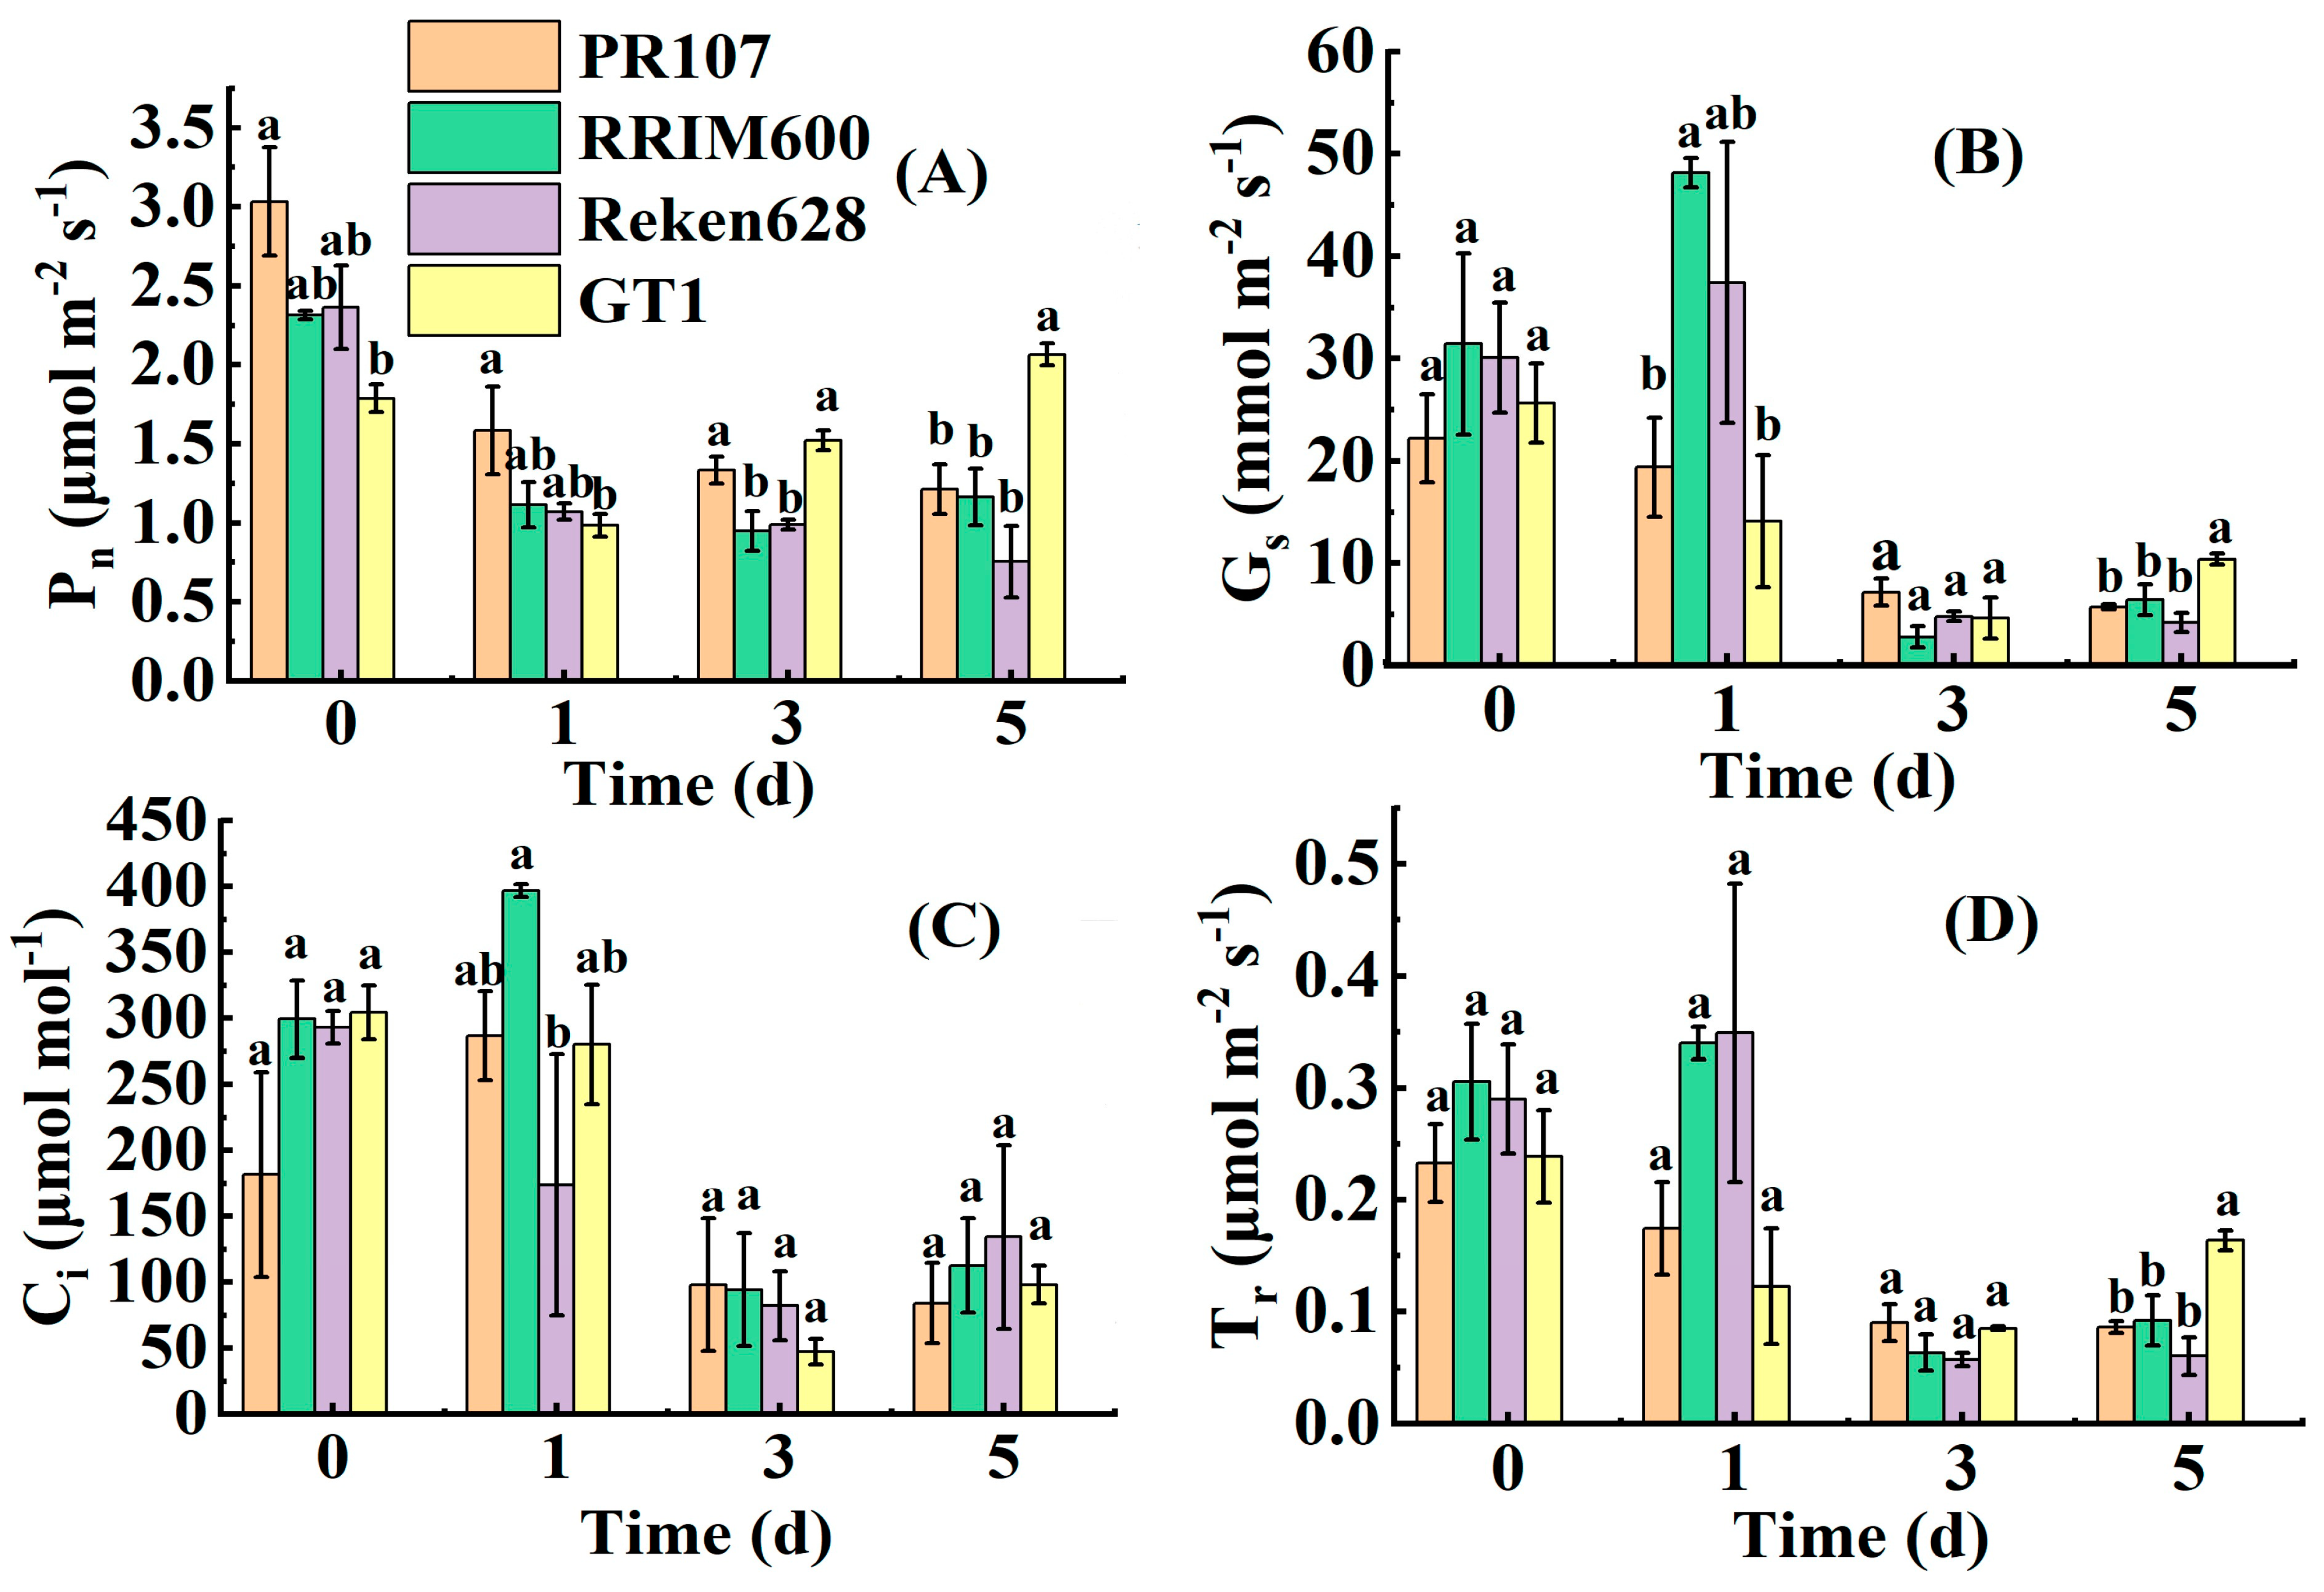
3.3. Impact of Continuous Chilling Stress on Photosynthetic Parameters in Rubber Trees

The leaf photosynthetic parameters, including the net photosynthetic rate (Pn), stomatal conductance (Gs), intercellular carbon dioxide concentration (Ci), and transpiration rate (Tr) values in variety PR107, variety RRIM600, variety Reken628, and variety GT1 seedlings, significantly decreased under the chilling stress. But these parameters exhibited varying trends (Figure 3). The Pn value in the seedlings declined after 1 day of chilling stress, compared with that before chilling stress. Figure 3A showed that the decline was least pronounced in variety GT1. After 3 days of chilling stress, the Pn value in variety GT1 seedlings gradually increased by 54.76%, whereas the Pn values in variety PR107, variety RRIM600, and variety Reken628 seedlings continuously decreased, accounting for 15.90%, 14.66%, and 7.81%, respectively, compared to their values after 1 day of chilling stress. After 5 days of chilling stress, the Pn values in variety RRIM600 and variety GT1 increased, but those in variety PR107 and variety Reken 628 continued to decrease. There were significant (p < 0.05) differences between variety GT1 and the other varieties. Compared with non-chilling stress, the Pn values in variety PR107, variety RRIM600, and variety Reken628 decreased by 60.02%, 49.72%, and 68.11%, respectively, while the Pn value in variety GT1 reached its maximum.
After 1 day of chilling stress, there was a clear increase in the Gs values of variety RRIM600 and variety Reken628, whereas the Gs values of variety PR107 and variety GT1 decreased (Figure 3B). A rapid decline of the Gs values was visible in variety PR107, variety RRIM600, variety Reken628, and variety GT1 (Figure 3B), accounted by 63.06%, 94.18%, 87.13%, and 67.04%, respectively, after 3 days of chilling stress, compared to the values recorded after 1 day of chilling stress. But there were no significant differences (p < 0.05) among them. The Gs values followed a similar pattern as the Pn values after 5 days of chilling stress. Compared with the Gs values before chilling stress, the values in variety PR107, variety RRIM600, variety Reken628, and variety GT1 were reduced by 74.12%, 79.49%, 85.93%, and 59.49%, respectively. Notably, the value of variety GT1 seedlings was significantly (p < 0.05) higher than that of the others after 5 days of chilling stress.
The Ci values in variety PR107 and variety RRIM600 showed an increasing trend, while those in variety Reken628, variety GT1, demonstrated a decreasing trend. Although the Ci value of variety RRIM600 was higher than the others, significant (p < 0.05) differences were only observed between variety RRIM600 and variety Reken628 after 1 day of chilling stress (Figure 3C). Under chilling stress, the Ci value of the seedlings in all varieties decreased as the duration of the stress increased. However, there were insignificant (p < 0.05) differences among them after 3 days of chilling stress. Compared with the Ci values after 3 days of chilling stress, those in variety RRIM600, variety Reken628, and variety GT1 showed an increasing trend, but those in variety PR107 showed a contrary change after 5 days of chilling stress. Later, the Ci values in variety PR107, variety RRIM600, variety Reken628, and variety GT1 were reduced by 53.67%, 62.35%, 54.20%, and 67.76%, respectively compared with those before chilling stress. There were insignificant (p < 0.05) differences among them.
The Tr values in various varieties followed a similar trend in alteration as the Gs values during the chilling stress phrase (Figure 3D). However, there were no significant (p < 0.05) differences among Tr values in different varieties after 1 day of chilling stress. As the duration of chilling stress was extended, the Tr value in variety GT1 was more pronounced than that in the other varieties. The differences in the Tr values were significant (p < 0.05) for variety GT1 compared to the other varieties after 5 days of chilling stress. Compared with Tr values in variety PR107, variety RRIM600, variety Reken628, and variety GT1 before chilling stress, the Tr values decreased by 62.87%, 69.81%, 79.21%, and 31.49%, respectively, after 5 days of chilling stress. The Tr values in variety GT1 showed a milder decline compared with those in the other varieties.

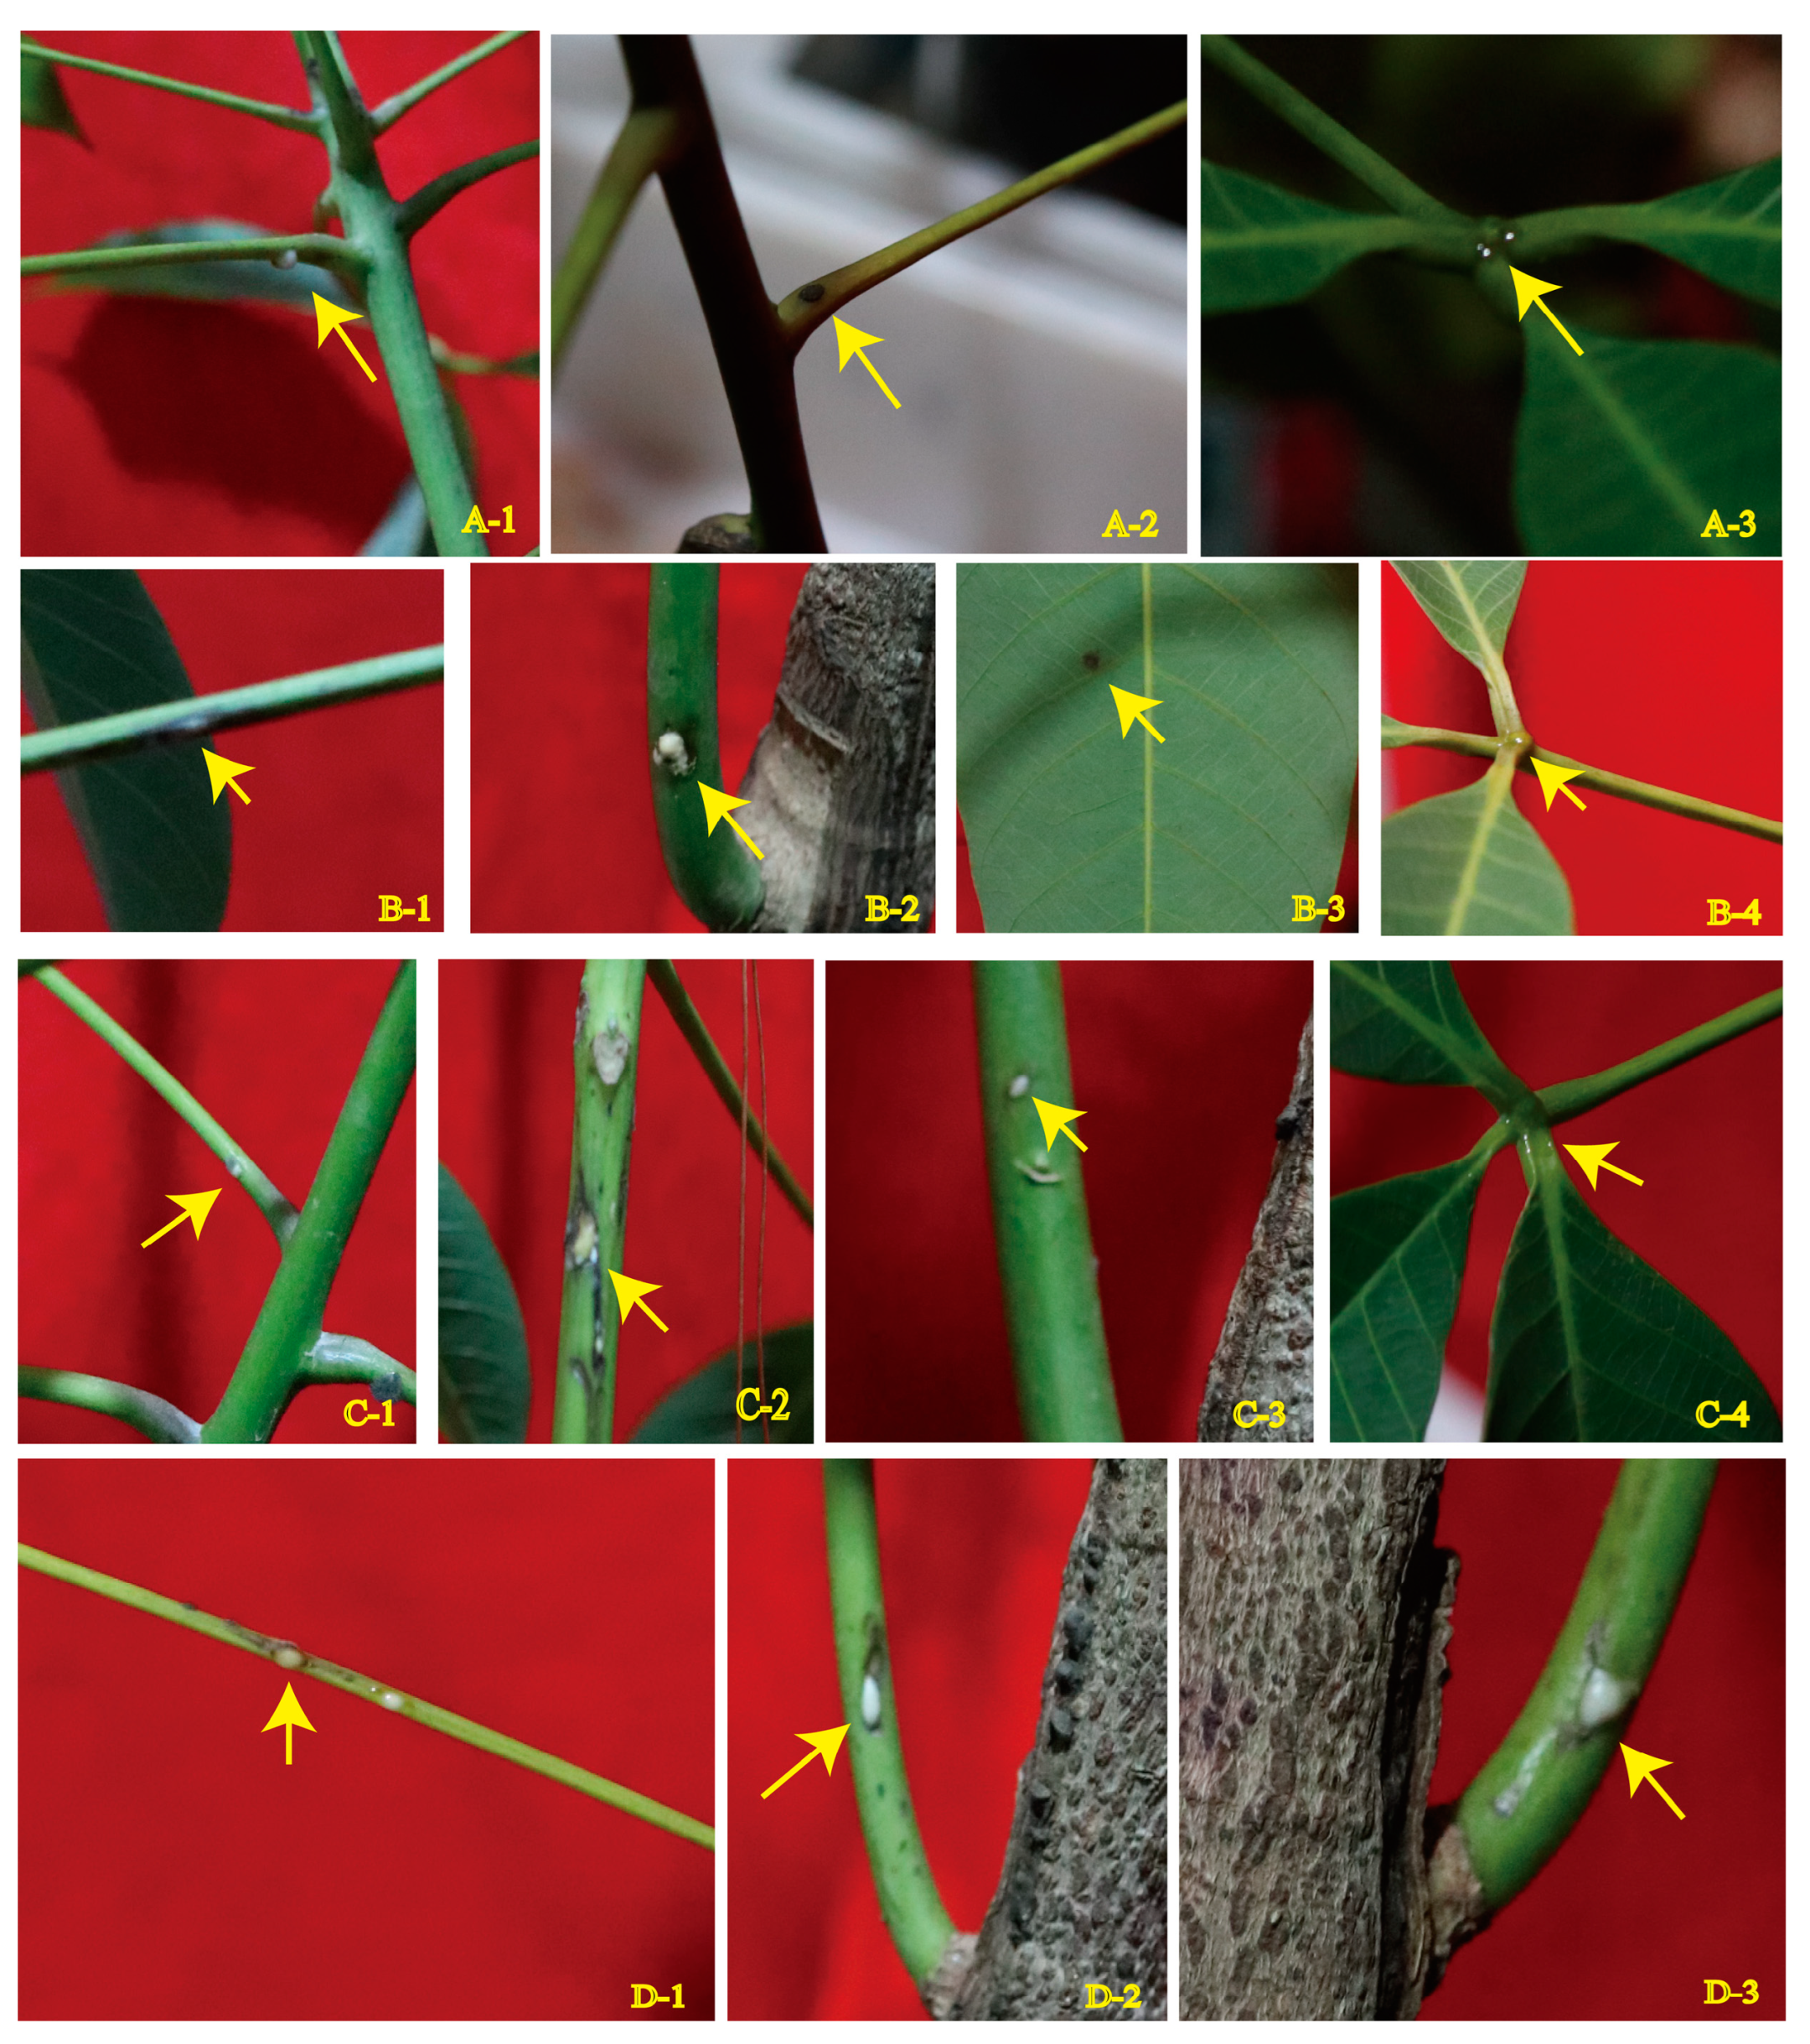
3.4. Latex Burst and Nectar Secretion Represented the Visual Damage of Chilling Stress

The syndrome of latex burst emerged in rubber tree seedlings after 3 days of chilling stress. Symptomatic seedlings exuded a small amount of latex on their petioles (Figure 4(A-1, A-2, B-1, C-1, D-1)), tender stems (Figure 4(B-2, C-2, C-3, D-2, D-3)), and leaf scars (Figure 4(C-2)). This was accompanied by the appearance of dark spots on the leaves (Figure 4(B-3)). The statistical data presented in Table 1 revealed variations in the manifestations of latex burst among different varieties. A stripped latex burst was evident in Reken628 (Figure 4(C-2)). Furthermore, the total area of latex burst in variety Reken628 seedlings was the most extensive, and the total number of latex-burst positions was the highest (Table 2). Interestingly, with the exception of variety GT1, the nectaries in all other varieties of rubber tree seedlings secreted nectar as the duration of chilling stress increased (Figure 4(A-3, B-4, C-4)).

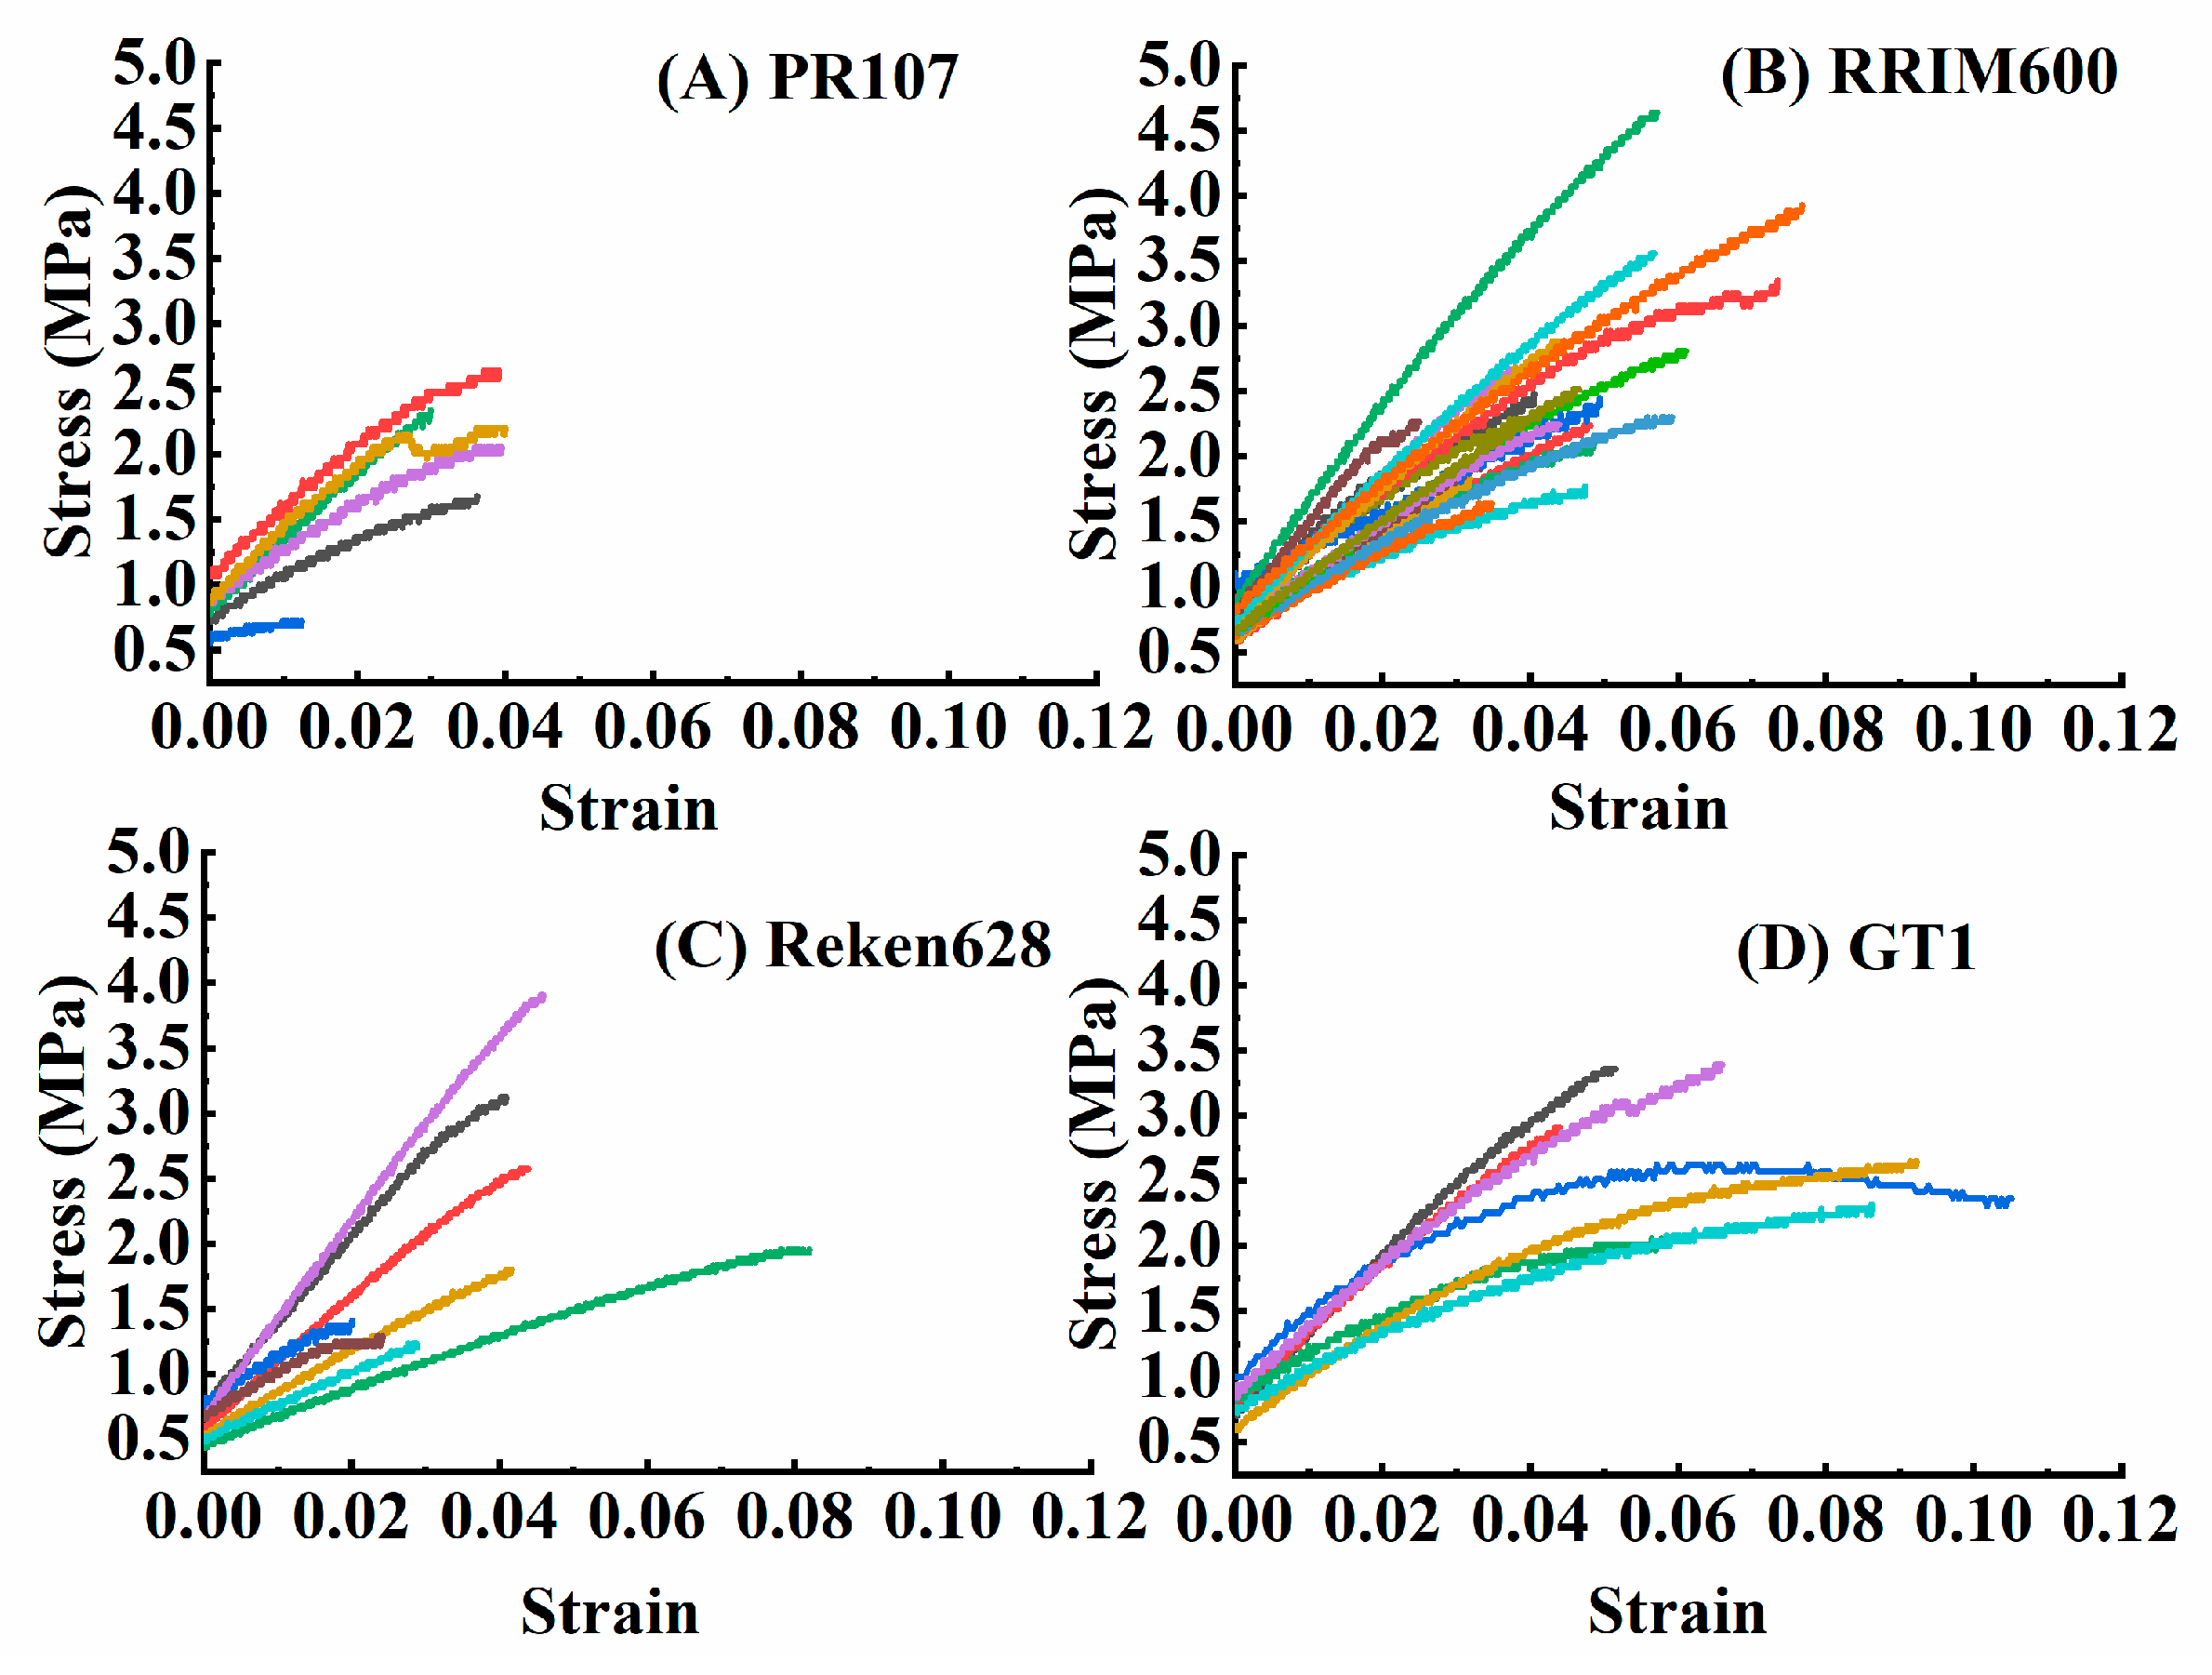
3.5. Different Tensile Properties in Barks of Different Rubber Tree Varieties

In total, six variety PR107 bark specimens, twenty two variety RRIM600 bark specimens, eight variety Reken628 bark specimens, and seven variety GT1 bark specimens were successfully tested and analyzed. The bark thickness of two-year-old twigs across these varieties is illustrated in Table 3. It can be seen that Reken 628 exhibited the significantly (p < 0.05) highest bark thickness (BT) value compared to the other varieties. Among them, the maximum load (ML) was observed to follow an order of variety Reken628 > variety GT1 > variety RRIM600 > variety PR107 with values of 10.7900 N, 10.5743 N, 9.8736 N, and 6.7783 N, respectively. It is important to note that the maximum load in variety PR107 was significantly (p < 0.05) lower than that in other varieties. The highest tensile strength was found in variety GT1 and the lowest in variety PR107. Both variety RRIM600 and variety Reken628 exhibited medium tensile strengths, but the significant (p < 0.05) differences in tensile strength were only observed between variety PR107 and variety GT1. Data analysis from Table 3 revealed that the elongation at break point (EBP) in variety GT1 was significantly (p < 0.05) higher than that in other varieties, with values of elongation at break point being 118.53%, 59.40%, and 52.20% greater than those in variety PR107, variety RRIM600, and variety Reken628, respectively. Figure 5 illustrates that bark samples from different varieties underwent deformation, and the strain in variety GT1 barks was greater than that in other varieties’ barks. According to Table 2, the Young’s modulus of variety RRIM600 barks was 13.25 MPa, 18.63 MPa, and 29.93 MPa greater than that of variety PR107, variety Reken628, and variety GT1 barks, respectively, but there were no significant (p < 0.05) differences among them.

3.6. Chemical Compositions Exhibited Diversities in Rubber Tree Barks of Different Varieties

The chemical compositions of the barks derived from the two-year-old twigs of different varieties of rubber trees are presented in Table 4. The chemical compositions varied in the barks of four varieties of rubber trees. In terms of pectin content, it was found to follow a sequence of variety RRIM600 > variety PR107 > variety GT1 > variety Reken628, with respective pectin contents of 16.50%, 13.40%, 7.94%, and 7.30%. Notably, the pectin content in RRIM600 barks was significantly (p < 0.05) higher than that in the other varieties. When compared with those in three other varieties, the cellulose content in variety GT1 barks was the lowest (p < 0.05), being 81.62%, 60.92%, and 89.03% lower than that in PR107, RRIM600, and Reken628, respectively. Furthermore, these differences were statistically significant (p < 0.05). The value rank of acid-insoluble lignin content in barks was similar to that of cellulose content. Analysis of acid-insoluble lignin content exhibited that the barks in variety GT1 had the lowest value of it, and there were significant (p < 0.05) differences between variety GT1, variety PR107, and variety Reken628. Concerning holocellulose content, barks of variety Reken628 displayed the highest (p < 0.05) amount compared with barks in the other three varieties, but there were significant (p < 0.05) differences among variety PR107, variety Reken628, and variety GT1.

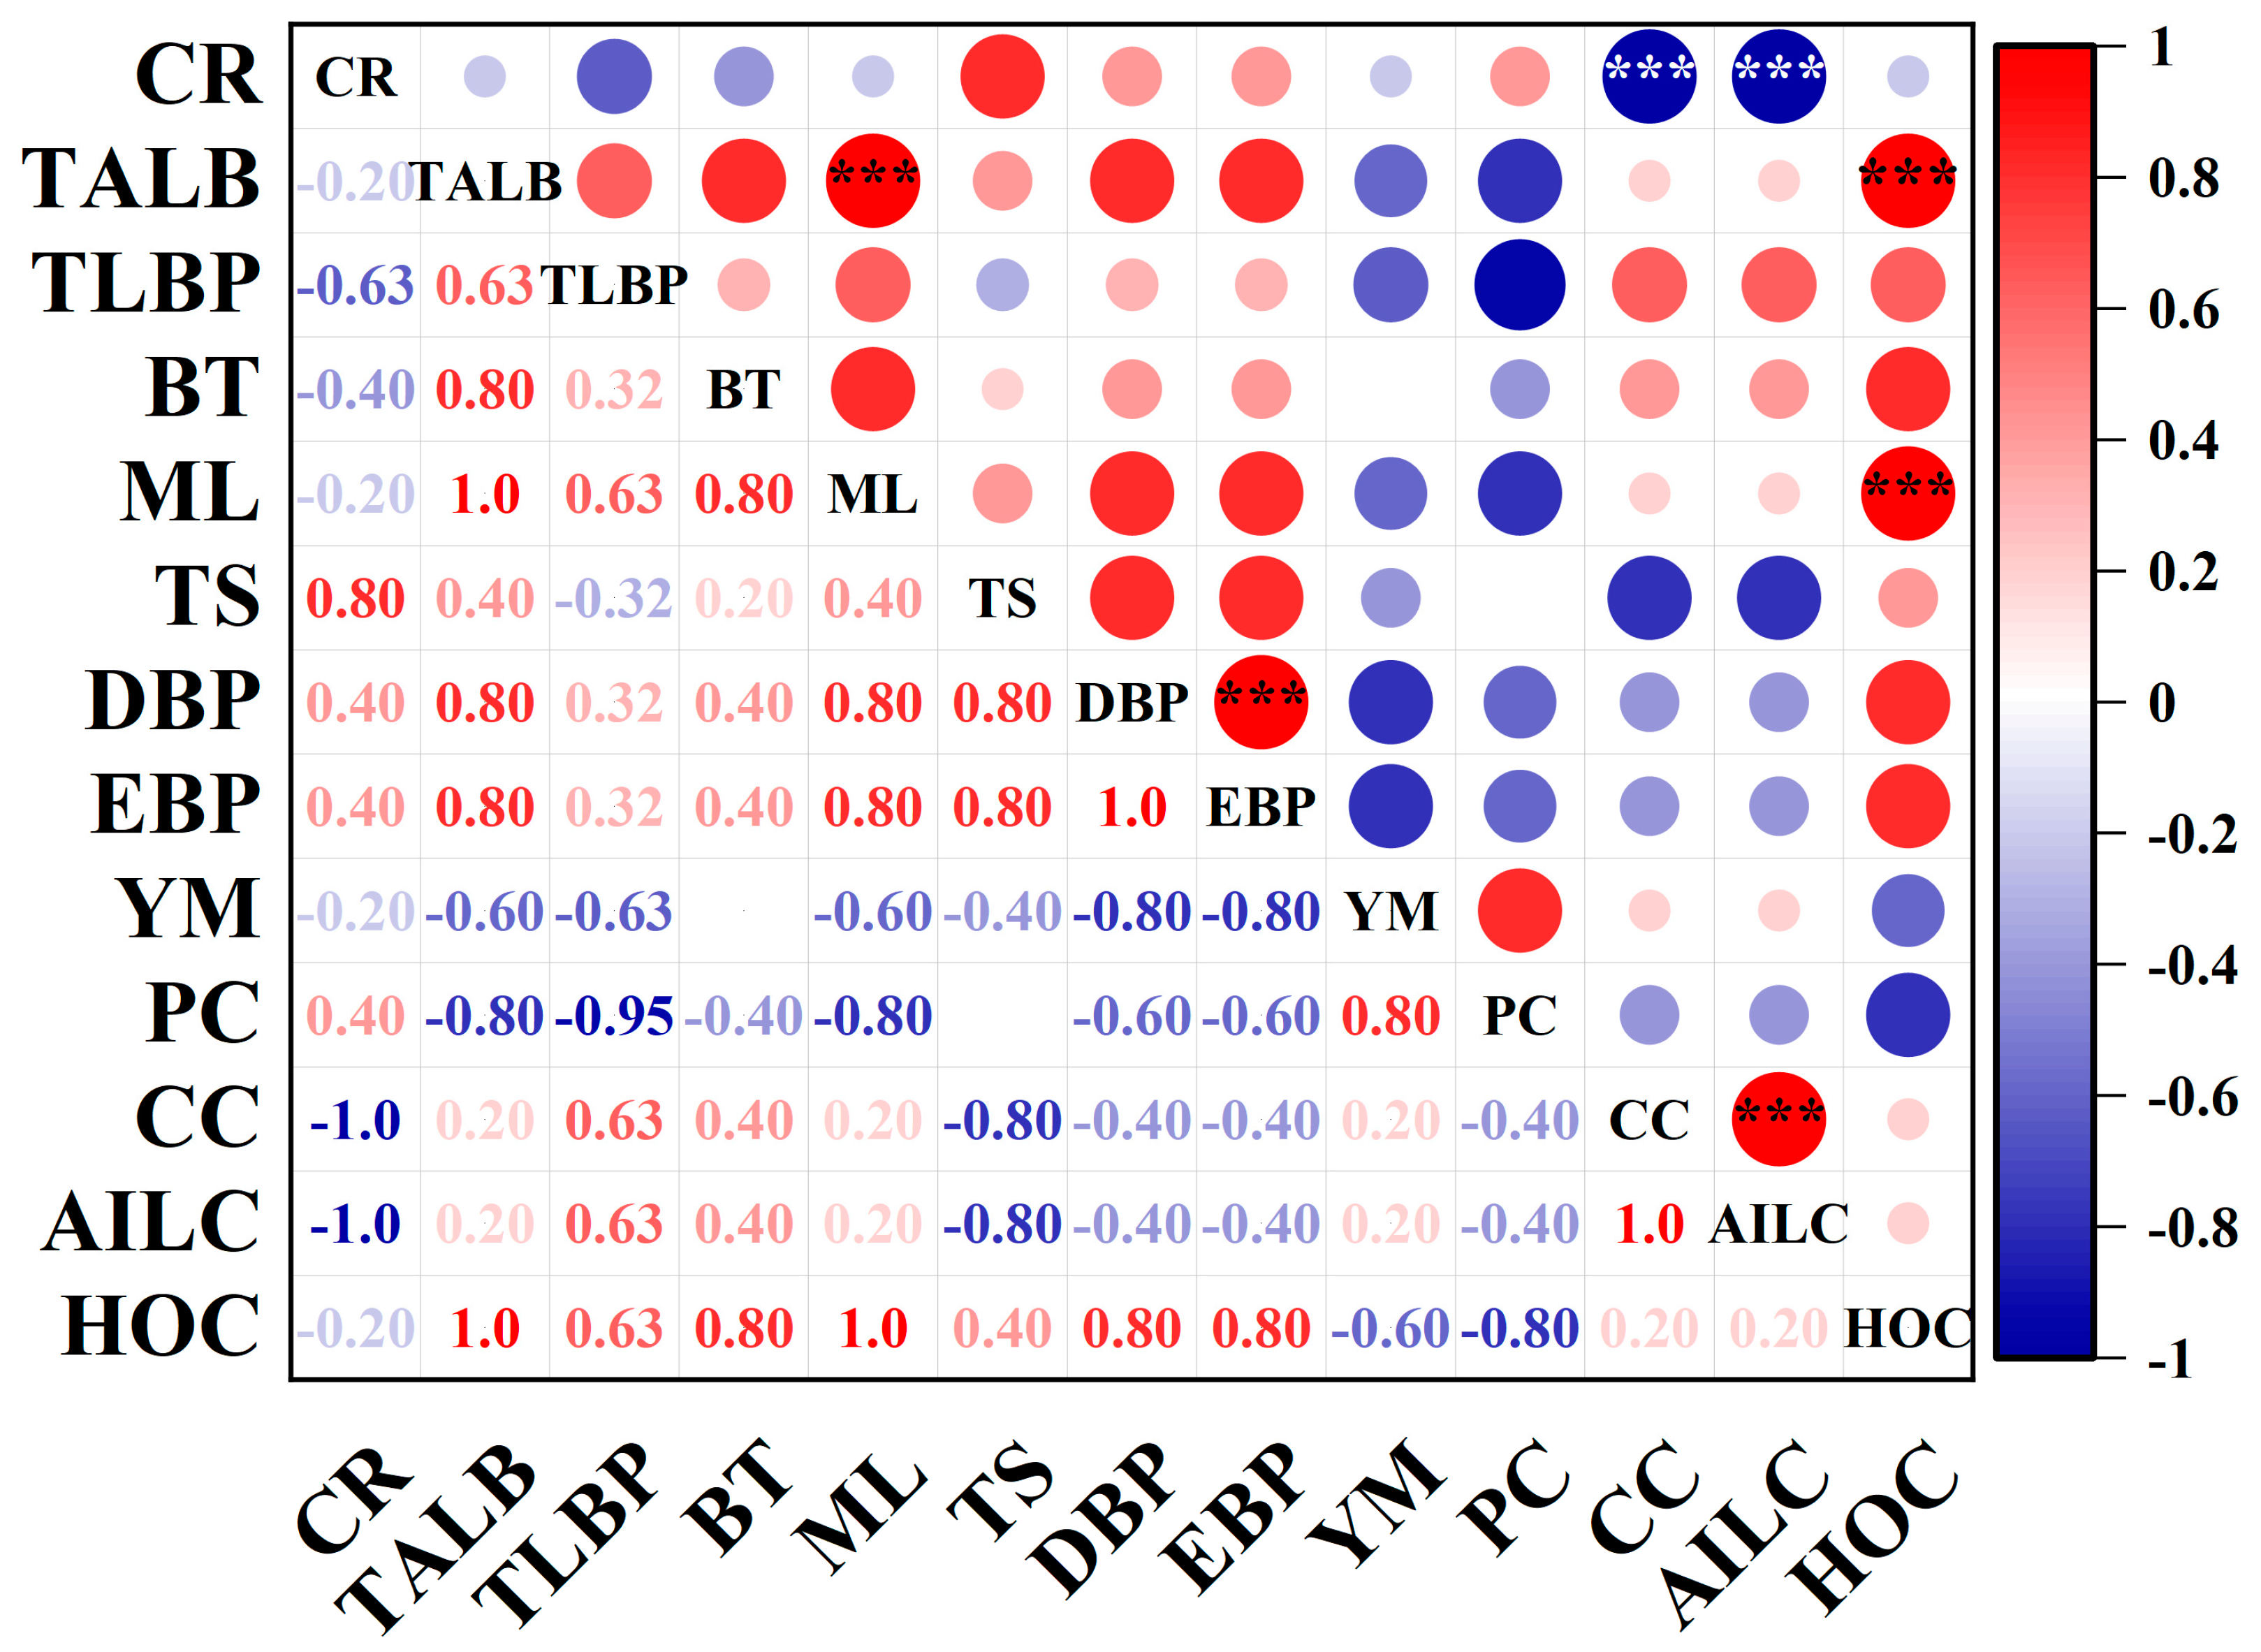
3.7. A Comprehensive Evaluation of Different Rubber Tree Varieties for Chilling Resistance

The fuzzy mathematical membership function method has been extensively used to evaluate the chilling resistance of plants, yielding satisfactory results. All physiological indicators were standardized for a comprehensive evaluation of chilling resistance using the chilling-resistance coefficient. The coefficients of each physiological indicator are presented in Table 5. The sum of these coefficients was then used to calculate the membership function values for various rubber tree varieties, which served as the standard for comparison and assessment of chilling resistance (Table 5). Then, the membership function values of each indicator were ranked based on their numerical values in Table 5. The total membership function values of variety PR107, variety RRIM600, variety Reken628, and variety GT1 were 0.1736, 0.3255, 0.0874, and 0.8524, respectively. This elucidated that the chilling resistance of the four varieties increased in the order variety Reken628 < variety PR107 < variety RRIM600 < variety GT1. Thus, variety GT1 was found to have the strongest chilling resistance compared with the other three varieties.
We computed the entropy values and weights for ten indicators using Equations (5)–(8). As presented in Table 6, the entropy value of Fv/Fm is the biggest, so the weight of this indicator is the minimum, indicating that the difference in Fv/Fm among varieties is small. And vice versa. Based on Equations (8) and (9), we could ultimately derive the combination weights of various indicators and the comprehensive evaluation values of cold resistance for each variety. The rank is consistent with those calculated by the membership function method (Table 7).
The comprehensive evaluation value was used as the chilling-resistance property in each variety, and it was integrated with latex burst data, bark physical properties, and their chemical components to construct a Spearman correlation matrix (Figure 6). This facilitated the determination of relationships among these variables. The results revealed that chilling resistance was strongly (p < 0.001) negatively correlated with both cellulose content and acid-insoluble lignin content, respectively. The total area of latex burst was significantly (p < 0.001) and positively correlated with holocellulose content and maximum load, respectively. The maximum load demonstrated a high (p < 0.001) positive correlation with holocellulose. Both displacement at the break point and elongation at the break point exhibited strong (p < 0.001) positive correlations with each other. Furthermore, there were strong (p < 0.001) correlations between cellulose and acid-insoluble lignin content.

4. Discussion

Global warming has resulted in increased climate instability and a higher frequency of extreme weather events, which have continuously negatively impacted agricultural productivity and crop yield over the past decades [23]. The escalating frequency of these extreme climates is causing a marked increase in severe cold damage to rubber trees, posing a significant challenge to natural rubber production. Global warming accelerates the phenological progression of rubber trees, thereby exposing them to sudden cold damage. Moreover, the risk of suffering cold damage has increased due to the northward acclimatization of the cultivation of rubber trees by global warming. Therefore, it is crucial to investigate the variations in chilling resistance and the impact of low temperatures on latex burst among different varieties of rubber trees. It is useful for the implementation of chilling-resistance cultivation measures and research on the mechanism.

4.1. Changes in Photosynthetic Pigment Content and Photosynthetic Capacity of Rubber Tree Seedlings in Response to Chilling Stress

Photosynthesis in plants is acutely sensitive to environmental temperatures and relies on factors such as chlorophyll pigment content, chlorophyll fluorescence, and photosynthetic parameters [24]. The chlorophyll pigment content is usually employed as an indicator of chloroplast development and photosynthetic capacity [25,26]. Chilling stress accelerates the decomposition of chlorophyll in leaves, impairs the synthesis substrate for chlorophyll, and consequently leads to a reduction in leaf chlorophyll pigment content [27]. In the current study, both chl a and T chl contents were found to be higher under 5 days of chilling stress conditions compared with those before the chilling stress. These findings align with our previous research and are consistent with observations in seedlings of other tree species [28]. It is possible that the alternations in endogenous hormone levels, signal transduction, and physiological response regulation in rubber tree seedlings are driven by the chilling stress [29]. Woody plants exhibit a certain degree of chilling resistance, which is influenced by prior chilling acclimation, and their genetic types play an important role in determining this resistance determination. Upon exposure to chilling stress, these plants activate their defense systems and increase chlorophyll contents to offset the reduction in chlorophyll contents caused by chloroplast injury [28]. Low-temperature stress results in the production of an excessive amount of reactive oxygen species (ROS), which have toxic effects on chlorophyll pigment contents [30]. Furthermore, ROS produced under low temperatures can specifically inhibit translation processes within the chloroplast [31]. Chlorophyll b (chl b) is particularly sensitive to chilling stress and is easily degraded [30]. Thus, the chl b content in rubber tree seedings experienced the most significant reduction after 5 days of chilling stress. When plants are subjected to multiple abiotic stresses, there has been a reported increase in carotenoid biosynthesis [32]. The influence of temperature on carotenoid metabolism in horticultural plants has been extensively researched [33,34]. Notably, variations in catenoid content across different tissues, development stages, or varieties can be significant at low temperatures [35]. For example, the accumulation of carotenoid content in specific banana cultivars [36] and the pulp of navel oranges [34] has been observed under conditions of low-temperature storage. Moreover, a treatment of sweet osmanthus petals at a low temperature (15 °C) resulted in an increase in carotenoid content [37]. Carotenoids have been associated with photoprotection against chlorophyll oxidation (ROS) in photosystems and light-harvesting complexes [38]. In an experiment involving avocado seedlings, carotenoid accumulation in leaves was greater under a −5 °C temperature treatment compared to those under 1 °C and −2 °C [39]. Similarly, the chilling stress significantly increased the carotenoid content in the leaves of rubber tree seedlings. These findings suggest that seedlings may be more sensitive to chilling stress than mature plants.
The parameters of chlorophyll fluorescence serve as indicators of light energy absorption and utilization in plant leaves. Therefore, the analysis of these parameters provides a useful technique for assessing the functionality of photosystem II (PSII) and chloroplasts [40,41]. Chilling stress suppresses the activity of PSII by diminishing photosynthetic efficiency [42]. In a study involving Arabidopsis leaves, those exposed to 4 °C treatment exhibited higher Fv/Fm values compared to those maintained at 22 °C/16 °C conditions after being placed in a cooling device, but there were no significant (p < 0.05) differences among them [43]. As our results in rubber tree seedlings showed, the reaction centers of PSII in leaves demonstrated some degree of chilling resistance during the initial stages of the chilling stress. As the duration of the stress increased, there was a decrease in photosynthetic efficiency and suppression of the photosynthetic electron transport rate of PSII, leading to damage to the reaction center of PSII. Ultimately, this resulted in an obstruction of PSII activity. In the current study, we observed a gradual decrease in both Fv/Fm and ΦPSII in rubber tree seedlings subjected to chilling stress. The chilling-resistance variety exhibited less susceptibility to photoinhibition under low-temperature treatment. The maize variety Gurez, which is tolerant to low temperatures, has a lower photochemical efficiency of PSII (Fv/Fm) compared to the low-temperature-sensitive variety GM6. This typically leads to an increase in thermal energy dissipation [44], highlighting the inherent resistance of low-temperature-tolerant genotypes to sustained photoinhibition damage. In the experiment, the Fv/Fm value in variety GT1 was lower than that in variety PR107 and variety RRIM600 after 5 days of chilling stress, corroborating the aforementioned research perspectives. The magnitude of decrease in ΦPSII in the cold-sensitive plant cultivar at low temperatures was greater than that in the cold-tolerant variety, indicating that the cold-tolerant variety experienced less photoinhibition under those conditions [45]. The reduction in light energy utilization efficiency at low temperatures is associated with an internal increase in stress stimulation, implying a general degradation of the photosynthetic electron transmission chain [46]. On the other hand, the damaged chloroplasts contribute to the decrease in the efficiency of photosynthetic electron transport and inhibition of PSII following exposure to chilling stress. Consequently, light energy is then converted into thermal energy, which the seedings dissipate through thermal energy dissipation [47]. During the period of chilling stress, the ΦPSII values in variety GT1 remained high, indicating that the PSII of variety GT1 experienced less photoinhibition and that the light energy absorption of PSII photochemistry remained relatively stable under these conditions.
Low-temperature conditions exacerbate the imbalance between light energy absorption by the photosystem and plant metabolism, adversely affecting electron transduction, the Calvin cycle, and stomatal conduction. These conditions necessitate that plants adjust to reach a new balance for their growth and development [48]. Previous studies indicated that both stomatal and non-stomatal factors contribute to a reduction in photosynthetic rate. Stomata, as the conduits for carbon and water exchange between plants and their environment, provide an indication of plant metabolic function and are critical indexes of chilling stress [49]. The stomatal conductance (Gs) is not the sole limiting factor for photosynthetic rate. Other non-stomatal limiting factors that may constrain the photosynthetic rate include changes in photosynthetic pigment content, Rubisco content and activity, and photosynthetic assimilation [50]. In a one-day process of chilling stress, both net photosynthesis (Pn) and Gs in variety PR107 seedlings decreased, while intercellular CO2 concentration (Ci) increased. This is attributed to non-stomatal factors impeding CO2 utilization, leading to CO2 accumulation. This included changes in photochemical activity, Rubisco content and activity, inorganic phosphate, and photosynthetic assimilation. In contrast, Pn in RRIM600 decreased, but Ci, Gs, and transpiration rate (Tr) in variety RRIM600 increased simultaneously. Here, the non-stomatal factors were identified as the primary restriction. As illustrated in Figure 1, alterations in the photosynthetic pigment content of RRIM600 may have enhanced these values. In Reken628 seedlings, both Gs and Tr exhibited consistent increasing trends, while Pn and Ci in them decreased concurrently. This suggests that stomatal conductance is not a primary limiting factor for Pn. It is likely that the activity of enzymes involved in photosynthesis was inhibited [51]. As depicted in Figure 3, Pn in GT1 seedlings was equivalent to Gs, Ci, and Ti. Stomatal closure resulted in insufficient CO2, leading to photosynthetic inhibition in variety GT1 seedlings. During the 2–3 day chilling stress process, Pn, Gs, Ci, and Tr in variety PR107, variety RRIM600, and variety Reken628 seedlings decreased simultaneously. However, Pn in GT1 seedlings showed a slight recovery. To prevent excessive dehydration and chilling injury to leaves under low-temperature stress, plants typically reduce the degree of openness or ultimately close their stomata to avoid transpiration and water loss. The decline rate of Gs was more pronounced in the cold-sensitive cultivars than in the cold-resistant cultivars under aggravated chilling stress [51]. This phenomenon was also observed in the rubber tree seedlings. During a 4–5 day period of chilling stress, we noted an increase in Pn in both variety GT1 and variety RRIM600 seedlings. This rise can be attributed to the early exposure to chilling stress, which prompted the development of new coping strategies such as increased photosynthetic pigment content, heightened activity of enzymes involved in photosynthesis, and improved functionality of the chloroplast and photosystem to adapt to the new environment [51]. Afterwards, these seedlings gradually enhanced their ability to carry out photosynthesis under chilling stress. Furthermore, the decline in Gs in variety GT1 seedlings was less than that in other varieties compared with those before chilling stress. This could be due to the suppression of Tr in the leaves of variety GT1 rubber trees through metabolic regulatory pathways, which involve modulations in water transport channels, hormone levels, and signal transduction pathways [52]. In variety PR107 seedlings, Pn and Gs declined simultaneously, and Ci correspondingly decreased. Therefore, the decrease in Pn in variety PR107 seedlings may be due to the destruction of the balance between Gs and Ci [53]. The decline in Pn in variety Reken628 is likely attributed to impaired dark reactions [54], rather than stomata closure, as evidenced by the different dynamics of photosynthetic rate and stomatal conductance (Figure 3A,B).

4.2. Chilling Stress-Induced Bark Latex Burst and Nectar Secretion in Rubber Tree Seedlings

Rubber trees, subjected to various forms of cold damage, typically present symptoms indicative of harm. These include withered branches and leaves, black spots on the trunk, and latex burst across different sections of the tree’s body. Historically, mature rubber trees have frequently shown latex burst due to chilling stress. However, instances of latex burst in rubber tree seedlings are not commonly documented. Nonetheless, one-year-old seedlings have been observed to exhibit latex burst on their petioles and stems under conditions of chilling stress. In our prior research, we observed a significant negative correlation between the total number of latex burst positions in rubber tree seedlings and their chilling resistance [55]. Conversely, the total area of latex burst exhibited a weak correlation with the same trait. These findings are likely attributable to factors such as latex yield, dry rubber content, total solid content, the duration of latex flow, latex volume, and the number of laticifer rows present in various parts of the seedlings. In the current study, variety GT1 emerged as the most resistant variety. However, it did not exhibit the fewest number of latex-burst positions or the smallest total area of latex burst.
Although rubber trees possess both floral and extrafloral nectaries, the primary source of nectar secretion is from the extrafloral nectaries situated at the glandular points above the petiolule apex [10]. During honey production, bees exclusively gather nectar from these petiolule nectaries [2]. While all flowering rubber trees can secrete nectar from their petiolule nectaries, not all rubber trees with this secretion are flowering. This suggests that while flowering is an important indicator, it is not the sole determinant of petiolule nectar secretion. In our study, we observed nectar secretion in the nectaries of rubber tree seedlings under chilling stress, indicating an activation of their chilling-resistance mechanisms. Previous reports have noted that nectar secretion in mature rubber trees susceptible to wind or cold damage has been reported [56]. However, our observations revealed nectar secretion in one-year-old rubber tree seedlings. It is important to note that the ability to secrete nectar varies among different rubber tree varieties; hence, we did not observe visible nectar secretion in variety GT1 seedlings.

4.3. Bark Physical Properties, Chemical Components Were Correlated with Chilling Resistance and Latex Burst in Rubber Tree Seedlings

No singular indicator or mechanism can accurately assess the chilling resistance of plants, given that the variation patterns of identical indicators among different varieties of the same species are not entirely consistent. Utilizing a single physiological indicator to evaluate the cold resistance between varieties may result in a lack of objectivity. Meanwhile, the characteristic of cold resistance is complex and quantitative in rubber trees. Different varieties of rubber trees exposed to varying types of cold damage exhibit significant manifestations of harm [10]. The combination weighting method effectively circumvents the limitations of single weight calculation techniques, offering a more objective and comprehensive reflection of each indicator’s significance [22]. In this study, we employed this method to conduct a thorough evaluation of the cold resistance among four rubber tree varieties. The comprehensive evaluation value (D) served as the benchmark for a comparative analysis of the chilling resistance; a higher D value indicated greater resistance to chilling stress in the respective rubber tree variety. Our findings revealed that variety GT1 exhibited the most robust chilling resistance, while variety Reken628 demonstrated the weakest.
The mechanical properties of barks are primarily determined by their chemical compositions [57]. The amalgamation of individual fibers into fiber pairs markedly augments their biophysical properties, including tensile strength and Young’s modulus. When this enhanced biophysical behavior is extended to the entire bark structure, it most likely confers a beneficial response during and following mechanical action. Key determinants of bark tensile properties include the high cell wall content of the bark fibers, the method of connection between adjacent fibers, and the alignment of fibers within interwoven layers [58]. It is noteworthy that the composition of the cell wall may vary across organs, tissues, species, and even different developmental stages. Cellulose, an abundant linear homopolysaccharide, forms the directional organization of rigid cellulose microfibrils and serves as the main-bearing structure [59]. An increase in bark thickness amplifies the maximum tensile load of the bark [57]. As demonstrated in Table 3, the bark thickness in variety Reken628 was significantly greater than that in other varieties, with the maximum load in this variety being the highest. The tensile strength improved as fiber loading increased. The enhanced tensile properties of the barks are responsible for their increased tensile strength. However, an increase in cellulose content may lead to poor adhesion, potentially resulting in a reduction in tensile properties [60]. Therefore, the cellulose content of variety GT1 bark was found to be the lowest among all varieties, yet it exhibited the highest tensile strength. This observation aligns with Bjurhager’s report that a reduction in lignin content results in a slight but significant decrease in tensile stiffness [61]. As demonstrated in Table 4, the acid-insoluble lignin content and Young’s modulus value were both lowest in variety GT1 bark (Table 3). Pectin, particularly abundant in the middle lamella, plays an essential role in regulating wall properties and adjusting wall extensibility by affecting the alignment of cellulose microfibrils [62]. In the context of wood, initial deformation under constant loading is elastic. However, as the duration of this constant-loading increases, the nonelastic components begin to respond, leading to a decrease in the elastic component [58]. When barks are subjected to a critical strain level, the fibers may lose contact due to relatively weak intercellular adhesion, resulting in the disruption of cell-to-cell bonding and tissue failure [63]. On the other side, the presence of more flaws, barks can trigger rapid failure in tensile tests [64]. Among the rubber tree varieties studied, variety GT1 barks exhibited the highest elongation, indicating superior flexibility, but also the weakest rigidity, as evidenced by the stress–strain curve in Figure 5.

5. Conclusions

In summary, our results showed the chilling stress caused significant differences in latex burst and nectar secretion among one-year-old rubber tree seedlings. Chilling resistance and latex burst status were positively correlated with the chemical compositions of two-year-old twig barks corresponding to each variety. Moreover, the latex burst status was negatively correlated with the tensile property of the barks, as determined by a multivariate analysis of the experimental data. These findings suggested that chemical compositions and biophysical properties play roles in chilling resistance and latex-burst characteristics. Therefore, these factors warrant attention in future endeavors. Nonetheless, additional investigations are necessary to elucidate the roles and mechanisms of nectar secretion in the latex-burst characteristics of rubber trees subjected to chilling-stress conditions. Furthermore, it would be interesting to broaden this study to encompass the physiological metabolism, biochemical, and molecular mechanisms underlying latex burst in rubber trees under chilling stress.

Author Contributions

Conceptualization, F.A., L.C. and G.X.; methodology, L.C. and H.J.; validation, L.C., W.P. and L.Z.; formal analysis, L.C., H.J. and W.P.; investigation, L.C.; resources, F.A., L.C. and J.W.; data curation, L.C. and H.J.; writing—original draft preparation, L.C.; writing—review and editing, L.C. and F.A.; visualization, L.C.; supervision, F.A. and L.C.; project administration, F.A. and L.C.; funding acquisition, G.X., F.A. and L.C. All authors have read and agreed to the published version of the manuscript.

Funding

This research was funded by the Hainan Provincial Natural Science Foundation of China, grant number 321QN332 and the Earmarked Fund for China Agriculture Research System, grant number CARS-33-ZP1. The APC was funded by CARS-33-ZP1.

Data Availability Statement

The data that support the results of the study are available on reasonable request from the corresponding authors.

Acknowledgments

We would like to express our gratitude to Jian Chen and Xinlong Wang for their contribution to grafting and carefully nurturing the rubber tree seedlings. The varieties of mature rubber trees were identified and provided by help of Yanshi Hu and employees of the National Tropical Plants Germplasm Resource Center—Rubber Tree. Many thanks to all of them. In addition, we would like to thank Lingling Wang for her guidance and assistance in the manuscript submission process. We are also grateful to Dingquan Wu for the help in pruning and collecting the two-year-old twigs.

Conflicts of Interest

The authors declare no conflicts of interest.

References

  1. Campos, M.C.; Boatwright, L.; da Silva, C.C.; Scaloppi, E.J.; de Souza, G.P.; Barbazuk, W.B.; Pereira, D.S.A. Deep expression analysis reveals distinct cold-response strategies in rubber tree (Hevea brasiliensis). BMC Genom. 2019, 20, 455. [Google Scholar]
  2. Priyadarshan, P.M. Biology of Hevea Rubber, 2nd ed.; Springer International Publishing AG: Cham, Switzerland, 2017; p. 139, p. 134, p. 215. [Google Scholar]
  3. Long, X.; Lu, J.; Kav, N.V.K.; Qin, Y.; Fang, Y. Identification and evaluation of suitable reference genes for gene expression analysis in rubber tree leaf. Mol. Biol. Rep. 2020, 47, 1921–1933. [Google Scholar] [CrossRef] [PubMed]
  4. Gan, P.; Liu, F.; Li, R.; Wang, S.; Luo, J. Chloroplasts—Beyond energy capture and carbon fixation: Tuning of photosynthesis in response to chilling stress. Int. J. Mol. Sci. 2019, 20, 5046. [Google Scholar] [CrossRef] [PubMed]
  5. Zhai, D.; Wang, J.; Thaler, P.; Luo, Y.; Xu, J. Contrasted effects of temperature during defoliation vs. refoliation periods on the infection of rubber powdery mildew (Oidium heveae) in Xishuangbanna, China. Int. J. Biometeorol. 2020, 64, 1835–1845. [Google Scholar] [CrossRef] [PubMed]
  6. Lai, S.; Wang, J.; Fu, Y.; Duan, B.; Hongchang, A.; Zhang, L.; Tarno, H. Infestation of platypodine beetles (Coleoptera: Curculionidae) on rubber trees in China. Coleopt. Bull. 2020, 74, 626–631. [Google Scholar] [CrossRef]
  7. Hiremath, S.R.; Prathapan, K.D. First report of the invasive south American pinhole borer, Euplatypus parallelus (Fabricius) (Coleoptera: Curculionidae: Platypodinae), on rubber in India. Coleopt. Bull. 2019, 73, 714–717. [Google Scholar] [CrossRef]
  8. Rodríguez, C.S.; Cognato, A.I.; Righi, C.A. Bark and ambrosia beetle (Curculionidae: Scolytinae) diversity found in agricultural and fragmented forests in Piracicaba-SP, Brazil. Environ. Entomol. 2017, 46, 1254–1263. [Google Scholar] [CrossRef] [PubMed]
  9. Hao, B.; Wu, J. Laticifer differentiation in Hevea brasiliensis: Induction by exogenous jasmonic acid and linolenic acid. Ann. Bot. 2000, 85, 37–43. [Google Scholar] [CrossRef]
  10. He, K.; Huang, Z. Rubber Culture in the Northern Part of Tropical Area, 1st ed.; GuangDong Science & Technology Press: GuangZhou, China, 1987; p. 114, p. 122, pp. 379–382. [Google Scholar]
  11. Petrova, A.; Gorshkova, T.; Kozlova, L. Gradients of cell wall nano-mechanical properties along and across elongating primary roots of maize. J. Exp. Bot. 2021, 72, 1764–1781. [Google Scholar] [CrossRef]
  12. Chanliaud, E.; Burrows, K.M.; Jeronimidis, G.; Gidley, M.J. Mechanical properties of primary plant cell wall analogues. Planta 2002, 215, 989–996. [Google Scholar] [CrossRef]
  13. Hu, J.Q.; Qi, Q.; Zhao, Y.; Tian, X.; Lu, H.; Gai, Y.; Jiang, X. Unraveling the impact of Pto4CL1 regulation on the cell wall components and wood properties of perennial transgenic Populus tomentosa. Plant Physiol. Biochem. 2019, 139, 672–680. [Google Scholar] [CrossRef] [PubMed]
  14. Gigli-Bisceglia, N.; Engelsdorf, T.; Hamann, T. Plant cell wall integrity maintenance in model plants and crop species-relevant cell wall components and underlying guiding principles. Cell. Mol. Life Sci. 2020, 77, 2049–2077. [Google Scholar] [CrossRef]
  15. Roig-Oliver, M.; Fullana-Pericàs, M.; Bota, J.; Flexas, J. Adjustments in photosynthesis and leaf water relations are related to changes in cell wall composition in Hordeum vulgare and Triticum aestivum subjected to water deficit stress. Plant Sci. 2021, 311, 111015. [Google Scholar] [CrossRef] [PubMed]
  16. Gao, J.F. Experimental Guidance for Plant Physiology; Higher Education Press: Beijing, China, 2006; pp. 74–76. [Google Scholar]
  17. Cheng, L.; An, F.; Xie, G.; Jiang, H.; Wang, J.; Peng, W.; Zhou, L. Cold resistance of Hevea brasiliensis based on phloem fiber morphology and bark tensile properties. J. Northwest For. Univ. 2023, 38, 47–54. [Google Scholar]
  18. GB/T 10742-2008; Raw Fiber Material—Determination of Pectin Content. Standards Press of China: Beijing, China, 2008.
  19. Wang, L.; Cheng, C. Determination the content of cellulose by nitric acid-ethanol method. Chem. Res. 2011, 22, 52–55, 71. [Google Scholar]
  20. GB/T 2677.8-1994; Fibrous Raw Material—Determination of Acid-Insoluble Lignin. Standards Press of China: Beijing, China, 1994.
  21. GBT 2677.10-1995; Fibrous Raw Material—Determination of Holocellulose. Standards Press of China: Beijing, China, 1995.
  22. Han, Y.; Liu, J.; Li, J.; Jiang, Z.; Ma, B.; Chu, C.; Geng, Z. Novel risk assessment model of food quality and safety considering physical-chemical and pollutant indexes based on coefficient of variance integrating entropy weight. Sci. Total Environ. 2023, 877, 162730. [Google Scholar] [CrossRef] [PubMed]
  23. Wang, P.; Deng, X.; Jiang, S. Global warming, grain production and its efficiency: Case study of major grain production region. Ecol. Indic. 2019, 105, 563–570. [Google Scholar] [CrossRef]
  24. Stirbet, A.; Govindjee. On the relation between the Kautsky effect (chlorophyll a fluorescence induction) and Photosystem II: Basics and applications of the OJIP fluorescence transient. J. Photochem. Photobiol. B Biol. 2011, 104, 236–257. [Google Scholar] [CrossRef]
  25. Wang, Y.; Liu, S.; Tian, X.; Fu, Y.; Jiang, X.; Li, Y.; Wang, G. Influence of light intensity on chloroplast development and pigment accumulation in wild-type and etiolated mutant plants of Anthurium andraeanum ‘Sonate’. Plant Signal. Behav. 2018, 13, 1482174. [Google Scholar]
  26. Foyer, C.H.; Vanacker, H.; Gómez, L.D.; Harbinson, J. Regulation of photosynthesis and antioxidant metabolism in maize leaves at optimal and chilling temperatures: Review. Plant Physiol. Biochem. 2002, 40, 659–668. [Google Scholar] [CrossRef]
  27. Liu, Y.; Geng, J.; Sha, X.; Zhao, Y.; Hu, T.; Yang, P. Effect of rhizobium symbiosis on low-temperature tolerance and antioxidant response in alfalfa (Medicago sativa L.). Front. Plant Sci. 2019, 10, 538. [Google Scholar] [CrossRef] [PubMed]
  28. Zhang, F.; Lu, K.; Gu, Y.; Zhang, L.; Li, W.; Li, Z. Effects of low-temperature stress and brassinolide application on the photosynthesis and leaf structure of tung tree seedlings. Front. Plant Sci. 2020, 10, 1767. [Google Scholar] [CrossRef] [PubMed]
  29. Zhu, J. Abiotic stress signaling and responses in plants. Cell 2016, 167, 313–324. [Google Scholar] [CrossRef] [PubMed]
  30. Anwar, A.; Bai, L.; Miao, L.; Liu, Y.; Li, S.; Yu, X.; Li, Y. 24-epibrassinolide ameliorates endogenous hormone levels to enhance low-temperature stress tolerance in cucumber seedlings. Int. J. Mol. Sci. 2018, 19, 2497. [Google Scholar] [CrossRef] [PubMed]
  31. Mattila, H.; Mishra, K.B.; Kuusisto, I.; Mishra, A.; Novotná, K.; Šebela, D.; Tyystjärvi, E. Effects of low temperature on photoinhibition and singlet oxygen production in four natural accessions of Arabidopsis. Planta 2020, 252, 19. [Google Scholar] [CrossRef]
  32. Brunetti, C.; Tattini, M.; Guidi, L.; Velikova, V.; Ferrini, F.; Fini, A. An integrated overview of physiological and biochemical responses of Celtis australis to drought stress. Urban for. Urban Green. 2019, 46, 126480. [Google Scholar] [CrossRef]
  33. Rivera-Pastrana, D.M.; Yahia, E.M.; González-Aguilar, G.A. Phenolic and carotenoid profiles of papaya fruit (Carica papaya L.) and their contents under low temperature storage. J. Sci. Food Agric. 2010, 90, 2358–2365. [Google Scholar] [CrossRef] [PubMed]
  34. Tao, N.; Wang, C.; Xu, J.; Cheng, Y. Carotenoid accumulation in postharvest “Cara Cara” navel orange (Citrus sinensis Osbeck) fruits stored at different temperatures was transcriptionally regulated in a tissue-dependent manner. Plant Cell Rep. 2012, 31, 1667–1676. [Google Scholar] [CrossRef] [PubMed]
  35. Yang, Y.; Li, T.; Teng, R.; Han, M.; Zhuang, J. Low temperature effects on carotenoids biosynthesis in the leaves of green and albino tea plant (Camellia sinensis (L.) O. Kuntze). Sci. Hortic. 2021, 285, 110164. [Google Scholar] [CrossRef]
  36. Facundo, H.V.D.V.; Gurak, P.D.; Mercadante, A.Z.; Lajolo, F.M.; Cordenunsi, B.R. Storage at low temperature differentially affects the colour and carotenoid composition of two cultivars of banana. Food Chem. 2015, 170, 102–109. [Google Scholar] [CrossRef]
  37. Wang, Y.; Zhang, C.; Xu, B.; Fu, J.; Du, Y.; Fang, Q.; Dong, B.; Zhao, H. Temperature regulation of carotenoid accumulation in the petals of sweet osmanthus via modulating expression of carotenoid biosynthesis and degradation genes. BMC Genom. 2022, 23, 418. [Google Scholar] [CrossRef] [PubMed]
  38. León-Chan, R.G.; López-Meyer, M.; Osuna-Enciso, T.; Sañudo-Barajas, J.A.; Heredia, J.B.; León-Félix, J. Low temperature and ultraviolet-B radiation affect chlorophyll content and induce the accumulation of UV-B-absorbing and antioxidant compounds in bell pepper (Capsicum annuum) plants. Environ. Exp. Bot. 2017, 139, 143–151. [Google Scholar] [CrossRef]
  39. Chung, S.W.; Rho, H.; Lim, C.K.; Jeon, M.K.; Kim, S.; Jang, Y.J.; An, H.J. Photosynthetic response and antioxidative activity of ‘Hass’ avocado cultivar treated with short-term low temperature. Sci. Rep. 2022, 12, 11593. [Google Scholar] [CrossRef] [PubMed]
  40. Swoczyna, T.; Kalaji, H.M.; Bussotti, F.; Mojski, J.; Pollastrini, M. Environmental stress—What can we learn from chlorophyll a fluorescence analysis in woody plants? A review. Front. Plant Sci. 2022, 13, 1048582. [Google Scholar] [CrossRef] [PubMed]
  41. Kalaji, H.M.; Jajoo, A.; Oukarroum, A.; Brestic, M.; Zivcak, M.; Samborska, I.A.; Cetner, M.D.; Łukasik, I.; Goltsev, V.; Ladle, R.J. Chlorophyll a fluorescence as a tool to monitor physiological status of plants under abiotic stress conditions. Acta Physiol. Plant. 2016, 38, 102. [Google Scholar] [CrossRef]
  42. Suzuki, K.; Nagasuga, K.; Okada, M. The chilling injury induced by high root temperature in the leaves of rice seedlings. Plant Cell Physiol. 2008, 49, 433–442. [Google Scholar] [CrossRef] [PubMed]
  43. Mishra, K.B.; Mishra, A.; Kubásek, J.; Urban, O.; Heyer, A.G.; Govindjee. Low temperature induced modulation of photosynthetic induction in non-acclimated and cold-acclimated Arabidopsis thaliana: Chlorophyll a fluorescence and gas-exchange measurements. Photosynth. Res. 2019, 139, 123–143. [Google Scholar] [CrossRef] [PubMed]
  44. Ramazan, S.; Bhat, H.A.; Zargar, M.A.; Ahmad, P.; John, R. Combined gas exchange characteristics, chlorophyll fluorescence and response curves as selection traits for temperature tolerance in maize genotypes. Photosynth. Res. 2021, 150, 213–225. [Google Scholar] [CrossRef]
  45. Gao, H.; Wu, F. Physiological and transcriptomic analysis of tomato in response to sub-optimal temperature stress. Plant Signal. Behav. 2024, 19, 2332018. [Google Scholar] [CrossRef]
  46. Hüner, N.P.A.; Bode, R.; Dahal, K.; Hollis, L.; Rosso, D.; Krol, M.; Ivanov, A.G. Chloroplast redox imbalance governs phenotypic plasticity: The “grand design of photosynthesis” revisited. Front. Plant Sci. 2012, 3, 255. [Google Scholar] [CrossRef]
  47. Bag, P.; Chukhutsina, V.; Zhang, Z.; Paul, S.; Ivanov, A.G.; Shutova, T.; Croce, R.; Holzwarth, A.R.; Jansson, S. Direct energy transfer from photosystem II to photosystem I confers winter sustainability in Scots Pine. Nat. Commun. 2020, 11, 6388. [Google Scholar] [CrossRef] [PubMed]
  48. Hu, Z.; Fan, J.; Xie, Y.; Amombo, E.; Liu, A.; Gitau, M.M.; Khaldun, A.B.M.; Chen, L.; Fu, J. Comparative photosynthetic and metabolic analyses reveal mechanism of improved cold stress tolerance in bermudagrass by exogenous melatonin. Plant Physiol. Biochem. 2016, 100, 94–104. [Google Scholar] [CrossRef] [PubMed]
  49. Farquhar, G.D.; Sharkey, T.D. Stomatal conductance and photosynthesis. Annu. Rev. Plant Biol. 1982, 33, 317–345. [Google Scholar] [CrossRef]
  50. Wu, X.; He, J.; Zhu, Z.; Yang, S.; Zha, D. Protection of photosynthesis and antioxidative system by 24-epibrassinolide in Solanum melongena under cold stress. Biol. Plant. 2014, 58, 185–188. [Google Scholar] [CrossRef]
  51. Jiang, N.; Yang, Z.; Luo, J.; Wang, C. Quantifying chilling injury on the photosynthesis system of strawberries: Insights from photosynthetic fluorescence characteristics and hyperspectral inversion. Plants 2023, 12, 3138. [Google Scholar] [CrossRef] [PubMed]
  52. Eisenhut, M.; Bräutigam, A.; Timm, S.; Florian, A.; Tohge, T.; Fernie, A.R.; Bauwe, H.; Weber, A.P.M. Photorespiration is crucial for dynamic response of photosynthetic metabolism and stomatal movement to altered CO2 availability. Mol. Plant. 2017, 10, 47–61. [Google Scholar] [CrossRef] [PubMed]
  53. Amin, B.; Atif, M.J.; Meng, H.; Ghani, M.I.; Ali, M.; Wang, X.; Ding, Y.; Li, X.; Cheng, Z. Biochemical and physiological responses of Cucumis sativus cultivars to different combinations of low-temperature and high humidity. J. Plant Growth Regul. 2023, 42, 390–406. [Google Scholar] [CrossRef]
  54. Lindfors, L.; Hölttä, T.; Lintunen, A.; Porcar-Castell, A.; Nikinmaa, E.; Juurola, E. Dynamics of leaf gas exchange, chlorophyll fluorescence and stem diameter changes during freezing and thawing of Scots pine seedlings. Tree Physiol. 2015, 35, 1314–1324. [Google Scholar] [CrossRef] [PubMed]
  55. Cheng, L.; An, F.; Xie, G.; Wang, J.; Peng, W.; Zhou, L. Comprehensive evaluation on cold resistance of Hevea brasiliensis varieties and comparison of bark latex bursting differences between varieties. Southwest China J. Agric. Sci. 2022, 35, 2326–2333. [Google Scholar]
  56. Wang, J. The rubber honey source in Hainan Island is highly developable. Apic. China 1988, 88, 31. [Google Scholar]
  57. Saravanakumar, S.S.; Kumaravel, A.; Nagarajan, T.; Sudhakar, P.; Baskaran, R. Characterization of a novel natural cellulosic fiber from Prosopis juliflora bark. Carbohydr. Polym. 2013, 92, 1928–1933. [Google Scholar] [CrossRef]
  58. Bold, G.; Langer, M.; Börnert, L.; Speck, T. The protective role of bark and bark fibers of the giant sequoia (Sequoiadendron giganteum) during high-energy impacts. Int. J. Mol. Sci. 2020, 21, 3355. [Google Scholar] [CrossRef] [PubMed]
  59. Lampugnani, E.R.; Khan, G.A.; Somssich, M.; Persson, S. Building a plant cell wall at a glance. J. Cell Sci. 2018, 131, 207373. [Google Scholar] [CrossRef] [PubMed]
  60. Balasubramanian, B.; Raja, K.; Kumar, V.V.; Ganeshan, P. Characterization study of Holoptelea integrifolia tree bark fibres reinforced epoxy composites. Nat. Prod. Res. 2024, 38, 1197–1206. [Google Scholar] [CrossRef] [PubMed]
  61. Bjurhager, I.; Olsson, A.M.; Zhang, B.; Gerber, L.; Kumar, M.; Berglund, L.A.; Burgert, I.; Sundberg, B.; Salmén, L. Ultrastructure and mechanical properties of Populus wood with reduced lignin content caused by transgenic down-regulation of cinnamate 4-hydroxylase. Biomacromolecules 2010, 11, 2359–2365. [Google Scholar] [CrossRef] [PubMed]
  62. Verger, S.; Chabout, S.; Gineau, E.; Mouille, G. Cell adhesion in plants is under the control of putative O-fucosyltransferases. Development 2016, 143, 2536–2540. [Google Scholar] [PubMed]
  63. Wang, X.; Keplinger, T.; Gierlinger, N.; Burgert, I. Plant material features responsible for bamboo’s excellent mechanical performance: A comparison of tensile properties of bamboo and spruce at the tissue, fibre and cell wall levels. Ann. Bot. 2014, 114, 1627–1635. [Google Scholar] [CrossRef]
  64. Shibly, M.A.H.; Islam, M.I.; Rahat, M.N.H.; Billah, M.M.; Rahman, M.M.; Bashar, M.S.; Abdul, B.; Alorfi, H.S. Extraction and characterization of a novel cellulosic fiber derived from the bark of Rosa hybrida plant. Int. J. Biol. Macromol. 2024, 257, 128446. [Google Scholar] [CrossRef]
Figure 1. Changes in photosynthetic pigment contents in rubber tree leaves under chilling stress. (A) Chlorophyll a content. (B) Chlorophyll b content. (C) Total chlorophyll content. (D) Carotenoid content. The data represent the average of three replicates. Bars show standard errors. Different lowercase letters represent significant differences (Duncan’s test of one-way ANOVA, p < 0.05) among different varieties of rubber trees.
Forests 15 01408 g001
Figure 2. Effect of chilling stress on the chlorophyll fluorescence parameters of rubber tree leaves. (A) The maximum photochemical efficiency of PSII, Fv/Fm. (B) The actual photochemical yield of PSII, ΦPSII. Data are means ± SEs (n = 3). Different lowercase letters represent significant differences (Duncan’s test of one-way ANOVA, p < 0.05) among different rubber tree varieties.
Forests 15 01408 g002
Figure 3. Effect of chilling stress on gas exchange parameters. (A) Photosynthetic rate is denoted as Pn. (B) Stomatal conductance is denoted as Gs. (C) Intercellular CO2 concentration is denoted as Ci. (D) Transpiration rate is denoted as Tr. Different lowercase letters represent significant differences (Duncan’s test of one-way ANOVA, p < 0.05) among different rubber tree varieties.
Forests 15 01408 g003
Figure 4. Visual latex burst in different rubber tree seedlings. (A-1A-3) Variety PR107 seedlings. (B-1B-4) Variety RRIM600 seedlings. (C-1C-4) Variety Reken628 seedlings. (D-1D-3) Variety GT1 seedlings.
Forests 15 01408 g004
Figure 5. Stress–strain curves for barks of two-year-old twigs in different varieties. Different colors represent different stress–strain curves of different specimens, respectively. (A) Variety PR107. (B) Variety RRIM600. (C) Variety Reken628. (D) Variety GT1.
Forests 15 01408 g005
Figure 6. Correlation analysis between latex burst in seedlings exposed to chilling stress, bark tensile properties, and chemical components with the chilling resistance of different varieties of rubber trees. CR, chilling resistance; TALB, total area of latex burst; TLBP, total latex burst positions; BT, bark thickness; ML, maximum load; TS, tensile strength; DBP, displacement at break point; EBP, elongation at break point; YM, Young’s modulus; PC, pectin content; CC, cellulose content; AILC, acid-insoluble lignin content; HOC, holocellulose content. The larger the circle and the darker the color, the larger the correlation coefficient. Positive correlations are exhibited in red and negative correlations in blue. Significant differences are marked by asterisks, with the levels of significance indicated as follows: *** p < 0.001.
Forests 15 01408 g006
Table 1. Changes in chlorophyll contents of each rubber tree variety under different chilling stress days.
VarietyChilling Stress Time (Day)Chl a (mg g−1)Chl b (mg g−1)T Chl (mg g−1)Caro (mg g−1)
PR10702.9870 ± 0.0805 ab0.9472 ± 0.0351 b3.9341 ± 0.1156 b0.5353 ± 0.0091 c
12.9182 ± 0.0766 b0.9198 ± 0.0259 b3.8380 ± 0.1025 b0.5340 ± 0.0125 c
33.0843 ± 0.0054 ab0.9794 ± 0.0021 b4.0637 ± 0.0071 b0.5908 ± 0.0002 b
53.1734 ± 0.0412 a1.2600 ± 0.0166 a4.4334 ± 0.0578 a0.8804 ± 0.0119 a
RRIM60002.8712 ± 0.0503 b0.9370 ± 0.0160 b3.8083 ± 0.0663 b0.5124 ± 0.0154 b
13.0186 ± 0.1447 b0.9794 ± 0.0424 b3.9980 ± 0.1872 b0.5464 ± 0.0225 b
33.0179 ± 0.0462 b0.9533 ± 0.0175 b3.9712 ± 0.0637 b0.5758 ± 0.0085 b
53.5649 ± 0.1123 a1.4169 ± 0.0449 a4.9818 ± 0.1572 a1.0204 ± 0.0353 a
Reken62802.9633 ± 0.0925 a0.9515 ± 0.0289 b3.9148 ± 0.1213 b0.5459 ± 0.0289 b
12.4659 ± 0.1003 b0.8293 ± 0.0349 c3.2952 ± 0.1351 c0.4430 ± 0.0167 c
32.5231 ± 0.0477 b0.8193 ± 0.0157 c3.3423 ± 0.0634 c0.5240 ± 0.0107 b
53.1033 ± 0.0969 a1.2338 ± 0.0384 a4.3371 ± 0.1353 a0.9104 ± 0.0288 a
GT103.9467 ± 0.1118 b1.3295 ± 0.0410 c5.2762 ± 0.1525 c0.6756 ± 0.0264 c
14.1778 ± 0.0923 b1.4486 ± 0.0326 bc5.6265 ± 0.1249 bc0.7087 ± 0.0140 c
34.5727 ± 0.1405 a1.5734 ± 0.0494 ab6.1461 ± 0.1898 ab0.7902 ± 0.0188 b
54.2558 ± 0.0786 ab1.6952 ± 0.0312 a5.9510 ± 0.1098 a1.1751 ± 0.0219 a
Data were represented as means ± SEs. Means that do not share the same letter(s) are significantly different at p < 0.05 by Duncan’s test of one-way ANOVA. Chl a, chlorophyll a content; Chl b, chlorophyll b content; T chl, total chlorophyll content; Caro, carotenoid content.
Table 2. Damage observation and data statistics of latex burst in rubber tree seedings after chilling stress.
VarietyNDPNSPTotal
Number
Area of DP (mm2)Area of SP (mm2)Total Area
(mm2)
Location
PR10760614.2874014.2874Petiole
RRIM60040432.9117032.9117Petiole, stem
Reken62881935.989312.942848.9321Petiole, stem, leaf scar
GT160632.9124032.9124Petiole, stem
NDP, number of dotted latex-burst positions; NSP, number of stripped latex-burst positions.
Table 3. Tensile properties (bark thickness, maximum load, tensile strength, elongation at break point, Young’s modulus) of barks in different rubber tree varieties.
VarietyBT (mm)ML (N)TS (MPa)EBP (%)YM (MPa)
PR1070.7383 ± 0.0577 b6.7783 ± 0.7080 b1.9400 ± 0.2762 b3.2861 ± 0.4361 b59.5229 ± 4.7126 a
RRIM6000.8005 ± 0.0256 b9.8736 ± 0.5952 a2.5005 ± 0.1692 ab4.5051 ± 0.3424 b72.7703 ± 16.4655 a
Reken6280.9875 ± 0.0706 a10.7900 ± 1.3989 a2.2237 ± 0.3224 ab4.7181 ± 0.7977 b54.1421 ± 8.2707 a
GT10.7643 ± 0.0452 b10.5743 ± 0.9489 a2.7643 ± 0.1917 a7.1811 ± 0.8670 a42.8443 ± 6.8711 a
Data were represented as means ± SEs. Means that do not share the same letter(s) are significantly different at p < 0.05 by Duncan’s test of one-way ANOVA. BT, bark thickness; ML, maximum load; TS, tensile strength; EBP, elongation at break point; YM, Young’s modulus.
Table 4. Bark compositions of different varieties of rubber trees.
VarietyPC (%)CC (%)AILC (%)HOC (%)
PR10713.4000 ± 0.5859 b1.8500 ± 0.0436 b21.5000 ± 0.4359 a58.9000 ± 0.5686 c
RRIM60016.5000 ± 0.1732 a0.8700 ± 0.0529 c20.0000 ± 0.2646 b60.1000 ± 0.0577 bc
Reken6287.3000 ± 0.0700 c3.1000 ± 0.0513 a22.1000 ± 0.1528 a69.6000 ± 0.5132 a
GT17.94000 ± 0.0208 c0.3600 ± 0.0115 d19.4000 ± 0.1155 b60.4000 ± 0.3215 b
Data were represented as means ± SEs. Means that do not share the same letter(s) are significantly different at p < 0.05 by Duncan’s test of one-way ANOVA. PC, pectin content; CC, cellulose content; AILC, acid-insoluble lignin content; HOC, holocellulose content.
Table 5. Chilling-resistance coefficients of varieties of different rubber trees.
VarietyChilling-Resistance CoefficientDMRank
Chl aChl bT ChlCaroPnGsCiTrFv/FmΦPSII
PR1070.06150.04460.00920.00510.03880000.00430.01010.17363
RRIM6000.07880.07410.01240.01010.00710.06560.04020.04130.005900.32552
Reken628000000.04220.00520.032900.00710.08744
GT10.32780.36240.05390.04030.02310.00060.01270.00500.00270.02390.85241
Table 6. Various weights of each indicator.
IndicatorWvjEjWejWj
Chl a0.32780.58870.10460.2109
Chl b0.36240.52100.12180.2394
T chl0.05390.57250.10870.0872
Caro0.04030.54920.11460.0774
Pn0.03880.66600.08490.0654
Gs0.06560.50420.12610.1036
Ci0.04020.57870.10710.0748
Tr0.04130.63450.09290.0706
Fv/Fm0.00590.75800.06150.0217
ΦPSII0.02390.69490.07760.0490
Wvj, the weight of the j-th indicator by the membership function method; Ej, the information entropy of the j-th indicator; Wej, the entropy weight of the j-th indicator; Wj, combination weight.
Table 7. Comprehensive evaluation values of chilling resistance in different varieties of rubber trees.
VarietyDRank
PR1070.19573
RRIM6000.42172
Reken6280.14714
GT10.74571
D, the comprehensive evaluation value by the combination weighting method.
Disclaimer/Publisher’s Note: The statements, opinions and data contained in all publications are solely those of the individual author(s) and contributor(s) and not of MDPI and/or the editor(s). MDPI and/or the editor(s) disclaim responsibility for any injury to people or property resulting from any ideas, methods, instructions or products referred to in the content.

