Article

Inhibition of Soil Wind-Erosion and Dust by Shelterbelts in the Hilly Area of Loess Plateau and Its Influencing Factors

1
College of Forestry, Shanxi Agricultural University, Jinzhong 030801, China
2
Institute of Loess Plateau, Shanxi University, Taiyuan 030006, China
*
Author to whom correspondence should be addressed.
Forests 2024, 15(8), 1413; https://doi.org/10.3390/f15081413
Submission received: 2 July 2024 / Revised: 24 July 2024 / Accepted: 8 August 2024 / Published: 13 August 2024
(This article belongs to the Section Forest Ecology and Management)

Abstract

:
The Loess Plateau is an important source of particulate matter pollution in North China. In order to establish and repair shelterbelts and improve their function of inhibiting wind erosion and dust, four typical shelterbelts (Populus simonii, Pinus tabulaeformis Carr., Pinus tabulaeformis Carr. × Populus simonii and Caragana korshinskii Kom.) were selected to investigate the inhibition rate of soil wind-erosion and the reduction rates of PM1, PM2.5 and PM10 by stand type, stand structure and soil properties. A sample plot survey and semi-fixed observation method were used to measure wind speed and particulate matter concentration and to calculate wind protection effect, sand transport rate, vertical flux of particulate matter, wind-erosion inhibition rate and particulate matter reduction rate. The results showed that the Pinus tabulaeformis Carr. forest and Caragana korshinskii Kom. forest had the best windproofing effect, at 2 m (82.9% ± 23.8%) and 0.5 m (54.4% ± 21.5%), respectively. The distribution curve of the sediment flux of shelterbelts is a logarithmic function. The wind-erosion inhibition rate and PM1 reduction rate of the Pinus tabulaeformis Carr. forest were significantly greater than those of other stand types (p < 0.05). The generalized linear mixed model (GLMM) shows that the DBH variation coefficient (CV) can effectively explain the reduction rate of PM1. It is suggested that policies be enacted to add or replace Pinus tabulaeformis Carr. forest in polluted areas to prevent wind erosion and dust.

1. Introduction

With global warming and frequent droughts, soils become dry and fragile due to lack of sufficient moisture. Spring is the season with the most wind during the year. As the cold-air force weakens in the southward process, the warm-air force becomes stronger. The cold and warm air push back and forth easily to form the north wind, and the ground vegetation is not completely covered, which can easily produce sandstorms [1,2]. Due to warm and dry conditions caused by climate change, these dust events are expected to increase in arid regions such as northern Mexico and the southwestern United States [3,4]. Croplands are one of the major sources of windblown dust in parts of the United States [5,6]. In southern Iran, where dust storms also occur frequently, soil loss from wind erosion and dust storms can be minimized by limiting farming to periods of low wind speed [7]. The establishment of windbreaks reduces the occurrence of wind erosion and dust emission rates during strong storms [8].
China has established the Three-North Shelter belt Forest Program over recent decades, a program which plays an important role in controlling soil erosion in farmland and blocking the diffusion of particulate matter in areas affected by wind and dust [9,10,11,12]. The stand structures of shelterbelts comprehensively reflect the effects of tree growth, competition, renewal and other processes of stand development and human management activities, and the response of forest tree growth to stand structure varies among different tree species, so it is scientifically important to fully consider the variability of stand structure in order to accurately evaluate the effects of shelterbelts on the inhibition of wind erosion of soils and the blocking of the dispersion of particulate matter [13]. Stand structure is commonly referred to as the composition of plants at the horizontal and vertical levels, and the horizontal and vertical structures of the stand make a difference in the spatial distribution within the forest, which has a certain impact on the function of protective forests in blocking particulate matter [14]. In recent years, based on the understanding of stand structure, we have found that the tree-diameter-at-breast-height (DBH) characteristics of trees have effects on the structural composition and stock amounts of tree species, such as the volume of the tree and the trunk, the height, the trunk state and the crown size. Ideally, trees with larger diameter at breast height (DBH) or taller growth are more advantageous in growth within the unit system formed by forest trees and neighboring trees together; at the same time, this relationship is obvious, as it reflects the growth advantages of forest trees, because taller trees can compete for sunlight more effectively. Using tree height as a judgment condition for the growth advantage of forest trees can clearly and effectively reflect the differences between trees at the vertical level [15]. However, tree growth is also related to climate, site level and the species’ own conditions, so diameter-at-breast-height (DBH) growth and height growth may not be synchronized, and the height-to-diameter ratio of a stand is usually used to judge individual tree growth, with lower DBH ratios usually implying that trees are growing slowly and may be limited by environmental conditions or competition for resources. Higher aspect ratios, on the other hand, may indicate rapid growth, but may also mean that the tree’s form is unhealthy or unstable. The size of a tree’s canopy also has an effect on its ability to absorb particulate matter, with trees with larger canopies tending to absorb more particulate matter, thus reducing the extent of particulate matter dispersion in the air [16]. Conversely, trees with smaller canopies may have limited absorptive capacity, leading to quicker diffusion of particulate matter through the air, and canopy structures with a typical porosity of 30% have a more retarding effect [17]. A higher degree of cover means a denser canopy, and trees with a higher degree of cover are able to intercept particulate matter to some extent, reducing the extent of particulate matter dispersion in the air. The fact that trees have lower levels of canopy cover may affect the rate and extent of particulate matter dispersion.
Field investigation and observation is the most basic and reliable method used to understand the wind-erosion conditions and determine the amount of wind erosion; with this method, the wind and sand around the protective forests can be more intuitively measured to determine the effectiveness of the shelterbelts in preventing wind and fixing sand [18]. By slowing down the wind speed, the shelterbelts intercept the sand [19,20], form the wind speed gradient, change the surrounding air and wind direction, and disperse the wind [21], thus improving the wind-erosion inhibition rate. The pressure field around a single tree in a shelterbelt shows a gradient of high pressure on the windward side and low pressure on the leeward side, showing its effectiveness in reducing wind speed and sand transport fluxes [21,22]. In addition, shelterbelts play an important role in trapping particulate matter. Relevant studies have shown that protective forests reduce the diffusion of PM10 in the downwind region, and also play a role in reducing the vertical flux of PM10. Woodlands have shown a greater explanatory rate of PM2.5 reduction, compared to grasslands and croplands [23]. Meteorological conditions affect the formation, narrowing and dispersion of particulate pollution. Previous studies have shown that the meteorological factors that have the greatest influence on the concentration of particles are wind speed, wind direction, temperature and humidity [24]. There are obvious differences in the lifting height and the distance traveled by soil particles under different winds; in general, for every 1 m/s increase in wind speed, the diffusion distance of dust will increase by 10%–30%, and when the wind speed is 1 m/s, the deposition rate of PM10 on pine needles is about 0.1 m/s [25]. In addition, shelterbelt tree species affect soil fertility, hydrological properties and ecosystem stability by affecting soil structure, nutrient content and water retention capacity [26]. Factors affecting soil wind-erosion are mainly the soil moisture content, soil organic matter and soil particle size composition [27]. Moderate soil moisture content can increase the soil’s bonding force and viscosity, so that the contact between soil particles is more compact, and can also be conducive to the formation of soil crust, increasing the soil’s ability to resist wind erosion [28]. Soil particles of different particle sizes have different sensitivities to wind erosion, with smaller particle sizes usually more susceptible to wind erosion [29]. Soils with good aggregates increase soil stability and resistance to wind erosion [30].
The Loess Plateau is one of the key areas for soil wind-erosion disaster prevention and control due to its fragmented topography and arid climate [31]. When the local spring wind occurs, the farmland is often eroded, which brings sand and dust. Fine particles such as PM2.5 particles caused by soil wind-erosion and dust are suspended in the air, which seriously affects the air quality [32]. The research area is a typical loess plateau, a hilly, sandy area in China, one belonging to the Three-North Shelter belt Forest Program, and part of the Yellow River “several-bends battle area”; it is a good example of an ecologically fragile area. The optimization of shelterbelts is the key to the improvement of forest ecosystem services. Exploring the effectiveness of the implementation of ecological measures for the prevention and control of wind and sand disasters in order to understand the role of protective forests within the soil wind-erosion process and the diffusion of particulate matter around the protective forests can provide a theoretical basis for the prevention and control of soil erosion, wind and sand disaster prevention and control, and air pollution management in North China, and has an important significance for the prevention and control of soil wind-erosion and for wind-based reduction of particulate matter pollution [33,34]. Taking shelterbelts of different stand types as the research object, the main influencing factors were explored by analyzing the growth structure characteristics, soil properties and wind and sand prevention functions of shelterbelts in order to provide a theoretical basis for improving the ecological environment in this area by the means of formulation of effective prevention and control measures. Our research focuses on (1) investigating the effects of stand type on stand structure and soil properties of shelterbelts; (2) analyzing the ability of shelterbelts of different stand types to inhibit wind erosion, and the characteristics of particulate matter dispersion; and (3) whether stand type, stand structure and soil properties affect the wind erosion and dust removal functions of shelterbelts and their contribution rates.

2. Materials and Methods
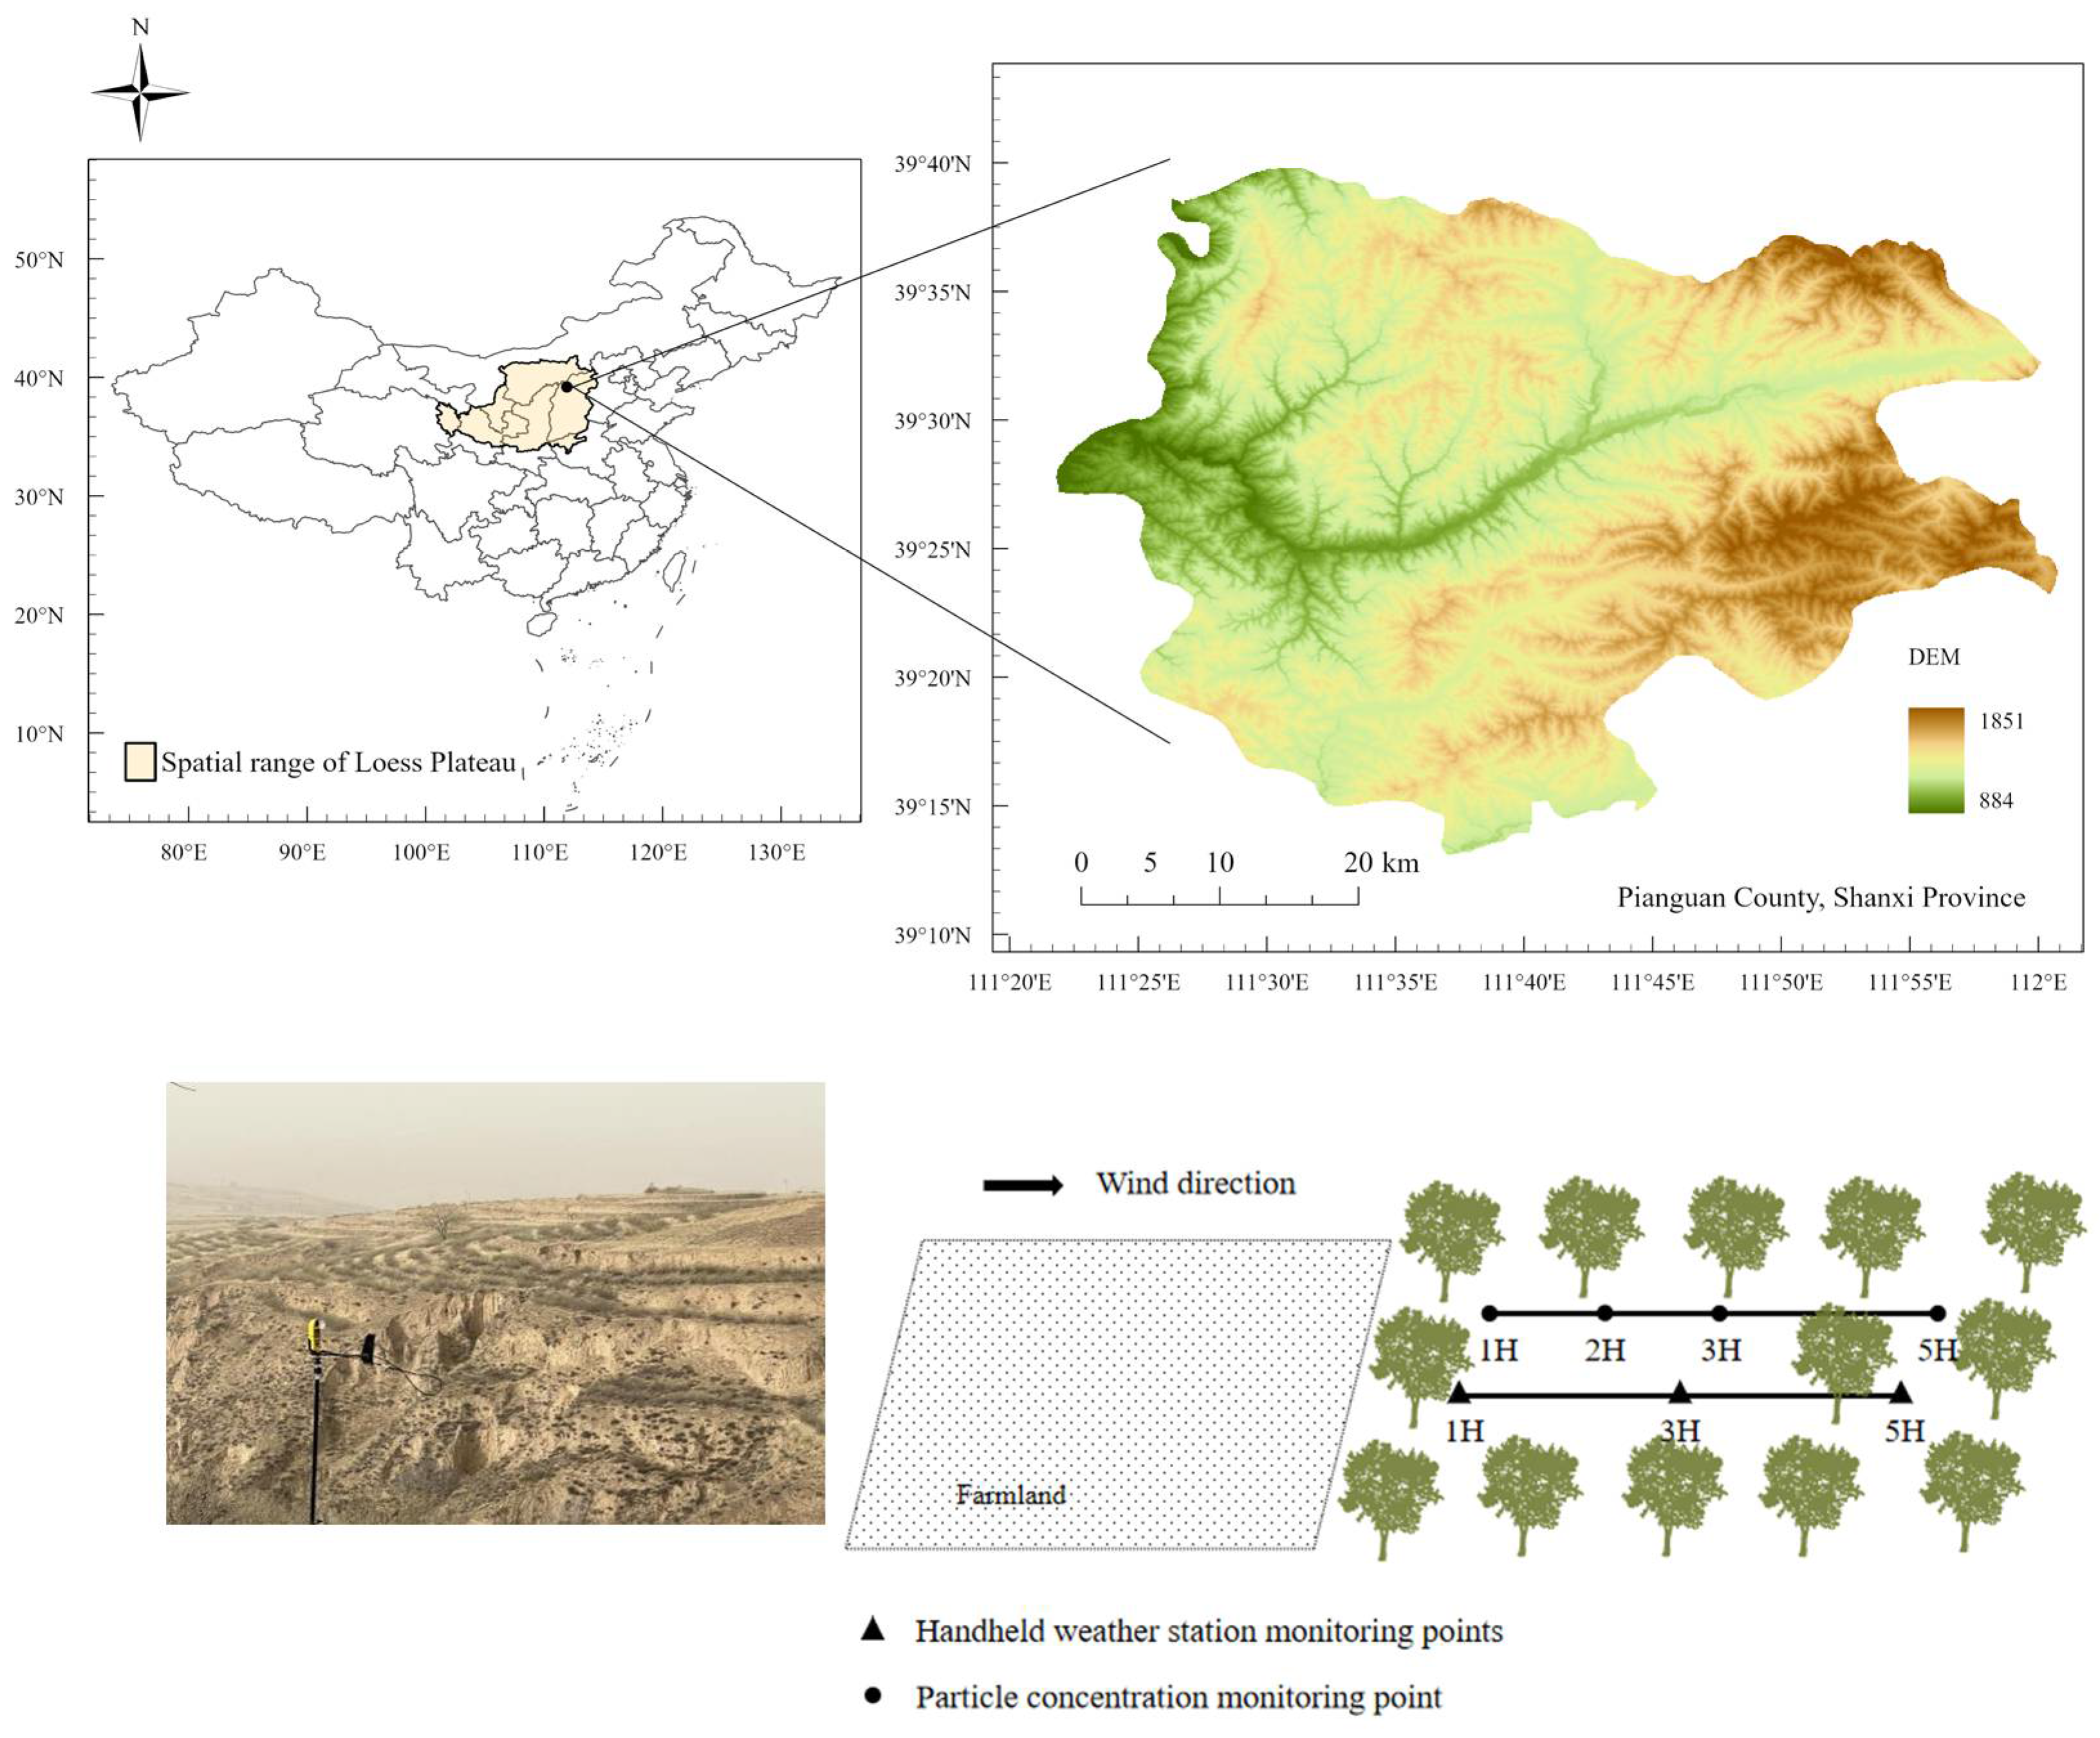
2.1. Study Site

The research area is located in Pianguan County, Xinzhou City, Shanxi Province (39°30′ N, 111°35′ E). The climate of the region is temperate continental monsoon. The soil layer in the loess hilly and gully region is deep, and the wind erosion is very serious in the northwest of Shanxi Province. The strata are, from old to new, Ordovician, Carboniferous and Quaternary strata. The formation lithology is mainly dolomitic limestone, quartz sandstone, sand gravel and loess (silt). Loess (silt) is widely distributed, ranging in thickness from a few meters to tens of meters. Winters are controlled by the Mongolian high-pressure air flow, which is dry and cold, and there are many gales during late spring and early summer, as many as 35 times a year. The average annual temperature is 5~8 °C; the extreme minimum temperature is −31 °C, and the maximum is 38.1 °C. The tree species in the study area are mainly dominated by Populus simonii, followed by Pinus tabulaeformis Carr. and Larix gmelinii, mostly in the eastern part of Daimiao Mountain, Baiyangling Mountain, and Nanbaozi Mountain and the northeastern part of Haizilou, which are located at altitudes of more than 1500 m above sea level. Shrub forests are dominated by Caragana korshinskii Kom., which grows extensively on the slopes of sandy-beamed gullies, as well as Hippophae rhamnoides L., Salix matsudana Koidz and others (Figure 1).

2.2. Sampling Plots’ Set-Up

The experiment was conducted in spring 2023. Four typical stand types were selected near the farmland for the purpose of a comparative study: Populus simonii, Pinus tabulaeformis Carr., Pinus tabulaeformis Carr. × Populus simonii and Caragana korshinskii Kom. Each stand type had a similar site environment and conservation measures. Each sample plot occupied an area of 20 × 20 m. These trees are healthy stands between 25 and 30 years old. Elevations were between 1251 and 1420. They are all multi-row plantations planted as shelterbelts.

2.3. Data Collection

Basic parameters such as tree height (TH), diameter at breast height (DBH), crown width (CR) and stand density (SD) were measured. Stability is a key characteristic of stand structure which refers to the resistance of ecosystem functions to spatial and temporal disturbances, and stand stability is an essential element in achieving sustainable management of forest stands. Stand trunk height-to-diameter ratios were used to determine the strength of a stand’s stability. Indicators characterizing the structure of protective forest stands are as follows: optical porosity (OP), DBH variation coefficient (CV), canopy density (CD), stand density (SD), height-to-diameter ratio (RHD), Clark–Evans index (CE), neighborhood competition index (NCI) and crown width (CR). Indicators that characterize the soil are as follows: total nitrogen content (TN), soil organic carbon (SOC), mean weight diameter of soil aggregates (MWD), soil moisture content (SMC) and soil bulk density (SBD). The sediment flux, particle reduction rate and wind-erosion inhibition rate were calculated by monitoring the wind-erosion levels and particulate matter concentrations in farmland soil and shelterbelts.
Before strong wind events, the sand collector was placed at various above-ground locations corresponding to wind direction, in the downwind direction, with sampling heights of 0.5 m, 1 m and 2 m; they were placed for 72 h each time. The size of the sand collector is 22 cm × 7 cm × 9 cm, and the end is equipped with an air vent to reduce the influence of air convection on the sand collection effect. The collected wind erosion is brushed out with a brush to calculate the sediment flux (Qs).
The particle reduction rate (PMRE) was calculated using the particle concentration. A Dustmate portable dust monitoring instrument (DUSTMATE, Turnkey Co., Ltd., Cheshire, UK) was used to monitor the mass concentrations of PM1, PM2.5 and PM10 in the air at various above-ground points based on the wind direction, in the downwind direction. The downwind monitoring points were 1H, 2H, 3H and 5H from the forest edge (H is the height of the tree), and the monitoring heights were 1.5 m and 2 m from the ground level of the sample site. Data were recorded once every 30 s. The measurements for each run were completed within about 30 min per run, with three repetitions.
A handheld weather station (Kestrel 5000, Nielsen-Kellerman Co., Boothwyn, PA, USA) was used to monitor various meteorological factors such as overground and downwind wind speed, temperature and relative humidity, recording data once a minute. The downwind monitoring points were 1H, 3H and 5H from the forest edge (H is the height of the tree), and the monitoring heights were 0.2 m, 0.5 m, 1 m and 2 m above the ground level of the sample plot. The test lasted for 10 min at each height and were finished after completing all tests at each height. The measurements for each run were completed in 40 min per run with three repetitions (Figure 1).
Three 0.5 m × 0.5 m quadrates were randomly arranged in the plot. After litter was removed from the center of the plot, the soil profile was excavated, and the topsoil samples were collected in parallel with a cutting-ring method. Soil chemical properties were determined as follows: total nitrogen content (TN) was measured by Kjeldahl and the soil organic carbon (SOC) was measured by the potassium dichromate capacity–dilution heat method.

2.4. Stand Structure Indicators

Canopy density (CD) was investigated by using the diagonal one-step, one-head method. The OP takes a vertical image with a digital camera and then uses Adobe Photoshop CS6 to calculate the opacity, which is expressed as the percentage of white on the image. The DBH variation coefficient (CV) reflects the size of the DBH distribution range [35]; the larger the CV value, the more discrete the DBH of the forest (Equation (1)). The Clark–Evans index (CE) is used to determine the spatial distribution pattern of the forest population (e.g., clustered, random, uniform) [36]. CE < 1 indicates a clustered distribution, CE = 1 indicates a random distribution, and CE > 1 indicates a uniform distribution (Equation (2)). NCI is the neighborhood competition index [37], and the larger the NCI, the greater the advantage of adjacent trees over the target trees (Equation (3)).
C V = i = 1 n ( d i D B H ¯ ) 2 n 1 D B H ¯ ,
C E = 1 n i = 1 n r i 1 2 A n ,
N C I = 1 n j = 1 n V i j ,
where n is the number of competing trees in the structural unit of tree i; di is the DBH of the target woods; D B H ¯ is the mean DBH of trees in the structural unit; ri is the distance between tree i and its nearest tree; A is the area of the structure unit, determined as a circle; Vij = 1 when the target tree i is smaller than its neighbor j tree, and when tree i is larger than its j neighbor, Vij = 0.

2.5. Inhibition of Wind-Erosion Dust Indicators

The study of the structure of wind-blown sand flow is made mainly to measure the sediment flux (Qs) at different surface heights; the sediment transport rate is monitored by the sand-collecting instrument [38]. PMRE is the reduction rate of particulate matter [39]. FvPM is the vertical flux of particulate matter [23]. K is the wind-erosion inhibition rate.
Q s = m H d t ,
where mH is the amount of sand in each layer (g), t is the time of collecting sand dust (d), and d is the width of the sand inlet of the sand collection box (m).
PMRE = P M o u t s i d e P M f o r e s t P M o u t s i d e × 100 % ,
where PMforest is the average concentration of particulate matter in the forest, and PMoutside is the average concentration of particulate matter in the monitoring station outside the forest.
F v P M = k u ( C 1 C 2 ) ln ( Z 2 Z 1 ) ,
where k is the von Karman constant (0.4). The u* is the friction velocity in m·s−1; C1 and C2 are particulate matter concentrations at heights Z1 and Z2, which are 1.5 m and 2 m, respectively.
K = F 1 F 2 F 1 × 100 % ,
where F1 is the sediment transport from farmland; F2 is the sediment transport of shelterbelts.

2.6. Statistical Analysis

According to the type of stand, the normal distribution test and variance homogeneity test were conducted for the wind-erosion inhibition rate and particle reduction rate of different stand types. IBM SPSS Statistics 26.0 software was used to conduct one-way ANOVA. When the results were significantly different, an LSD test was carried out to identify the differences between stand structure, soil factors and soil wind-eroded dust in different stand types. The images were drawn using Origin 2023. In order to study the correlations between stand structure, soil factors and the wind-eroded dust index, we performed an extensive correlation analysis using the R program. Correlation analyses were accomplished utilizing the “corrgram” packages within R 4.4.0. Subsequently, we identified indicators that had a significant effect on wind-eroded dust. These selected indicators were grouped into two groups: stand structure (including OP, CD, CV, SD, RHD, CE, NCI and CR) and soil factor (including TN, SOC, MWD, SMC and SBD). Then, the CANOCO 5.0 program was used to conduct redundancy analysis (RDA) to explore the relationship between all the influencing factors and wind-eroded dust, in order to determine the specific influencing factors. Finally, a generalized linear mixed model (GLMM) was constructed by using these important indicators through a stepwise method. This approach aims to determine whether these important indicators can explain the protection efficiency of shelterbelts.

3. Results

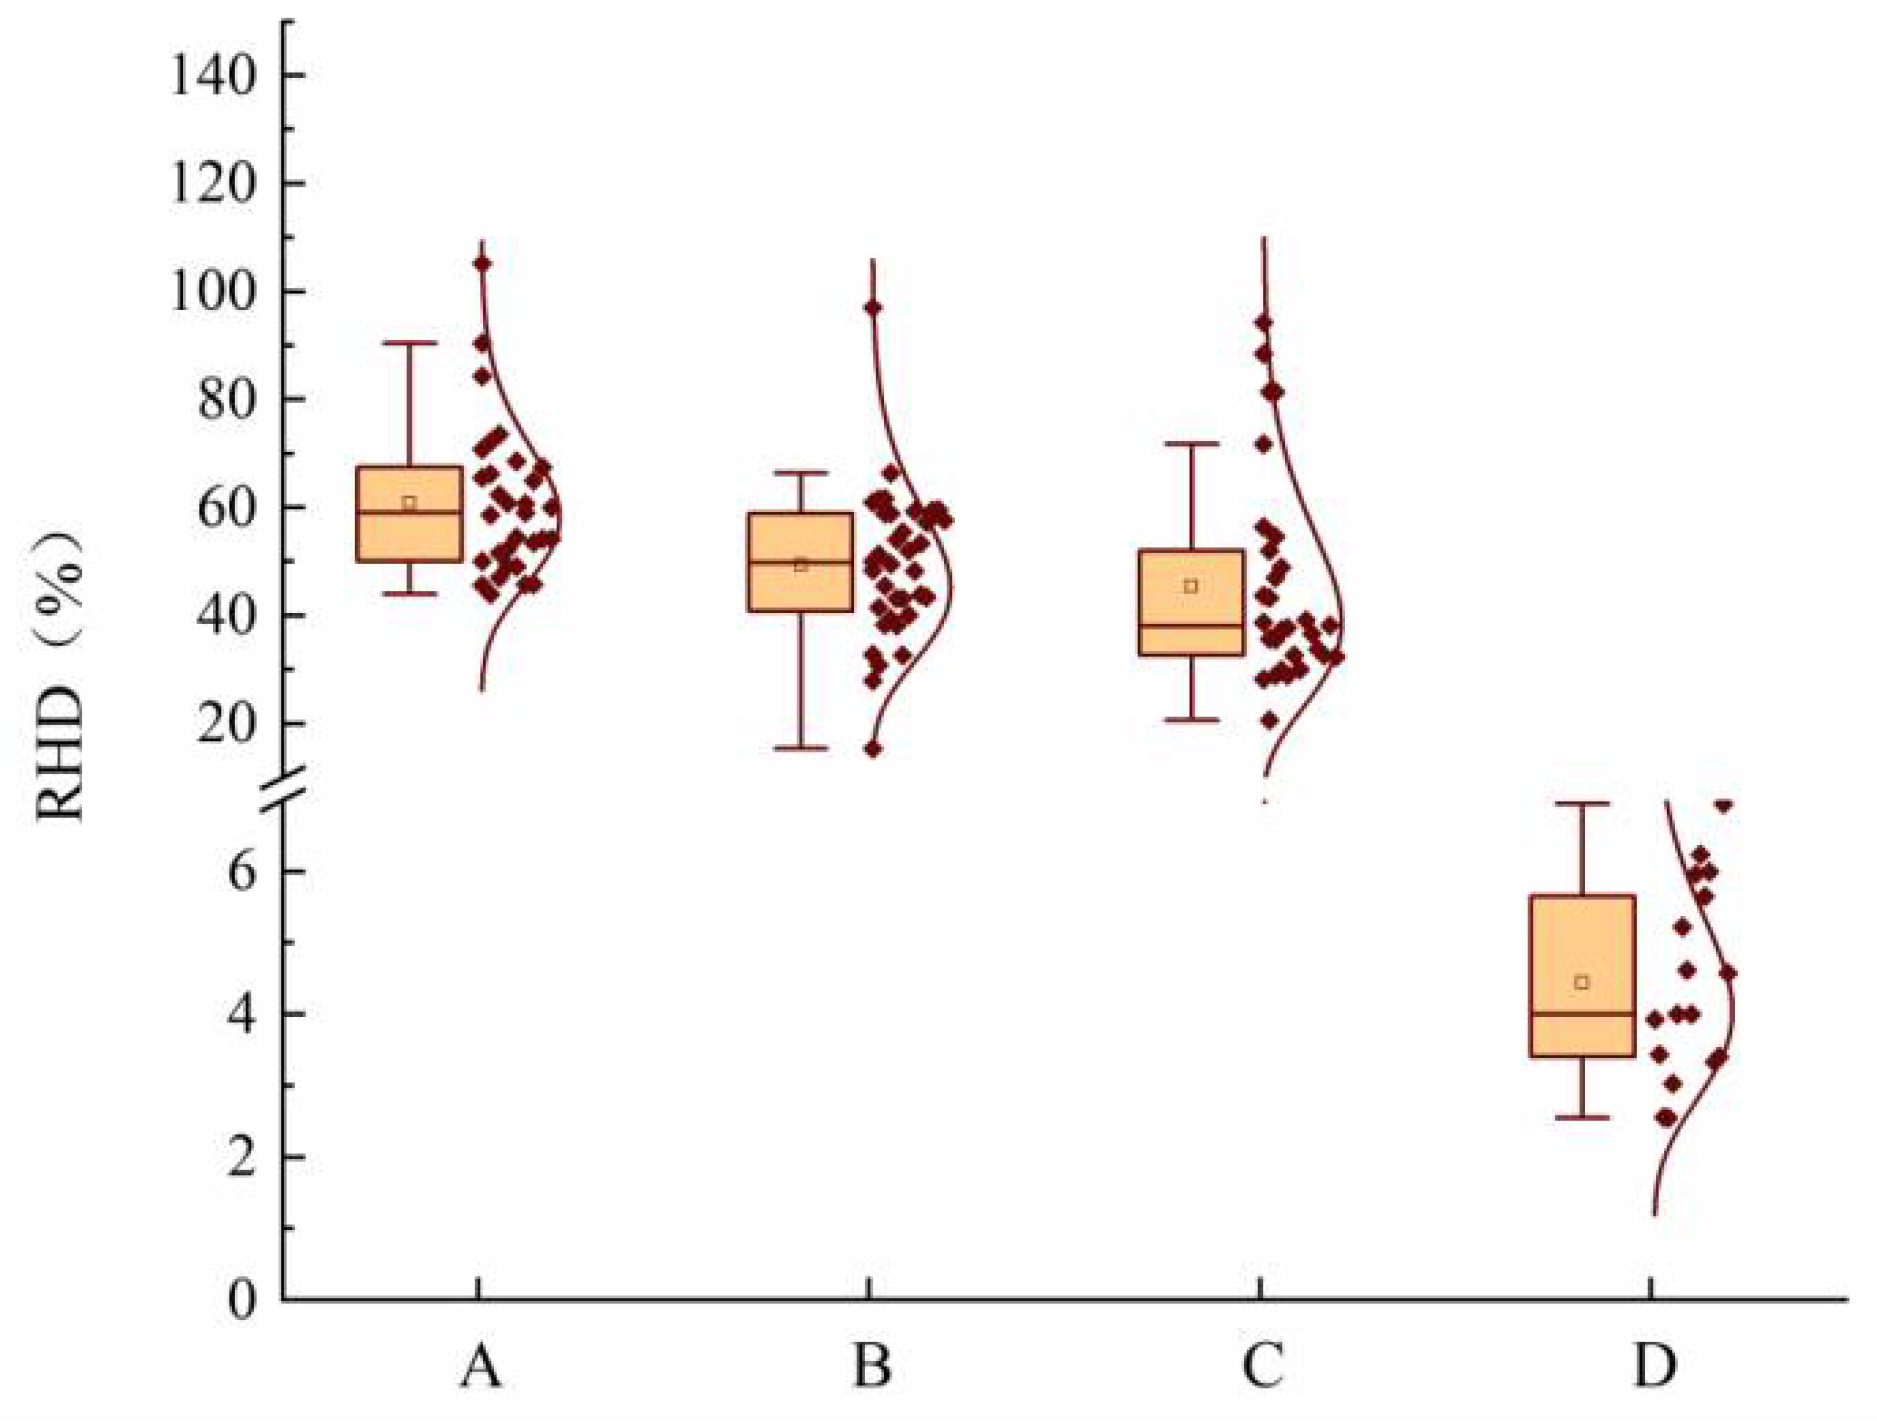
3.1. Stand Structure and Soil Response to Different Stand Types of Shelterbelts

The results of one-way ANOVA showed that OP, CV and RHD of the Populus simonii forest were significantly higher than those of the Pinus tabulaeformis Carr. forest, Pinus tabulaeformis Carr. × Populus simonii forest and Caragana korshinskii Kom. forest. The CD and NCI of the Pinus tabulaeformis Carr. forest were significantly higher than those of the Populus simonii forest, Pinus tabulaeformis Carr. × Populus simonii forest and Caragana korshinskii Kom. forest (Table 1). The RHD of the four stand types showed a gamma distribution. The RHD of the Populus simonii forest showed a skewed distribution, with a peak value between 50 and 70. The RHD of the Pinus tabulaeformis Carr. forest showed a normal distribution, with a peak value between 40 and 50, and the RHD of the Pinus tabulaeformis Carr. × Populus simonii forest showed a skewed distribution, with a peak value between 30 and 40 (Figure 2).
CV can reflect the dispersion degree of the DBH distribution. The CV of the Populus simonii forest was significantly higher than those of other stands, indicating that the diameter distribution of Populus simonii forest was highly discrete. The CV of the Pinus tabulaeformis Carr. forest was the smallest, and the CVs of the Populus simonii forest and Pinus tabulaeformis Carr. × Populus simonii forest were higher than that of Pinus tabulaeformis Carr. forest. This indicates that the DBH distribution of Pinus tabulaeformis Carr. forest is relatively low and the stand growth is stable. The Clark–Evans index showed that the distribution of the Caragana korshinskii Kom. forest was random, the distribution of the Pinus tabulaeformis Carr. forest was clustered, and the distributions of the Populus simonii forest and Pinus tabulaeformis Carr. × Populus simonii forest were uniform.
These results indicated that the structural characteristics of the four stand types were as follows: the DBH of the Pinus tabulaeformis Carr. forest was low in dispersion, clustered in distribution and large in size ratio. The difference in DBH between the Populus simonii forest and the Pinus tabulaeformis Carr. × Populus simonii forest was large, and the distribution was uniform. The Caragana korshinskii Kom. forest was randomly distributed. The optical porosity and height-to-diameter ratio of Populus simonii forest were significantly higher than those of the Pinus tabulaeformis Carr. forest, Pinus tabulaeformis Carr. × Populus simonii forest and Caragana korshinskii Kom. forest (p < 0.05).

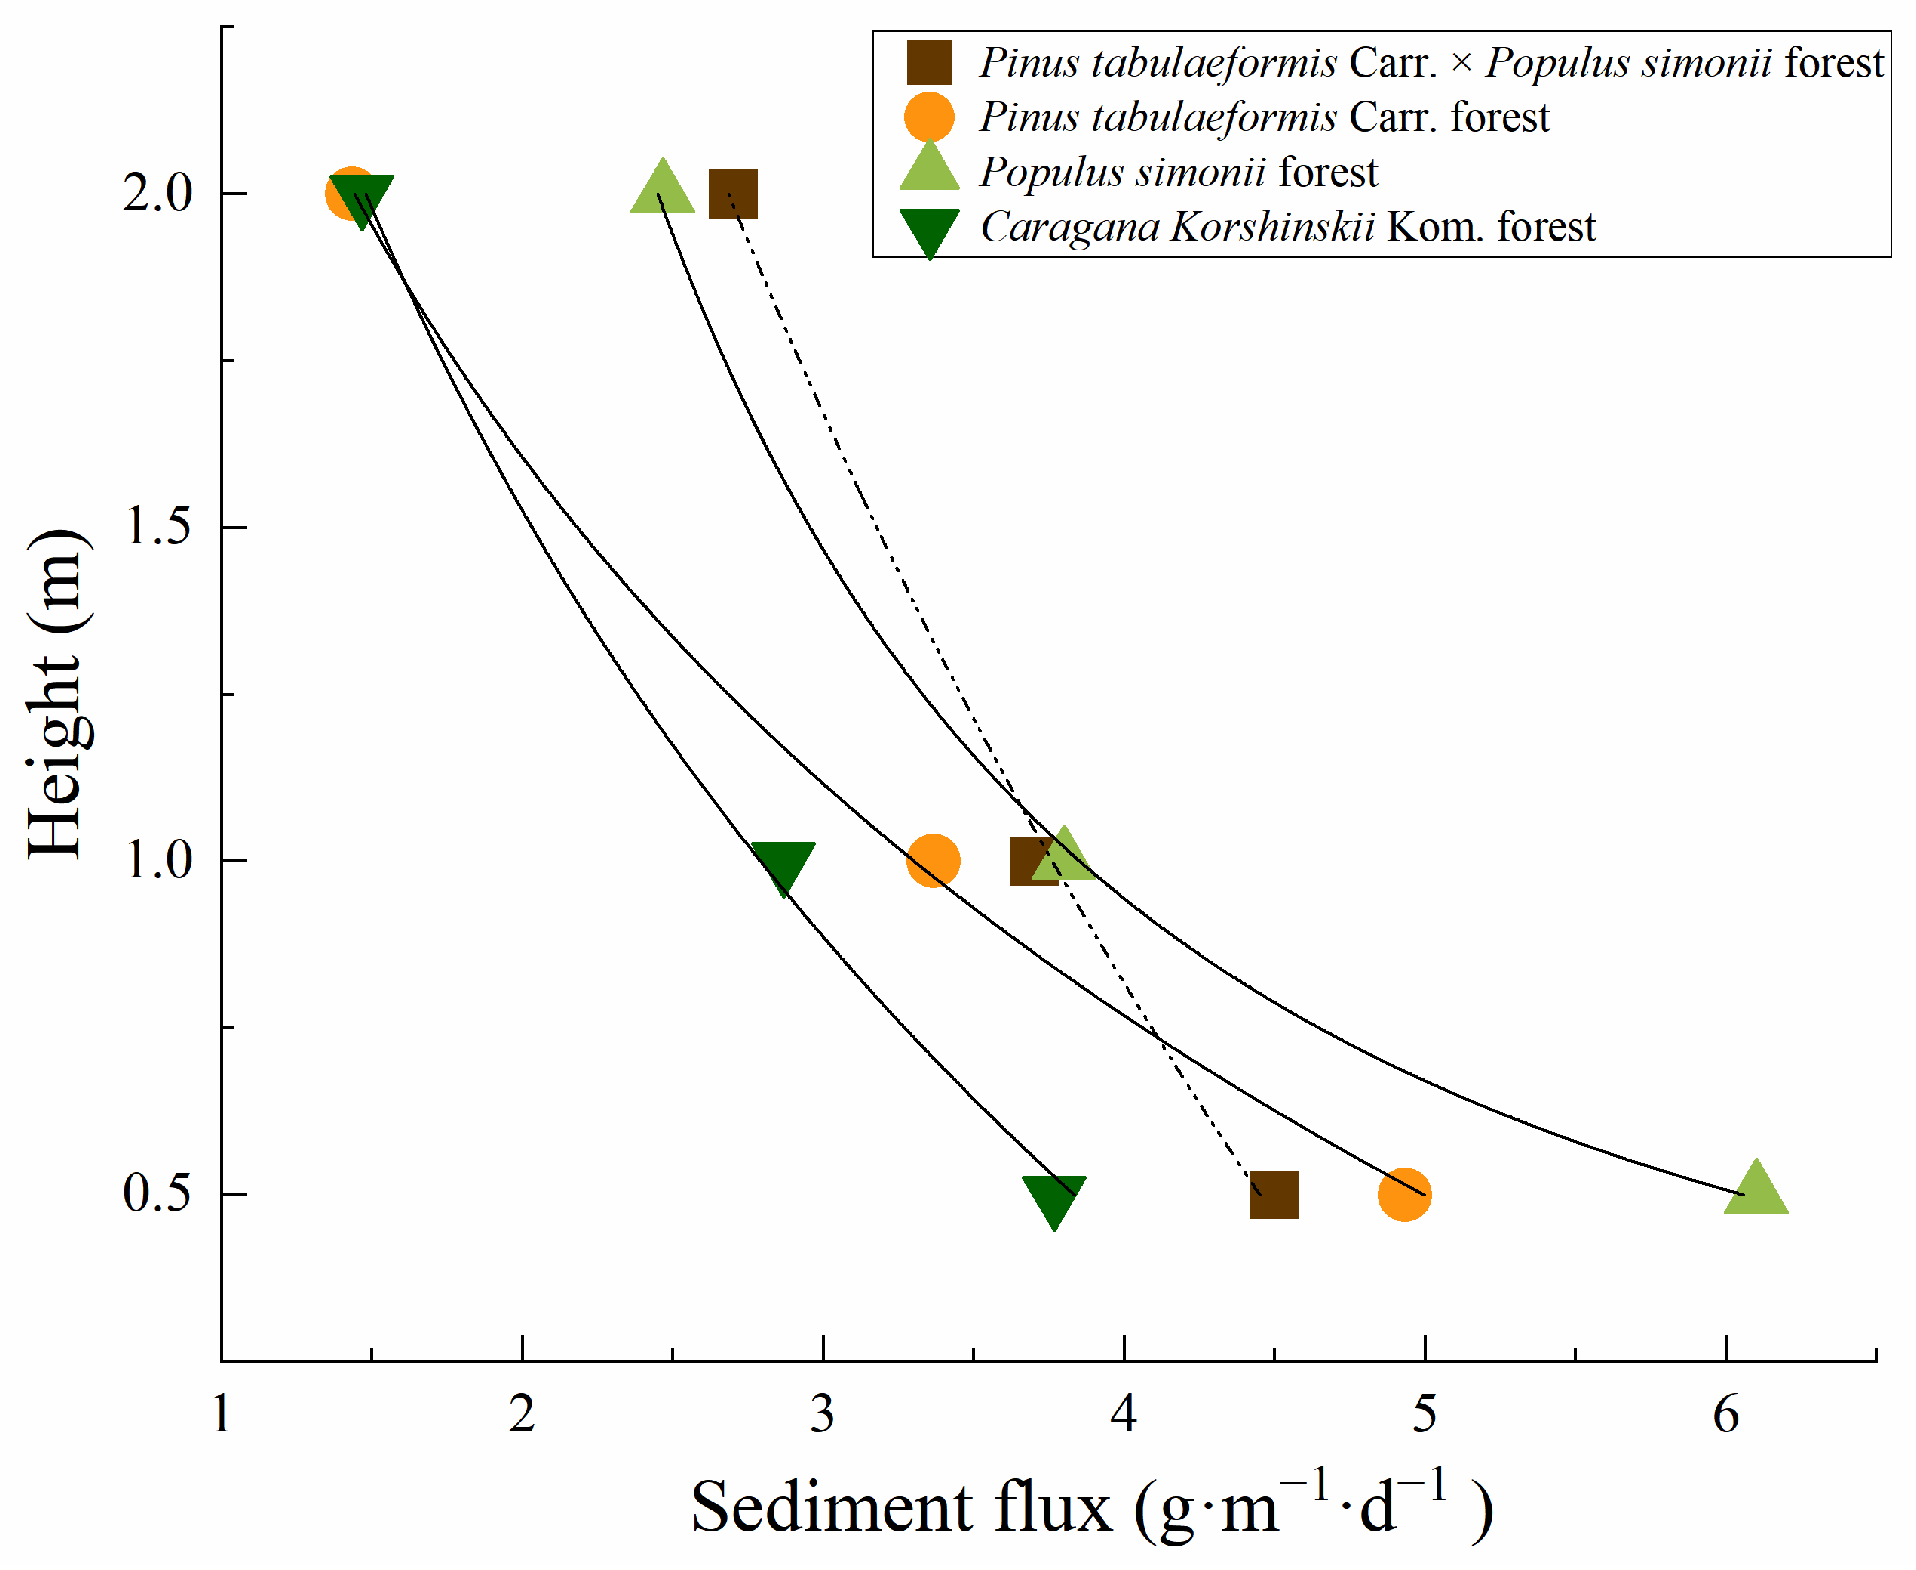
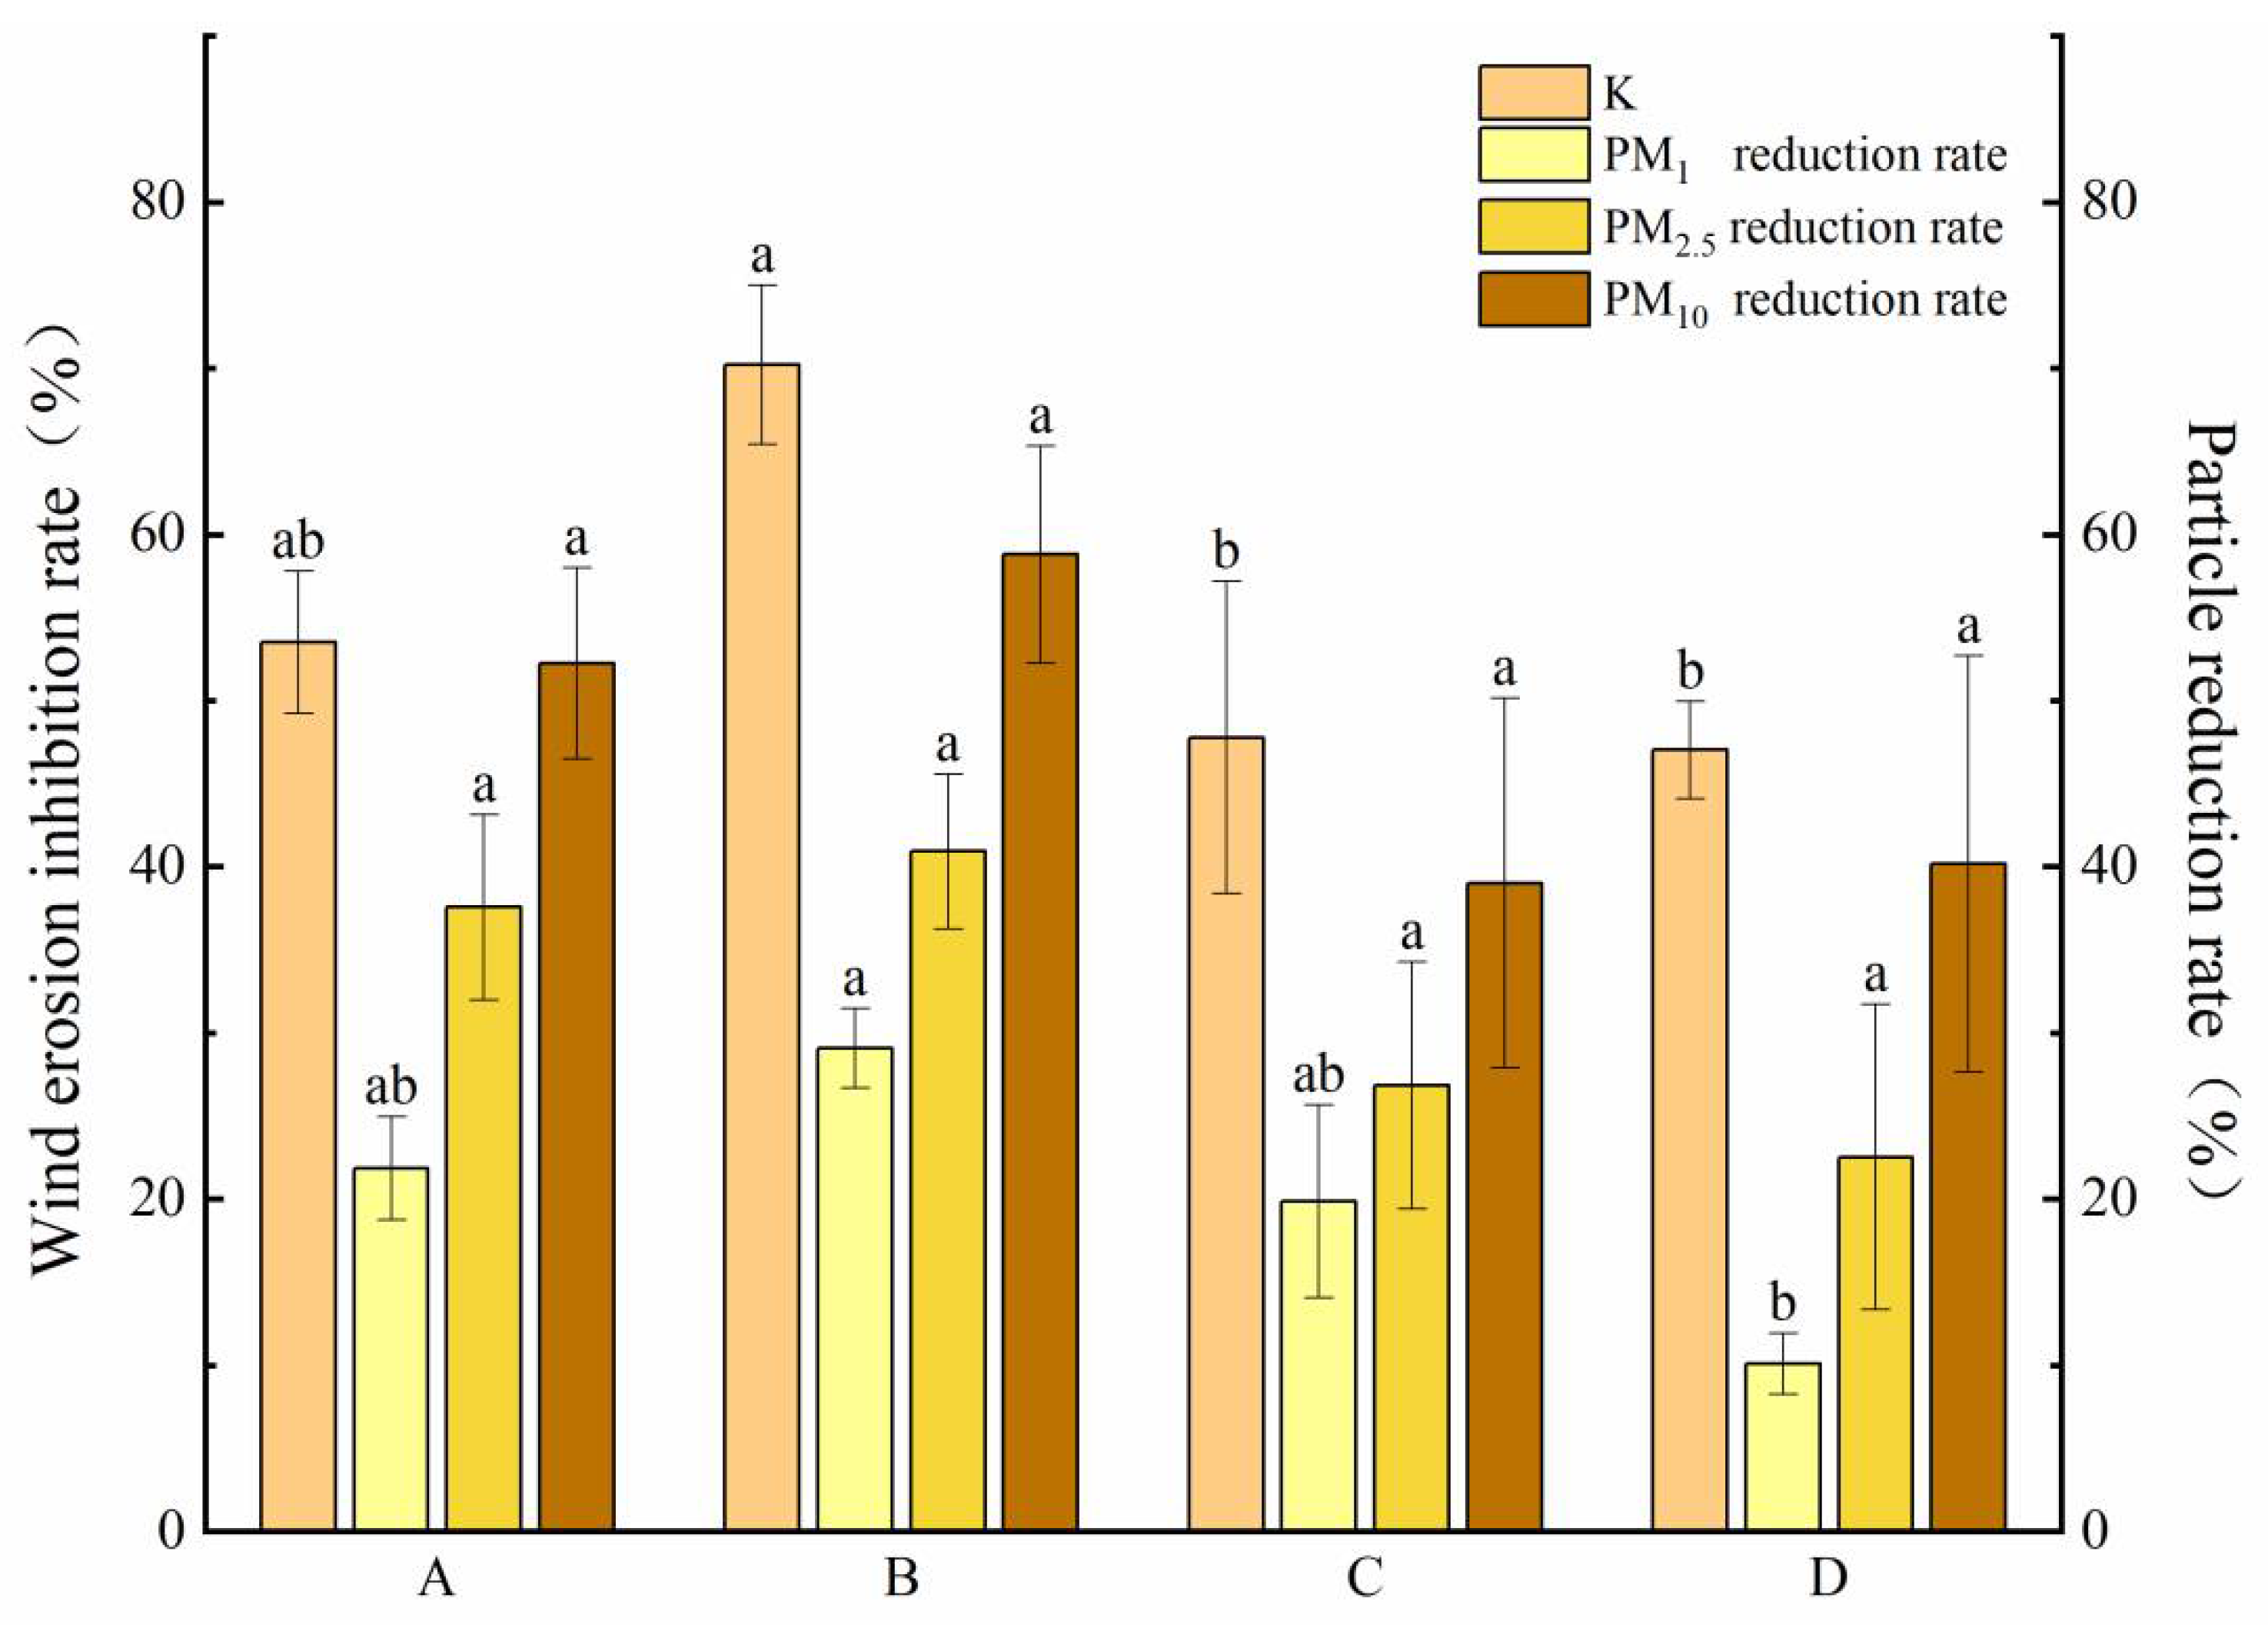
3.2. Wind-Eroded Dust Removal Efficiency of Different Stand Types

As a whole, the wind protection effect of shelterbelts shows a weakening trend with the increase of distance (Figure 3). In the horizontal direction, the windbreak effect of the Pinus tabulaeformis Carr. forest and Populus simonii forest at the heights of 0.5 m and 2 m were roughly the same. The difference was that the windbreak effect of Populus simonii forest in the lee was largest at 1H, and that of the Pinus tabulaeformis Carr. forest in the lee was largest at 3H, and then gradually decreased (Figure 3a,b). In the vertical direction, the wind-proofing effects of the Pinus tabulaeformis Carr. forest and Populus simonii forest were largest at the 2 m height, 82.85% and 51.37%, respectively, while the maximum windproofing effect of the Caragana korshinskii Kom. forest, determed to be 0.5 m above the ground, was 54.37% (Figure 3d). On the whole, a Pinus tabulaeformis Carr. forest can effectively reduce wind speed and wind erosion.
Aeolian sand flux values in the Pinus tabulaeformis Carr. forest, Pinus tabulaeformis Carr. × Populus simonii forest and Caragana korshinskii Kom. forest decreased with increasing height, which is well described by a logarithmic function (Figure 4). At 0.5 m and 1 m above the ground, the sediment flux of the Caragana korshinskii Kom. forest was the lowest, and at 2 m height, the sediment flux of the Pinus tabulaeformis Carr. forest was the lowest. The sediment flux at 0.5 m was, in the order of large to small, as follows: Populus simonii forest (6.1 g·m−1·d−1) > Pinus tabulaeformis Carr. forest (4.93 g·m−1·d−1) > Pinus tabulaeformis Carr. × Populus simonii forest (4.5 g·m−1·d−1) > Caragana korshinskii Kom. forest (3.76 g·m−1·d−1). At 1 m, the sediment flux from large to small was Populus simonii forest (3.8 g·m−1·d−1) > Pinus tabulaeformis Carr. × Populus simonii forest (3.7 g·m−1·d−1) > Pinus tabulaeformis Carr. forest (3.36 g·m−1·d−1) > Caragana korshinskii Kom. forest (2.86 g·m−1·d−1). For the 2 m height, the sediment transport order, from large to small, was Pinus tabulaeformis Carr. × Populus simonii forest (2.7 g·m−1·d−1) > Populus simonii forest (2.46 g·m−1·d−1) > Caragana korshinskii Kom. forest (1.46 g·m−1·d−1) > Pinus tabulaeformis Carr. forest (1.43 g·m−1·d−1).
The monitoring results for particulate matter concentration showed that the vertical flux outside the forest was greater than that inside the forest (Figure 5), and the decreasing trend of the vertical flux of particulate matter in the forest was reflected in all areas. In the Pinus tabulaeformis Carr. forest, the vertical flux of particulate matter decreased greatly, and the rate of decrease for PM10 was quicker than those of PM2.5 and PM1. This shows that the shelterbelts accelerate the settling of particulate matter, and the settling rate of coarse particulate matter is higher than that of fine particulate matter. The results of one-way ANOVA showed that the wind-erosion inhibition rate and PM1 reduction rate of the Pinus tabulaeformis Carr. forest were significantly higher than those of the Populus simonii forest, Pinus tabulaeformis Carr. × Populus simonii forest and Caragana korshinskii Kom. forest (Figure 6).

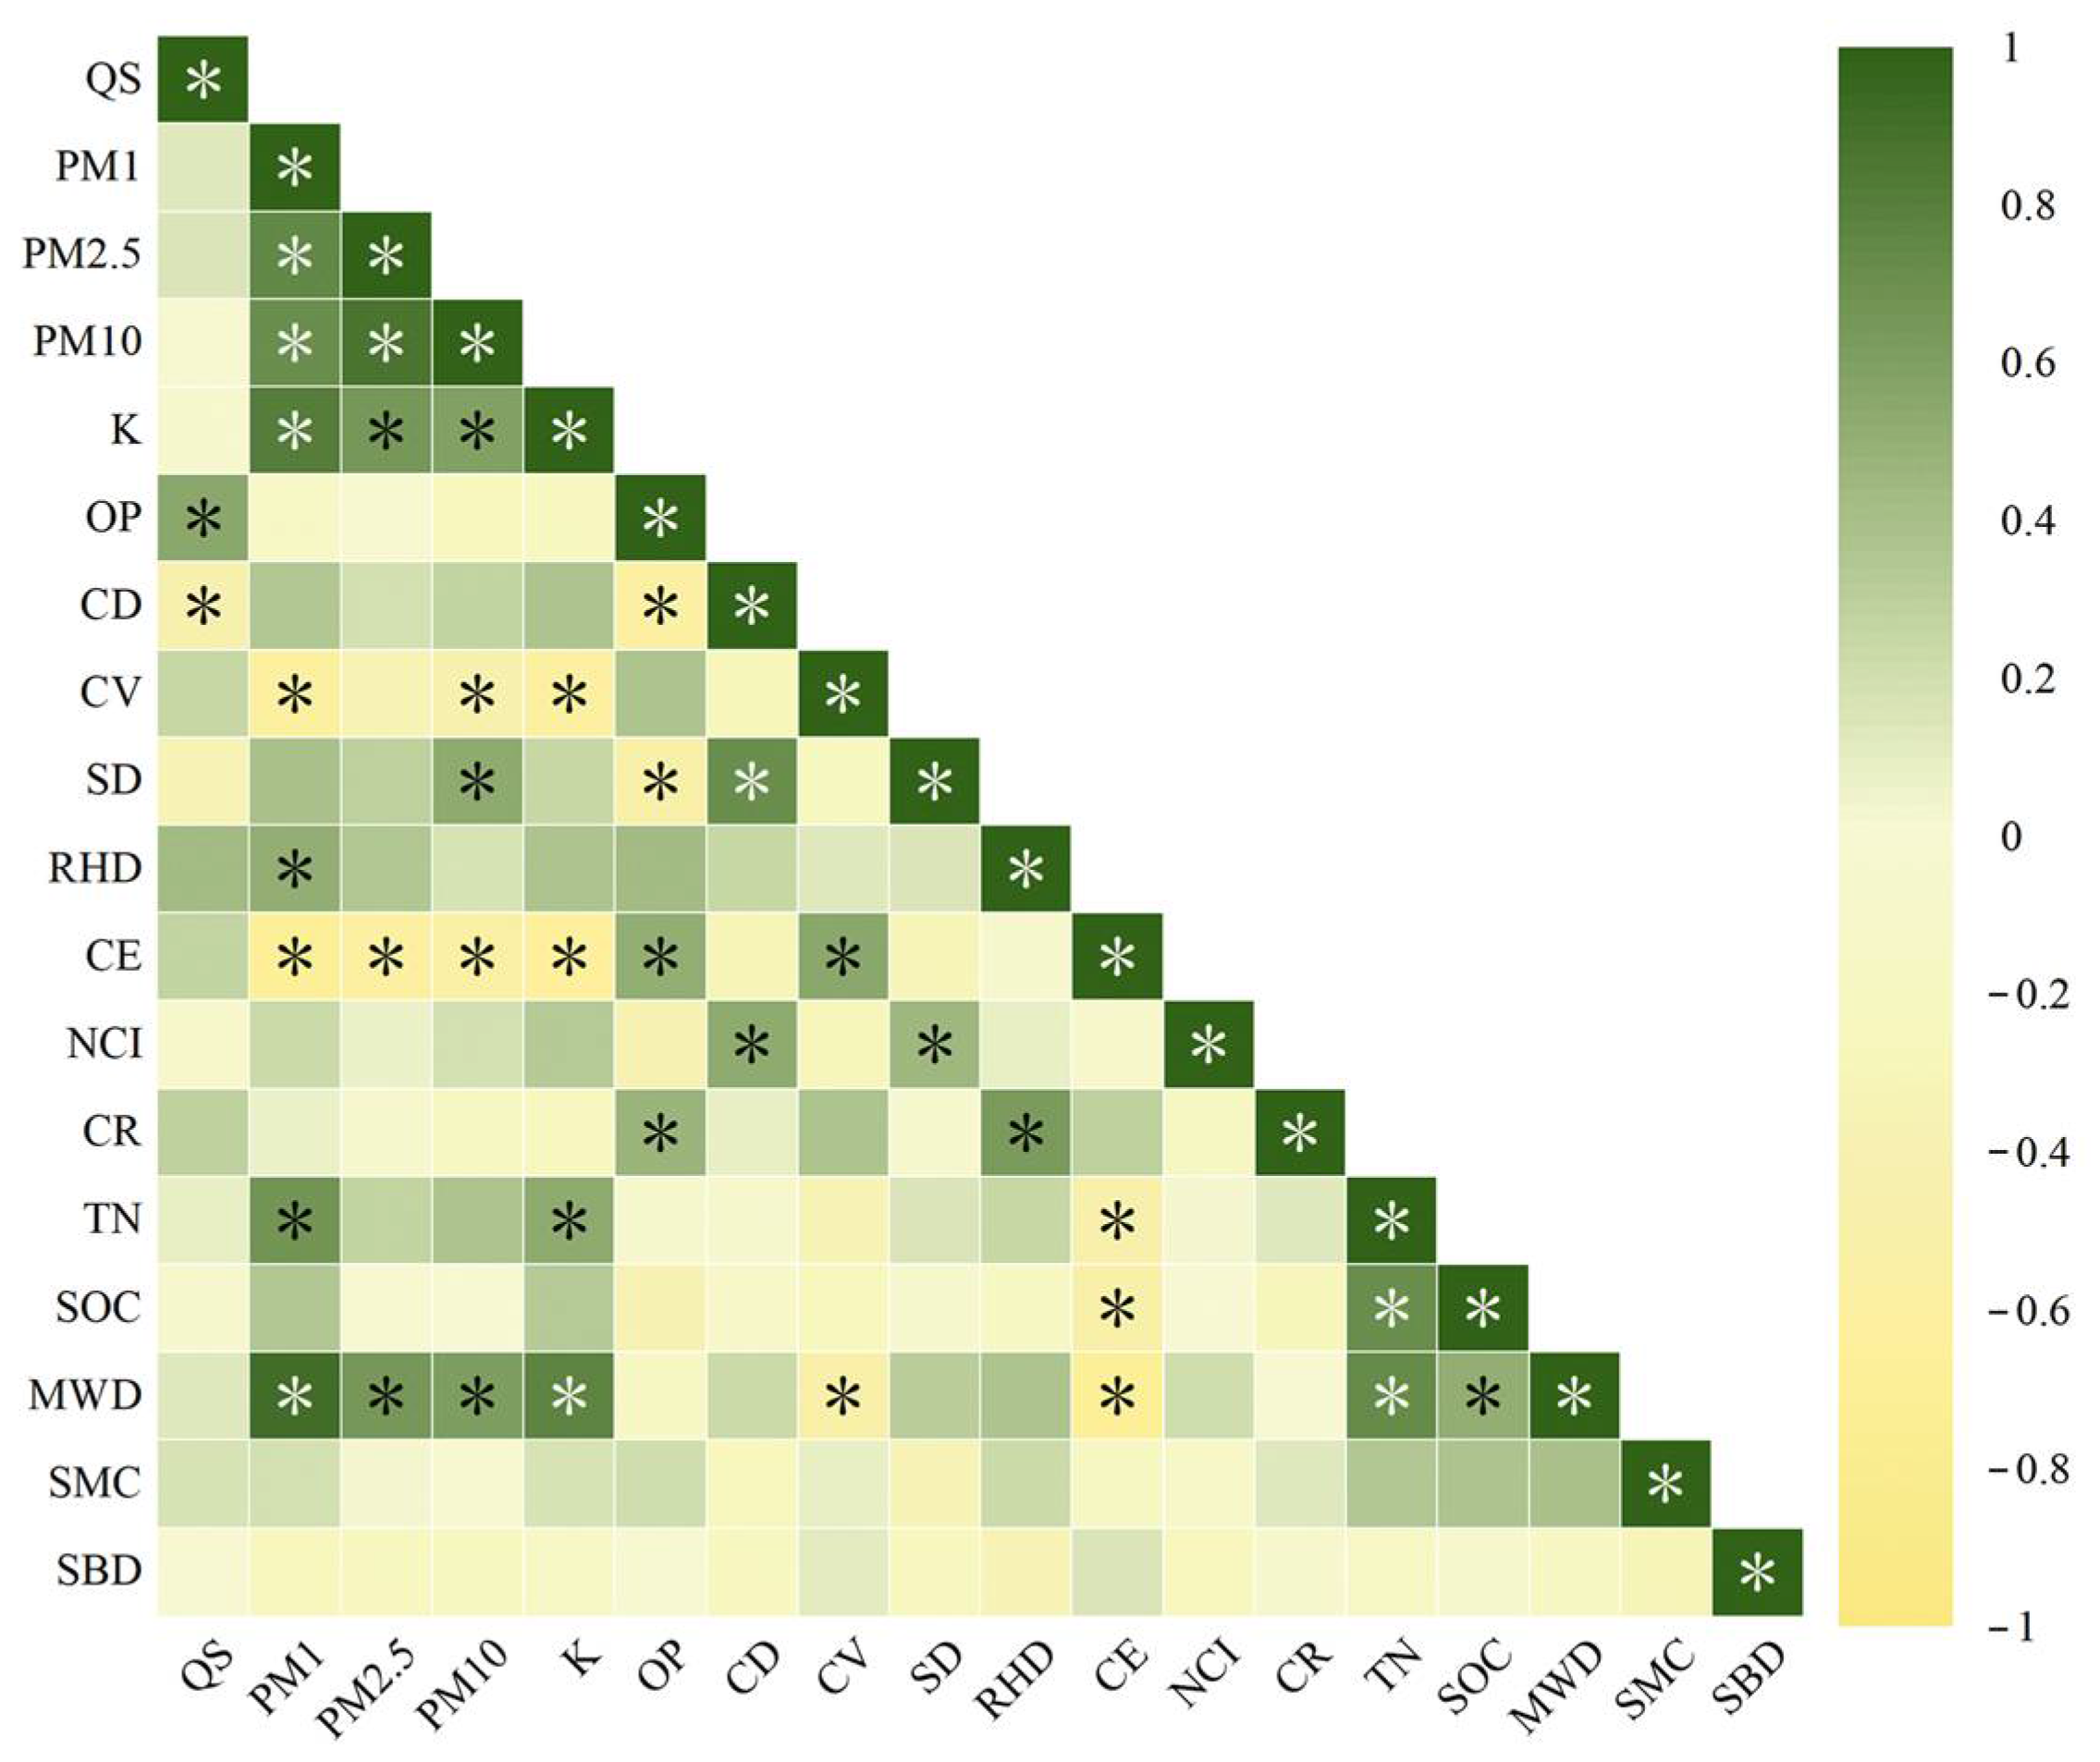
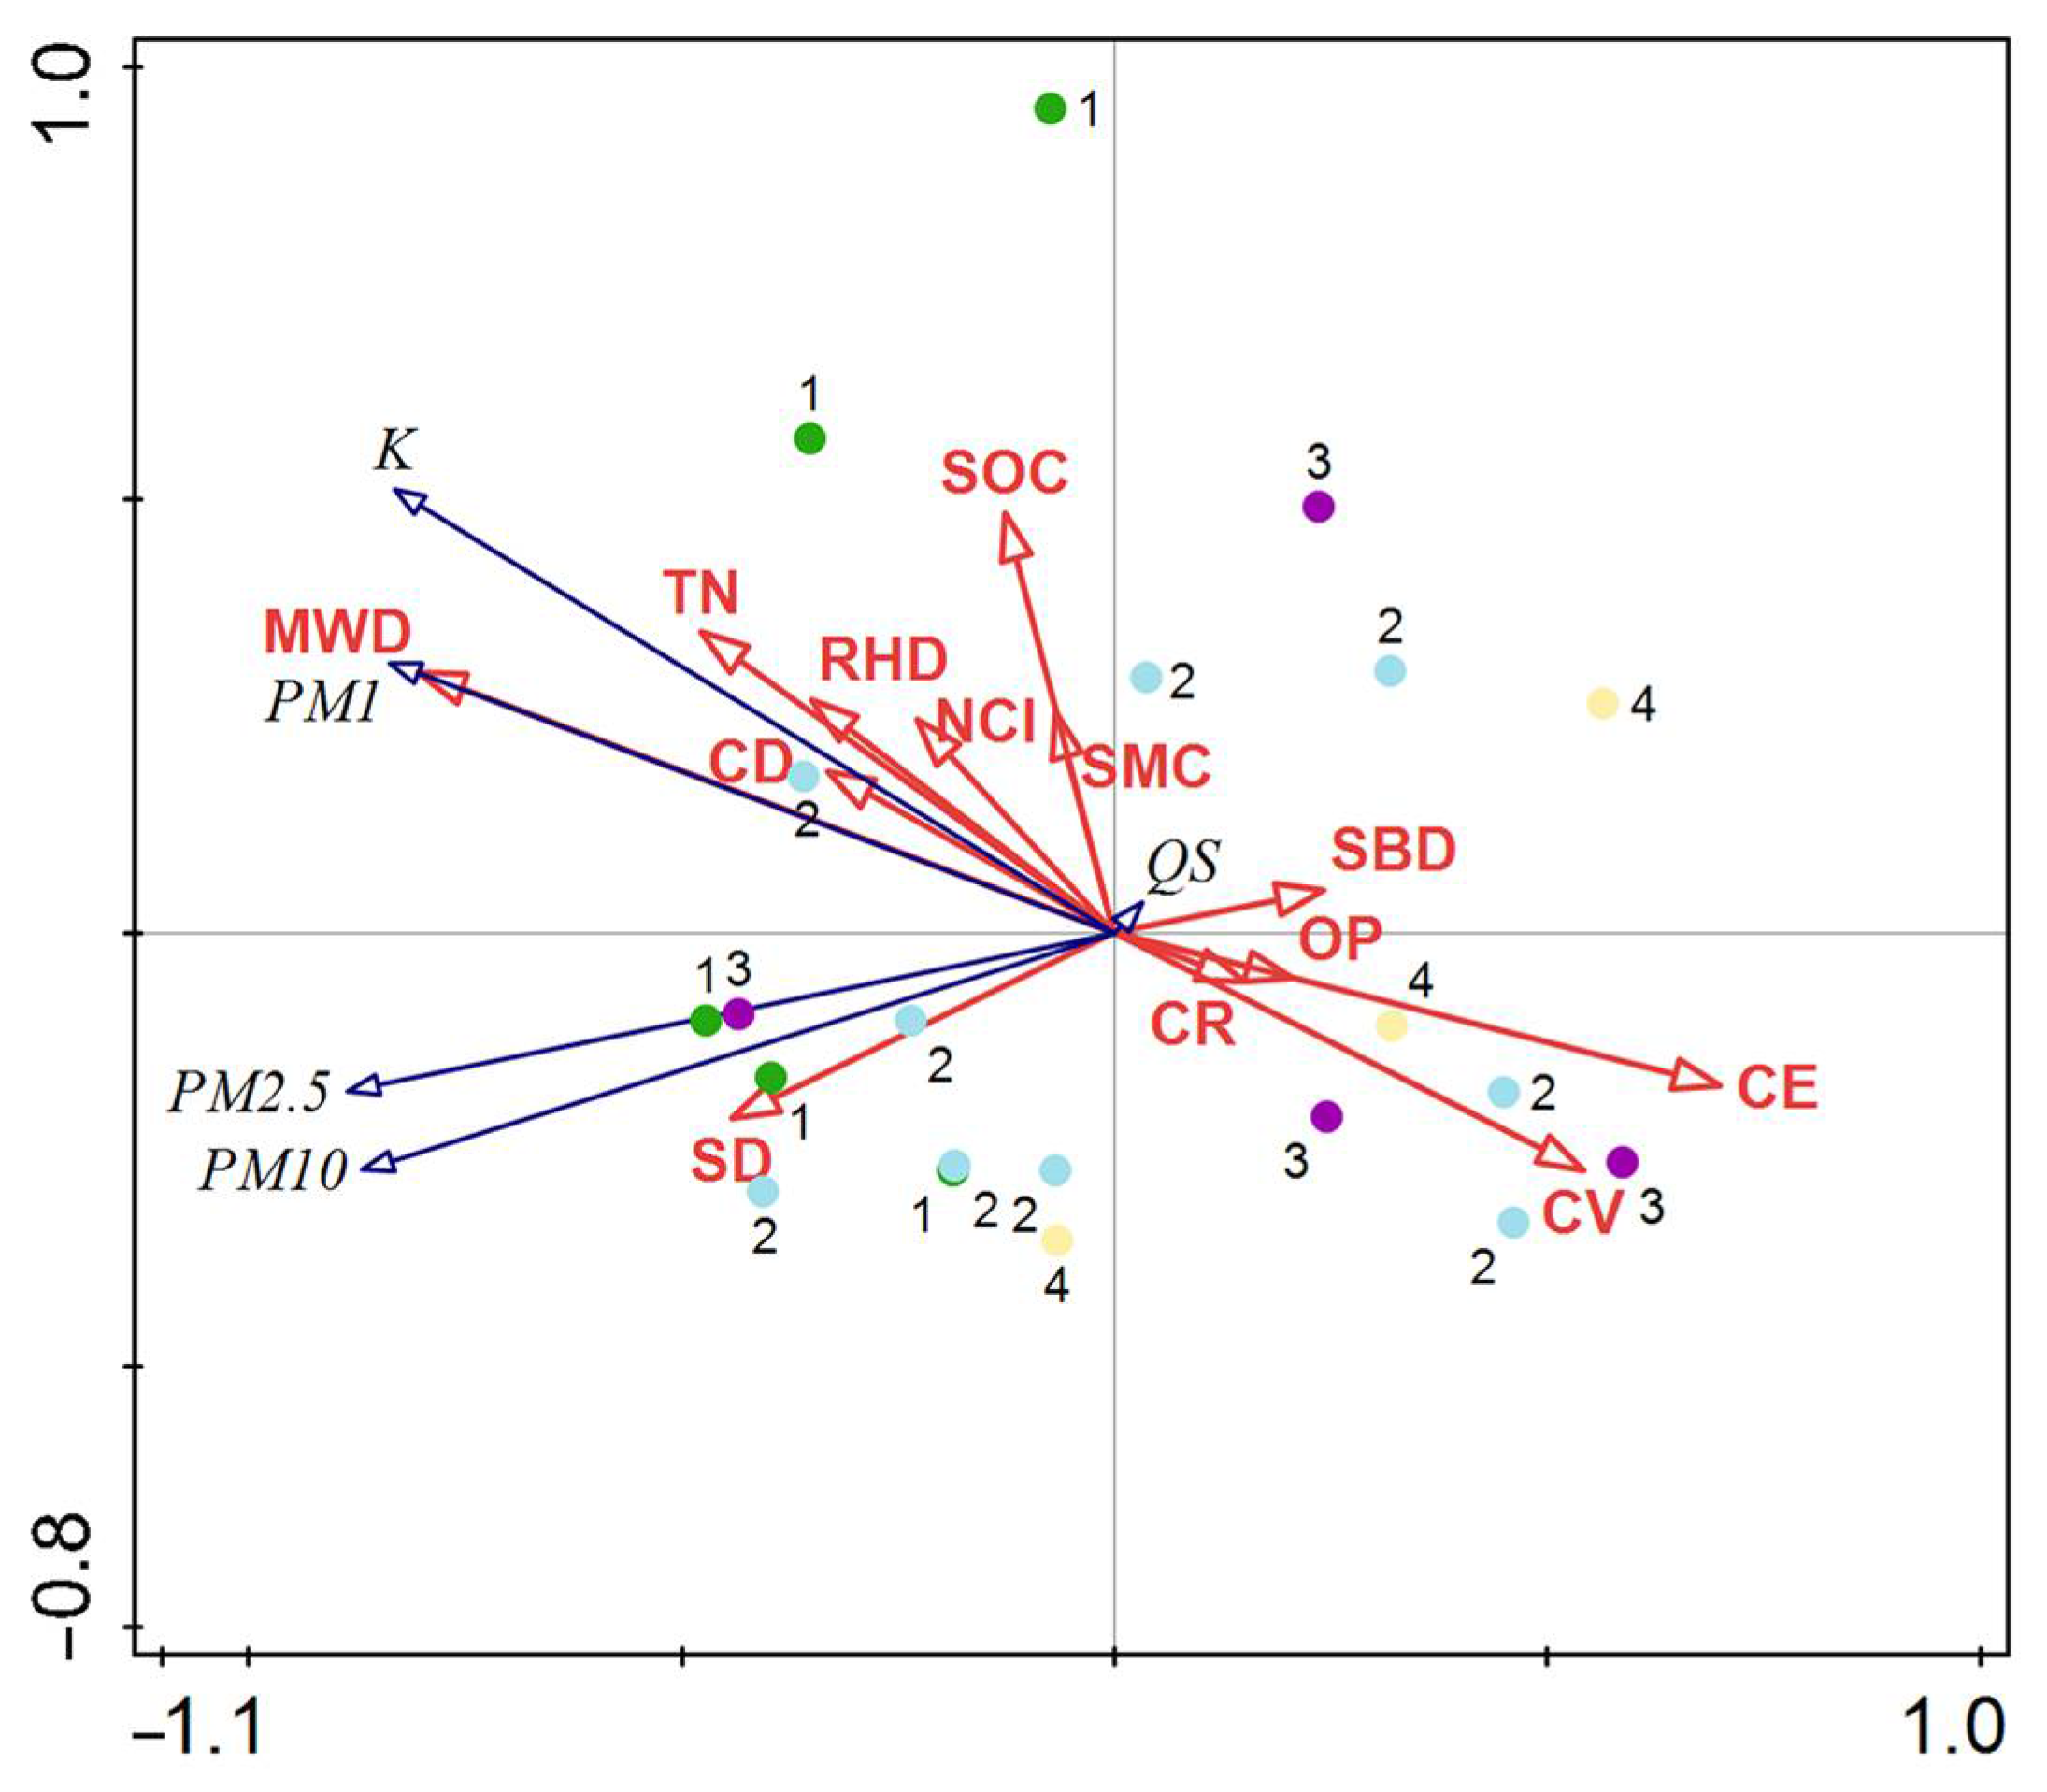
3.3. Effects of Stand Type, Stand Structure and Soil Characteristics on Wind-Eroded Dust

Through correlation analysis, the correlations between stand structure, soil properties and wind-eroded dust index were explored. The results showed that OP, SD, RHD and TN were positively correlated with the wind-eroded dust index (p < 0.05) The Clark–Evans index, CD and CV were negatively correlated with the wind-eroded dust index (p < 0.05). The more uniform the distribution of DBH size, the stronger the inhibition ability relative to wind erosion and dust. The density and PM10 were positively correlated, indicating that the greater the stand density, the stronger the reduction effect on PM10 (Figure 7).
The overall explanatory ability of the redundancy analysis (RDA) model for wind-eroded dust is 73.97% (p = 0.002), and the eigenvalues are 0.7397, 0.1123, 0.0339 and 0.0208, respectively (Figure 8).
The influence of each factor on the function of shelterbelts to block wind-eroded dust was determined by its interpretation value; among these factors, MWD was the highest (48.9%, p = 0.002), followed by SOC (10.2%, p = 0.022), CE (6.1%, p = 0.078), SMC (4.2%, p = 0.102), CR (3.2%, p = 0.202), RHD (3.0%, p = 0.218), CV (2.3%, p = 0.24), CD (2.3%, p = 0.288) and the OP (1.8%, p = 0.346).
A generalized linear mixture model (GLMM) was used to fit the relationship between PM1 reduction rate and stand type, OP, CV, RHD, MWD, SOC and CD. The results showed that stand type (p = 0.021), CV (p = 0.000) and MWD (p = 0.003) could effectively explain the PM1 reduction rate (Table 2).

4. Discussion

4.1. Stand Structures and Soil Properties of the Four Types of Shelterbelts

The growth of the Pinus tabulaeformis Carr. forest was more stable, as shown by comparing the variation coefficients of diameter at breast height [40]. The distribution pattern showed that the distribution of the Pinus tabulaeformis Carr. forest with high stability was clustered, the distributions of the Populus simonii forest and Pinus tabulaeformis Carr. × Populus simonii forest were uniform, and the distribution of the Caragana korshinskii Kom. forest was random. The OP and RHD of the Populus simonii forest were significantly higher than those of other stand types, indicating that the growth of poplar was not better than that observed in other stands, and further research is needed on the factors affecting the growth of a Populus simonii forest. The results show that the open stand structure of a Populus simonii forest can reduce wind speed, possibly because the open forest space is conducive to air flow [17], but the inhibition ability as to soil wind-erosion is low. However, due to its complex stand structure, a Pinus tabulaeformis Carr. forest can not only reduce wind speed, but also reduce the occurrence of soil wind-eroded dust [41]. In the study area, there were no significant differences in the soils under the different stand types.

4.2. Characteristics of Wind-Eroded Dust and Reduction Rates of Particulate Matter in Different Shelterbelts

Within the same stand type, the sediment flux is affected by wind speed and duration [21]. So, after measuring the sediment flux in different stand types at the same time, the results showed that the Pinus tabulaeformis Carr. forest had the best wind and sand consolidation effect, followed by Caragana korshinskii Kom. forest, while the Pinus tabulaeformis Carr. × Populus simonii forest had the worst wind and sand consolidation effect [42]. In this study, the wind-erosion inhibition rate of the Pinus tabulaeformis Carr. forest was significantly different from those of the other stand types, indicating that the Pinus tabulaeformis Carr. forest had a significant effect on wind-erosion control in spring. Cao et al. showed that the functioning of a plantation can be optimized by introducing a Pinus tabulaeformis Carr. forest [43]. Because the roots of a Pinus tabulaeformis Carr. forest are mainly distributed in shallow soil and the biomass density of the Pinus tabulaeformis Carr. fine roots is high, it can consolidate soil better. The efficiency of shelterbelts in the reduction of PM1 is more obvious than that seen with PM2.5 or PM10. The results of this study showed that the largest rate of reduction for PM1 in spring was in the Pinus tabulaeformis Carr. forest, and the needles of Pinus tabulaeformis Carr. forest could block more particles [25,41]. Arboreal forests have a larger canopy area, which can better mix and dilute pollutants in the air, providing a larger surface area for particle capture and retention. Perhaps because the experiment was carried out in spring, when the Pinus tabulaeformis Carr. × Populus simonii forest and the Populus simonii forest had not yet grown leaves, their functions of blocking particulate matter had not been maximized.
The wind protection efficiency of the Caragana korshinskii Kom. forest is best at 0.5 m above the ground, a height which can better limit the initial flight of sand grains, which is consistent with the results of Wu et al. [44,45]. By trapping sand grains near the surface of the soil, shrubbery can better fix soil particles, and this has a more effective direct effect on wind erosion than seen with trees [46,47]. However, forests affect wind erosion and dust more effectively than shrubs by reducing wind speed downwind [8,42]. An appropriate increase in tree branches and density can effectively reduce wind erosion and particulate matter concentration.
The vertical diffusion speed of particulate matter outside the forest is greater than that inside the forest, and the wind speed slows down due to the blocking effects of trees in the shelterbelts, thus affecting the diffusion of particulate matter. In the shelterbelts, compared with PM1 and PM2.5, the vertical flux of PM10 decreases the most, and its wide distribution indicates that this has a significant impact on air quality, a finding which is similar to the results of GUEVARA-MACiAS et al. [48]. The increases in particulate matter concentrations within shelterbelts occur through impacts near forest edges and tree tops, as well as sedimentation within forests, with most of the increase occurring in the upper, rather than lower, layers. Since the experiment was carried out in spring and the Populus simonii forest had not yet grown leaves, its open upper space was conducive to the migration of particles carried by air flow. In addition, the direction of the wind also affects the dispersion of particles [24,49]. The main wind directions associated with the study site are the northwest wind and southwest wind, and a downwind direction has a tendency to reduce the particle settlement rate. Particle size is one of the main factors affecting the diffusion of particulate matter, and coarse particles are deposited more quickly than fine particles [8,50]. The smaller the particle size, the smaller the air resistance, the stronger the liftoff ability and the farther the diffusion distance.

4.3. Influencing Factors of Wind Erosion and Dust

It was found that the reduction rates for particulate matter in shelterbelts were different due to stand type, stand structure, soil properties and particle size. Because different stand types reduce wind speed to different degrees, which affects the diffusion of particulate matter, and the path is tortuous, the reduction rate of particulate matter is not easy to predict accurately. The results showed that among the stand types, the Pinus tabulaeformis Carr. forest had a significant effect on inhibiting soil wind-erosion and dust. In terms of stand structure, the DBH variation coefficient (CV) has the greatest influence on the inhibition of wind-eroded dust in shelterbelts. For soil, the mean weight diameter of soil aggregates (MWD) has the greatest influence on the wind erosion and dust removal of shelterbelts. For the PM1 reduction rate, stand structure (p = 0.000) > soil properties (p = 0.003) > stand type (p = 0.021).
In the evaluation and investigation of shelterbelts, it is helpful to evaluate the overall sustainability and environmental impacts of ecological measures on wind-erosion control. In the process of planting shelterbelts, it is necessary to comprehensively consider the characteristics of stand structure and soil properties. According to different regions and different ecological environments, measures such as planting native conifer species to build wind-erosion shelterbelts and repairing degraded shelterbelts can be taken to effectively prevent the occurrence of soil wind-erosion and dust. Finally, in future studies, it is necessary to consider the impact of the occurrence of extreme weather as a variable on the evaluation of wind-erosion prevention measures, in the context of intensified climate change.

5. Conclusions

Different stand types have significant differences in wind and sand prevention and particle reduction. The wind-erosion inhibition rate and particulate matter reduction rate of Pinus tabulaeformis Carr. forest were significantly higher than those of the Populus simonii, Pinus tabulaeformis Carr. × Populus simonii forest and the Caragana korshinskii Kom. forest (p < 0.05). The wind-erosion inhibition rate of the Caragana korshinskii Kom. forest is high, and the particle reduction effect is weak.
Particle size is an important factor affecting the diffusion of particulate matter. Fine particulate matter is easier to diffuse and effectively control, while coarse particulate matter settles more easily.
The stand types, stand structures and soil characteristics of shelterbelts all contribute to the reduction of wind erosion and dust, and the DBH variation coefficient (CV) has the greatest effect on the reduction rate of PM1. The interactions of shelterbelts should be considered in the establishment of shelterbelts, so as to better establish shelterbelts that can prevent wind, fix sand and reduce particulate matter.

Author Contributions

X.C.: Validation, Supervision, Software, Resources, Project administration, Funding acquisition, Formal analysis, Data curation, Conceptualization. B.Y.: Writing—review and editing, Writing—original draft, Visualization, Project administration, Methodology, Investigation, Formal analysis, Data curation. Y.C.: Visualization, Validation, Software, Investigation, Data curation. M.F.: Validation, Supervision, Formal analysis, Data curation. Z.L.: Validation, Software, Data curation. L.S.: Methodology, Investigation. All authors have read and agreed to the published version of the manuscript.

Funding

This research was funded by National Natural Science Foundation of China, grant numbers 32201630; Shanxi Provincial Program on Basic Research Project, grant number 202203021212429; Shanxi Provincial Program on Basic Research Project, grant number 202203021222014; Doctoral Research Startup Foundation of Shanxi Agricultural University, grant number 2021BQ105; Excellent Youth Training Program of Shanxi Agricultural University, grant numbers 2024YQPYGC06; and Scientific research projects with reward funds for doctoral graduates and postdoctoral researchers working in Shanxi Province, grant number SXBYKY2022052.

Data Availability Statement

The authors do not have permission to share the data.

Acknowledgments

We would like to thank our colleagues for their comments and the funding support for this article.

Conflicts of Interest

The authors declare that they have no known competing financial interests or personal relationships that could have appeared to influence the work reported in this paper.

References

  1. Kelley, M.C.; Ardon-Dryer, K. Analyzing two decades of dust events on the Southern Great Plains region of West Texas. Atmos. Pollut. Res. 2021, 12, 101091. [Google Scholar] [CrossRef]
  2. Liu, T.Y.; Duan, F.K.; Ma, Y.L.; Ma, T.; Zhang, Q.Q.; Xu, Y.Z.; Li, F.; Huang, T.; Kimoto, T.; Zhang, Q.; et al. Classification and sources of extremely severe sandstorms mixed with haze pollution in Beijing. Environ. Pollut. 2023, 322, 121154. [Google Scholar] [CrossRef]
  3. Csavina, J.; Field, J.; Félix, O.; Corral-Avitia, A.Y.; Sáez, A.E.; Betterton, E.A. Effect of wind speed and relative humidity on atmospheric dust concentrations in semi-arid climates. Sci. Total Environ. 2014, 487, 82–90. [Google Scholar] [CrossRef] [PubMed]
  4. Alvarez, C.A.; Carbajal, N. Regions of influence and environmental effects of Santa Ana wind event. Air Qual. Atmos. Health 2019, 12, 1019–1034. [Google Scholar] [CrossRef]
  5. Joshi, J.R. Quantifying the impact of cropland wind erosion on air quality: A high-resolution modeling case study of an Arizona dust storm. Atmos. Environ. 2021, 263, 118658. [Google Scholar] [CrossRef]
  6. Dhital, S.; Webb, N.P.; Chappell, A.; Kaplan, M.L.; Nauman, T.W.; Tyree, G.; Duniway, M.C.; Edwards, B.; Legrand, S.L.; Letcher, T.W.; et al. Synoptic Analysis and WRF-Chem Model Simulation of Dust Events in the Southwestern United States. J. Geophys. Res.-Atmos. 2024, 129, e2023JD040650. [Google Scholar] [CrossRef]
  7. Rezaei, M.; Sameni, A.; Shamsi, S.R.F.; Bartholomeus, H. Remote sensing of land use/cover changes and its effect on wind erosion potential in southern Iran. PeerJ 2016, 4, e1948. [Google Scholar] [CrossRef]
  8. Miri, A.; Webb, N.P. The impact of a multiple-row Tamarix windbreak on grain size parameters of aeolian sand flux. Soil Sci. Soc. Am. J. 2024, 88, 482–497. [Google Scholar] [CrossRef]
  9. Yang, X.G.; Li, F.R.; Fan, W.Y.; Liu, G.W.; Yu, Y. Evaluating the efficiency of wind protection by windbreaks based on remote sensing and geographic information systems. Agrofor. Syst. 2021, 95, 353–365. [Google Scholar] [CrossRef]
  10. Cong, L.; Zhang, H.; Zhai, J.X.; Yan, G.X.; Wu, Y.N.; Wang, Y.; Ma, W.M.; Zhang, Z.M.; Chen, P.J. The blocking effect of atmospheric particles by forest and wetland at different air quality grades in Beijing China. Environ. Technol. 2020, 41, 2266–2276. [Google Scholar] [CrossRef]
  11. Nauman, T.W.; Munson, S.M.; Dhital, S.; Webb, N.P.; Duniway, M.C. Synergistic soil, land use, and climate influences on wind erosion on the Colorado Plateau: Implications for management. Sci. Total Environ. 2023, 893, 164605. [Google Scholar] [CrossRef]
  12. Zhai, J.J.; Wang, L.; Liu, Y.; Wang, C.Y.; Mao, X.G. Assessing the effects of China’s Three-North Shelter Forest Program over 40 years. Sci. Total Environ. 2023, 857, 159354. [Google Scholar] [CrossRef]
  13. Li, H.L.; Wang, Y.D.; Li, S.Y.; Askar, A.; Wang, H.F. Shelter Efficiency of Various Shelterbelt Configurations: A Wind Tunnel Study. Atmosphere 2022, 13, 1022. [Google Scholar] [CrossRef]
  14. Zhang, X.L.; Buddhika, J.W.G.; Wang, J.Y.; Weerasuriya, A.U.; Tse, K.T. Numerical investigation of effects of trees on cross-ventilation of an isolated building. J. Build. Eng. 2023, 73, 106808. [Google Scholar] [CrossRef]
  15. Vacek, Z.; Rehácek, D.; Cukor, J.; Vacek, S.; Khel, T.; Sharma, R.P.; Kucera, J.; Král, J.; Papaj, V. Windbreak Efficiency in Agricultural Landscape of the Central Europe: Multiple Approaches to Wind Erosion Control. Environ. Manag. 2018, 62, 942–954. [Google Scholar] [CrossRef] [PubMed]
  16. Krasovitov, B.; Fominykh, A.; Levy, A.; Kleeorin, N.; Katra, I. Dry deposition of dust particles during medium- and high-level dust storms to a forest canopy in a semi-arid region. Atmos. Pollut. Res. 2021, 12, 101058. [Google Scholar] [CrossRef]
  17. Li, H.; Yan, Z.F.; Zhang, Z.M.; Lang, J.C.; Wang, X.D. A Numerical Study of the Effect of Vegetative Windbreak on Wind Erosion over Complex Terrain. Forests 2022, 13, 1072. [Google Scholar] [CrossRef]
  18. Du, H.Q.; Liu, X.L.; Ding, R.Q.; Fan, Y.W.; Liu, X.F. New insights into dust emission mechanism in natural environments based on a series of field observations. Sci. Total Environ. 2024, 914, 169888. [Google Scholar] [CrossRef] [PubMed]
  19. Liu, J.Y.; Zheng, B.H. A Simulation Study on the Influence of Street Tree Configuration on Fine Particulate Matter (PM2.5) Concentration in Street Canyons. Forests 2023, 14, 1550. [Google Scholar] [CrossRef]
  20. Polinko, A.D.; Willis, J.L.; Sharma, A.; Guldin, J.M. Stand-level structural characteristics dictate hurricane resistance and resilience more than silvicultural regime in longleaf pine woodlands. For. Ecol. Manag. 2022, 526, 120585. [Google Scholar] [CrossRef]
  21. Miri, A.; Webb, N.P. Characterizing the spatial variations of wind velocity and turbulence intensity around a single Tamarix tree. Geomorphology 2022, 414, 108382. [Google Scholar] [CrossRef]
  22. Miri, A.; Davidson-Arnott, R. The effectiveness of a single Tamarix tree in reducing aeolian erosion in an arid region. Agric. For. Meteorol. 2021, 300, 108324. [Google Scholar] [CrossRef]
  23. Chang, X.M.; Sun, L.B.; Yu, X.X.; Liu, Z.Q.; Jia, G.D.; Wang, Y.S.; Zhu, X.H. Windbreak efficiency in controlling wind erosion and particulate matter concentrations from farmlands. Agric. Ecosyst. Environ. 2021, 308, 107269. [Google Scholar] [CrossRef]
  24. Xiong, J.W.; Li, J.; Gao, F.; Zhang, Y. City Wind Impact on Air Pollution Control for Urban Planning with Different Time-Scale Considerations: A Case Study in Chengdu, China. Atmosphere 2023, 14, 1068. [Google Scholar] [CrossRef]
  25. Tarodiya, R.; Krasovitov, B.; Kleeorin, N.; Levy, A.; Katra, I. Numerical study of dry deposition of dust-PM10 on leaves of coniferous forest. Atmos. Pollut. Res. 2023, 14, 101859. [Google Scholar] [CrossRef]
  26. Zhang, B.H.; Qu, Z.Q.; Lv, S.J.; Han, G.D.; Gao, C.P.; Wilkes, A.; Li, J.R.; Li, Z.G.; Wang, S.H.; Wang, R.; et al. Grazing effects on total carbon and nitrogen content of wind-eroded soils in desert steppe. Land Degrad. Dev. 2023, 15, 5328–5342. [Google Scholar] [CrossRef]
  27. Wang, R.D.; Zhou, N.; Li, Q.; Chang, C.P.; Guo, Z.L.; Li, J.F. Difference in wind erosion characteristics between loamy and sandy farmlands and the implications for soil dust emission potential. Land Degrad. Dev. 2018, 29, 4362–4372. [Google Scholar] [CrossRef]
  28. Wang, Y.S.; Wang, D.D.; Yu, X.X.; Jia, G.D.; Chang, X.M.; Sun, L.L.; Zheng, P.F.; Qiu, Y.X. Emissions of biological soil crust particulate matter and its proportion in total wind erosion. Land Degrad. Dev. 2022, 33, 3118–3132. [Google Scholar] [CrossRef]
  29. Dong, L.; Wang, J.; Li, J.R.; Wu, Y.T.; Zheng, Y.; Zhang, J.H.; Li, Z.Y.; Yin, R.P.; Liang, C.Z. Assessing the impact of grazing management on wind erosion risk in grasslands: A case study on how grazing affects aboveground biomass and soil particle composition in Inner Mongolia. Glob. Ecol. Conserv. 2022, 40, e02344. [Google Scholar] [CrossRef]
  30. Liu, Q.Y.; Li, J.F.; Guo, Z.L.; Chang, C.P.; Wang, H.M. The Relationships between Root Traits and the Soil Erodibility of Farmland Shelterbelts in the Bashang Region of China. Forests 2023, 14, 1827. [Google Scholar] [CrossRef]
  31. Luo, J.N.; Huang, F.X.; Gao, S.; Liu, S.; Liu, R.X.; Devasthale, A. Satellite Monitoring of the Dust Storm over Northern China on 15 March 2021. Atmosphere 2022, 13, 157. [Google Scholar] [CrossRef]
  32. Lackóová, L.; Pokryvková, J.; Dufková, J.K.; Policht-Latawiec, A.; Michalowska, K.; Dabrowska, J. Long-Term Impact of Wind Erosion on the Particle Size Distribution of Soils in the Eastern Part of the European Union. Entropy 2021, 23, 935. [Google Scholar] [CrossRef] [PubMed]
  33. Wei, J.; Li, Z.; Lyapustin, A.; Wang, J.; Dubovik, O.; Schwartz, J.; Sun, L.; Li, C.; Liu, S.; Zhu, T. First close insight into global daily gapless 1 km PM2.5 pollution, variability, and health impact. Nat. Commun. 2023, 14, 8349. [Google Scholar] [CrossRef] [PubMed]
  34. Casallas, A.; Cabrera, A.; Guevara-Luna, M.A.; Tompkins, A.; González, Y.; Aranda, J.; Belalcazar, L.C.; Mogollon-Sotelo, C.; Celis, N.; Lopez-Barrera, E.; et al. Air pollution analysis in Northwestern South America: A new Lagrangian framework. Sci. Total Environ. 2024, 906, 167350. [Google Scholar] [CrossRef] [PubMed]
  35. Wen, Y.X.; Tong, R.; Zhang, H.; Feng, K.Q.; Song, R.; Wang, G.G.; Wu, T.G. N addition decreased stand structure diversity in young but increased in middle-aged Metasequoia glyptostroboides plantations. Glob. Ecol. Conserv. 2021, 30, e01803. [Google Scholar] [CrossRef]
  36. Sterba, H.; Dirnberger, G.; Ritter, T. The Contribution of Forest Structure to Complementarity in Mixed Stands of Norway Spruce (Picea abies L. Karst) and European Larch (Larix decidua Mill.). Forests 2018, 9, 410. [Google Scholar] [CrossRef]
  37. Weng, X.X.; Guo, Y.P.; Tang, Z.Y. Spatial-temporal dependence of the neighborhood interaction in regulating tree growth in a tropical rainforest. For. Ecol. Manag. 2022, 508, 120032. [Google Scholar] [CrossRef]
  38. Mendez, M.J.; Funk, R.; Buschiazzo, D.E. Field wind erosion measurements with Big Spring Number Eight (BSNE) and Modified Wilson and Cook (MWAC) samplers. Geomorphology 2011, 129, 43–48. [Google Scholar] [CrossRef]
  39. Hong, J.; Lee, M.; Huh, W.; Kim, T.K.; Jeon, J.; Lee, H.; Kim, K.; Byeon, S.; Park, C.; Kim, H.S. Comparisons of PM2.5 mitigation with stand characteristics between evergreen Korean pine plantations and deciduous broad-leaved forests in the Republic of Korea. Environ. Pollut. 2023, 334, 122240. [Google Scholar] [CrossRef]
  40. Forrester, D.I. Linking forest growth with stand structure: Tree size inequality, tree growth or resource partitioning and the asymmetry of competition. For. Ecol. Manag. 2019, 447, 139–157. [Google Scholar] [CrossRef]
  41. Han, D.H.; Shen, H.L.; Duan, W.B.; Chen, L.X. A review on particulate matter removal capacity by urban forests at different scales. Urban For. Urban Green. 2020, 48, 126565. [Google Scholar] [CrossRef]
  42. Zhang, J.M.; Yu, X.X.; Jia, G.D.; Liu, Z.Q. Determination of optimum vegetation type and layout for soil wind erosion control in desertified land in North China. Ecol. Eng. 2021, 171, 106383. [Google Scholar] [CrossRef]
  43. Cao, J.; Chen, Y.P.; Jiang, Y.; Chen, J.S.; Zhang, Y.Y.; Wu, J.H. Different Responses of Soil Moisture to Different Artificial Forest Species on the Loess Plateau. Sustainability 2023, 15, 14275. [Google Scholar] [CrossRef]
  44. Wu, Y.X.; Yu, X.X.; Jia, G.D. Seasonal Variation of Soil Erodibility Under Vegetation Restoration in the Agro-pastoral Ecotone of Northern China. J. Soil Sci. Plant Nutr. 2023, 23, 2331–2343. [Google Scholar] [CrossRef]
  45. Torshizi, M.R.; Miri, A.; Shahriari, A.; Dong, Z.B.; Davidson-Arnott, R. The effectiveness of a multi-row Tamarix windbreak in reducing aeolian erosion and sediment flux, Niatak area, Iran. J. Environ. Manag. 2020, 265, 110486. [Google Scholar] [CrossRef] [PubMed]
  46. Treminio, R.S.; Webb, N.P.; Edwards, B.L.; Faist, A.; Newingham, B.; Kachergis, E. Spatial Patterns and Controls on Wind Erosion in the Great Basin. J. Geophys. Res.-Biogeosci. 2024, 129, e2023JG007792. [Google Scholar] [CrossRef]
  47. Niu, F.R.; Pierce, N.A.; Okin, G.S.; Archer, S.R.; Fischella, M.R.; Nadoum, S. Sandblasting promotes shrub encroachment in arid grasslands. New Phytol. 2023, 240, 1817–1829. [Google Scholar] [CrossRef]
  48. Guevara-Macías, M.D.; Pineda-Martínez, L.F.; Carbajal, N. A descriptive study of dust storms and air quality in a semi-arid region of Mexico. Air Qual. Atmos. Health 2023, 16, 1645–1660. [Google Scholar] [CrossRef]
  49. Ardon-Dryer, K.; Kelley, M.C. Particle size distribution and particulate matter concentrations during synoptic and convective dust events in West Texas. Atmos. Chem. Phys. 2022, 22, 9161–9173. [Google Scholar] [CrossRef]
  50. Siegmund, N.; Panebianco, J.E.; Avecilla, F.; Iturri, L.A.; Sommer, M.; Buschiazzo, D.E.; Funk, R. From Gustiness to Dustiness-The Impact of Wind Gusts on Particulate Matter Emissions in Field Experiments in La Pampa, Argentina. Atmosphere 2022, 13, 1173. [Google Scholar] [CrossRef]
Figure 1. Study area location. Note: H is the height of the tree. A Dustmate portable dust monitor was installed at 1H, 2H, 3H and 5H within the forest. Kestrel 5000 hand-held weather stations are located at 1H, 3H and 5H within the forest.
Forests 15 01413 g001
Figure 2. RHD distribution of four stand types. Note: (A) Populus simonii; (B) Pinus tabulaeformis Carr.; (C) Pinus tabulaeformis Carr. × Populus simonii; (D) Caragana Korshinskii Kom.
Forests 15 01413 g002
Figure 3. Changes of wind speed at different distances and heights relative to the forest edge.
Forests 15 01413 g003
Figure 4. Sediment flux of the four stand types at heights of 0.5 m, 1 m and 2 m.
Forests 15 01413 g004
Figure 5. Horizontal distribution of particulate matter relative to downwind distance, not vertical distance.
Forests 15 01413 g005
Figure 6. Wind-erosion inhibition rate and particulate matter reduction rate of the four stand types. Note: (A) Populus simonii; (B) Pinus tabulaeformis Carr.; (C) Pinus tabulaeformis Carr. × Populus simonii; (D) Caragana korshinskii Kom. Different letters in the same color indicate significant differences at the 0.05 level.
Forests 15 01413 g006
Figure 7. Correlation analysis of stand structure, soil characteristics and wind erosion and dust. Note: Yellow indicates negative correlation, and green indicates positive correlation. The intensity of the fill color in the lower left corresponds to the strength of the correlation, with a white asterisk indicating significance <0.01 and a black asterisk indicating significance <0.05. QS, sediment flux; PM1, PM1 reduction rate; PM2.5, PM2.5 reduction rate; PM10, PM10 reduction rate; K, wind-erosion inhibition rate; OP, optical porosity; CD, canopy density; CV, DBH variation coefficient; SD, stand density; RHD, height-to-diameter ratio; CE, Clark–Evans index; NCI, neighborhood competition index; CR, crown width; TN, total nitrogen content; SOC, soil organic carbon; MWD, mean weight diameter of soil aggregates; SMC, soil moisture content; SBD, soil bulk density.
Forests 15 01413 g007
Figure 8. Wind erosion and dust indicators and stand structure (OP, CD, CV, SD, RHD, CE, NCI, CR) and soil (TN, SOC, MWD, SMC, SBD) RDA analysis sequence map results. NOTE: Differently colored circles represent different plots. 1: Pinus tabulaeformis Carr.; 2: Populus simonii; 3: Pinus tabulaeformis Carr. × Populus simonii; 4: Caragana Korshinskii Kom.
Forests 15 01413 g008
Table 1. Stand structure and soil differences among the four stand types.
Populus simoniiPinus tabulaeformis Carr.Pinus tabulaeformis Carr. × Populus simoniiCaragana korshinskii Kom.
OP0.46 ± 0.05 a0.26 ± 0.07 ab0.38 ± 0.04 ab0.16 ± 0.04 b
CD0.43 ± 0.05 b0.74 ± 0.10 a0.54 ± 0.10 ab0.38 ± 0.10 b
CV0.35 ± 0.02 a0.20 ± 0.02 b0.26 ± 0.05 ab0.28 ± 0.05 ab
SD730.56 ± 92.12 a955.00 ± 202.08 a675.00 ± 59.51 a583.33 ± 106.39 a
RHD63.09 ± 4.42 a58.00 ± 5.25 ab43.26 ± 4.12 b4.12 ± 0.23 c
CE1.26 ± 0.18 a0.65 ± 0.12 a1.12 ± 0.56 a1.02 ± 0.08 a
NCI0.62 ± 0.03 ab0.77 ± 0.06 a0.61 ± 0.03 b0.63 ± 0.03 ab
CR607.56 ± 37.56 ab465.20 ± 48.20 b664.00 ± 58.13 a164.67 ± 19.64 c
TN0.48 ± 0.03 a0.48 ± 0.05 a0.51 ± 0.13 a0.36 ± 0.07 a
SOC11.47 ± 0.89 a12.06 ± 1.42 a13.28 ± 2.59 a14.88 ± 2.92 a
MWD1.53 ± 0.26 a2.13 ± 0.26 a1.34 ± 0.49 a0.83 ± 0.28 a
SMC12.45 ± 1.58 a12.31 ± 1.93 a9.94 ± 2.49 a10.66 ± 1.86 a
SBD1.41 ± 0.03 a1.38 ± 0.04 a1.38 ± 0.03 a1.44 ± 0.01 a
Note: OP, optical porosity; CD, canopy density; CV, DBH variation coefficient; SD, stand density; RHD, height-to-diameter ratio; CE, Clark–Evans index; NCI, neighborhood competition index; CR, crown width; TN, total nitrogen content; SOC, soil organic carbon; MWD, mean weight diameter of soil aggregates; SMC, soil moisture content; SBD, soil bulk density. Mean ± standard error. Different letters in the same column indicate significant differences at the 0.05 level.
Table 2. GLMM model results (coefficients).
ModelCoefficientStandard ErrortSignificance
intercept12.0475.95782.0220.068
A1.4124.60080.3070.765
B9.4274.74481.9870.072
C2.6263.5720.7350.478
D0 b---
OP0.9018.40390.1070.917
CV−57.49910.3193−5.5720
RHD0.0420.05320.7920.445
MWD5.9681.55073.8480.003
SOC0.3360.28791.1690.267
CD10.5736.21841.70.117
Note: A, Populus simonii; B, Pinus tabulaeformis Carr.; C, Pinus tabulaeformis Carr. × Populus simonii; D, Caragana korshinskii Kom.; OP, optical porosity; CV, DBH variation coefficient; RHD, height-to-diameter ratio; MWD, mean weight diameter of soil aggregates; SOC, soil organic carbon; CD, canopy density. b indicates that this coefficient is redundant, so it is set to zero.
Disclaimer/Publisher’s Note: The statements, opinions and data contained in all publications are solely those of the individual author(s) and contributor(s) and not of MDPI and/or the editor(s). MDPI and/or the editor(s) disclaim responsibility for any injury to people or property resulting from any ideas, methods, instructions or products referred to in the content.

