Article

Revealing the Nonlinear Impact of Human Activities and Climate Change on Ecosystem Services in the Karst Region of Southeastern Yunnan Using the XGBoost–SHAP Model

by
Bao Zhou
1,
Guoping Chen
1,*,
Haoran Yu
2,*,
Junsan Zhao
1 and
Ying Yin
3
1
Faculty of Land Resource Engineering, Kunming University of Science and Technology, Kunming 650093, China
2
School of Landscape Architecture, Nanjing Forestry University, Nanjing 210042, China
3
College of Electronic and Information Engineering, West Anhui University, Luan 237000, China
*
Authors to whom correspondence should be addressed.
Forests 2024, 15(8), 1420; https://doi.org/10.3390/f15081420
Submission received: 4 June 2024 / Revised: 8 August 2024 / Accepted: 11 August 2024 / Published: 13 August 2024
(This article belongs to the Special Issue Application of Remote Sensing in Vegetation Dynamic and Ecology)

Abstract

:
The Karst region is a critical ecological barrier and functional zone in China. Understanding the spatiotemporal evolution of its ecosystem services and its relationship with human activities and climate change is of importance for achieving regional ecological protection and high-quality development. In this study, we used the InVEST model and CASA model to evaluate the spatiotemporal evolution pattern of ecosystem services in the study area from 2000 to 2020. The XGBoost–SHAP model was used to reveal the key indicators and thresholds of changes in major ecosystem services in the study area due to climate change and human activities. The results showed significant land use changes in the study area from 2000 to 2020, particularly the conversion of cropland to construction land, which was more intense in economically developed areas. The areas of forest and grassland increased initially but later decreased due to the impact of human activities and natural factors. Habitat quality (HQ) showed an overall declining trend, while soil retention (SR) and water yield (WY) services exhibited significant interannual variations due to climate change. The changes in rainfall had a particularly notable impact on these services; in years with excessive rainfall, soil erosion intensified, leading to a decline in SR services, whereas in years with moderate rainfall, SR and WY services improved. Carbon fixation (CF) services were enhanced with the expansion of forest areas. The XGBoost–SHAP model further revealed that the effects of rainfall and sunshine duration on ecosystem services were nonlinear, while population density and the proportion of construction land had a significant negative impact on habitat quality and soil retention. The expansion of construction land had the most significant negative impact on habitat quality, whereas the increase in forest land significantly improved carbon fixation and the soil retention capacity. By revealing the mechanisms of the impact of climate change and human activities on ecosystem services, we aimed to provide support for the promotion of ecological conservation and sustainable development strategies in the study area, as well as to provide an important reference for areas with geographic similarities to the study area.

1. Introduction

China has one of the widest distributions of Karst landscapes in the world, with Karst areas accounting for about 15% of the country’s land area [1,2]. The natural environment and climatic conditions of Karst areas make the ecosystems of the region more sensitive and less resistant to disturbance. Under these fragile ecological conditions, surface soil loss, the gradual exposure of rocks, a reduction in water retention, the interruption of vegetation growth continuity, a loss of agricultural production capacity, and the degradation of ecological environment quality have been caused by the irrational socio-economic activities of human beings over a long period of time. The Karst mountainous area in southwest China, centered on Guizhou Province [3], Yunnan Province, and Guangxi Province, is the most concentrated area of Karst distribution in China, with the largest area of exposed carbonate rocks. The area belongs to the “Southern Border Ecological Barrier” in the “Three Screens, Two Belts, Six Corridors, and Multiple Points” of Yunnan Province. However, the Karst region is a complex geographical system, and its limited natural resources, fragile ecological environment, socio-economic conditions, and tense human–land relationships have restricted the development of the region, especially in recent years. The contradiction between production space and ecological space has been prominent, and there is a scarcity of space for multi-functionality. The constraints on production space resources have been tightening. Therefore, an in-depth study of the spatial and temporal evolution of ecosystem services and its driving factors in the region is of significance for achieving regional ecological protection and sustainable development.
Currently, researchers typically use remote sensing technology [4,5], geographic information systems [6,7], and biophysical models (InVEST, SoLVES, etc.) to measure the characteristics of ecosystem service changes at different temporal and spatial scales [8,9,10,11,12,13]. Results have shown that the pattern of ecosystem services and the role of relationships in time and space have different characteristics of change [10,14,15,16], and the main factors affecting the temporal and spatial evolution of ecosystem services include natural factors (e.g., climate change, geomorphological features, etc.) and anthropogenic factors (e.g., land use/cover changes, economic development, policy interventions, etc.). However, most existing studies have relied on cross-sectional data and lack continuous time series observations, so they have been unable to accurately assess the spatial and temporal trends of ecosystem services [17,18,19]. Moreover, traditional studies of the drivers of ecosystem services have often used statistical methods such as generalized linear models (GLM) and stepwise regression models [20,21] or random forests [22,23]. Although these methods have some explanatory power, they have limitations in dealing with complex nonlinear relationships and multivariate interactions. Generalized linear models assume that the relationship between variables is linear, and stepwise regression models, although they take into account the stepwise selection of variables, are prone to fail when confronted with multicollinearity and high-dimensional data. In addition, it is difficult to obtain intuitive visualization results when explaining the effects of variables using these methods, limiting their application in practical ecological management [24]. To overcome these shortcomings, we adopted the XGBoost–SHAP model to analyze the drivers of ecosystem services in the southeastern Yunnan Karst region of Yunnan, China. XGBoost (eXtreme Gradient Boosting) is an integrated learning method based on decision trees, whereby weak learners are continuously constructed and optimized, ultimately resulting in a powerful predictive model [25,26]. Compared to traditional statistical models, XGBoost has significant advantages in dealing with nonlinear relationships, capturing complex interactions between variables, and dealing with high-dimensional data, while SHAP (SHapley Additive exPlanations) values are based on cooperative game theory, which can provide consistent and fair interpretations for each prediction result. Combining XGBoost and SHAP, the XGBoost–SHAP model not only has strong predictive power, but also quantifies the contribution of each variable to the model output, providing transparent and interpretable results [25,27,28]. The XGBoost–SHAP model is now widely used in several research fields, including healthcare, environmental sciences, and financial forecasting. For example, in ecological research, the model has been applied to predict the existence probability of wolf populations in Germany, helping scientists and conservationists to better understand and manage wildlife populations by analyzing data collected from sources such as the Global Biodiversity Information Facility (GBIF) [29]. In addition, some researchers have used the model to predict the susceptibility of landslides, explaining the geographical heterogeneity of landslide susceptibility by integrating topographic, geological, and hydrological data [30]. In view of the above, we used the InVest model and CASA model to assess the major ecosystem services (carbon sequestration, habitat quality, net primary productivity, soil and water conservation, and water yield) in the study area, based on which the XGBoost–SHAP model was used to analyze the impacts of anthropogenic activities, climate change, and natural topography on the spatial differentiation pattern of major ecosystem service generation in the study area. By calculating the SHAP values, it was possible not only to identify the key drivers affecting ecosystem services, but also to gain a deeper understanding of how these factors are influenced and their threshold effects. By identifying these thresholds, we were able to provide a scientific basis for formulating more precise and effective ecological governance policies. This also allowed us to provide a research framework and methodology that can be referred to in geographically similar regions.

2. Overview of the Study Area and Methodology

2.1. Materials

2.1.1. Overview of the Study Area

The research area encompassed the national key ecological functional area for the prevention and control of Karst rocky desertification in Guizhou and Yunnan. The area includes national nature reserves, forest parks, wetland parks, geological parks, desert (rocky desert) parks, scenic spots, water conservancy scenic spots, etc. Karst areas have complex and diverse landform types (Figure 1). The climate is mainly south subtropical and mid-subtropical. The annual precipitation is 800–1200 mm in most areas. Precipitation is relatively abundant, but evaporation is greater than precipitation. Rocky desertification and potential rocky desertification land are widely distributed, and the soil is infertile and leaky with poor water retention capacity. The vegetation in Karst areas includes evergreen broad-leaf forest, deciduous broad-leaf forest, warm coniferous forest, bamboo forest, shrubs, grass, and other vegetation types, with rich biological diversity. The problems of surface droughts and water shortages are prominent. The distribution of vegetation is restricted by the Karst environment and altitude. The tree species structure is single, the forest community structure is simple, and some areas show a reverse succession trend. Production activities, such as steep-slope farming, deforestation, overgrazing, and mining, have caused ecosystem damage, exacerbating rocky desertification and soil erosion. According to monitoring results, the water and soil loss rate in this region is 30%, which is significant. The rocky desertification land area is 806,800 hectares, accounting for 37.9% of the total rocky desertification land area in Guizhou Province (2.1285 million hectares). The ecological vulnerability is extremely high. Once the soil is lost, ecological restoration and reconstruction becomes extremely difficult.

2.1.2. Data Acquisition and Processing

The data in this study included land use, topography, meteorology, socio-economic, and other data. (1) The meteorological observation data included radiation, precipitation, temperature, etc. data from the “China Regional High Spatiotemporal Resolution Surface Meteorological Elements Driven Dataset” (https://data.tpdc.ac.cn/home, accessed on 22 April 2023). (2) The land use data from 2000 to 2020 were from the Wuhan University CLCD dataset (https://zenodo.org/record/5210928, accessed on 25 April 2023), with a spatial resolution of 30 m. (3) The DEM elevation data, specifically ASTER GDEM data, were obtained from the China Resource and Environmental Science Data Center of the Academy of Sciences (https://www.resdc.cn/, accessed on 25 April 2023). (4) Soil data were from the China soil dataset (v1.2), based on HWSD, with a resolution of S1000 m. (5) Other data were from the statistical yearbooks or included study area boundary data. The statistical yearbook data included the 2000–2020 statistical yearbooks of the study area and county and district statistical bulletins. The study area boundary data were from the National Geographic Information Resources Directory Service System (http://www.webmap.cn/, accessed on 26 April 2023). All data were uniformly sampled to 30 m through the resampling function of the ArcGIS platform, and the unified coordinate system was WGS_1984_UTM_Zone_50N.

2.2. Ecosystem Service Indicators

2.2.1. Carbon Stocks

The carbon storage service is the carbon stored in vegetation and soil by ecosystems. In InVEST, carbon module carbon stock is divided into four parts: aboveground carbon, underground carbon, soil carbon, and dead organic carbon [31,32]. Referring to the existing literature to determine the carbon pool in the study area, the carbon stock was calculated based on the land use data with the following formula:
C t o t a l   = k = 1 n A k × ( C a b o v e   + C b e l o w   + C s o i l   + C d e a d )
where C t o t a l is the total carbon stock in the study area (t), A k is the area of the k t h land type in the study area, k is from 1 to n ,  n is the number of land types, C a b o v e is the aboveground vegetation carbon density, C b e l o w is the belowground vegetation carbon density, C s o i l is the soil carbon density, and C d e a d is the dead organic matter carbon density. Together, these values represent the carbon pool in the study area in units of t / h m 2 .

2.2.2. Water Production

Water yield is an important element of ecosystem services, representing the amount of water available annually for human use and social well-being [33,34]. The calculation of water yield using the InVEST model requires a combination of climatic, topographic, and soil data, and the use of the following formula:
Y x j = ( 1 A E T x j P x ) P x
where   Y x j   is the annual water production (mm) of the j land class at x image elements, P x   is the average annual precipitation in image x (mm), and A E T x j   is the actual evapotranspiration (mm) of the j th land class in image x .

2.2.3. Soil Conservation

Soil retention (SR) is the ability of each class to prevent soil erosion, and the SDR module in InVEST is based on the Revised Universal Soil Loss Equation (RUSLE), which takes into account the plot’s interception force of sediment [35,36,37] and is calculated as follows:
S R = R × K × L S R × K × L S × C × P
where S R represents the total annual soil conservation ( t h m 2 a 1 ), L S is the topographic factor calculated from the slope length factor ( L ) and the slope gradient factor ( S ), C is the vegetation cover factor, P is the soil conservation measure factor, and R is the rainfall erosivity index calculated from the monthly precipitation.

2.2.4. Habitat Quality

Habitat quality is the ability of the environment to provide various types of resources and conditions for the development of organisms. The development of biodiversity is guaranteed when the habitat quality is good [6,33,34,35]. Using the Habitat Quality module of the InVEST model to establish the relationship between each category and threat factors, the relative sensitivity of each category to the threat factors and the distance of influence of the threat factors were taken into account to calculate the Habitat Quality Index, expressed as biodiversity, with the following formula:
Q x j = H j ( 1 D x j z D x j z + K z )
In the equation, Q x j represents the habitat quality index of grid x in landscape type j in the study area. The value range of H j is [0, 1], which represents the habitat suitability score of the landscape type j . k is the half-saturation constant, which is set based on the data precision of the study area. In this paper, k is set to 50. z is the scale constant, which is generally set to 2.5.

2.2.5. Net Primary Productivity (NPP)

Net primary production (NPP) refers to the remaining part of the total organic matter produced by photosynthesis minus autotrophic respiration per unit of time and per unit of area of a plant. NPP correlates with biomass in an ecosystem, but the biomass in an ecosystem is affected by other factors, such as invasion of exotic species, human activities, etc. Nevertheless, it is convenient to use NPP to indirectly represent the biomass size at a larger scale. The calculation of NPP is mainly based on the CASA model [36,37], and the calculation formula is as follows:
N P P ( x , t ) = A P A R ( x , t ) × ε ( x , t )
where N P P x , t is the x location net primary productivity at time t ;   A P A R x , t   is the net primary productivity of the x location; t is the photosynthetically active radiation at the moment at the x location, and t is the light energy utilization at the moment.

2.3. The XGBoost–SHAP Algorithm and Variable Selection

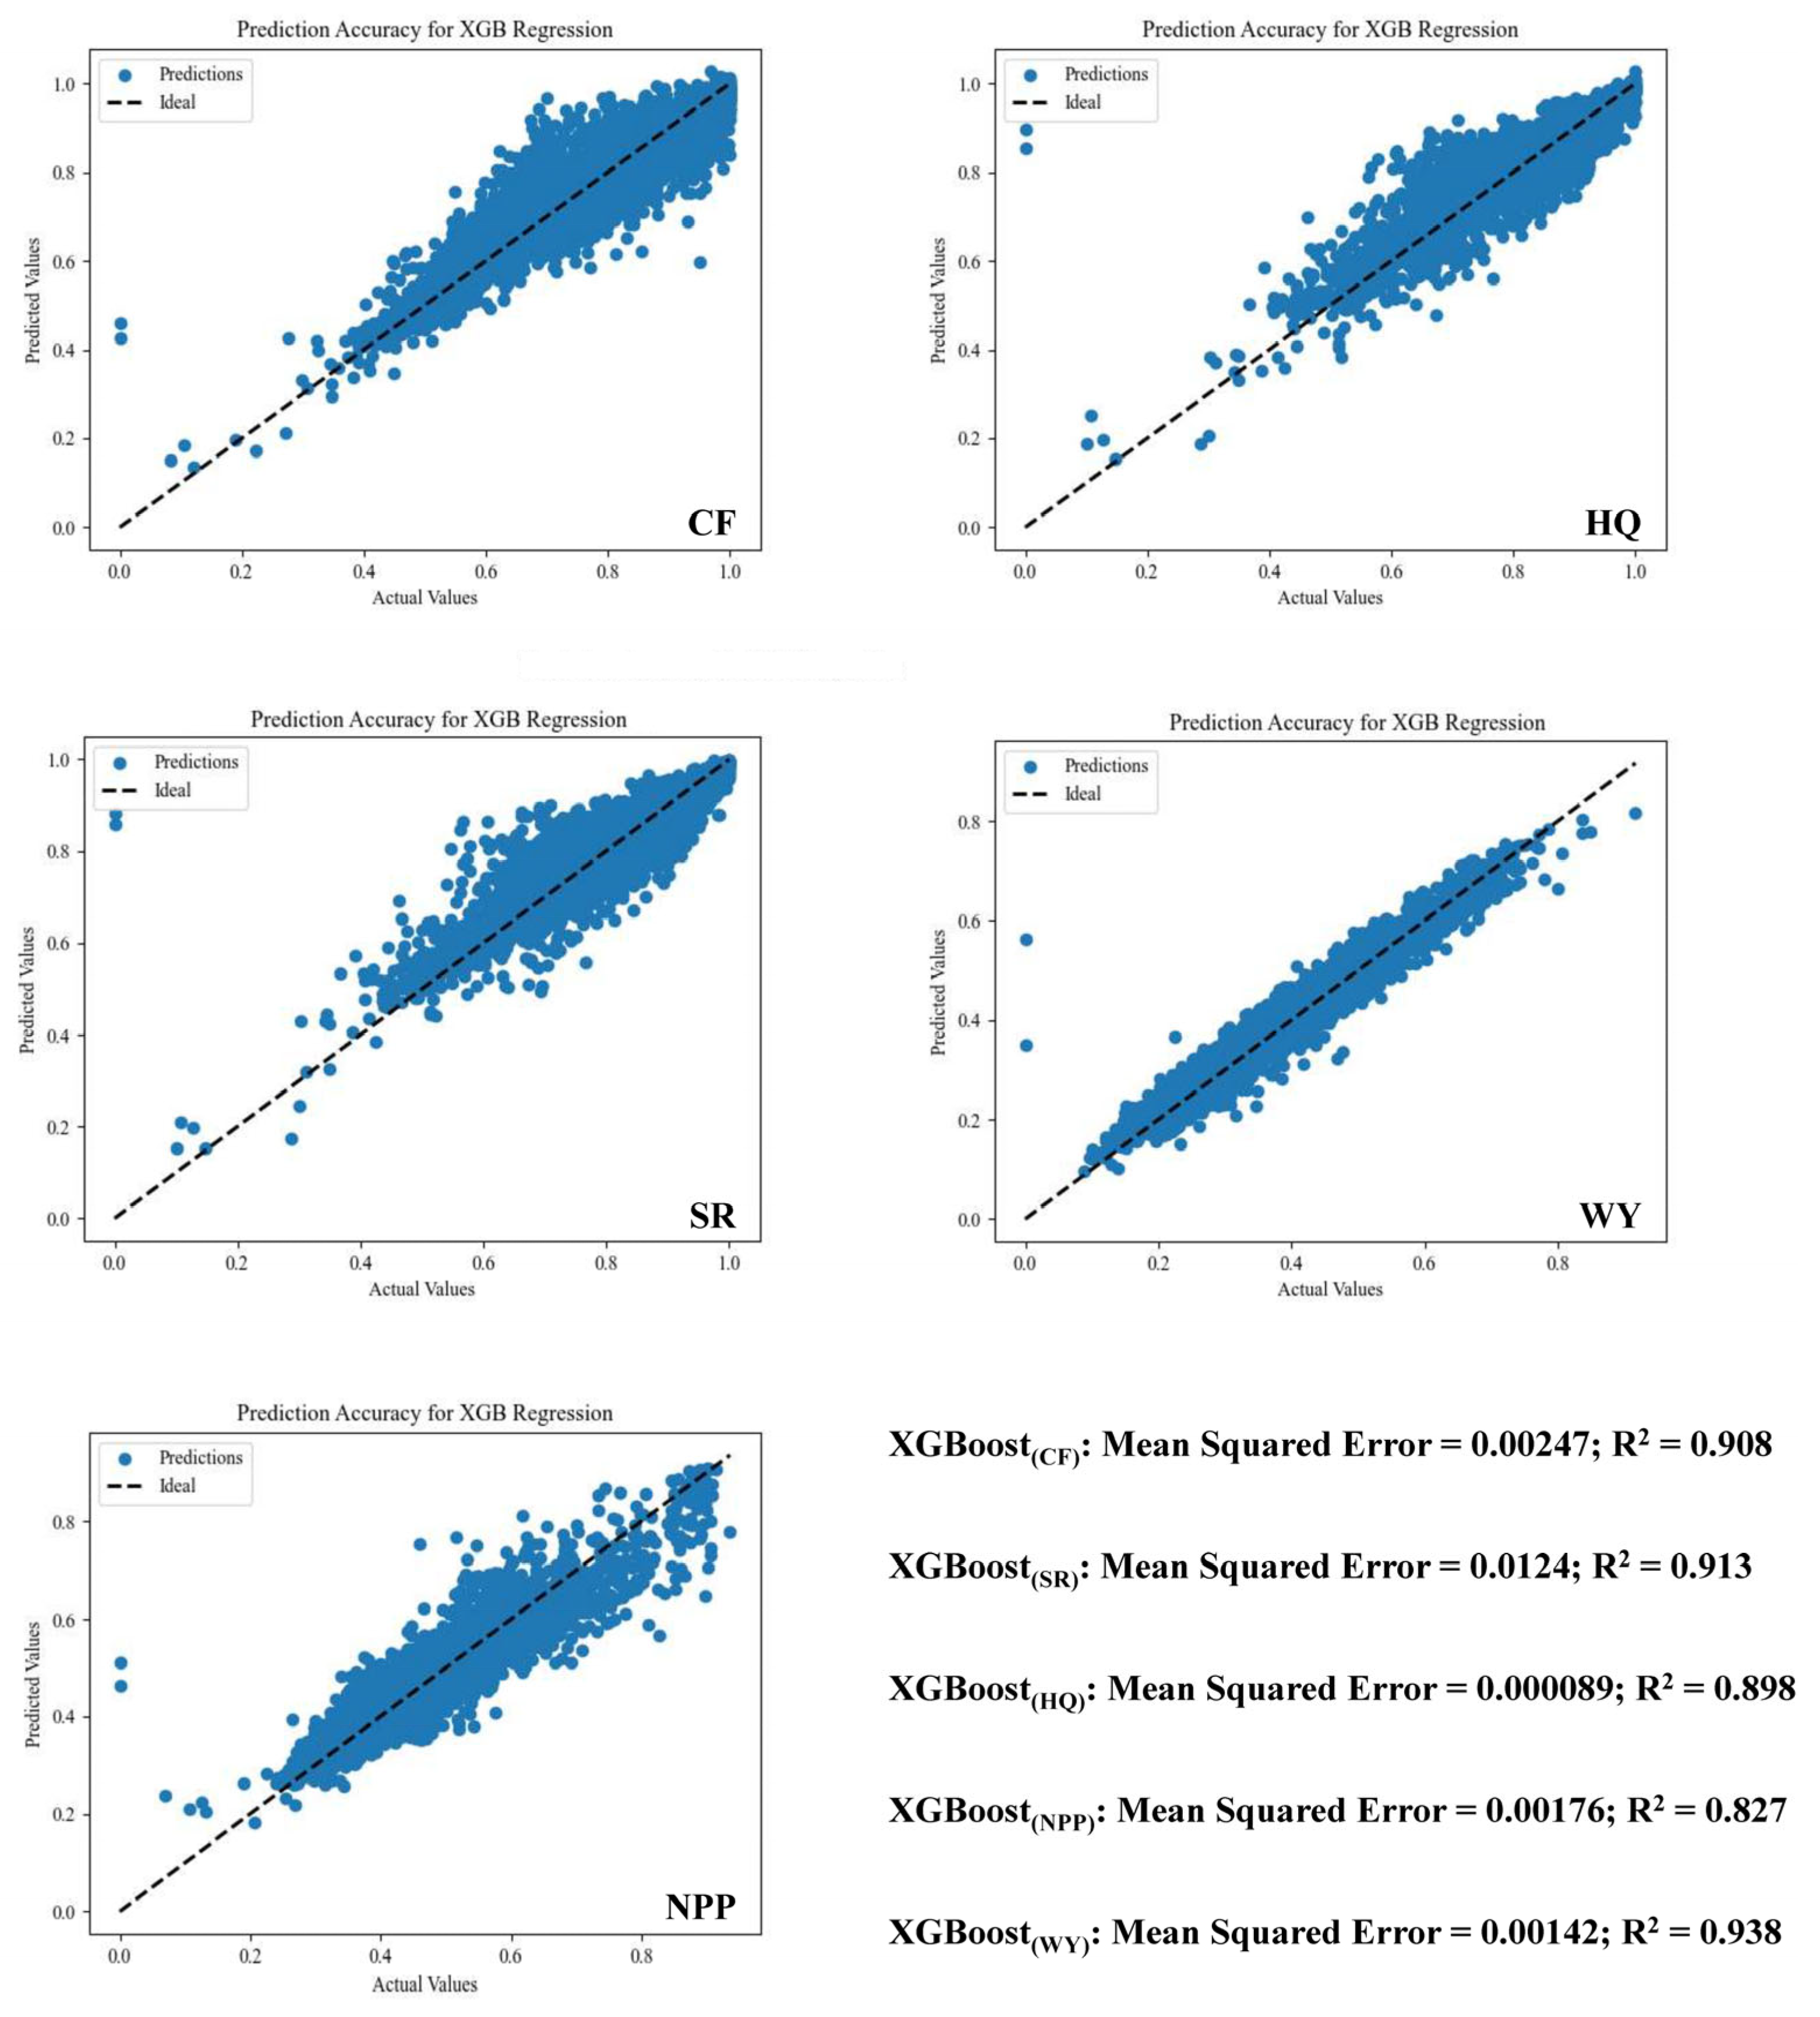
2.3.1. Principles of the XGBoost–SHAP Algorithm

XGBoost (eXtreme Gradient Boosting) is a boosted tree algorithm that is popular in machine learning competitions because of its efficient performance and scalability [25,26,28]. SHAP (SHapley Additive exPlanations) is a method for interpreting the predictions of machine learning models, which is based on Shapley values from cooperative game theory.
In XGBoost, at each iteration, a tree that maximizes the decrease in the loss function is added and given an objective function as follows:
O b j = L + Ω
where L is the loss function for the training data and Ω is the complexity of the model for regularization. Specifically, if we use the mean square error loss, then L can be defined as follows:
L = i = 1 n ( y i y ^ i ) 2
where y i is the true value and y ^ i   is the predicted value.
Model complexity Ω can be defined as follows:
Ω = γ T + 1 2 λ j = 1 T w j 2
where T is the number of trees and w j   is the weight of the first j weight of the leaf node of the first tree. γ and λ are the regularization parameters.
The SHAP value provides a method of interpreting individual predictions by indicating the contribution of each feature to the model’s prediction. For a given prediction, the SHAP value can be interpreted as follows:
ϕ i ( v ) = S N { i } | S | ! ( | N | | S | 1 ) ! | N | ! ( v ( S u { i } ) v ( S ) )
where N is the set of all features, S is the set of features that do not contain i of any subset, and S is the set of features of the S contribution to the prediction. The SHAP value quantifies the marginal contribution of each feature to the final prediction by averaging all possible combinations of features. The model accuracy is shown in Figure 2. In this study, the XGBoost machine learning model was constructed using the Python language, and each key parameter was set as follows: learning rate 0.02; n_estimators 88; max_depth 7; Min_child_weight 2.

2.3.2. Variable Selection

In this study, a variety of indicators representing human activities and climate change were selected, such as the elevation (Elevation), slope (Slope), rainfall (Pre), sunshine hours (SST), land use ratio (forest land, built-up land, agricultural land), humidity (Hum), temperature (Tem), population density (POP), and night-time lighting [7,37,38]. These indicators were chosen based on their widespread use and importance in geographic and ecological studies, as well as their representativeness of potential impacts on ecosystem processes and services. Elevation and slope are key topographic factors that directly influence topography, water flow, and soil formation processes, thus affecting the physical environment of regional ecosystems. Rainfall and sunshine duration, as major climatic factors, significantly influence vegetation growth, evapotranspiration, and water cycle processes, thus affecting ecosystem functions and services. Indicators of land use occupancy, such as the proportions of forested land, built-up land, and agricultural land, reflect the types of land use and its changes, which are a direct reflection of the impact of human activities on the natural environment. Humidity and temperature, as important parameters of climatic conditions, affect the microclimatic environment and biological suitability of ecosystems. Population density and night-time lighting are proxy variables of the intensity of human activities, which can reflect the scale of human agglomerations and the vibrancy of night-time economic activities, which, in turn, exert pressure on natural resources and the environment. The combined selection of these indicators aimed to comprehensively capture the multiple impacts of climate change and human activities on ecosystem services in the study area, providing a multidimensional database to support in-depth ecosystem service analyses and management decisions.

3. Analysis of Results

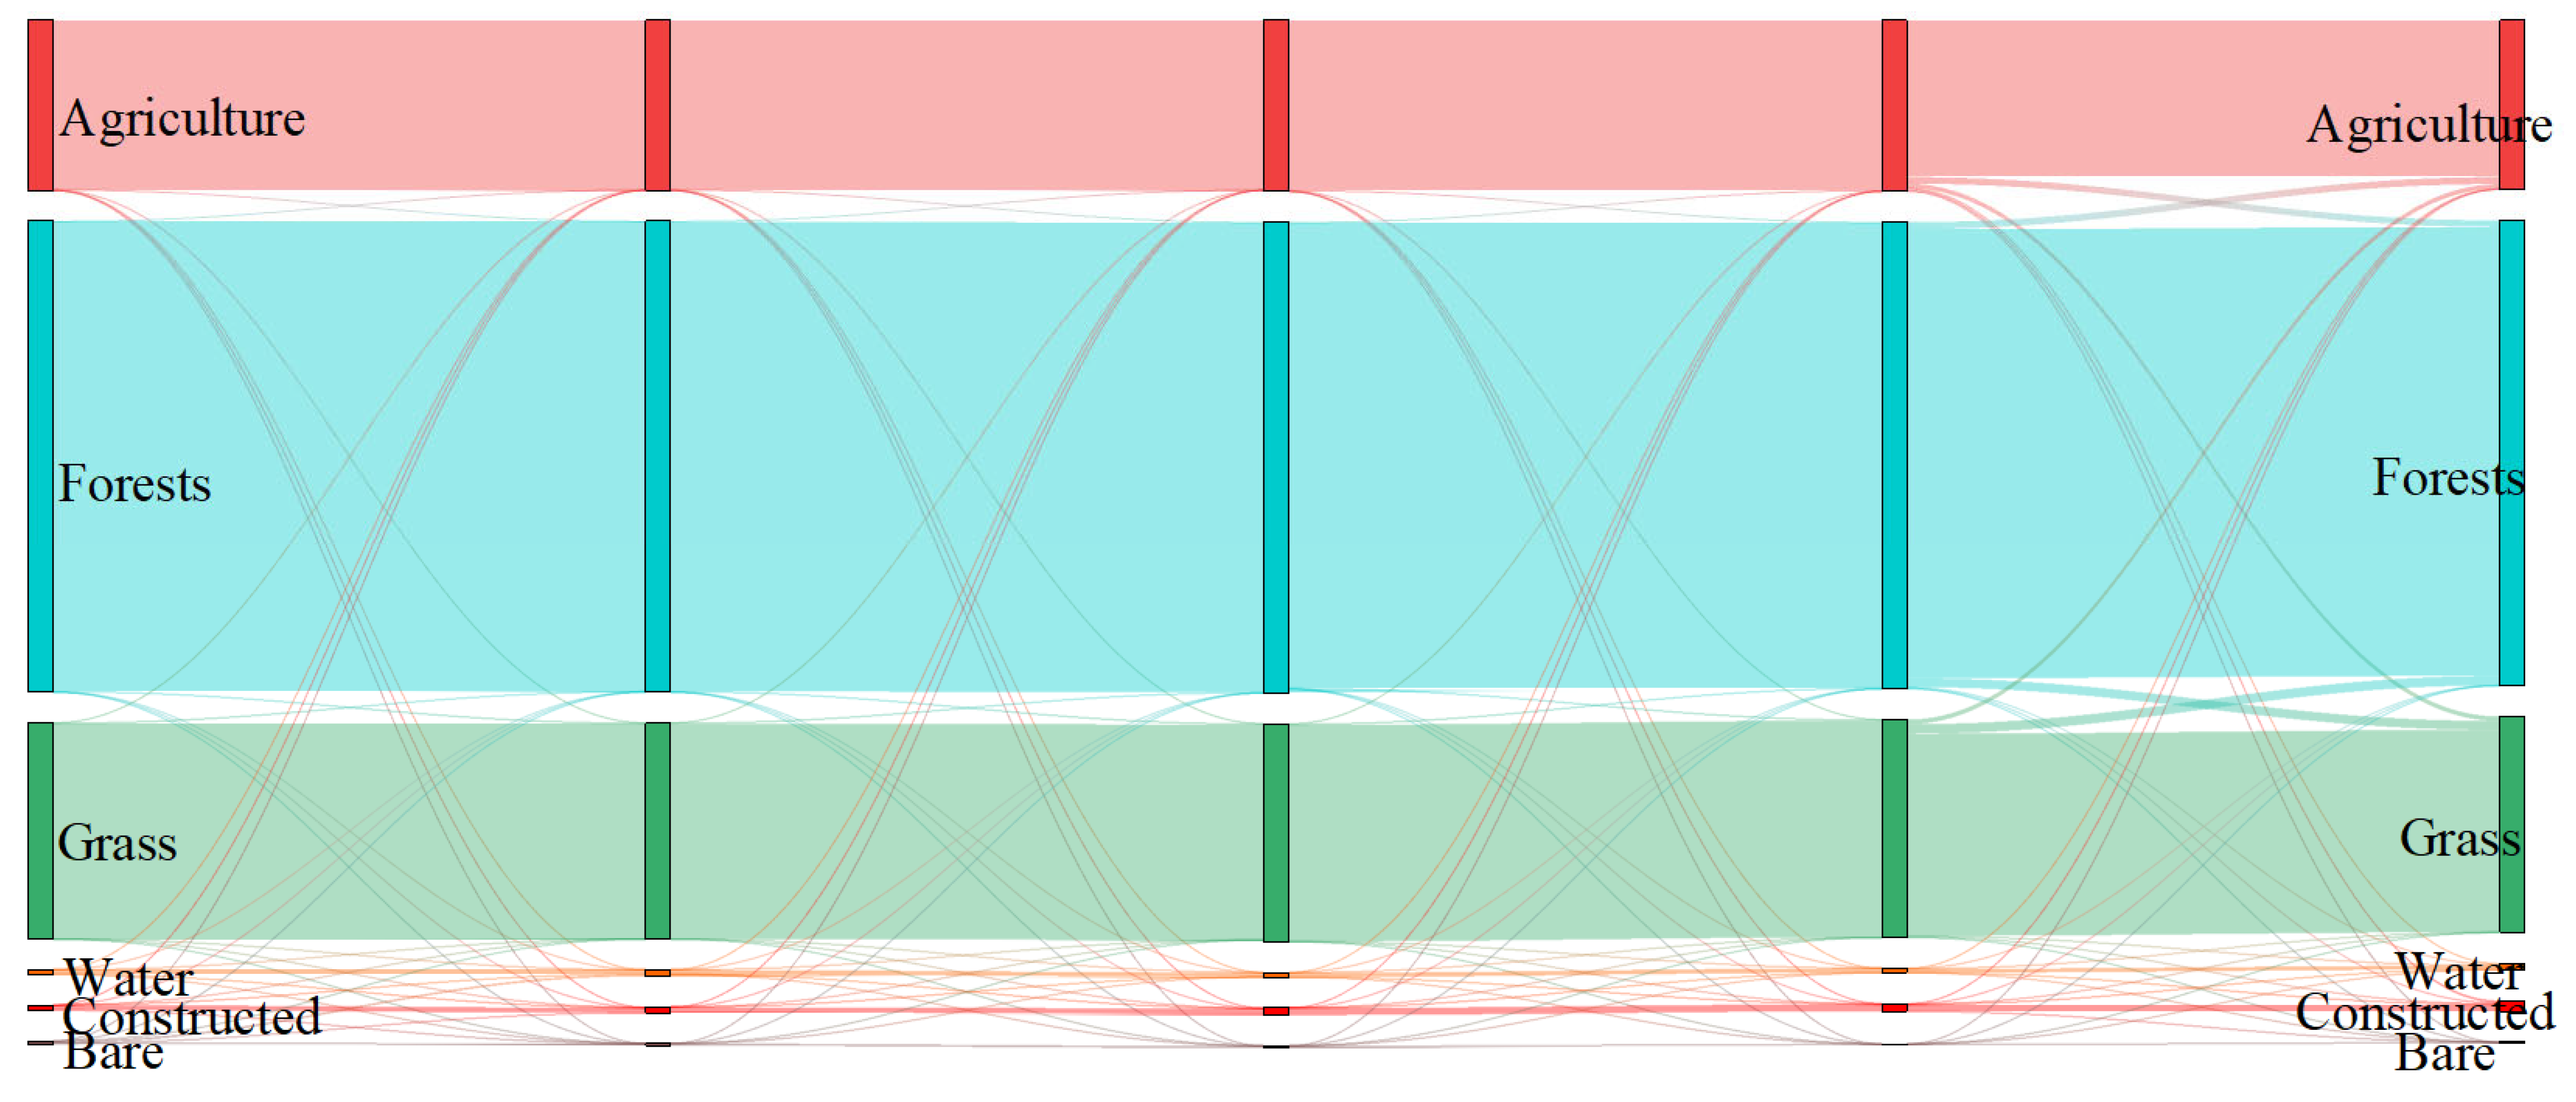
3.1. Land Use Transfer Characteristics

Over the past two decades, the Karst region of Yunnan has experienced drastic land use changes, especially the conversion between arable land and built-up land in peri-urban areas (Figure 3 and Table 1). Based on land use data from 2000 to 2020, we calculated the land use transfer matrix for each year and analyzed the trend of change through Sankey diagrams. We found that the rapid advancement of urbanization resulted in a large amount of arable land being converted to construction land. Newly built villages, town expansion, and other land turned into cropland after the demolition of villages were the main forms in the conversion. In Wenshan, Yanshan, and Qiubei, where the urbanization process has been significant, the transformation of arable land into construction land has been particularly drastic. In this process, the amount of agricultural land was gradually reduced, while new commercial and residential areas were developed. In other parts of the study area, such as Qiubei, Guangnan, Shizong, Luoping, and Luxi, etc., the transformation of land use was mainly manifested in the inter-conversion between construction land and forest and grassland. Cultivated land is relatively scarce in these areas, so the main type of conversion was non-cultivated land. One of the reasons for this is that the natural conditions in these areas are relatively harsh, making them unsuitable for large-scale agricultural development, but they are suitable for forestry and grassland development. Across the region, land for construction showed a trend of linear growth, which was related to the rapid economic development and urbanization in the region. The area of forest and grassland fluctuated around 2015, first increasing and then decreasing, which was mainly due to the dual impact of ecological protection policies and land development pressure. The area of arable land continued to decline, which, on the one hand, reflected the trend of gradual replacement of agricultural land by non-agricultural land and, on the other hand, suggested the necessity of sustainable land management strategies.

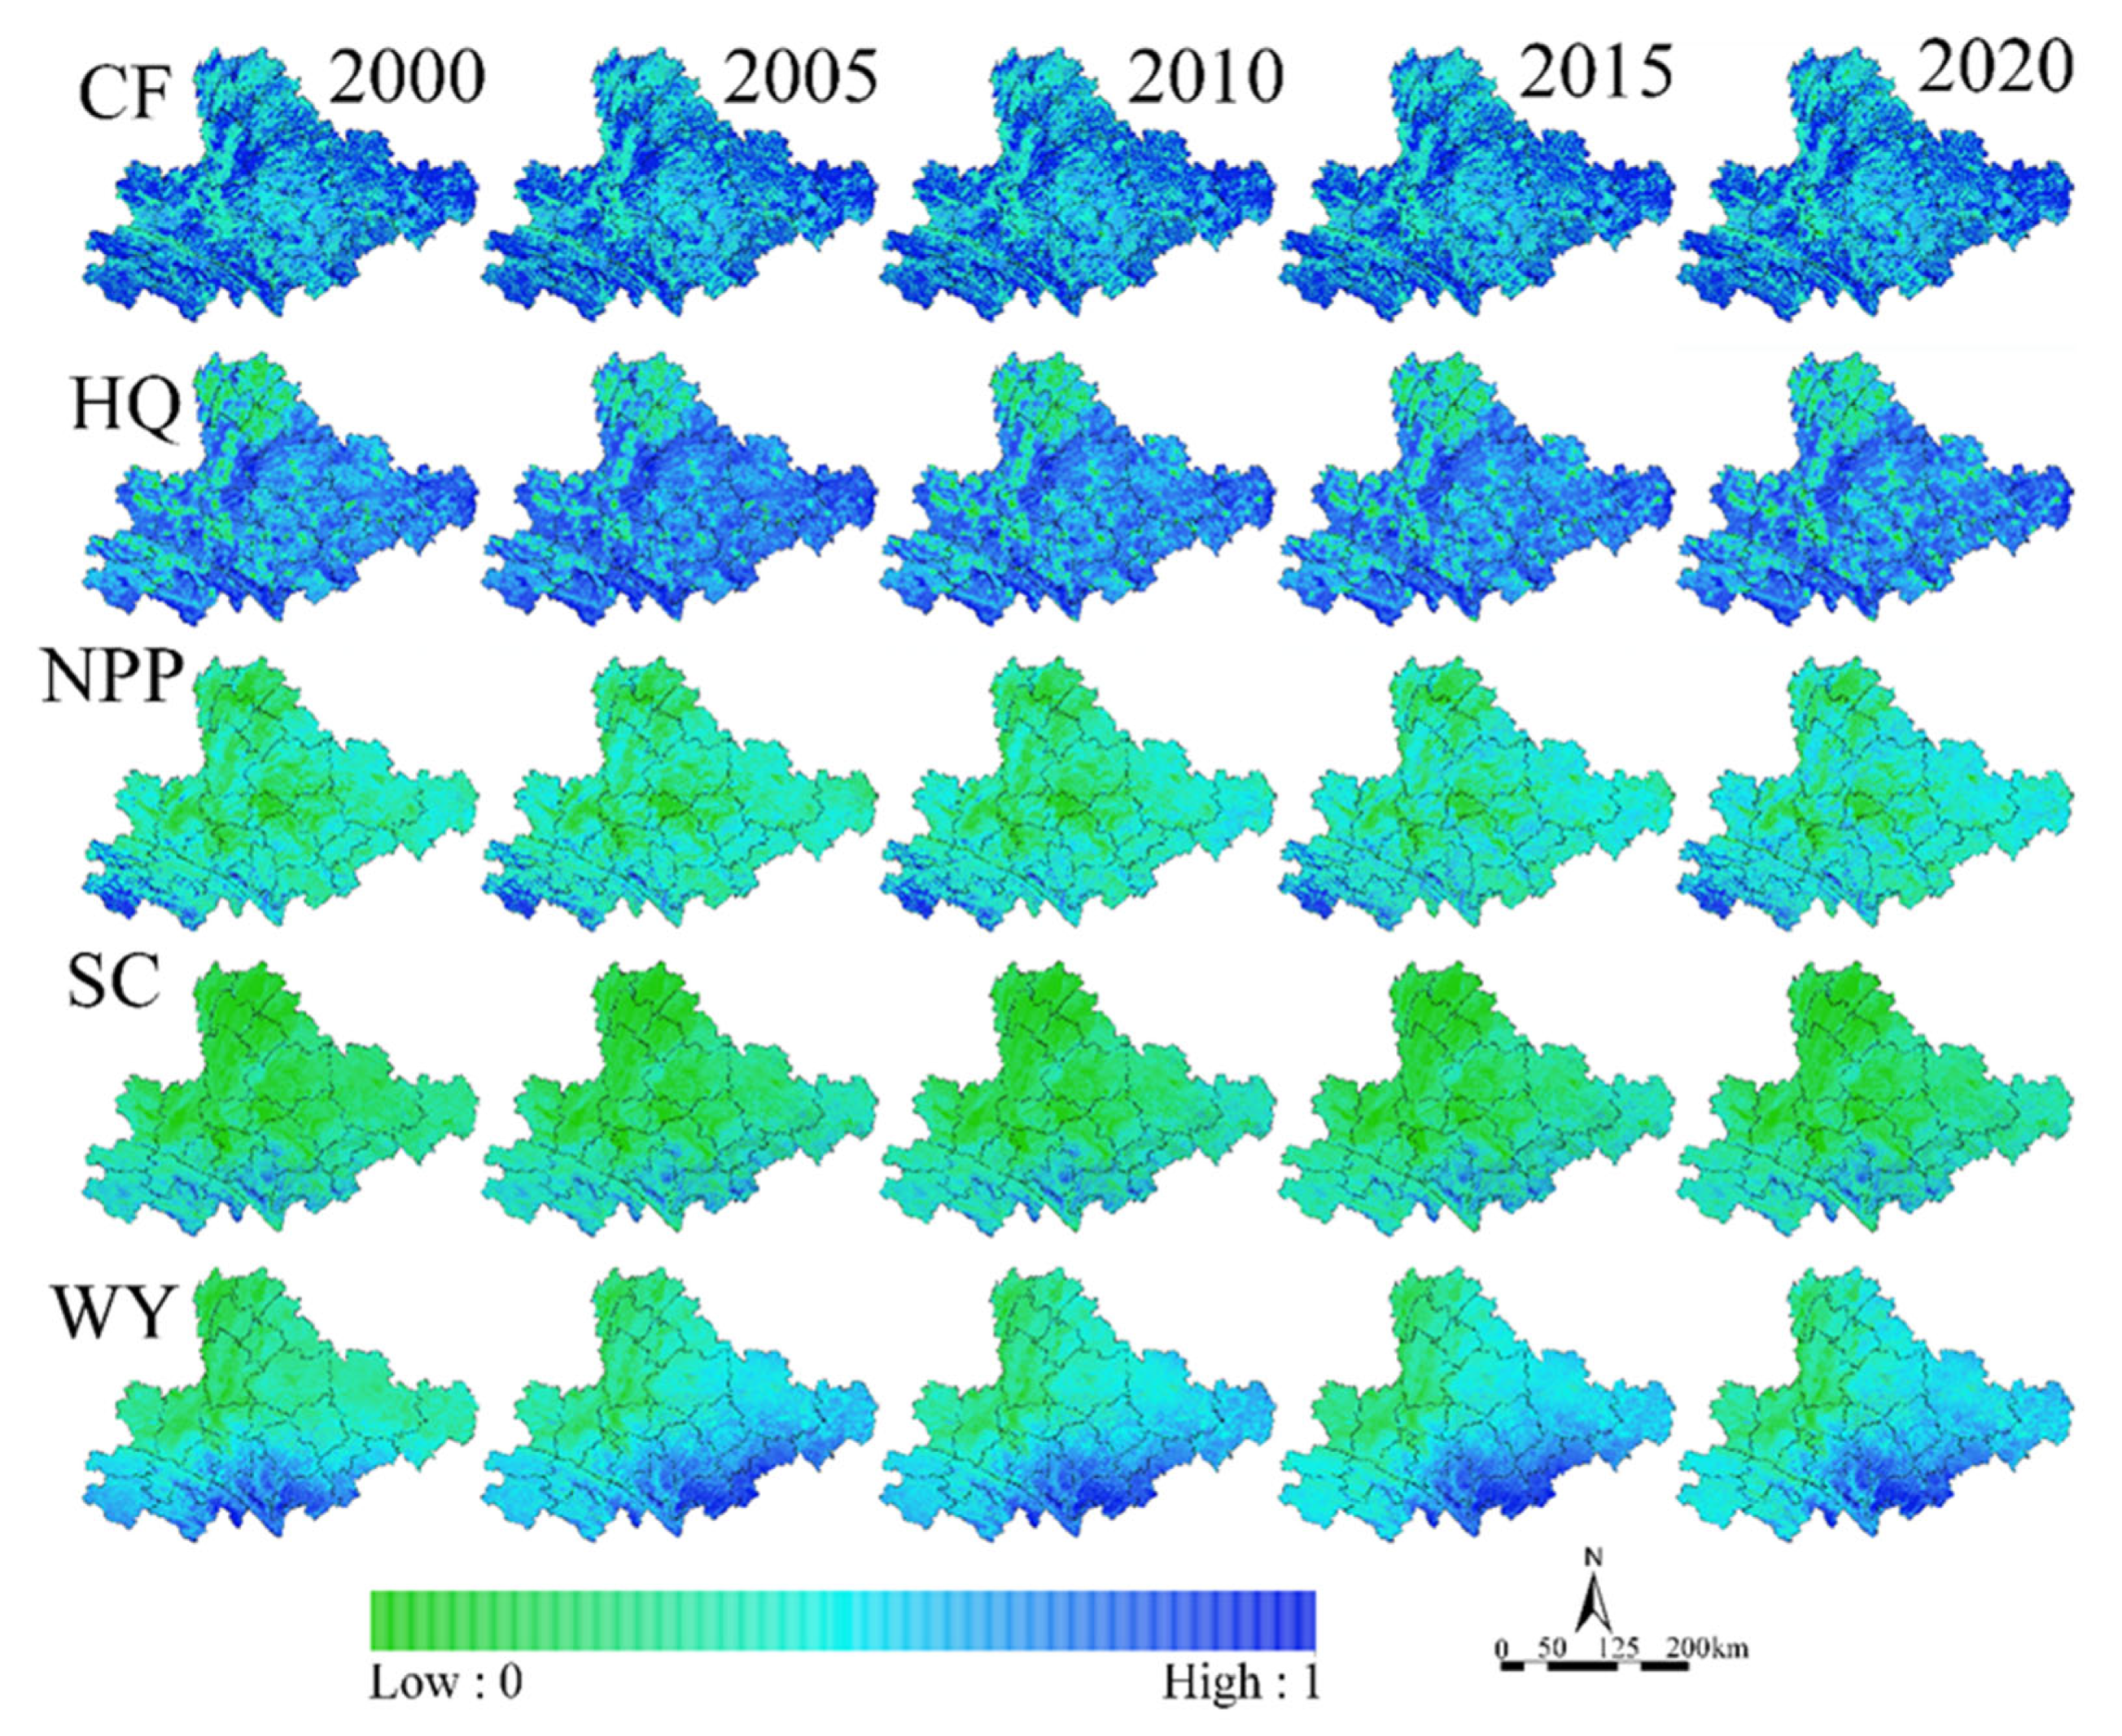
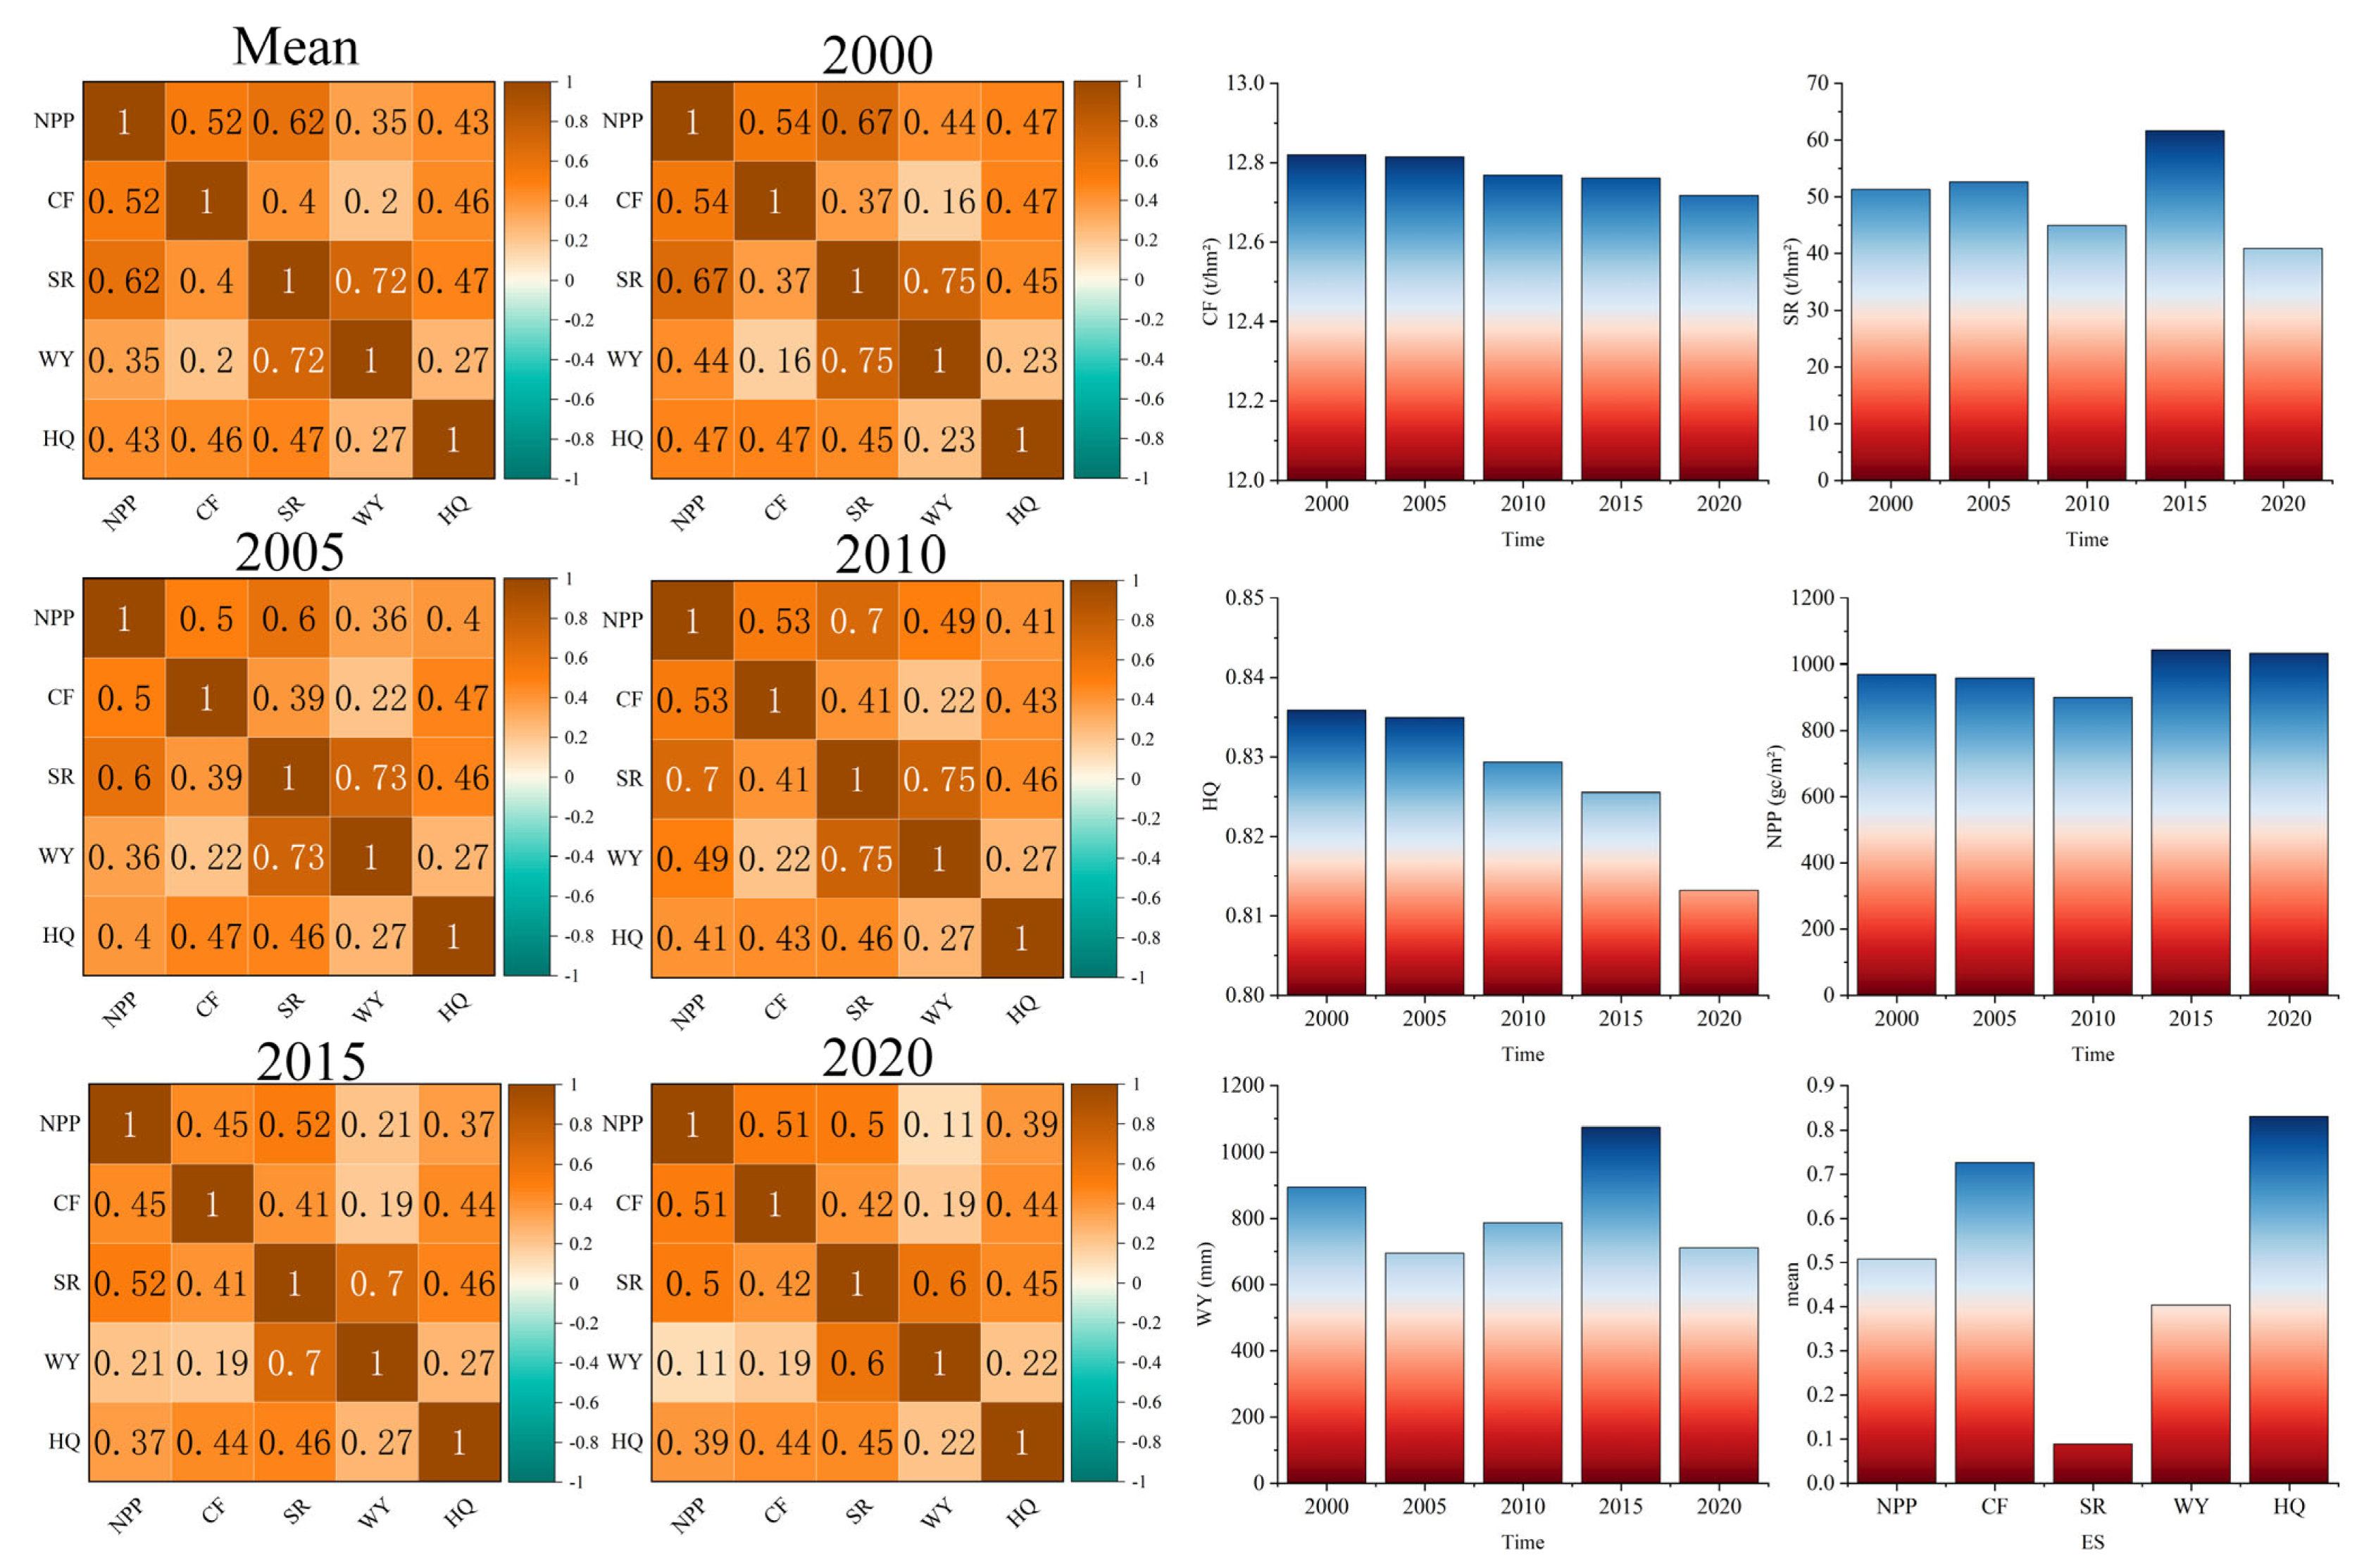
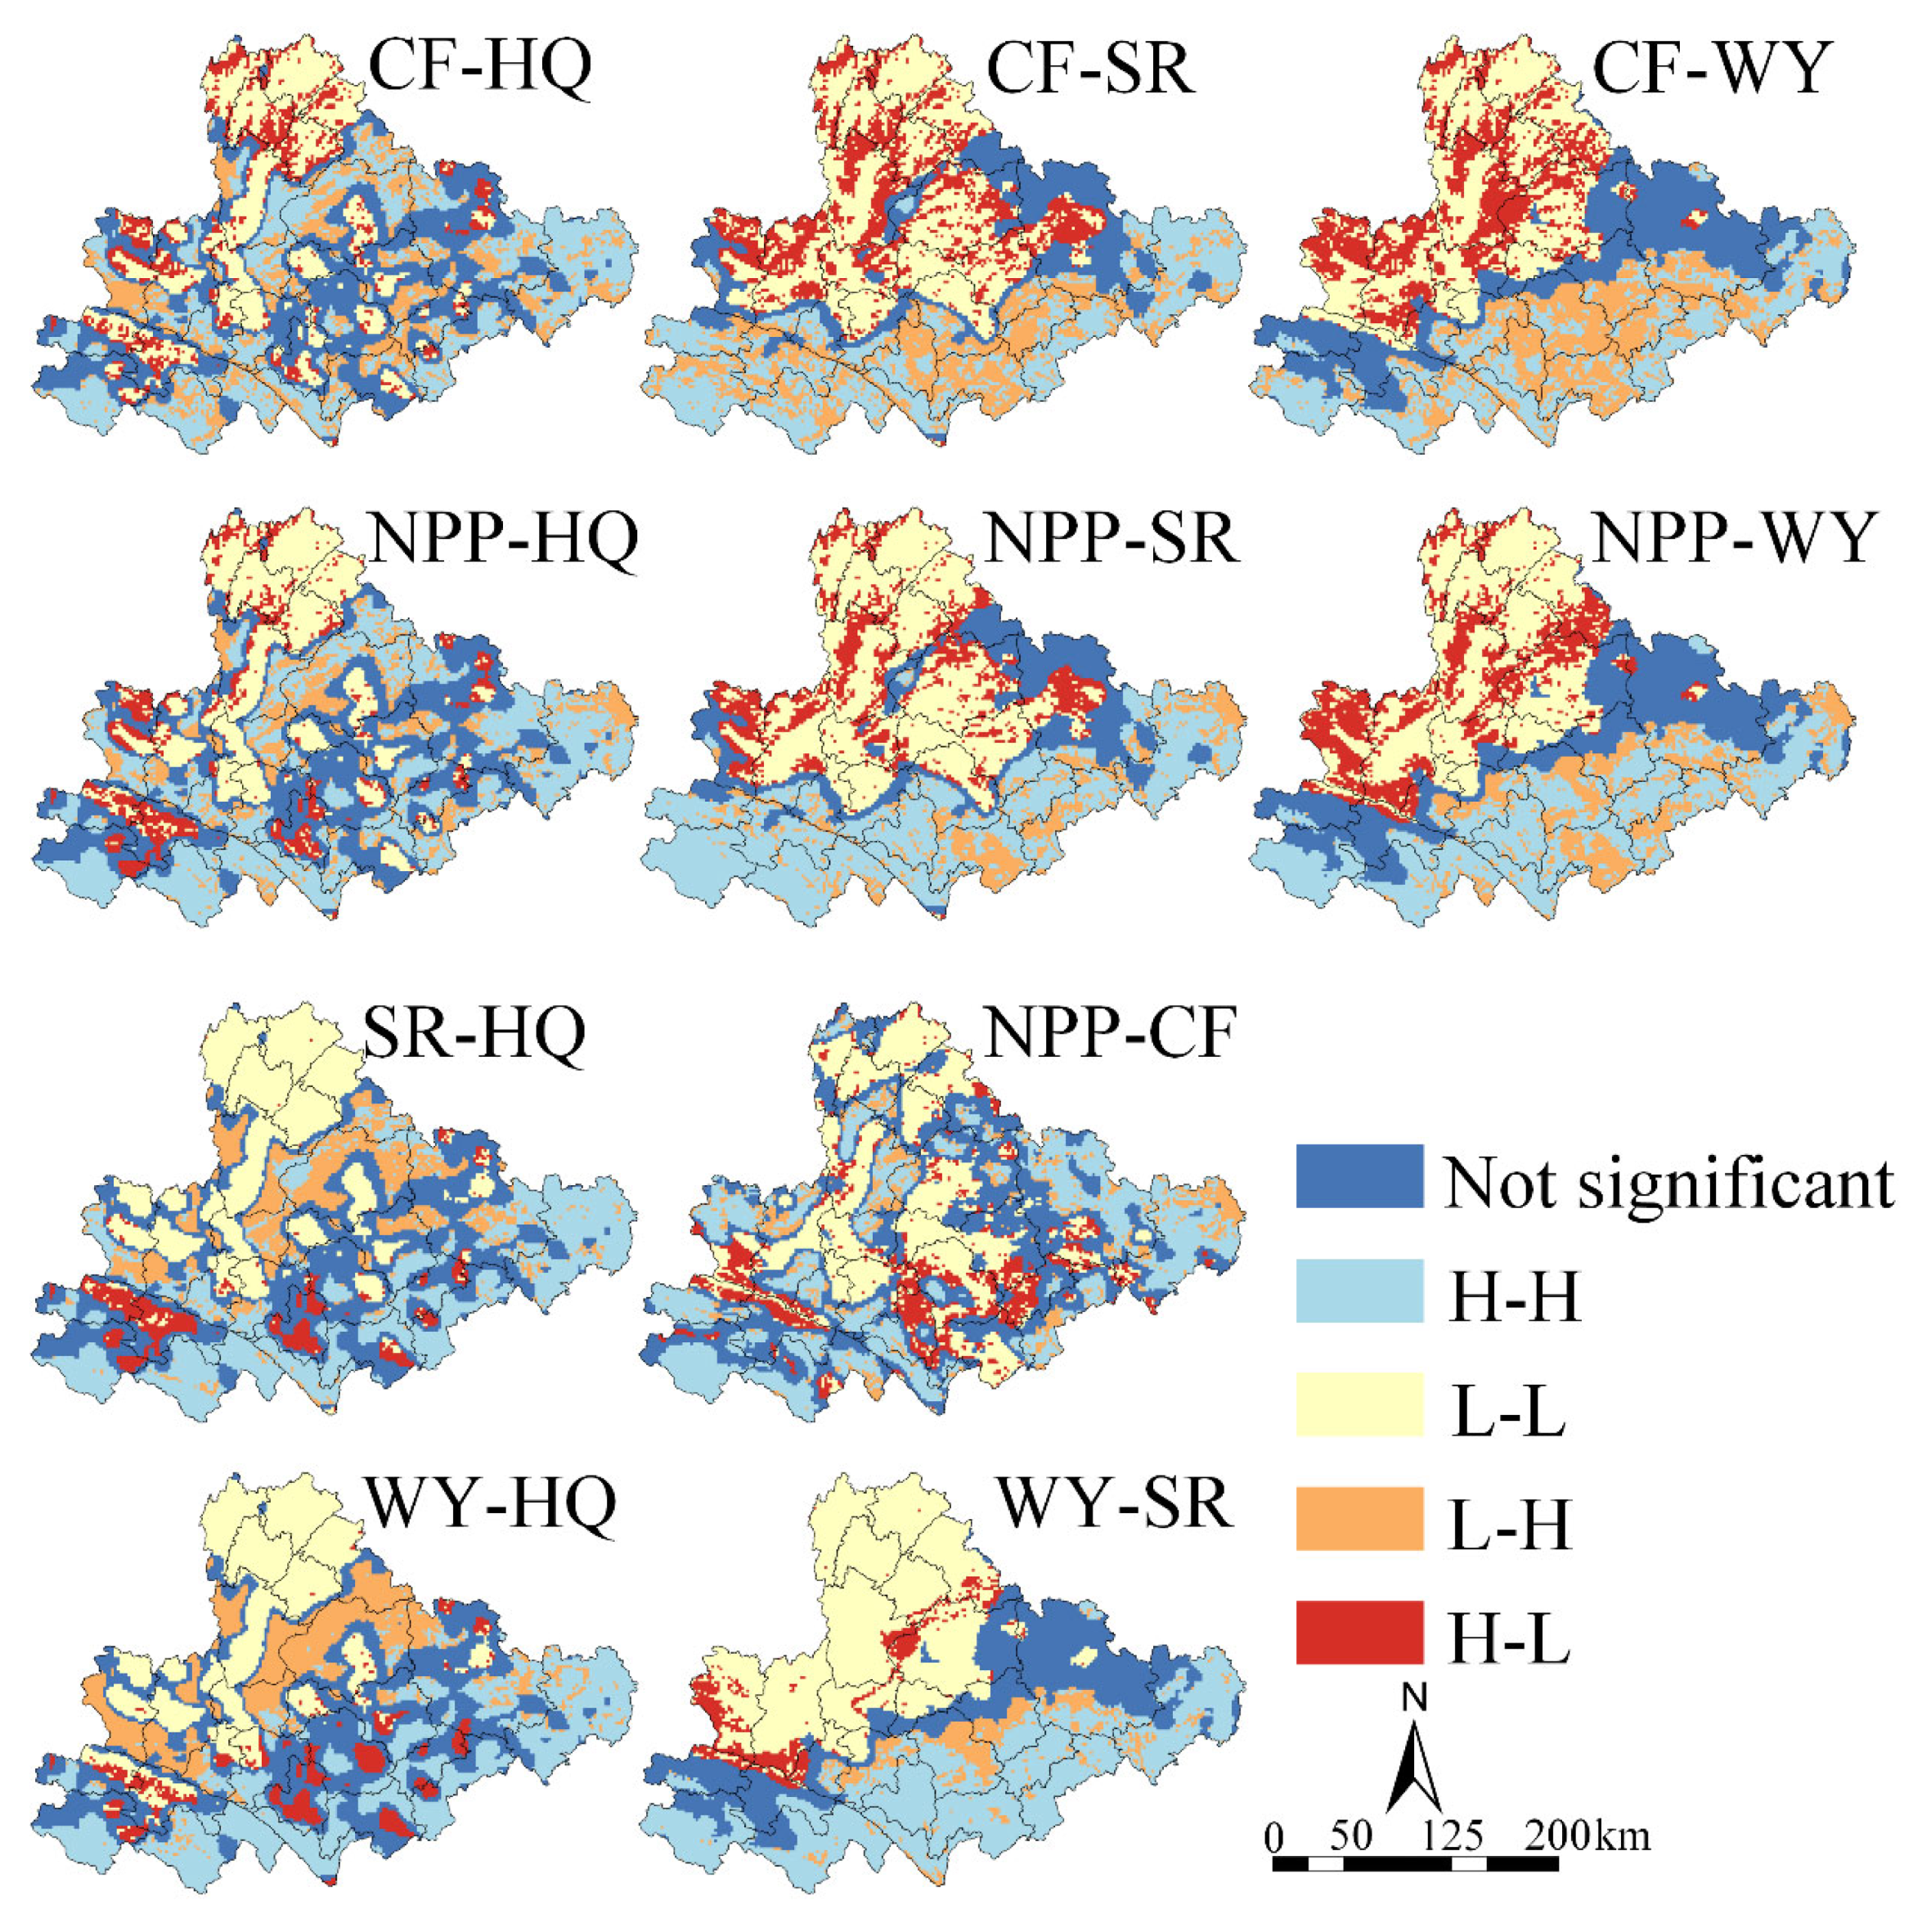
3.2. Characteristics of the Spatial Distribution of Ecosystem Services and Trade-Offs

Based on the InVEST and CASA models, this study quantified, in detail, the spatial distribution patterns of the five types of ecosystem services in the Yunnan Karst region and analyzed their dynamics. We found that the spatial distribution of carbon fixation (CF) was relatively homogeneous, which was mainly attributed to the large areas of woodland and grassland in the region (Figure 4). The relatively homogeneous ecological environment provided a stable base for carbon storage. However, while habitat quality (HQ) had a similar distribution pattern to CF, lower habitat quality was noted close to Kunming City, which was mainly attributed to the greater degree of ecological disturbance due to construction land in the area. In addition, net primary productivity (NPP) was generally low in the study area, except for the area around Luchun County, which had higher NPP values. The spatial distribution of soil conservation (SC) was similar to that of NPP; the high value areas were scattered in the high mountainous areas, especially along the spatial band structure formed from Luchun to Funing County. This indicated that high altitude areas have strong soil retention capacity due to good vegetation cover. The spatial distribution of water yield (WY) showed a trend of high in the south and low in the north, which was closely related to the natural climatic conditions of the region. Analyzing the trends between 2000 and 2020, we observed a continuous decline in habitat quality, especially between 2015 and 2020. Carbon fixation showed a slight downward trend, but the overall change was not significant. NPP showed an overall upward trend, which may have been related to the active promotion of afforestation and ecological restoration activities in the region. SR (soil erosion) showed a fluctuating process of first decreasing, then increasing, and then decreasing, which was mainly driven by changes in rainfall. The trend of WY had a certain synergistic relationship with SR, and the dynamics of the two reflected the complex interactions between regional soil erosion and water resource regeneration. By statistically normalizing the values of the five categories of ecosystem services, we assessed the dominant ecosystem service functions in the study area. The results showed that habitat quality was the dominant service function in the study area, reflecting the high level of biodiversity in the region. The relatively low SR values revealed the poor soil and water conservation capacity of this Karst area, which reflected the unique geological and climatic conditions of the region. These findings not only provide a scientific basis for understanding the ecological functions of the Yunnan Karst region, but also provide important reference information for future environmental protection and land management policy development.
In a long-term ecosystem services study in the Yunnan Karst region, synergies and trade-offs between five types of ecosystem services were measured using the Spearman method. Data analyzed from 2000 to 2020 showed that these ecosystem services broadly exhibited synergistic relationships, i.e., enhancement of one service tended to be accompanied by enhancement of others rather than sacrificing some services to enhance others. Among the specific relationships between the various services, the synergistic relationship between water yield (WY) and soil retention (SR) was the strongest, with an average correlation coefficient of 0.72, indicating a strong positive correlation between water resource abundance and soil erosion control. This finding was closely related to the geomorphological features and precipitation patterns of the Karst region, where water resource abundance tends to contribute to enhanced soil stability and hence reduced erosion. Secondly, the synergistic relationship between SR and net primary productivity (NPP) was also relatively significant, with an average correlation coefficient of 0.62. This suggested that, in this region, the effectiveness of soil conservation measures directly affects vegetation growth and ecosystem primary productivity. The synergistic relationships between carbon fixation (CF) and habitat quality (HQ) and water yield (WY) were relatively weak, with average correlation coefficients of 0.27 and 0.2, respectively. This may have reflected the low dependence of carbon storage and habitat quality on water resources, or the fact that these services are more influenced by other non-water related factors.
It is worth noting that the synergistic relationship between the five categories of ecosystem services remained relatively stable from 2000 to 2010 (Figure 5), but the synergistic relationship between water yield and net primary productivity declined significantly between 2015 and 2020. The correlation coefficient for this relationship was 0.49 in 2010, while in 2020 this value dropped to 0.11. This change may have been related to regional climate change, increased human activities, and the implementation of ecological restoration measures in recent years. In particular, changes in precipitation patterns as a result of climate change may affect the allocation and use of water resources, which in turn affect the growth of vegetation and the productivity of ecosystems.
Bivariate spatial autocorrelation analyses using Geoda2.1 software revealed complex spatial correlations among the five types of ecosystem services in the Yunnan Karst region (Figure 6). The results of the analyses showed that these ecosystem services had the spatial characteristics of low–low clustering in the northern part of the region, which indicated that the level of ecosystem service provision was generally lower in the more economically developed areas with relatively flat land and a higher intensity of human activities. This could be attributed to the high pressure of highly urbanized and industrialized activities on the natural environment, leading to a decline in ecosystem service capacity. Further analyses showed that carbon fixation (CF) and habitat quality (HQ) exhibited low–low and high–low clustering in the northern part of the study area, but high–high clustering in the central and southern parts. This distribution pattern reflected the interactions and dependence between ecosystem services in different regions. The low–low clustering in the north may have reflected the reduced capacity of ecosystem services due to intensive human activities, while the high–high clustering in the center and south may have been related to the lower intensity of human activities and better natural environmental protection status in these areas. In addition, CF showed similarities in spatial agglomeration type to soil conservation (SR) and water yield (WY), suggesting a high synergistic service relationship between WY and SR. This synergy may have been due to the fact that all these services are closely related to water resources and soil conditions, and good water management and soil conservation measures can simultaneously enhance the carbon fixation capacity of these regions. Habitat quality (HQ) and net primary productivity (NPP) showed high–high clustering in most of the study area, indicating that these two services tend to be simultaneously high in ecologically well-conditioned areas. The clustering space of NPP with SR and WY was mostly low–low clustering, which was similar to the type of clustering of CF and SR and WY, further proving the clustering tendency of these services in areas that have been less affected by human activities.

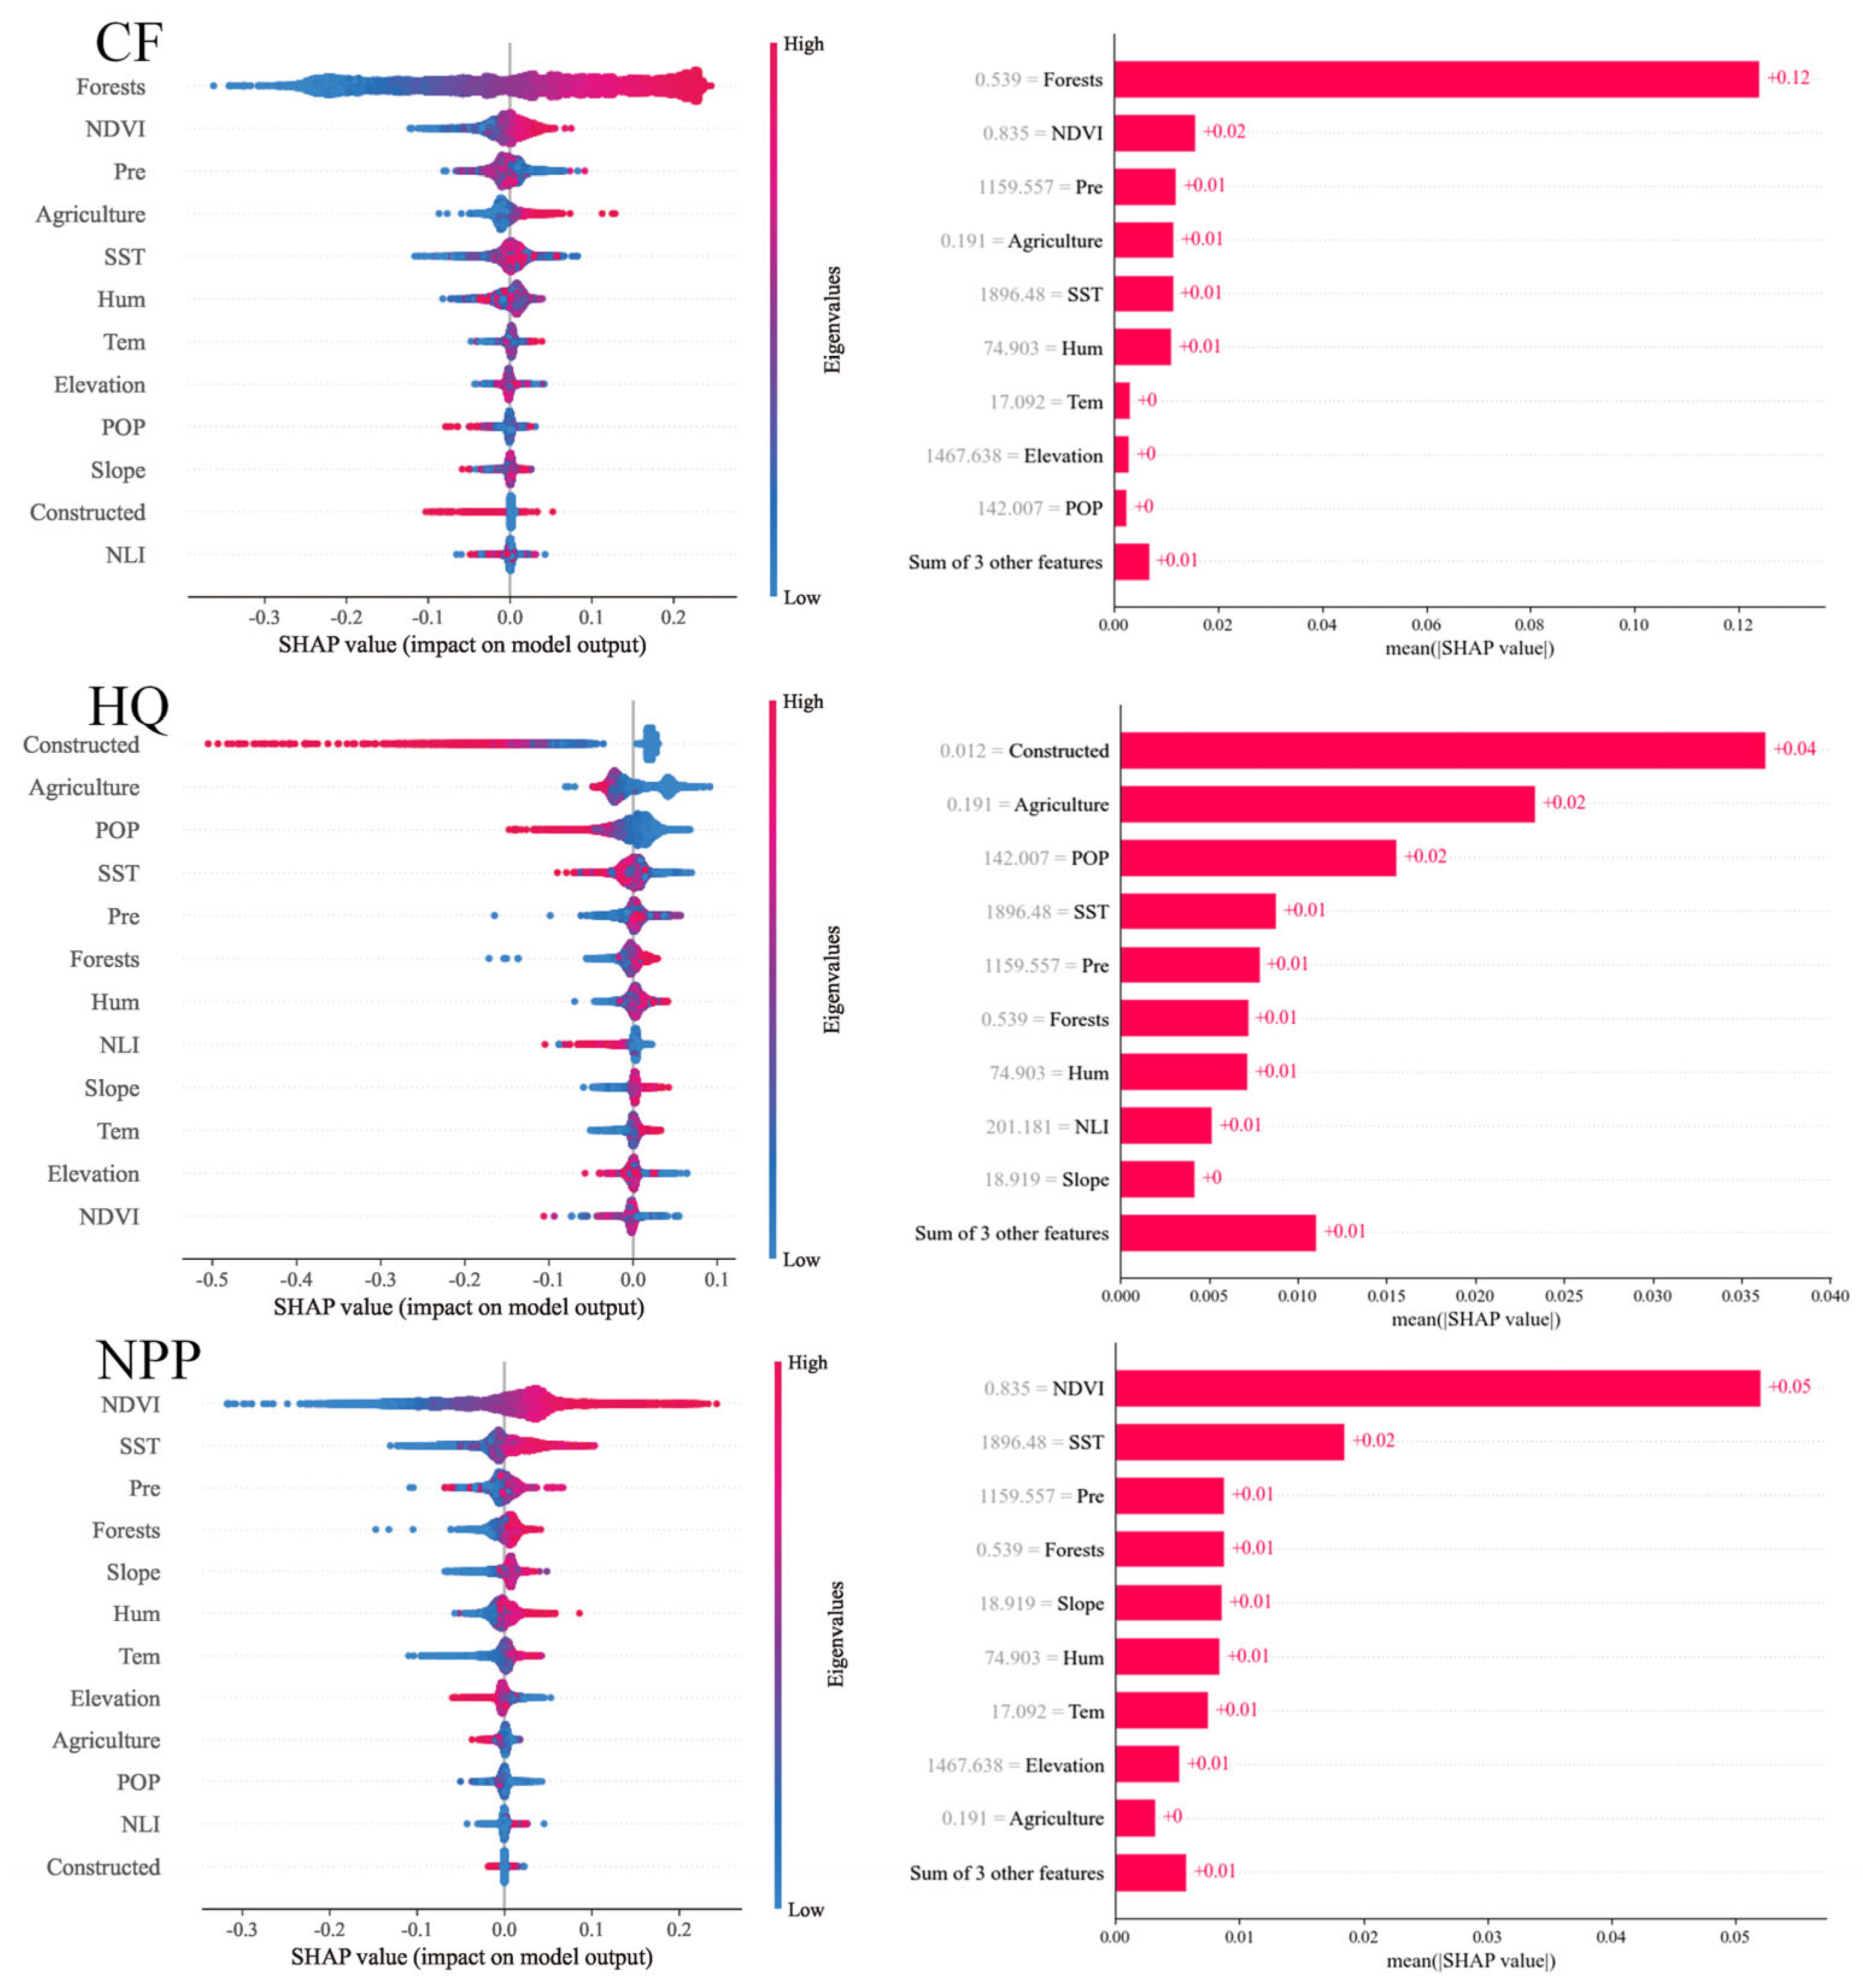
3.3. Identification of Key Influencing Factors

In this study, we used the XGBoost–SHAP model to analyze the key factors affecting five major ecosystem services in the Yunnan Karst region. By calculating the SHAP values, we revealed the relative importance of each factor’s influence on ecosystem services, providing a scientific basis for ecological protection and land management (Figure 7).
The key drivers of the carbon fixation capacity included the proportion of forest land, the vegetation index (NDVI), rainfall (Pre), the proportion of agricultural land (Agriculture), and sunshine hours (SST). The highest SHAP value (0.12), for the proportion of forested land, indicated that forested land was the most critical factor for regional carbon fixation, reflecting the central role of forest ecosystems in carbon sequestration. The SHAP value of 0.02 for the NDVI was the next highest, revealing the significant influence of vegetation health on the carbon fixation process. The SHAP values of rainfall and sunshine duration were both 0.01, revealing the fundamental supportive roles of moisture and sunlight on plant growth and carbon fixation activities. The influencing factors of habitat quality included the proportion of construction land (Constructed), the proportion of agricultural land, population density (POP), sunshine duration, and rainfall. The SHAP value of 0.04 for the proportion of construction land was the most important factor affecting habitat quality, highlighting the potential destructive effects of the expansion of construction land on natural habitats in the process of urbanization. The SHAP value for agricultural land was 0.02, further emphasizing the impact of land use change on biodiversity and ecological quality. The SHAP values of population density and sunshine duration were both 0.01, jointly indicating the intensity of human activities and environmental conditions.

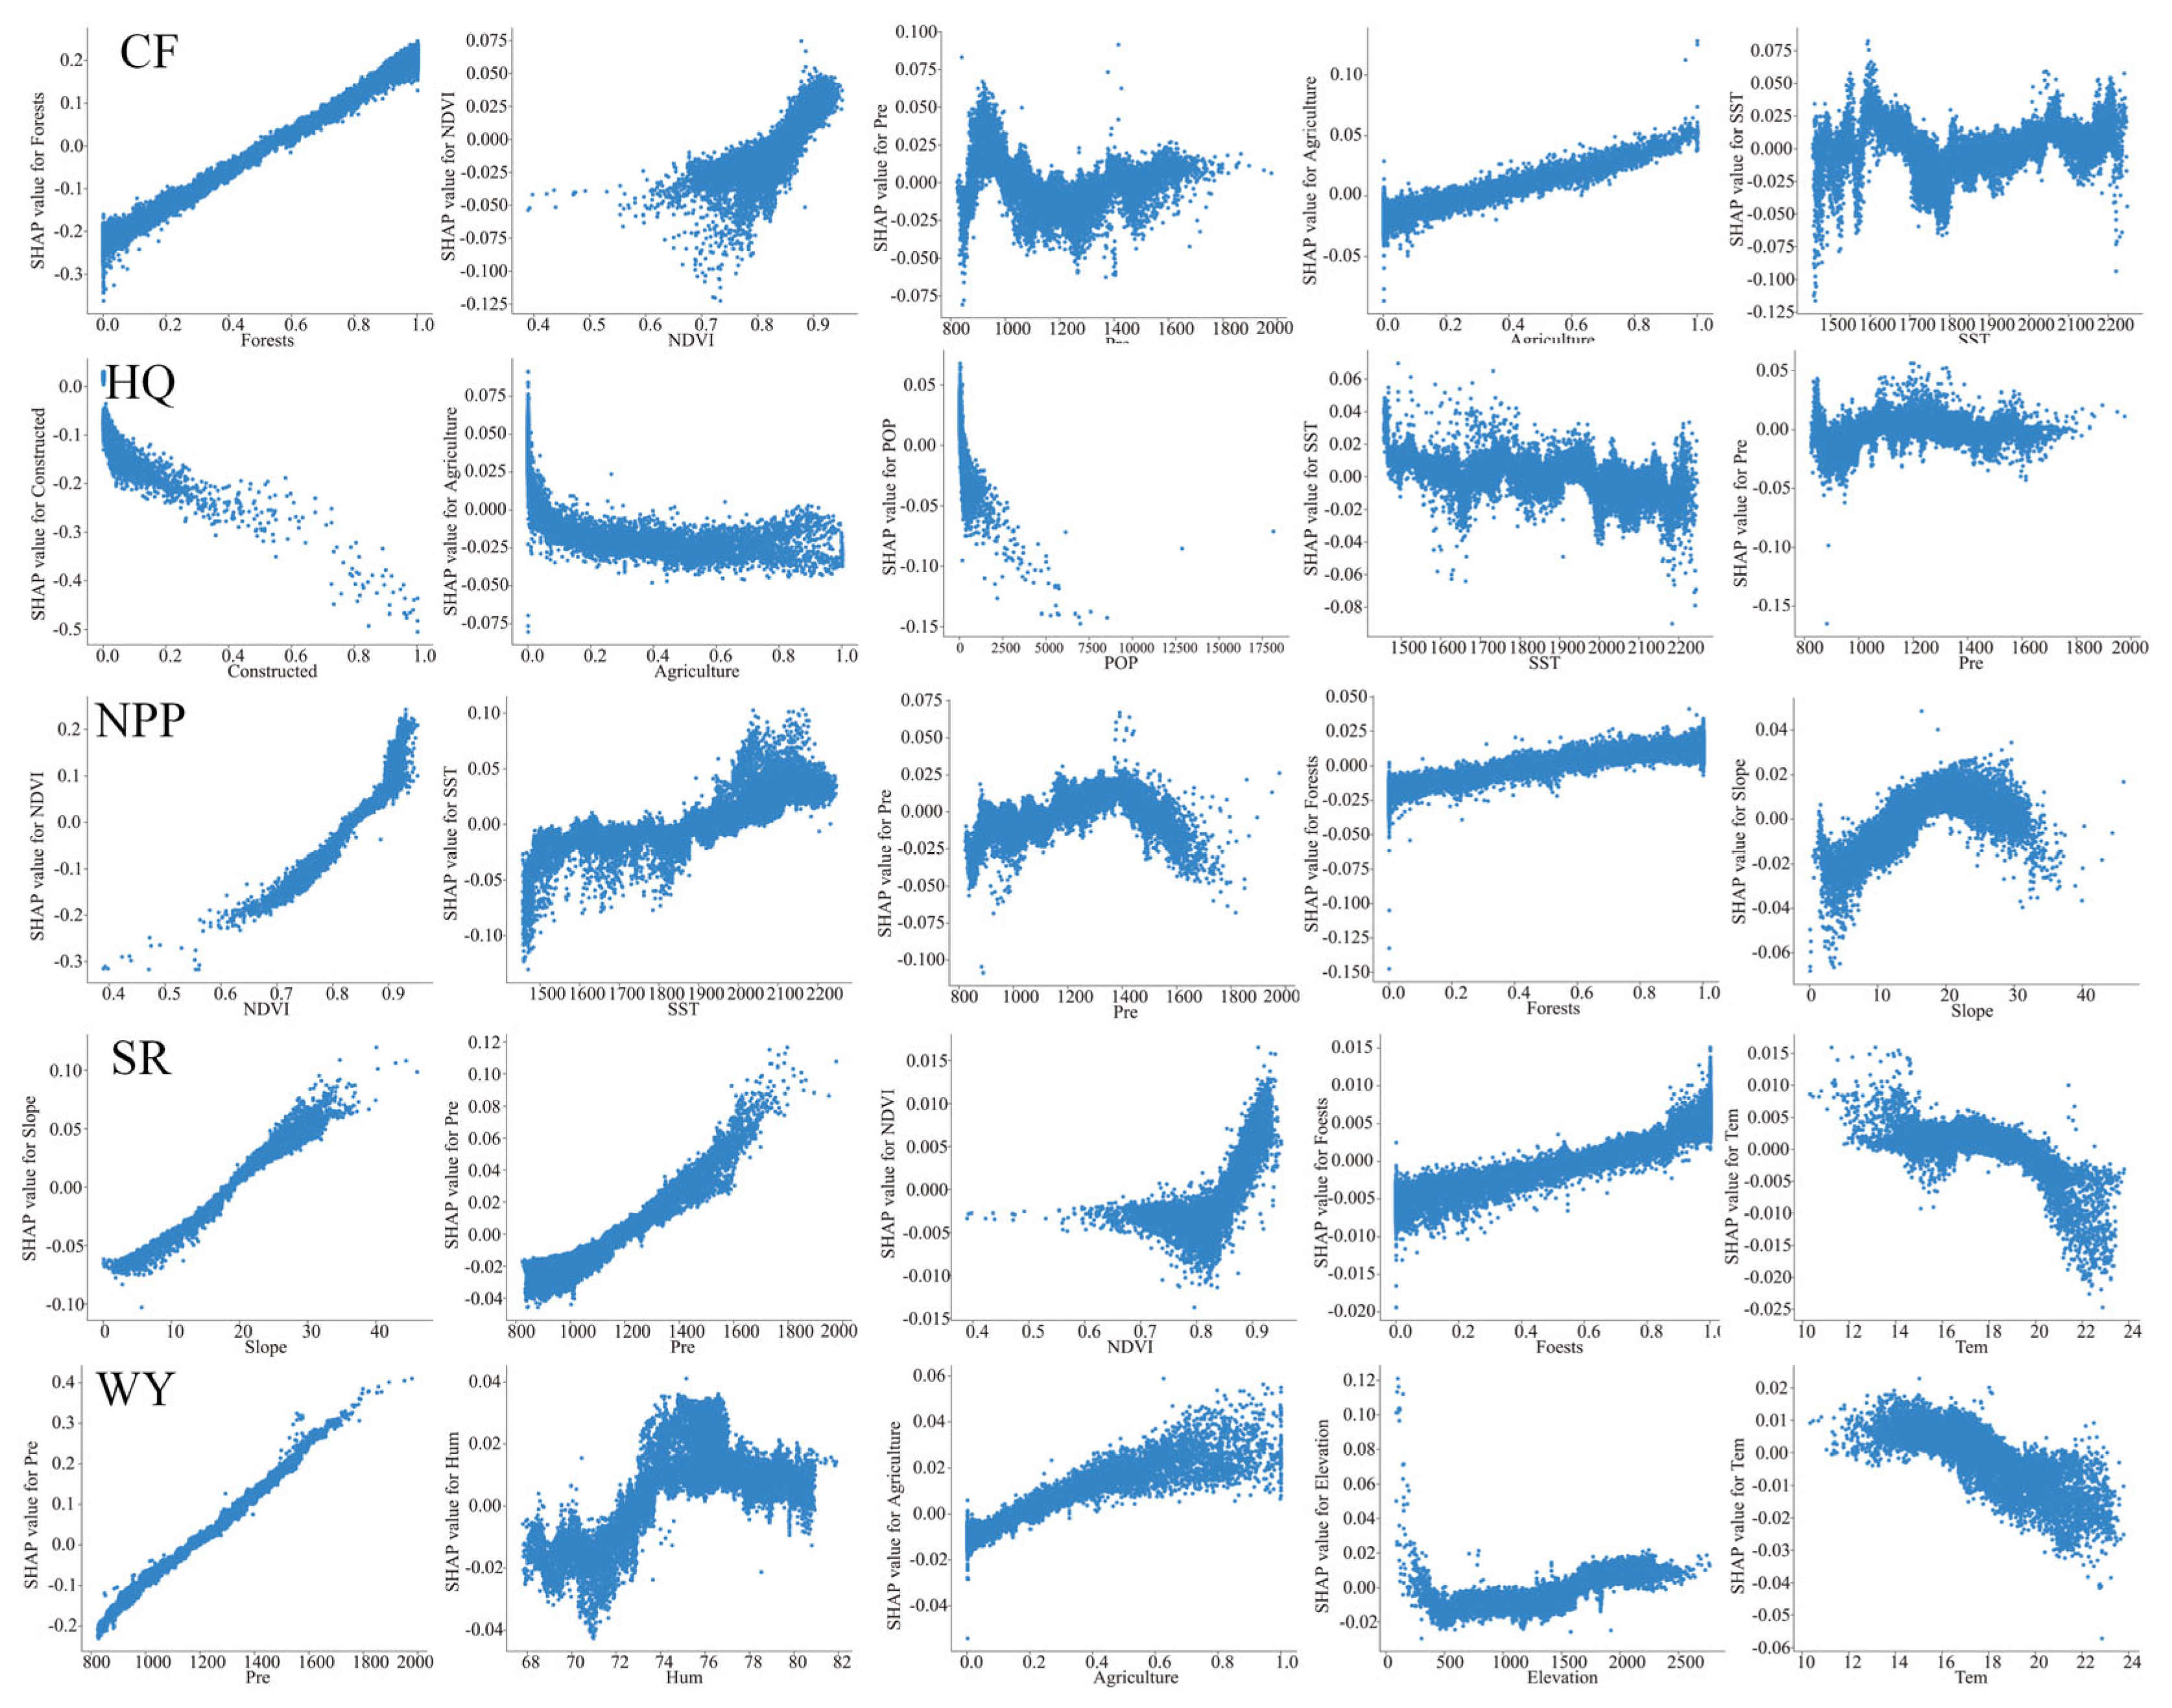
3.4. Nonlinear Relationships and Effectiveness Thresholds for Key Influencing Factors

In this study, the key factors affecting different ecosystem services in the Yunnan Karst region were analyzed using the XGBoost–SHAP model. The influencing factors of these ecosystem services showed complex interactions and diverse influence patterns, not only affecting their respective service types individually, but also significantly correlating and interacting with each other (Figure 8).
Carbon fixation (CF) and net primary productivity (NPP) were influenced by several common factors, including forest land occupation (Forests), vegetation index (NDVI), and rainfall (Pre). Specifically, the proportion of forested land had a positive effect on both CF and NPP, with a SHAP value of 0.12, indicating that forest expansion significantly increased the regional carbon sequestration capacity and plant productivity. The NDVI had a positive effect on both services, highlighting the importance of a healthy state of vegetation on carbon fixation and productivity. The effect of rainfall on these two services was nonlinear, with rainfall contributing to ecosystem functioning until a certain threshold (1000 mm) was reached, but beyond which excessive rainfall could lead to resource wastage or ecological damage. This finding emphasized the importance of moderate rainfall in maintaining ecosystem health. Habitat quality (HQ) and soil retention (SR) were also affected by similar factors, such as rainfall and land cover type (e.g., agricultural land and forest land). The proportion of built-up land had a significant negative effect on HQ, with a SHAP value of -0.04, and the negative effect gradually increased with the increase in built-up land, indicating significant damage to biodiversity and habitat quality during urbanization. The effect on SR was relatively small, indicating that the direct effect of built-up land on soil conservation was limited. The proportion of forested land had a positive effect on both HQ and SR, emphasizing the key role of forested land in improving habitat quality and enhancing soil conservation. Among the factors affecting NPP, the NDVI, sunshine duration (SST), and rainfall were the most dominant. The predominantly positive trend in the effect of the NDVI, with a SHAP value of 0.05, indicated that the improvement in vegetation cover significantly enhanced regional productivity. The positive effect of sunshine duration on NPP (SHAP value of 0.02) indicated that sufficient sunlight helps plant photosynthesis. The effect of rainfall was first positive and then negative, becoming negative after exceeding 1400 mm, which suggested that moderate rainfall favors vegetation growth, but excessive rainfall may lead to excess water resources and soil erosion. Soil retention (SR) was significantly affected by slope, rainfall, and the NDVI. The positive effect of slope on SR (SHAP value of 0.03) indicated that steep terrain helps soil fixation and retention; however, the effect of excessive slope (>20 degrees) on NPP was negative due to the limitations of vegetation growth on steep terrain. The positive effect of rainfall on SR (SHAP value of 0.02) was consistent with its replenishing effect on water resources. The effect of the NDVI on SR was first negative and then positive, with vegetation health significantly enhancing soil retention when the NDVI was greater than 0.8.
The main factors influencing water yield (WY) were rainfall and humidity (Hum). Rainfall had the most significant positive effect on WY, with a SHAP value of 0.09, indicating that rainfall directly determines the availability of regional water resources. Humidity showed a nonlinear pattern that was first negative and then positive, with the first inflection point occurring at 71 and the second at 74, indicating that water resources are more efficiently utilized under moderate humidity conditions. The share of agricultural land had a positive effect on WY (SHAP value of 0.01), while the negative effect of sunshine hours on WY (SHAP value of −0.01) showed that too much sunlight may lead to increased evaporation and reduced water resources. By analyzing the relationships and thresholds of the effects of these key factors together, we can more fully understand the interdependencies and trade-offs between ecosystem services. For example, an increase in woodland, while contributing to enhanced carbon fixation and improved habitat quality, may also affect surface water availability and the demand for agricultural land. Similarly, while increased rainfall can enhance NPP and WY, excessive rainfall may negatively affect soil stability. Therefore, rational management of land use and environmental conditions, balancing the relationship between various ecological services, is essential for achieving sustainable regional development.

4. Discussion

4.1. Significance of This Study for Regional Ecological Restoration

In this study, land use changes and their impacts on ecosystem services in the Yunnan Karst region between 2000 and 2020 were analyzed in depth using the XGBoost–SHAP model, providing an important practical basis and guidance for regional ecological governance.
We found significant changes in land use in the study area over the past 20 years, especially in the conversion of arable land to construction land. This change was particularly evident in more economically developed areas, such as Wenshan, Yanshan, and Qiubei, mainly due to rapid urbanization and infrastructure development. In addition, the area of woodland and grassland increased in the initial period but began to decline after 2015, which was closely related to the expansion of agriculture and the increase in construction land. Decreases in water bodies and wetlands reflected challenges in water resource management, and decreases in unutilized land indicated development pressure on land resources. Trends in ecosystem services also showed clear inter-annual differences. Habitat quality (HQ) declined significantly under the combined effects of urbanization and agricultural expansion, leading to loss of biodiversity and deterioration of ecosystem health. Soil conservation (SR) and water yield (WY) services showed large inter-annual variations due to climate change, with changes in rainfall having a particularly significant impact on both services. Soil erosion increased and SR services declined in years of excessive rainfall, while SR and WY services improved in years of moderate rainfall. However, carbon fixation (CF) services have been enhanced over the past 20 years by expanding the area of forest land. The increase in forest land not only improved the carbon sequestration capacity of the region, but also mitigated the negative impacts of other land use types on ecosystem services to some extent. This suggested that the declining trend of ecosystem services can be reversed to a certain extent through reasonable ecological management measures.

4.2. Policy Recommendations

By revealing the impacts of human activities and climate change on ecological services in the Karst region, this study provides a scientific basis for relevant policy formulation. China’s territorial spatial planning emphasizes ecological protection and rational use of resources, and the Karst region has special requirements for strategy formulation due to its special ecosystem and topographic conditions [26,27]. Through the XGBoost–SHAP model, we not only analyzed how climate change and land use change affect ecological services, but also specifically revealed the nonlinear relationships and threshold effects of these factors, which will be crucial for the development of precise regional management strategies. In addition, the findings emphasized the importance of maintaining ecosystem services for promoting biodiversity and improving the overall functioning of regional ecosystems. Therefore, this study supports the implementation of strict land management policies in China in ecologically fragile regions such as Karst, to protect natural resources while promoting sustainable economic development. These findings were consistent with the objectives of territorial spatial planning and provide empirical support for policy decisions at the local and national levels. Based on the results, we outline the following policy recommendations for territorial spatial planning to help promote ecological protection and sustainable development:
(1)
Enhancement of land use management in ecologically sensitive areas: Karst areas are particularly sensitive to human activities due to their unique landforms and ecosystems. The conversion of cultivated land to construction land has a significant impact on ecological services, especially habitat quality and soil conservation. For this reason, strict land use policies are needed to limit non-essential construction activities in ecologically sensitive and biodiversity-rich areas. Policies should include clear categorization of land use, strict approval processes, and high standards of environmental impact assessment to ensure that development activities do not cause irreversible damage to local ecosystem services.
(2)
Implement targeted ecological restoration and protection measures: According to research findings, ecological services in Karst areas, especially soil retention and carbon fixation capacity, have been affected by human activities and climate change. Policies should support and promote ecological restoration programs such as restoration of native vegetation, establishment of ecological corridors, and wetland protection and restoration. In addition, the government should invest in research on endemic ecosystems to better understand their ecological functions and effectively implement conservation measures. Strengthening the participation and education of local communities is also key to increase their awareness of the importance of ecological conservation programs, and thereby increase their participation.
(3)
Establish a dynamic ecological monitoring and management system: In order to adapt to the rapid changes in climate and human activities, the Karst region needs a dynamic ecological monitoring system that can monitor the status and changes in ecosystem services in real time. This system should integrate remote sensing technology and ground monitoring data for early warning and response to ecological changes. In addition, flexible management strategies should be developed to adjust protection and restoration measures based on monitoring data. Policymakers should ensure sufficient financial and technical support to establish and maintain the system and ensure its effective operation, in order to protect and restore ecosystem services in Karst areas.

4.3. Shortcomings and Prospects

In this study, the key drivers of ecosystem services in the southeast Yunnan Karst region were analyzed in depth using the XGBoost–SHAP model. Meaningful results were obtained, but there were some shortcomings that need to be improved and explored in depth in future studies.
The data in this study spanned the years 2000, 2005, 2010, 2015, and 2020, and although they covered 20 years of change, a lack of timely data updating remains an issue. With the rapid development of climate change and human activities, the influencing factors and dynamics of ecosystem services may become more complex. Therefore, future studies should consider using newer, longer time-span data to capture more comprehensive trends in ecosystem service changes. Second, this study mainly relied on remotely sensed data and statistical data, which, although they have high spatial coverage and temporal continuity, may be deficient in precision and resolution. For example, although night-time lighting data can reflect the intensity of human activities, the low resolution may not accurately capture small-scale changes in human activities. Therefore, future studies should combine high-resolution remote sensing data and ground survey data to improve the accuracy and fineness of the analyzed results. In addition, a variety of indicators such as elevation, slope, rainfall, sunshine duration, land use ratio (forest land, construction land, agricultural land), humidity, temperature, population density, and night-time lighting were selected for this study. Although these indicators can reflect the impacts of climate change and human activities in a more comprehensive way, there are still some potentially critical factors that were not included, such as soil type, vegetation type, and water resource management measures. Future research should consider more dimensional environmental and socio-economic factors to fully reveal the driving mechanisms of ecosystem services.
The XGBoost–SHAP model, although able to reveal nonlinear relationships and complex interactions between variables, still suffers from insufficient interpretability and is non-intuitive. SHAP values can quantify the contribution of each variable, but their interpretability depends on the accuracy of the model and the quality of the training data. Therefore, future research could consider introducing more explanatory models and methods [25,27], such as causal inference and Bayesian networks, to further enhance the understanding of ecosystem service driving mechanisms. Although this study revealed several key thresholds for ecosystem services, the specific ecological significance and practical management applications of these thresholds still need to be further verified and explored. Future studies should combine field experiments and long-term monitoring to verify the validity of these thresholds and develop corresponding management measures to achieve optimization and sustainable management of regional ecosystem services.
Despite the abovementioned shortcomings of this study, the research framework and methodology provide new perspectives and tools for the study of regional ecosystem services. Future studies should make further efforts towards data updating, model optimization, incorporation of multidimensional factors, and field validation to enhance the understanding of changes in ecosystem services and their driving mechanisms, and to provide a more solid scientific basis for regional ecological conservation and sustainable development.

5. Conclusions

In this study, the drivers of five categories of key ecosystem services (CF, HQ, NPP, SR, WY) in the Yunnan Karst region were analyzed in depth through the use of the XGBoost–SHAP model, and the interactions among these factors and their combined impacts on ecosystem services were explored. The following are the main conclusions of this study:
(1)
Between 2000 and 2020, land use in the study area underwent significant changes, especially the shift from arable land to construction land, which was particularly drastic in the more economically developed areas. During this period, the area of forest land and grassland initially showed an increasing trend, but then these areas began to decrease due to various human activities and natural factors. In some areas, some of the original woodlands and grasslands were converted to other land use types due to agricultural expansion and urban construction. The area of unutilized land decreased with the demands of population growth and economic development. This land type is often converted into agricultural land or construction land, especially in areas with high population density and economic activities.
(2)
Between 2000 and 2020, ecosystem services in the Yunnan Karst region experienced significant changes. Habitat quality (HQ) showed an overall downward trend, mainly due to the expansion of construction land during urbanization and the irrational use of agricultural land. These changes led to the destruction of natural habitats and a reduction in biodiversity levels. In addition, soil retention (SR) and water yield (WY) services showed large inter-annual variations due to climate change. In particular, changes in rainfall had a significant impact on soil erosion and water management. In years of excessive rainfall, soil erosion increased, leading to a decline in SR services, while in years of moderate rainfall, SR and WY services improved.
(3)
Multiple ecosystem services were influenced by common factors, particularly the forest land fraction, NDVI, and rainfall. These factors generally showed positive effects on carbon fixation (CF) and net primary productivity (NPP), and positive effects on habitat quality (HQ) and soil retention (SR), especially under moderate environmental conditions. The effects of some key factors, such as rainfall and sunshine duration, on ecosystem services showed nonlinear characteristics with obvious threshold effects. For example, while rainfall promotes NPP and WY, excessive amounts may negatively affect soil stability, which requires attention to be paid to the rational use and regulation of water resources in ecological management. The expansion of built-up land significantly negatively affected habitat quality (HQ), while the impact of agricultural land was more complex, showing positive and negative bidirectional effects on ecological services under different conditions. This suggests the need to pay more attention to ecological protection and land use sustainability in areas of rapid urbanization.

Author Contributions

All authors contributed to the study conception and design. Detailed contributions are as follows: B.Z.: Conceptualization; methodology; software; validation; formal analysis; investigation; data curation; visualization; writing—original draft; writing—review and editing. G.C.: Validation; resources; writing—review and editing; supervision; project administration; funding acquisition. H.Y.: Methodology; writing—review and editing. J.Z.: Resources; supervision; project administration; funding acquisition; writing—review and editing. Y.Y.: Data curation. All authors have read and agreed to the published version of the manuscript.

Funding

This research was supported by the Basic Research Program of Yunnan Province (grant number: 202201AU070112) and the National Natural Science Foundation of China (grant number: 42301304).

Data Availability Statement

The data presented in this study are available on request from the first author.

Acknowledgments

The authors express their heartfelt gratitude to our teachers and fellow students who generously contributed to this study with their insights and support. We are also deeply appreciative of the anonymous reviewers whose constructive feedback significantly enhanced the quality of the manuscript.

Conflicts of Interest

The authors declare no conflicts of interest.

References

  1. Gao, J.; Du, F.; Zuo, L.; Jiang, Y. Integrating ecosystem services and rocky desertification into identification of karst ecological security pattern. Landsc. Ecol 2021, 36, 2113–2133. [Google Scholar] [CrossRef]
  2. Zuo, L.; Gao, J.; Du, F. The pairwise interaction of environmental factors for ecosystem services relationships in karst ecological priority protection and key restoration areas. Ecol. Indic. 2021, 131, 108125. [Google Scholar] [CrossRef]
  3. Peng, L.; Chen, T.; Deng, W.; Liu, Y. Exploring ecosystem services trade-offs using the Bayesian belief network model for ecological restoration decision-making: A case study in Guizhou Province, China. Ecol. Indic. 2022, 135, 108569. [Google Scholar] [CrossRef]
  4. Li, F.; Pan, B.; Wu, Y.; Shan, L. Application of game model for stakeholder management in construction of ecological corridors: A case study on Yangtze River Basin in China. Habitat Int. 2017, 63, 113–121. [Google Scholar] [CrossRef]
  5. Zhong, Z.; Fang, X.; Zhang, Y.; Shu, X.; Guo, D. Mapping Ecosystem Service Supply–Demand Bundles for an Integrated Analysis of Tradeoffs in an Urban Agglomeration of China. Land 2022, 11, 1558. [Google Scholar] [CrossRef]
  6. Yu, H.; Gu, X.; Liu, G.; Fan, X.; Zhao, Q.; Zhang, Q. Construction of Regional Ecological Security Patterns Based on Multi-Criteria Decision Making and Circuit Theory. Remote Sens. 2022, 14, 527. [Google Scholar] [CrossRef]
  7. Armoskaite, A.; Aigars, J.; Andersone, I.; Hansen, H.S.; Schroder, L.; Strake, S. Assessing change in habitat composition, ecosystem functioning and service supply in Latvian protected stony reefs. J. Environ. Manag. 2021, 298, 113537. [Google Scholar] [CrossRef]
  8. Caro, C.; Marques, J.C.; Cunha, P.P.; Teixeira, Z. Ecosystem services as a resilience descriptor in habitat risk assessment using the InVEST model. Ecol. Indic. 2020, 115, 106426. [Google Scholar] [CrossRef]
  9. Redhead, J.W.; Stratford, C.; Sharps, K.; Jones, L.; Ziv, G.; Clarke, D.; Oliver, T.H.; Bullock, J.M. Empirical validation of the InVEST water yield ecosystem service model at a national scale. Sci. Total Environ. 2016, 569, 1418–1426. [Google Scholar] [CrossRef]
  10. Song, S.; Yu, H.; Zhang, Q.; Zhang, L.; Zhong, Q.; Zhang, G. Functional regionalization of land resources considering eco-efficiency in Nanjing Metropolitan Area, China. Ecol. Indic. 2023, 155, 110964. [Google Scholar] [CrossRef]
  11. García-Palacios, P.; Gross, N.; Gaitán, J.; Maestre, F.T. Climate mediates the biodiversity-ecosystem stability relationship globally. Proc. Natl. Acad. Sci. USA 2018, 115, 8400–8405. [Google Scholar] [CrossRef] [PubMed]
  12. Fu, D.; Bu, B.; Wu, J.; Singh, R.P. Investigation on the carbon sequestration capacity of vegetation along a heavy traffic load expressway. J. Environ. Manag. 2019, 241, 549–557. [Google Scholar] [CrossRef] [PubMed]
  13. Sherrouse, B.C.; Semmens, D.J.; Ancona, Z.H. Social Values for Ecosystem Services (SolVES): Open-source spatial modeling of cultural services. Environ. Model. Softw. 2022, 148, 105259. [Google Scholar] [CrossRef]
  14. Wang, Y.; Ji, Y.; Yu, H.; Lai, X. Measuring the Relationship between Physical Geographic Features and the Constraints on Ecosystem Services from Urbanization Development. Sustainability 2022, 14, 8149. [Google Scholar] [CrossRef]
  15. Srivathsa, A.; Vasudev, D.; Nair, T.; Chakrabarti, S.; Chanchani, P.; DeFries, R.; Deomurari, A.; Dutta, S.; Ghose, D.; Goswami, V.R.; et al. Prioritizing India’s landscapes for biodiversity, ecosystem services and human well-being. Nat. Sustain. 2023, 6, 568–577. [Google Scholar] [CrossRef]
  16. Lang, Y.; Song, W. Quantifying and mapping the responses of selected ecosystem services to projected land use changes. Ecol. Indic. 2019, 102, 186–198. [Google Scholar] [CrossRef]
  17. Wu, J.; Fan, X.; Li, K.; Wu, Y. Assessment of ecosystem service flow and optimization of spatial pattern of supply and demand matching in Pearl River Delta, China. Ecol. Indic. 2023, 153, 110452. [Google Scholar] [CrossRef]
  18. Wang, C.D.; Li, W.Q.; Sun, M.X.; Wang, Y.T.; Wang, S.B. Exploring the formulation of ecological management policies by quantifying interregional primary ecosystem service flows in Yangtze River Delta region, China. J. Environ. Manag. 2021, 284, 11. [Google Scholar] [CrossRef] [PubMed]
  19. Sun, X.; Yang, P.; Tao, Y.; Bian, H.Y. Improving ecosystem services supply provides insights for sustainable landscape planning: A case study in Beijing, China. Sci. Total Environ. 2022, 802, 13. [Google Scholar] [CrossRef]
  20. Soininen, J.; Luoto, M. Predictability in species distributions: A global analysis across organisms and ecosystems. Glob. Ecol. Biogeogr. 2014, 23, 1264–1274. [Google Scholar] [CrossRef]
  21. Amoatey, P.; Sulaiman, H.; Kwarteng, A.; Al-Reasi, H.A. Above-ground carbon dynamics in different arid urban green spaces. Environ. Earth Sci. 2018, 77, 431. [Google Scholar] [CrossRef]
  22. Ma, X.; Zhang, J.; Wang, P.; Zhou, L.; Sun, Y. Estimating the nonlinear response of landscape patterns to ecological resilience using a random forest algorithm: Evidence from the Yangtze River Delta. Ecol. Indic. 2023, 153, 110409. [Google Scholar] [CrossRef]
  23. Callaghan, C.T.; Poore, A.G.; Major, R.E.; Cornwell, W.K.; Wilshire, J.H.; Lyons, M.B. How to build a biodiverse city: Environmental determinants of bird diversity within and among 1581 cities. Biodivers. Conserv. 2021, 30, 217–234. [Google Scholar] [CrossRef]
  24. Peng, H.; Wang, S.; Wang, X. Consistency and asymptotic distribution of the Theil-Sen estimator. J. Stat. Plan. Inference 2008, 138, 1836–1850. [Google Scholar] [CrossRef]
  25. Wang, M.; Li, Y.; Yuan, H.; Zhou, S.; Wang, Y.; Ikram, R.M.A.; Li, J. An XGBoost-SHAP approach to quantifying morphological impact on urban flooding susceptibility. Ecol. Indic. 2023, 156, 111137. [Google Scholar] [CrossRef]
  26. Mo, T.; Li, S.; Li, G. An interpretable machine learning model for predicting cavity water depth and cavity length based on XGBoost-SHAP. J. Hydroinf. 2023, 25, 1488–1500. [Google Scholar] [CrossRef]
  27. Schoonemann, J.; Nagelkerke, J.; Seuntjens, T.G.; Osinga, N.; van Liere, D. Applying XGBoost and SHAP to Open Source Data to Identify Key Drivers and Predict Likelihood of Wolf Pair Presence. Environ. Manag. 2024, 73, 1072–1087. [Google Scholar] [CrossRef]
  28. Zhang, J.; Ma, X.; Zhang, J.; Sun, D.; Zhou, X.; Mi, C.; Wen, H. Insights into geospatial heterogeneity of landslide susceptibility based on the SHAP-XGBoost model. J. Environ. Manag. 2023, 332, 117357. [Google Scholar] [CrossRef]
  29. Zhou, S.; Liu, Z.; Wang, M.; Gan, W.; Zhao, Z.; Wu, Z. Impacts of building configurations on urban stormwater management at a block scale using XGBoost. Sustain. Cities Soc. 2022, 87, 104235. [Google Scholar] [CrossRef]
  30. Wei, P.; Chen, S.; Wu, M.; Jia, Y.; Xu, H.; Liu, D. Increased Ecosystem Carbon Storage between 2001 and 2019 in the Northeastern Margin of the Qinghai-Tibet Plateau. Remote Sens. 2021, 13, 3986. [Google Scholar] [CrossRef]
  31. Zhao, J.; Li, C. Investigating Ecosystem Service Trade-Offs/Synergies and Their Influencing Factors in the Yangtze River Delta Region, China. Land 2022, 11, 106. [Google Scholar] [CrossRef]
  32. Zhang, R.; Zhang, Q.; Zhang, L.; Zhong, Q. Impact of spatial structure on the functional connectivity of urban ecological corridors based on quantitative analysis. Urban For. Urban Green. 2023, 89, 128121. [Google Scholar] [CrossRef]
  33. Fan, X.; Gu, X.; Yu, H.; Long, A.; Tiando, D.S.; Ou, S.; Li, J.; Rong, Y.; Tang, G.; Zheng, Y.; et al. The Spatial and Temporal Evolution and Drivers of Habitat Quality in the Hung River Valley. Land 2021, 10, 1369. [Google Scholar] [CrossRef]
  34. Xie, Q.; Yue, Y.; Sun, Q.; Chen, S.; Lee, S.-B.; Kim, S.W. Assessment of Ecosystem Service Values of Urban Parks in Improving Air Quality: A Case Study of Wuhan, China. Sustainability 2019, 11, 6519. [Google Scholar] [CrossRef]
  35. Peng, J.; Shen, H.; Wu, W.; Liu, Y.; Wang, Y. Net primary productivity (NPP) dynamics and associated urbanization driving forces in metropolitan areas: A case study in Beijing City, China. Landsc. Ecol. 2016, 31, 1077–1092. [Google Scholar] [CrossRef]
  36. Xu, F.; Wang, X.; Li, L. NPP and Vegetation Carbon Sink Capacity Estimation of Urban Green Space Using the Optimized CASA Model: A Case Study of Five Chinese Cities. Atmosphere 2023, 14, 1161. [Google Scholar] [CrossRef]
  37. Zhao, G.; Tian, P.; Mu, X.; Jiao, J.; Wang, F.; Gao, P. Quantifying the impact of climate variability and human activities on streamflow in the middle reaches of the Yellow River basin, China. J. Hydrol. 2014, 519, 387–398. [Google Scholar] [CrossRef]
  38. Dennis, M.; Beesley, L.; Hardman, M.; James, P. Ecosystem (Dis)benefits Arising from Formal and Informal Land-Use in Manchester (UK); A Case Study of Urban Soil Characteristics Associated with Local Green Space Management. Agronomy 2020, 10, 552. [Google Scholar] [CrossRef]
Figure 1. Topography and land use of the study area (2000 and 2020).
Forests 15 01420 g001
Figure 2. XGBoost model prediction accuracy and error.
Forests 15 01420 g002
Figure 3. Sankey diagram of land use transfer in the study area.
Forests 15 01420 g003
Figure 4. Spatial distribution map of ecosystem services in the study area from 2000 to 2020.
Forests 15 01420 g004
Figure 5. Trade-off synergies and trends in ecosystem services in the study area between 2000 and 2020.
Forests 15 01420 g005
Figure 6. Bivariate spatial autocorrelation diagram of ecosystem services in the study area from 2000 to 2020.
Forests 15 01420 g006
Figure 7. Average SHAP values and factor importance rankings in the study area shape the habitat pattern. The main influencing factors of NPP were the NDVI, sunshine duration, rainfall, proportion of forested land, and slope. The SHAP value of the NDVI was the highest (0.05), which indicated that the vegetation cover and health were the key factors determining the NPP, and emphasizing the direct influence of vegetation on the productivity of ecosystems. Sunshine duration (SHAP value of 0.02) and rainfall (SHAP value of 0.01) indicated the direct influence of climatic factors on vegetation growth and ecological productivity. The main factors affecting soil retention were slope, rainfall, the NDVI, percentage of forested land, and temperature (Tem). Slope, with a SHAP value of 0.03, was the most important topographic factor affecting soil retention, pointing to the potential risk of steep topography to soil erosion. Rainfall had a SHAP value of 0.02, emphasizing the dual role of precipitation in soil erosion and conservation. Water yield was influenced by rainfall, humidity (Hum), agricultural land share, sunshine hours, and elevation. Rainfall had the highest SHAP value (0.09), showing the dominance of rainfall in determining regional water availability. The SHAP values of 0.01 for both humidity and elevation further illustrated the influence of climatic and topographic conditions on the water resource distribution.
Forests 15 01420 g007aForests 15 01420 g007b
Figure 8. Interactions between key variables and ecosystem services.
Forests 15 01420 g008
Table 1. Land use transfer matrix, 2000–2020 (ha).
Year
2000
2020
Arable LandWoodlandGrasslandBody of WaterBuilding SiteUnused Land
arable land1,241,494.5669,164.2857,641.856108.2133,273436.05
woodland80,969.673,676,651.56119,562.3910,125.4510,716.21155.43
grassland65,962.71104,375.071,603,5035095.1711,563.1177.85
body of water3441.061422.811163.729,592.09546.6632.22
building site5319.72997.11665.1630.1834,380.3681.18
unused land1944.721706.586975.7286.9415.486904.35
Disclaimer/Publisher’s Note: The statements, opinions and data contained in all publications are solely those of the individual author(s) and contributor(s) and not of MDPI and/or the editor(s). MDPI and/or the editor(s) disclaim responsibility for any injury to people or property resulting from any ideas, methods, instructions or products referred to in the content.

