

Quantitative Analysis of Vegetation Dynamics and Driving Factors in the Shendong Mining Area under the Background of Coal Mining
Abstract
1. Introduction
2. Materials and Methods
2.1. Study Area
2.2. Data Source and Preprocessing
2.2.1. kNDVI Datasets
2.2.2. Driving Factor Datasets
2.3. Methods
2.3.1. Variation Trends Analysis
2.3.2. Future Vegetation Dynamics Trend Analysis
2.3.3. Relationships between Vegetation and Influencing Factors
3. Results
3.1. Spatiotemporal Dynamics and Vegetation Distribution Pattern
3.1.1. Temporal Variation in Vegetation Dynamics
3.1.2. Spatial Pattern of Vegetation Dynamics
3.2. Future Trends in Vegetation Dynamics
3.3. Characteristics of Climate Change and Its Partial Correlation with Vegetation Dynamics
3.3.1. Characteristics of Climate Change
3.3.2. Partial Correlation between Vegetation Dynamics and Climate Factors
3.4. Contributions of Climate Change and Human Activities to Vegetation Dynamics
3.4.1. Quantifying the Effects of Climate Change on Vegetation Dynamics
3.4.2. The Contribution of Human Activities to Vegetation Dynamics
4. Discussion
4.1. Temporal and Spatial Characteristics of Vegetation Dynamics
4.2. Effects of Climate on Vegetation Dynamics Change
4.3. Effects of Human Activities on Vegetation Dynamics Change
4.4. Limitations and Prospects
5. Conclusions
- (1)
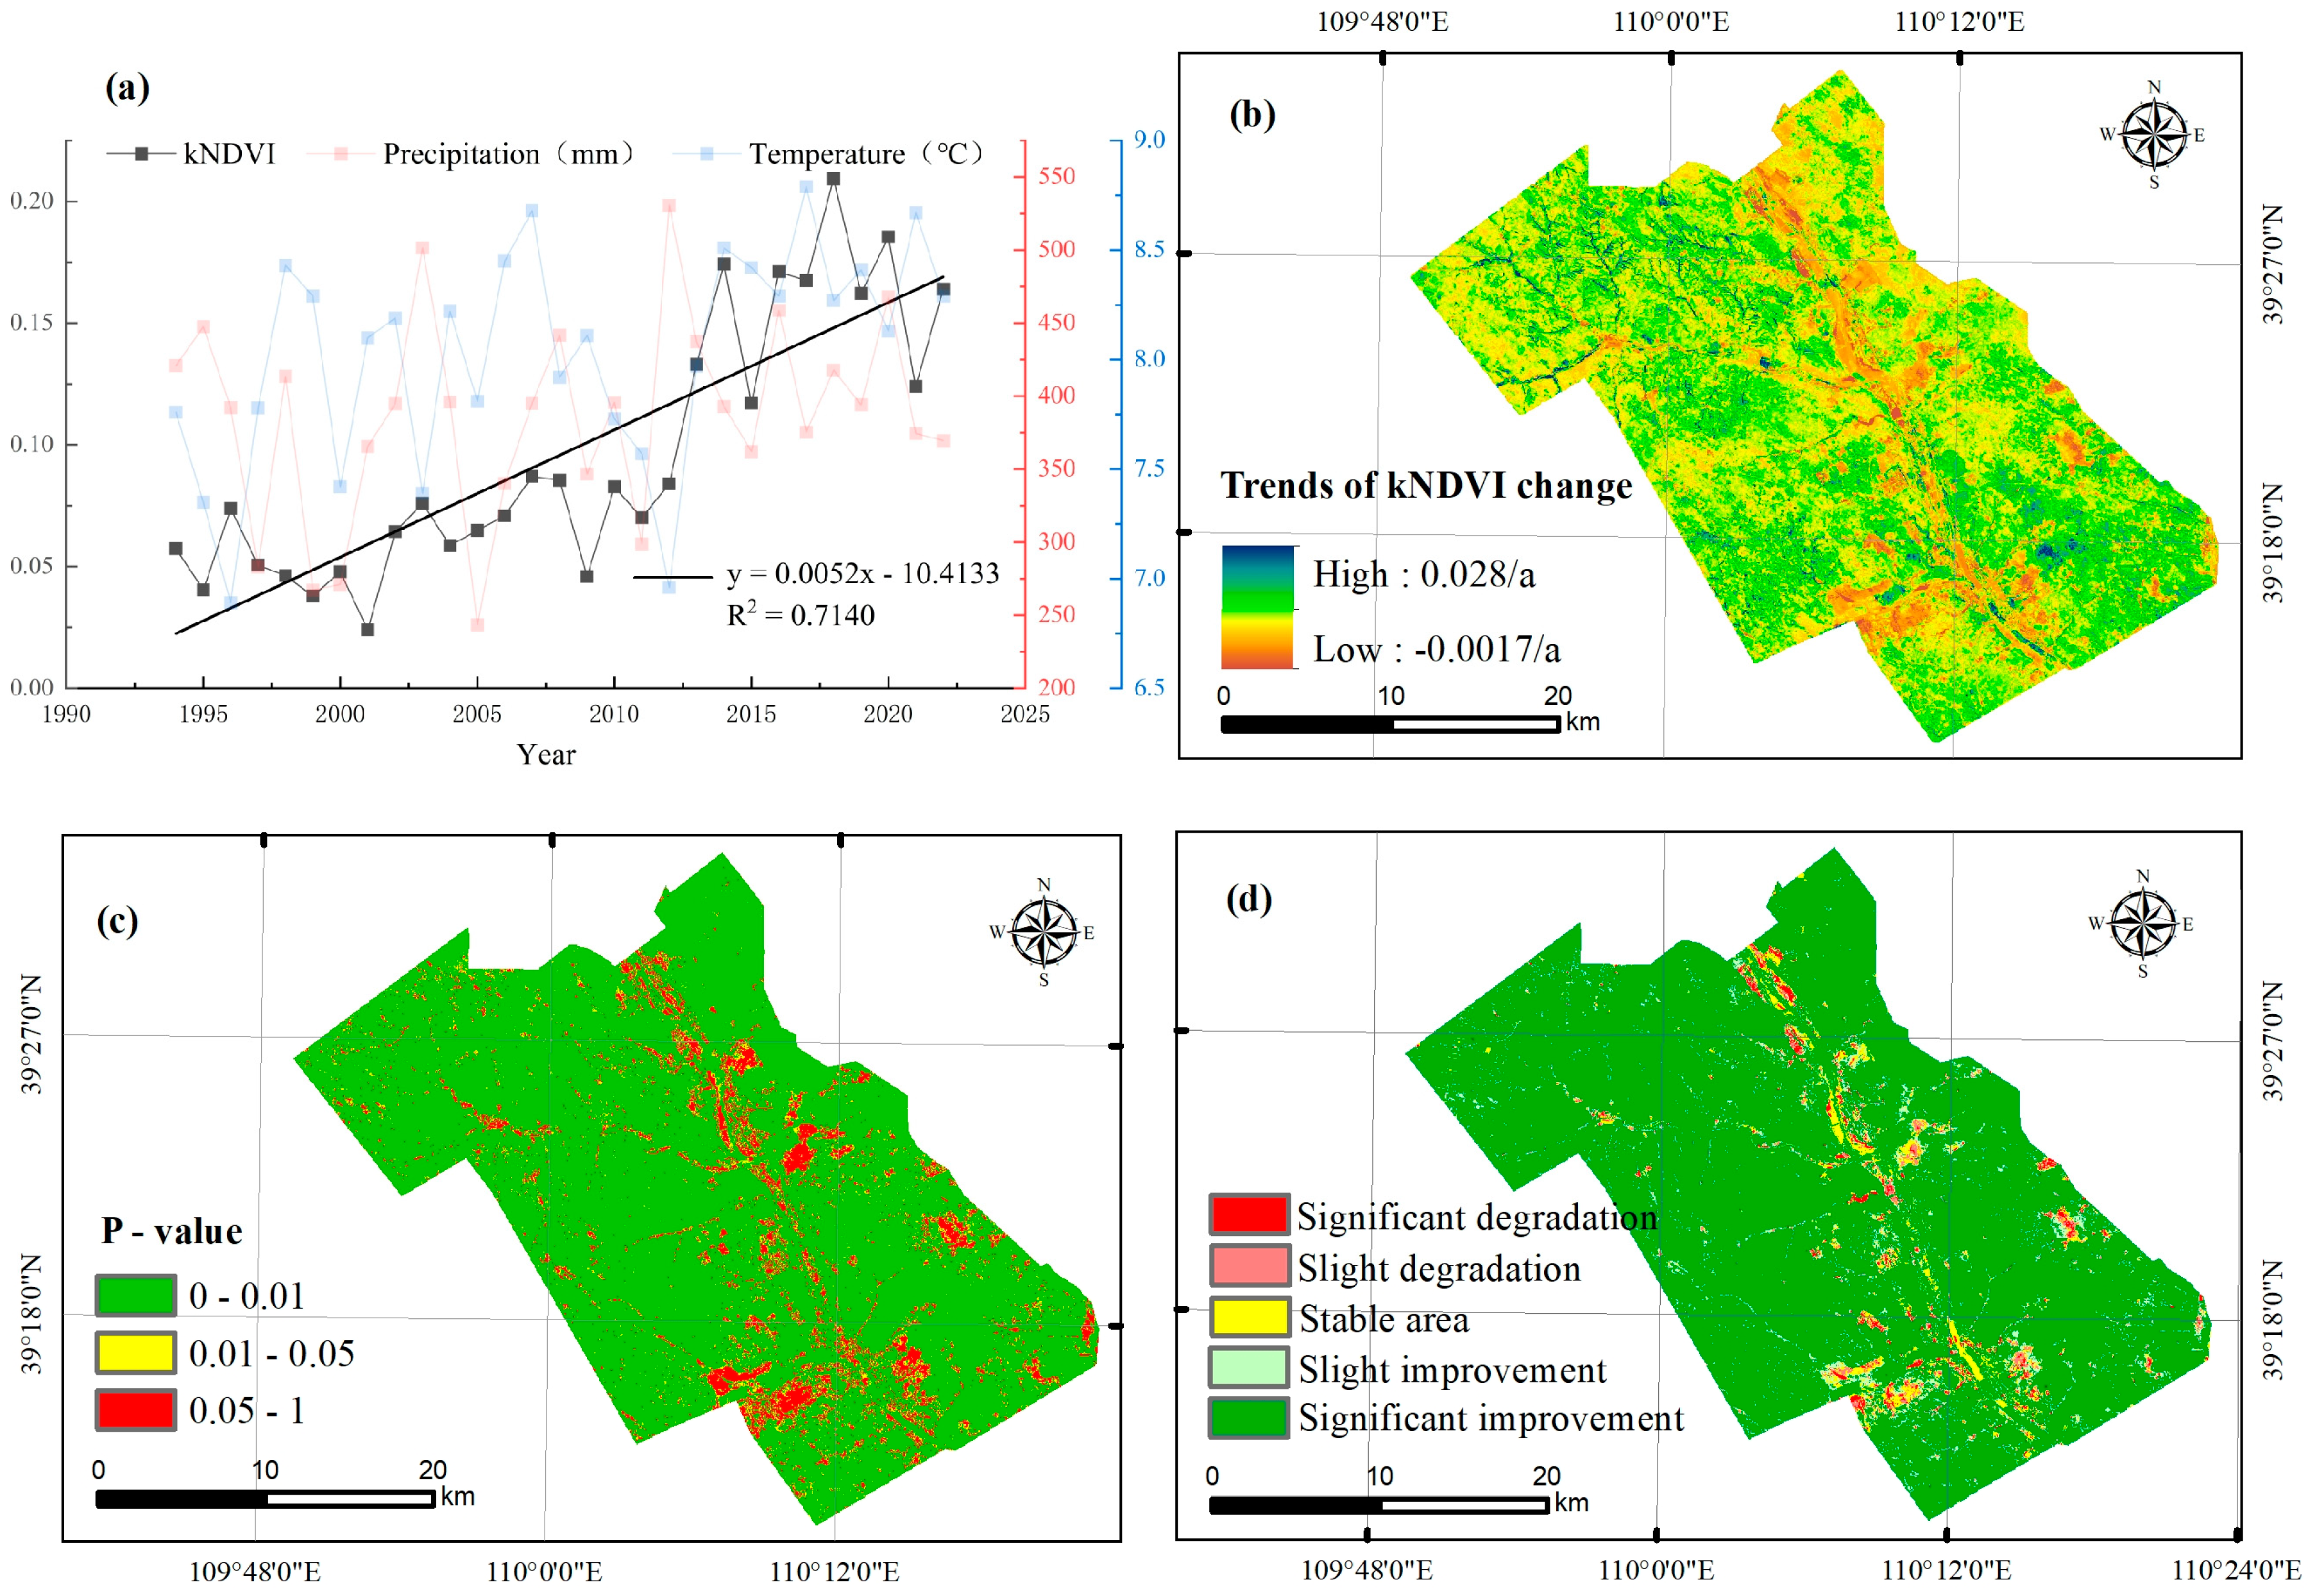
- kNDVI showed a fluctuating upward trend in the last 29 years, with an increase rate of 0.0052/a. With the contribution of the ecological restoration project, vegetation kNDVI in mining areas showed a significant increasing trend in the whole region. However, according to the Hurst index analysis, the development trend of sustainable growth ability of vegetation will not continue to increase, and the spatial distribution shows that 40.02% of the area will show a downward trend in the future.
- (2)
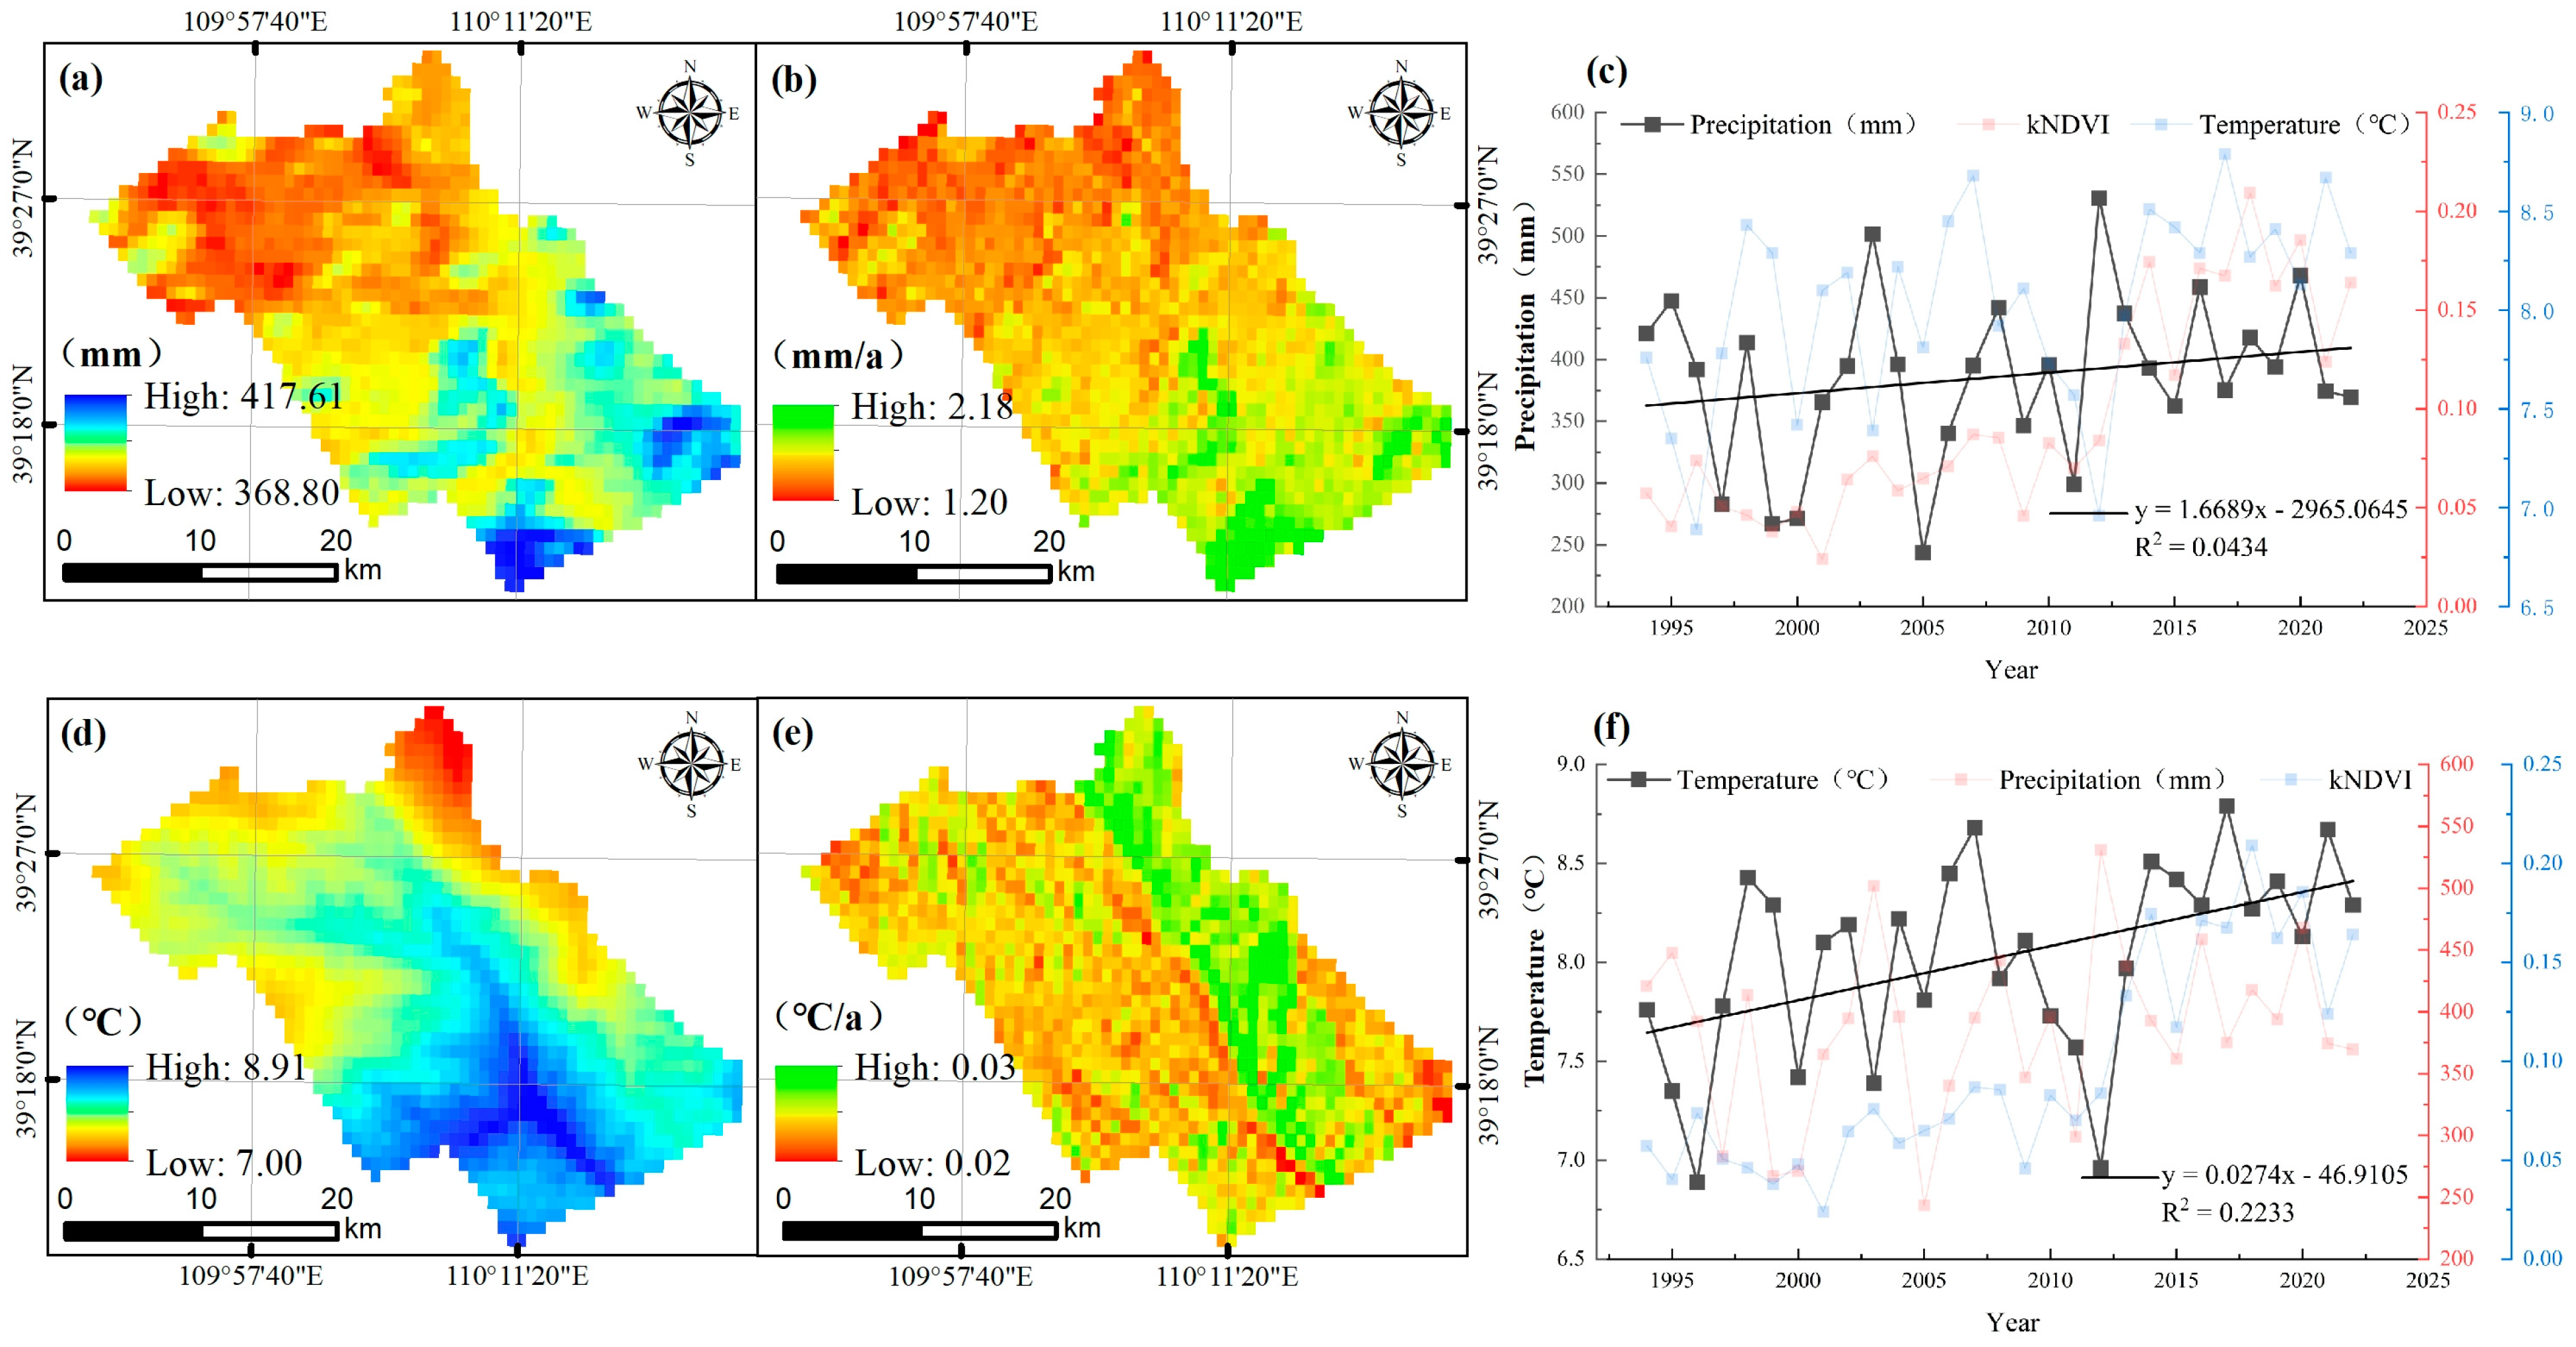
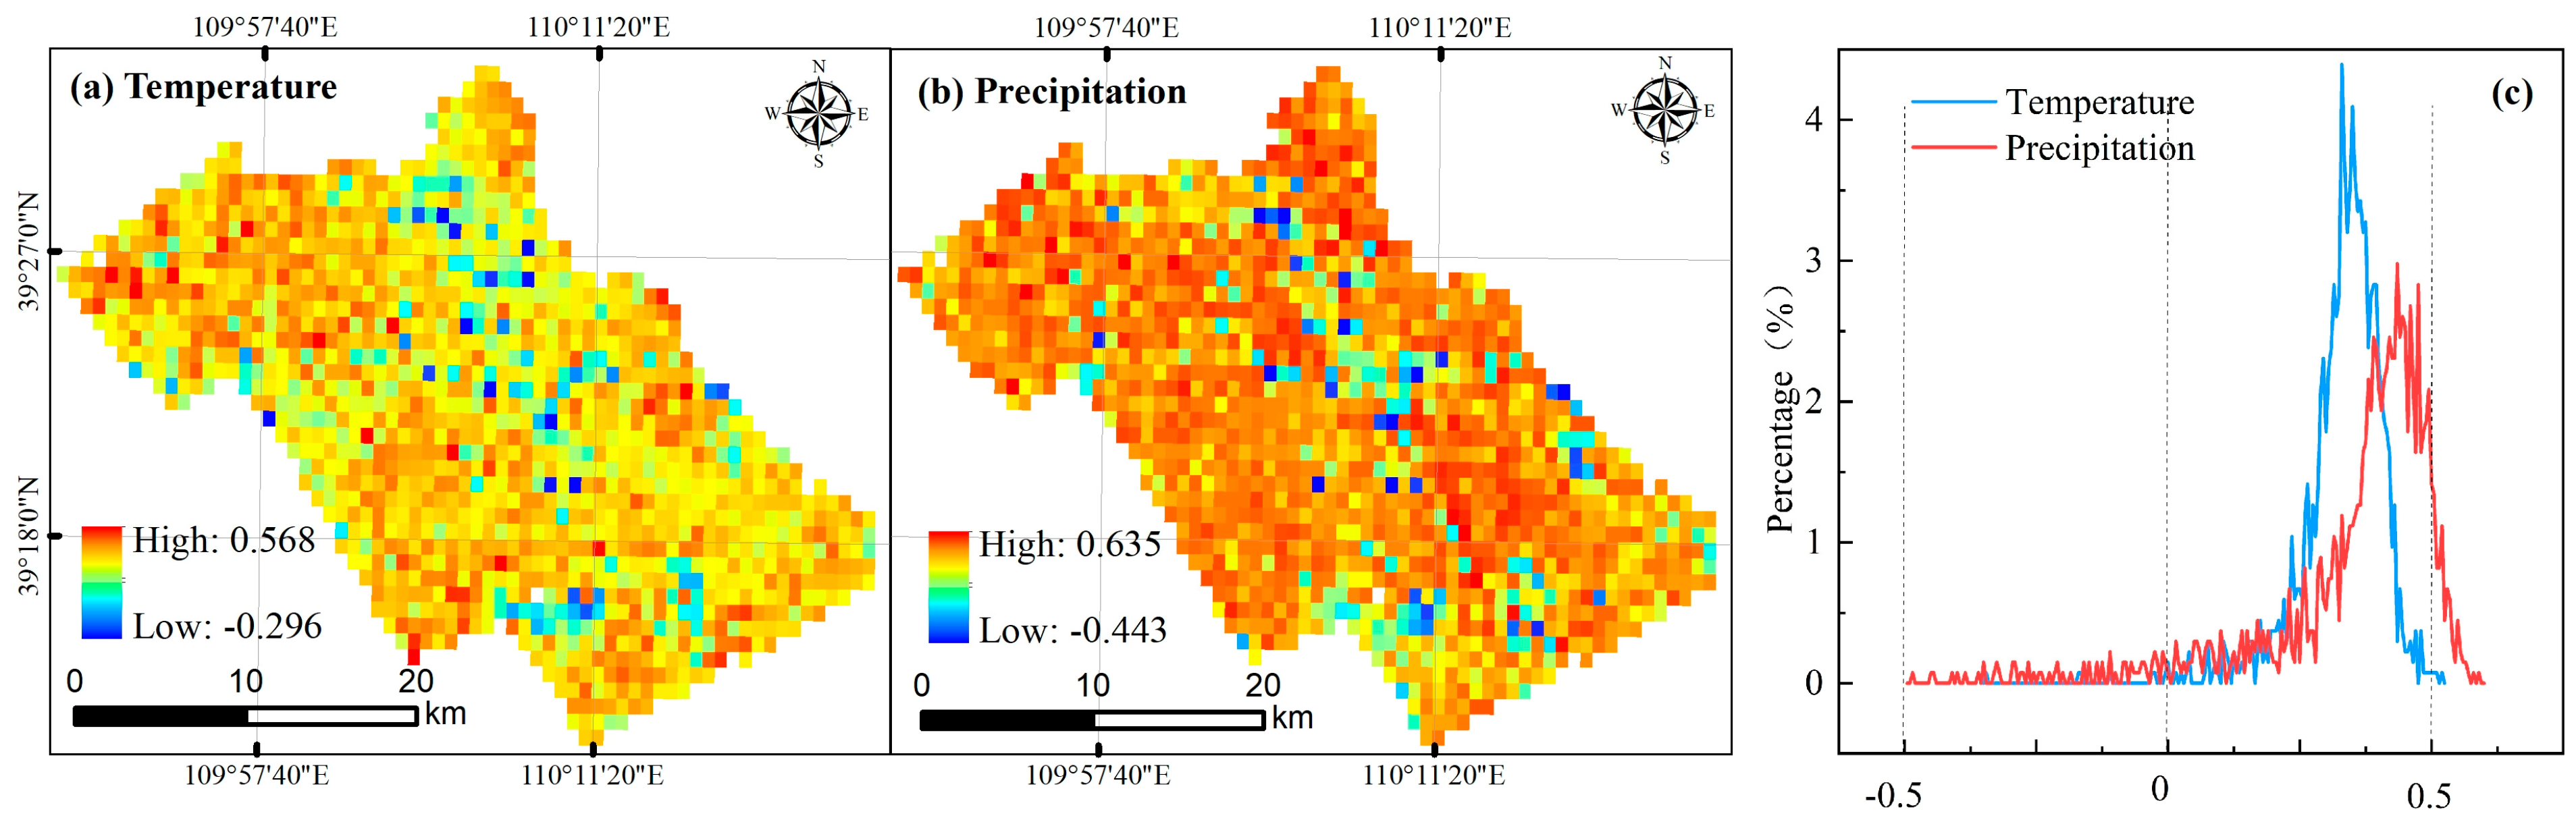
- Precipitation and temperature are the key climatic factors that affect vegetation growth. The partial correlation coefficients between kNDVI and precipitation, and temperature in 29 years were 0.377, and 0.398, respectively. Compared with temperature, precipitation has a greater positive effect on kNDVI.
- (3)
- The results of attribution analysis show that climate change and human activities have dual effects on vegetation change, but the positive effects are dominant overall. In addition, compared with climate (30.77%), human activities (69.23%) were the main driving factors affecting vegetation change in the Shendong mining area. In arid and semi-arid areas, human activities (ecological restoration projects) have promoted the restoration of vegetation in mining areas, and afforestation has made outstanding contributions to the greening of mining areas.
Author Contributions
Funding
Data Availability Statement
Acknowledgments
Conflicts of Interest
References
- Clark, E.V.; Zipper, C.E. Vegetation influences near-surface hydrological characteristics on a surface coal mine in eastern USA. Catena 2016, 139, 241–249. [Google Scholar] [CrossRef]
- McHugh, L. World Energy Needs: A Role for Coal in the Energy Mix. In Coal in the 21st Century: Energy Needs, Chemicals and Environmental Controls; Hester, R.E., Harrison, R.M., Eds.; The Royal Society of Chemistry: London, UK, 2017. [Google Scholar]
- Cui, X.; Peng, S.; Lines, L.R.; Zhu, G.; Hu, Z.; Cui, F. Understanding the Capability of an Ecosystem Nature-Restoration in Coal Mined Area. Sci. Rep. 2019, 9, 19690. [Google Scholar] [CrossRef] [PubMed]
- Wang, D.; Wan, K.; Yang, J. Measurement and evolution of eco-efficiency of coal industry ecosystem in China. J. Clean. Prod. 2019, 209, 803–818. [Google Scholar] [CrossRef]
- Maus, V.; Giljum, S.; da Silva, D.M.; Gutschlhofer, J.; da Rosa, R.P.; Luckeneder, S.; Gass, S.L.B.; Lieber, M.; McCallum, I. An update on global mining land use. Sci. Data 2022, 9, 433. [Google Scholar] [CrossRef] [PubMed]
- Feng, H.; Zhou, J.; Zhou, A.; Bai, G.; Li, Z.; Chen, H.; Su, D.; Han, X. Grassland ecological restoration based on the relationship between vegetation and its below-ground habitat analysis in steppe coal mine area. Sci. Total Environ. 2021, 778, 146221. [Google Scholar] [CrossRef] [PubMed]
- Zhang, G.; Gao, Y.; Li, J.; Su, B.; Chen, Z.; Lin, W. China’s environmental policy intensity for 1978–2019. Sci. Data 2022, 9, 75. [Google Scholar] [CrossRef] [PubMed]
- Higgins, S.I.; Conradi, T.; Muhoko, E. Shifts in vegetation activity of terrestrial ecosystems attributable to climate trends. Nat. Geosci. 2023, 16, 147–153. [Google Scholar] [CrossRef]
- Chen, J.; Shao, Z.; Deng, X.; Huang, X.; Dang, C. Vegetation as the catalyst for water circulation on global terrestrial ecosystem. Sci. Total Environ. 2023, 895, 165071. [Google Scholar] [CrossRef]
- Cai, Y.; Zhang, F.; Duan, P.; Yung Jim, C.; Weng Chan, N.; Shi, J.; Liu, C.; Wang, J.; Bahtebay, J.; Ma, X. Vegetation cover changes in China induced by ecological restoration-protection projects and land-use changes from 2000 to 2020. Catena 2022, 217, 106530. [Google Scholar] [CrossRef]
- Lü, L.; Zhao, Y.; Chu, L.; Wang, Y.; Zhou, Q. Grassland coverage change and its humanity effect factors quantitative assessment in Zhejiang province, China, 1980–2018. Sci. Rep. 2022, 12, 18288. [Google Scholar] [CrossRef]
- Zhang, X.; Li, X. An innovative index for separating the effects of temperature and precipitation on global vegetation change. iScience 2023, 26, 106972. [Google Scholar] [CrossRef] [PubMed]
- Ghebrezgabher, M.G.; Yang, T.; Yang, X.; Eyassu Sereke, T. Assessment of NDVI variations in responses to climate change in the Horn of Africa. Egypt. J. Remote Sens. Space Sci. 2020, 23, 249–261. [Google Scholar] [CrossRef]
- Enebish, B.; Dashkhuu, D.; Renchin, M.; Russell, M.; Singh, P. Impact of Climate on the NDVI of Northern Mongolia. J. Indian Soc. Remote Sens. 2020, 48, 333–340. [Google Scholar] [CrossRef]
- Jiang, H.; Xu, X.; Guan, M.; Wang, L.; Huang, Y.; Jiang, Y. Determining the contributions of climate change and human activities to vegetation dynamics in agro-pastural transitional zone of northern China from 2000 to 2015. Sci. Total Environ. 2020, 718, 134871. [Google Scholar] [CrossRef] [PubMed]
- Sun, Y.; Yang, Y.; Zhang, Y.; Wang, Z. Assessing vegetation dynamics and their relationships with climatic variability in northern China. Phys. Chem. Earth Parts A/B/C 2015, 87–88, 79–86. [Google Scholar] [CrossRef]
- Song, Y.; Ma, M. A statistical analysis of the relationship between climatic factors and the Normalized Difference Vegetation Index in China. Int. J. Remote Sens. 2011, 32, 3947–3965. [Google Scholar] [CrossRef]
- Kun, Y.; Chuanmin, H. Changes in vegetative coverage of the Hongze Lake national wetland nature reserve: A decade-long assessment using MODIS medium-resolution data. J. Appl. Remote Sens. 2013, 7, 073589. [Google Scholar] [CrossRef]
- Jia, L.; Li, Z.; Xu, G.; Ren, Z.; Li, P.; Cheng, Y.; Zhang, Y.; Wang, B.; Zhang, J.; Yu, S. Dynamic change of vegetation and its response to climate and topographic factors in the Xijiang River basin, China. Environ. Sci. Pollut. Res. 2020, 27, 11637–11648. [Google Scholar] [CrossRef]
- Xiao, Y.; Xiao, Q.; Zhang, J. Balancing the international benefits and risks associated with implementation of ecological policy on the Qinghai-Tibet Plateau, China. Gondwana Res. 2023, 115, 183–190. [Google Scholar] [CrossRef]
- Dai, L.; Fu, R.; Guo, X.; Ke, X.; Du, Y.; Zhang, F.; Cao, G. Effect of grazing management strategies on alpine grassland on the northeastern Qinghai-Tibet Plateau. Ecol. Eng. 2021, 173, 106418. [Google Scholar] [CrossRef]
- Qu, S.; Wang, L.; Lin, A.; Yu, D.; Yuan, M.; Li, C.a. Distinguishing the impacts of climate change and anthropogenic factors on vegetation dynamics in the Yangtze River Basin, China. Ecol. Indic. 2020, 108, 105724. [Google Scholar] [CrossRef]
- Chen, T.; Tang, G.; Yuan, Y.; Guo, H.; Xu, Z.; Jiang, G.; Chen, X. Unraveling the relative impacts of climate change and human activities on grassland productivity in Central Asia over last three decades. Sci. Total Environ. 2020, 743, 140649. [Google Scholar] [CrossRef] [PubMed]
- Hao, C.; Sun, X.; Xie, B.; Hou, S. Increase in fluoride concentration in mine water in Shendong mining area, Northwest China: Insights from isotopic and geochemical signatures. Ecotoxicol. Environ. Saf. 2022, 236, 113496. [Google Scholar] [CrossRef] [PubMed]
- Chen, Z.; Zhang, X.; Jiao, Y.; Cheng, Y.; Zhu, Z.; Wang, S.; Zhang, H. Investigating the spatio-temporal pattern evolution characteristics of vegetation change in Shendong coal mining area based on kNDVI and intensity analysis. Front. Ecol. Evol. 2023, 11, 1344664. [Google Scholar] [CrossRef]
- Yang, X.; Yao, W.; Li, P.; Hu, J.; Latifi, H.; Kang, L.; Wang, N.; Zhang, D. Changes of SOC Content in China’s Shendong Coal Mining Area during 1990–2020 Investigated Using Remote Sensing Techniques. Sustainability 2022, 14, 7374. [Google Scholar] [CrossRef]
- Xu, J.; Zhu, W.; Xu, J.; Wu, J.; Li, Y. High-intensity longwall mining-induced ground subsidence in Shendong coalfield, China. Int. J. Rock Mech. Min. Sci. 2021, 141, 104730. [Google Scholar] [CrossRef]
- Dou, Y.; Tong, X.; Horion, S.; Feng, L.; Fensholt, R.; Shao, Q.; Tian, F. The success of ecological engineering projects on vegetation restoration in China strongly depends on climatic conditions. Sci. Total Environ. 2024, 915, 170041. [Google Scholar] [CrossRef] [PubMed]
- Almalki, R.; Khaki, M.; Saco, P.M.; Rodriguez, J.F. Monitoring and Mapping Vegetation Cover Changes in Arid and Semi-Arid Areas Using Remote Sensing Technology: A Review. Remote Sens. 2022, 14, 5143. [Google Scholar] [CrossRef]
- Li, L.; Xin, X.; Zhao, J.; Yang, A.; Wu, S.; Zhang, H.; Yu, S. Remote Sensing Monitoring and Assessment of Global Vegetation Status and Changes during 2016–2020. Sensors 2023, 23, 8452. [Google Scholar] [CrossRef]
- Huang, C.; Yang, Q.; Guo, Y.; Zhang, Y.; Guo, L. The pattern, change and driven factors of vegetation cover in the Qin Mountains region. Sci. Rep. 2020, 10, 20591. [Google Scholar] [CrossRef]
- Jiang, L.; Liu, Y.; Wu, S.; Yang, C. Analyzing ecological environment change and associated driving factors in China based on NDVI time series data. Ecol. Indic. 2021, 129, 107933. [Google Scholar] [CrossRef]
- Martinez, A.d.l.I.; Labib, S.M. Demystifying normalized difference vegetation index (NDVI) for greenness exposure assessments and policy interventions in urban greening. Environ. Res. 2023, 220, 115155. [Google Scholar] [CrossRef] [PubMed]
- Liu, H.Q.; Huete, A. A feedback based modification of the NDVI to minimize canopy background and atmospheric noise. IEEE Trans. Geosci. Remote Sens. 1995, 33, 457–465. [Google Scholar] [CrossRef]
- Aklilu Tesfaye, A.; Gessesse Awoke, B. Evaluation of the saturation property of vegetation indices derived from sentinel-2 in mixed crop-forest ecosystem. Spat. Inf. Res. 2021, 29, 109–121. [Google Scholar] [CrossRef]
- Huang, S.; Tang, L.; Hupy, J.P.; Wang, Y.; Shao, G. A commentary review on the use of normalized difference vegetation index (NDVI) in the era of popular remote sensing. J. For. Res. 2021, 32, 1–6. [Google Scholar] [CrossRef]
- Camps-Valls, G.; Campos-Taberner, M.; Moreno-Martínez, Á.; Walther, S.; Duveiller, G.; Cescatti, A.; Mahecha, M.D.; Muñoz-Marí, J.; García-Haro, F.J.; Guanter, L.; et al. A unified vegetation index for quantifying the terrestrial biosphere. Sci. Adv. 2021, 7, eabc7447. [Google Scholar] [CrossRef] [PubMed]
- Pan, T.; Zou, X.; Liu, Y.; Wu, S.; He, G. Contributions of climatic and non-climatic drivers to grassland variations on the Tibetan Plateau. Ecol. Eng. 2017, 108, 307–317. [Google Scholar] [CrossRef]
- Yang, H.; Yang, D. Climatic factors influencing changing pan evaporation across China from 1961 to 2001. J. Hydrol. 2012, 414–415, 184–193. [Google Scholar] [CrossRef]
- Zhu, L.; Sun, S.; Li, Y.; Liu, X.; Hu, K. Effects of climate change and anthropogenic activity on the vegetation greening in the Liaohe River Basin of northeastern China. Ecol. Indic. 2023, 148, 110105. [Google Scholar] [CrossRef]
- Li, Y.; Li, Z.; Zhang, X.; Gui, J.; Xue, J. Vegetation variations and its driving factors in the transition zone between Tibetan Plateau and arid region. Ecol. Indic. 2022, 141, 109101. [Google Scholar] [CrossRef]
- Yang, L.-s.; Feng, Q.; Zhu, M.; Wang, L.; Reza Alizadeh, M.; Adamowski, J.F.; Wen, X.; Yin, Z. Variation in actual evapotranspiration and its ties to climate change and vegetation dynamics in northwest China. J. Hydrol. 2022, 607, 127533. [Google Scholar] [CrossRef]
- Yuan, X.; Guo, B.; Lu, M. The Responses of Vegetation NPP Dynamics to the Influences of Climate–Human Factors on Qinghai–Tibet Plateau from 2000 to 2020. Remote Sens. 2023, 15, 2419. [Google Scholar] [CrossRef]
- Liu, Y.; Liu, H.; Chen, Y.; Gang, C.; Shen, Y. Quantifying the contributions of climate change and human activities to vegetation dynamic in China based on multiple indices. Sci. Total Environ. 2022, 838, 156553. [Google Scholar] [CrossRef] [PubMed]
- Jiang, Y.; Guo, J.; Peng, Q.; Guan, Y.; Zhang, Y.; Zhang, R. The effects of climate factors and human activities on net primary productivity in Xinjiang. Int. J. Biometeorol. 2020, 64, 765–777. [Google Scholar] [CrossRef] [PubMed]
- Chang, J.; Liu, Q.; Wang, S.; Huang, C. Vegetation Dynamics and Their Influencing Factors in China from 1998 to 2019. Remote Sens. 2022, 14, 3390. [Google Scholar] [CrossRef]
- Cao, W.; Wu, D.; Huang, L.; Pan, M.; Huhe, T. Determinizing the contributions of human activities and climate change on greening in the Beijing–Tianjin–Hebei Region, China. Sci. Rep. 2021, 11, 21201. [Google Scholar] [CrossRef] [PubMed]
- Xiao, W.; Zhang, W.; Ye, Y.; Lv, X.; Yang, W. Is underground coal mining causing land degradation and significantly damaging ecosystems in semi-arid areas? A study from an Ecological Capital perspective. Land Degrad. Dev. 2020, 31, 1969–1989. [Google Scholar] [CrossRef]
- Chen, L.; Zhang, H.; Zhang, X.; Liu, P.; Zhang, W.; Ma, X. Vegetation changes in coal mining areas: Naturally or anthropogenically Driven? Catena 2022, 208, 105712. [Google Scholar] [CrossRef]
- Zheng, H.; Miao, C.; Li, X.; Kong, D.; Gou, J.; Wu, J.; Zhang, S. Effects of Vegetation Changes and Multiple Environmental Factors on Evapotranspiration Across China Over the Past 34 Years. Earth’s Future 2022, 10, e2021EF002564. [Google Scholar] [CrossRef]
- Wang, Q.; Moreno-Martínez, Á.; Muñoz-Marí, J.; Campos-Taberner, M.; Camps-Valls, G. Estimation of vegetation traits with kernel NDVI. ISPRS J. Photogramm. Remote Sens. 2023, 195, 408–417. [Google Scholar] [CrossRef]
- Shouzhang, P. 1-km Monthly Precipitation Dataset for China (1901–2021); National Tibetan Plateau Data Center: Beijing, China, 2020. [Google Scholar] [CrossRef]
- Jiang, L.; Guli, ·J.; Bao, A.; Guo, H.; Ndayisaba, F. Vegetation dynamics and responses to climate change and human activities in Central Asia. Sci. Total Environ. 2017, 599–600, 967–980. [Google Scholar] [CrossRef] [PubMed]
- He, P.; Xu, L.; Liu, Z.; Jing, Y.; Zhu, W. Dynamics of NDVI and its influencing factors in the Chinese Loess Plateau during 2002–2018. Reg. Sustain. 2021, 2, 36–46. [Google Scholar] [CrossRef]
- Sioris, C.E.; Zou, J.; McElroy, C.T.; Boone, C.D.; Sheese, P.E.; Bernath, P.F. Water vapour variability in the high-latitude upper troposphere—Part 2: Impact of volcanic eruptions. Atmos. Chem. Phys. 2016, 16, 2207–2219. [Google Scholar] [CrossRef]
- Zhu, Y.; Zhang, S.; Luo, P.; Su, F.; Sun, B.; Liang, L.e.; Guo, J.; Yang, R. Assessing ecohydrological factors variations and their relationships at different spatio-temporal scales in semiarid area, northwestern China. Adv. Space Res. 2021, 67, 2368–2381. [Google Scholar] [CrossRef]
- Zhang, Y.; Zhang, C.; Wang, Z.; Chen, Y.; Gang, C.; An, R.; Li, J. Vegetation dynamics and its driving forces from climate change and human activities in the Three-River Source Region, China from 1982 to 2012. Sci. Total Environ. 2016, 563–564, 210–220. [Google Scholar] [CrossRef] [PubMed]
- Qi, Z.; Cui, C.; Jiang, Y.; Chen, Y.; Ju, J.; Guo, N. Changes in the spatial and temporal characteristics of China’s arid region in the background of ENSO. Sci. Rep. 2022, 12, 17826. [Google Scholar] [CrossRef] [PubMed]
- Perotti, E.; Huguenin-Elie, O.; Meisser, M.; Dubois, S.; Probo, M.; Mariotte, P. Climatic, soil, and vegetation drivers of forage yield and quality differ across the first three growth cycles of intensively managed permanent grasslands. Eur. J. Agron. 2021, 122, 126194. [Google Scholar] [CrossRef]
- Wu, Q.; Xu, H.; Yang, Y.; Hou, H.; Mi, J.; Wang, X.; Pei, Y.; Zhang, S. Identifying structure change of vegetation under long-term disturbance in the Shendong mining area. Environ. Earth Sci. 2023, 82, 450. [Google Scholar] [CrossRef]
- Chen, C.; Park, T.; Wang, X.; Piao, S.; Xu, B.; Chaturvedi, R.K.; Fuchs, R.; Brovkin, V.; Ciais, P.; Fensholt, R.; et al. China and India lead in greening of the world through land-use management. Nat. Sustain. 2019, 2, 122–129. [Google Scholar] [CrossRef]
- Guo, Q. Slow recovery in desert perennial vegetation following prolonged human disturbance. J. Veg. Sci. 2004, 15, 757–762. [Google Scholar] [CrossRef]
- Chen, K.H. Research of mining wasteland reclamation and regeneration modes in Shendong Mining Region. IOP Conf. Ser. Earth Environ. Sci. 2018, 185, 012027. [Google Scholar] [CrossRef]
- Zhu, L.; Meng, J.; Zhu, L. Applying Geodetector to disentangle the contributions of natural and anthropogenic factors to NDVI variations in the middle reaches of the Heihe River Basin. Ecol. Indic. 2020, 117, 106545. [Google Scholar] [CrossRef]
- Zhu, Y.; Zhang, Y.; Zheng, Z.; Liu, Y.; Wang, Z.; Cong, N.; Zu, J.; Tang, Z.; Zhao, G.; Gao, J.; et al. Converted vegetation type regulates the vegetation greening effects on land surface albedo in arid regions of China. Agric. For. Meteorol. 2022, 324, 109119. [Google Scholar] [CrossRef]
- Liu, L.; Gou, X.; Wang, X.; Yang, M.; Qie, L.; Pang, G.; Wei, S.; Zhang, F.; Li, Y.; Wang, Q.; et al. Relationship between extreme climate and vegetation in arid and semi-arid mountains in China: A case study of the Qilian Mountains. Agric. For. Meteorol. 2024, 348, 109938. [Google Scholar] [CrossRef]
- Yin, Y.; Deng, H.; Ma, D. Complex effects of moisture conditions and temperature enhanced vegetation growth in the Arid/humid transition zone in Northern China. Sci. Total Environ. 2022, 805, 150152. [Google Scholar] [CrossRef] [PubMed]
- Mu, Y.; Jia, X.; Ye, Z.; Guo, X.; Hao, S.; Zha, T.; Zhang, Y.; Han, C.; Gao, S.; Xing, F.; et al. Vegetation factors and atmospheric dryness regulate the dynamics of ecosystem water use efficiency in a temperate semiarid shrubland. J. Hydrol. 2024, 639, 131644. [Google Scholar] [CrossRef]
- Ren, H.; Wen, Z.; Liu, Y.; Lin, Z.; Han, P.; Shi, H.; Wang, Z.; Su, T. Vegetation response to changes in climate across different climate zones in China. Ecol. Indic. 2023, 155, 110932. [Google Scholar] [CrossRef]
- Xu, H.-j.; Wang, X.-p.; Zhao, C.-y. Drought sensitivity of vegetation photosynthesis along the aridity gradient in northern China. Int. J. Appl. Earth Obs. Geoinf. 2021, 102, 102418. [Google Scholar] [CrossRef]
- Duan, G.; Zhou, R.; Wang, L.; Zheng, C.; Liu, Y.; Chai, X.; Zhou, C.; Wen, Z. Effects of different soil and water conservation measures on plant diversity and productivity in Loess Plateau. J. Environ. Manag. 2023, 348, 119330. [Google Scholar] [CrossRef]
- Chen, Y.; Liu, X.; Ma, Y.; He, J.; He, Y.; Zheng, C.; Gao, W.; Ma, C. Variability analysis and the conservation capacity of soil water storage under different vegetation types in arid regions. Catena 2023, 230, 107269. [Google Scholar] [CrossRef]
- Ke, J.; Zhou, D.; Hai, C.; Yu, Y.; Jun, H.; Li, B. Temporal and Spatial Variation of Vegetation in Net Primary Productivity of the Shendong Coal Mining Area, Inner Mongolia Autonomous Region. Sustainability 2022, 14, 10883. [Google Scholar] [CrossRef]
- Fan, F.; Xiao, C.; Feng, Z.; Yang, Y. Impact of human and climate factors on vegetation changes in mainland southeast asia and yunnan province of China. J. Clean. Prod. 2023, 415, 137690. [Google Scholar] [CrossRef]
- Wang, H.; Yan, S.; Liang, Z.; Jiao, K.; Li, D.; Wei, F.; Li, S. Strength of association between vegetation greenness and its drivers across China between 1982 and 2015: Regional differences and temporal variations. Ecol. Indic. 2021, 128, 107831. [Google Scholar] [CrossRef]
- Liu, T.; Yu, L.; Chen, X.; Wu, H.; Lin, H.; Li, C.; Hou, J. Environmental laws and ecological restoration projects enhancing ecosystem services in China: A meta-analysis. J. Environ. Manag. 2023, 327, 116810. [Google Scholar] [CrossRef] [PubMed]
- Zhou, Y.; Fu, D.; Lu, C.; Xu, X.; Tang, Q. Positive effects of ecological restoration policies on the vegetation dynamics in a typical ecologically vulnerable area of China. Ecol. Eng. 2021, 159, 106087. [Google Scholar] [CrossRef]
- Zhu, Z.; Piao, S.; Myneni, R.B.; Huang, M.; Zeng, Z.; Canadell, J.G.; Ciais, P.; Sitch, S.; Friedlingstein, P.; Arneth, A.; et al. Greening of the Earth and its drivers. Nat. Clim. Chang. 2016, 6, 791–795. [Google Scholar] [CrossRef]
- Xiu, L.; Yao, X.; Chen, M.; Yan, C. Effect of Ecological Construction Engineering on Vegetation Restoration: A Case Study of the Loess Plateau. Remote Sens. 2021, 13, 1407. [Google Scholar] [CrossRef]
- Hua, W.; Chen, H.; Zhou, L.; Xie, Z.; Qin, M.; Li, X.; Ma, H.; Huang, Q.; Sun, S. Observational Quantification of Climatic and Human Influences on Vegetation Greening in China. Remote Sens. 2017, 9, 425. [Google Scholar] [CrossRef]
- Zhou, W.; Gang, C.; Zhou, F.; Li, J.; Dong, X.; Zhao, C. Quantitative assessment of the individual contribution of climate and human factors to desertification in northwest China using net primary productivity as an indicator. Ecol. Indic. 2015, 48, 560–569. [Google Scholar] [CrossRef]
- Piao, S.; Yin, G.; Tan, J.; Cheng, L.; Huang, M.; Li, Y.; Liu, R.; Mao, J.; Myneni, R.B.; Peng, S.; et al. Detection and attribution of vegetation greening trend in China over the last 30 years. Glob. Chang. Biol. 2015, 21, 1601–1609. [Google Scholar] [CrossRef]


| Dataset | Type | Image Usability Analysis | Spatial Resolution/m | Time Resolution/Year | Data Source | |
|---|---|---|---|---|---|---|
| Image data | Landsat 5 T1 | Raster | 114 scenes | 30 | 1994–2011 | United States Geological Survey https://www.usgs.gov/ (accessed on 2 November 2023). |
| Landsat 7 T1 | Raster | 142 scenes | 30 | 1999–2022 | United States Geological Survey https://www.usgs.gov/ (accessed on 3 November 2023). | |
| Landsat 8 T1 | Raster | 91 scenes | 30 | 2013–2022 | United States Geological Survey https://www.usgs.gov/ (accessed on 4 November 2023). | |
| Basic data | Temperature | Raster | / | 1000 | 1994—2022 (monthly) | National Tibetan Plateau Data Center https://data.tpdc.ac.cn/ (accessed on 25 November 2023). |
| Precipitation | Raster | / | 1000 | 1994—2022 (monthly) | National Tibetan Plateau Data Center https://data.tpdc.ac.cn/ (accessed on 24 November 2023). | |
| DEM | Raster | / | 30 | 2019—2021 | China geospatial data cloud https://www.gscloud.cn/ (accessed on 26 November 2023). | |
| Land use type | Raster | 5 scenes | 30 | 1994, 2022 | / | |
| CVkNDVI | Fluctuation Degree | Area Percentage (%) |
|---|---|---|
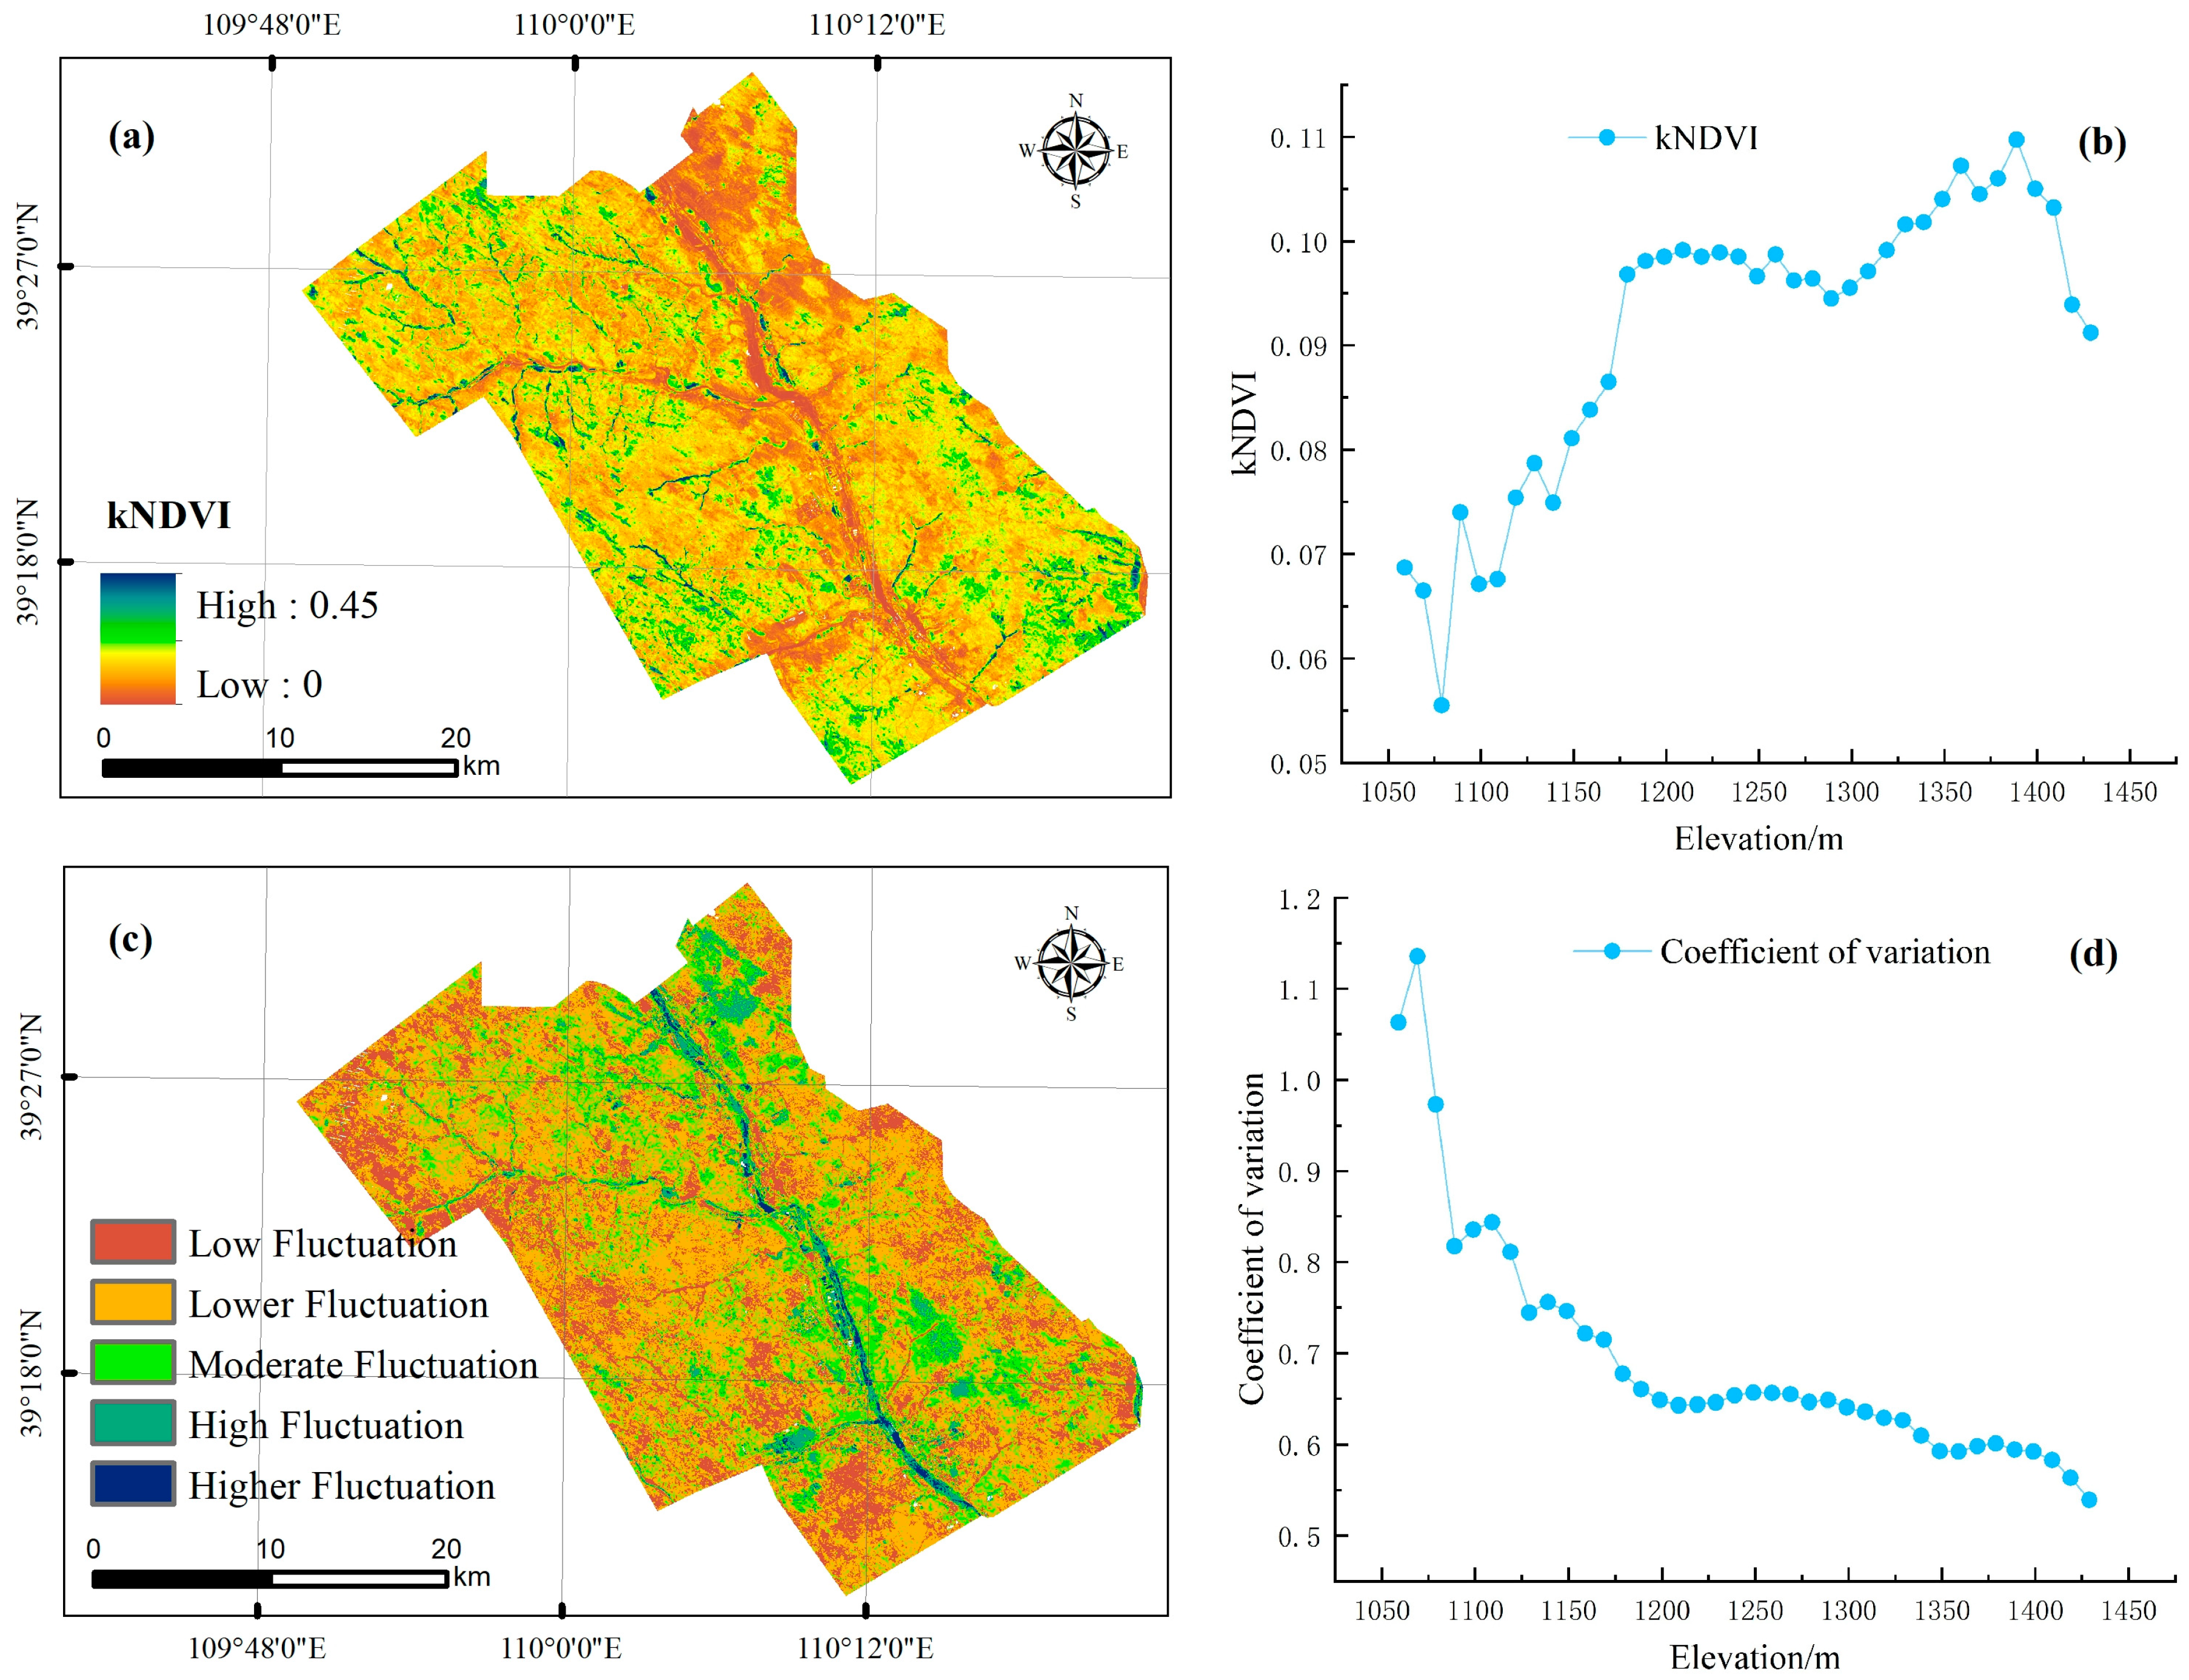
| CVkNDVI < 0.55 | Low fluctuation | 23.95 |
| 0.55 ≤ CVkNDVI < 0.71 | Relatively low fluctuation | 47.70 |
| 0.71 ≤ CVkNDVI < 0.92 | Moderate fluctuation | 21.85 |
| 0.92 ≤ CVkNDVI < 1.31 | Relatively high fluctuation | 5.70 |
| CVkNDVI ≥ 1.31 | High fluctuation | 0.80 |
| SlopekNDVI | Z Value | H Value | Variation Types | Area Percentage (%) |
|---|---|---|---|---|
| ≥0.001 | ≥1.96 | >0.5 | Consistent and significant improvement | 53.54 |
| 0.0001–0.001 | −1.96–1.96 | >0.5 | Consistent and slight improvement | 2.25 |
| ≥0.0001 | −1.96–1.96 | <0.5 | Inconsistent and improvement | 40.02 |
| −0.0001–0.0001 | −1.96–1.96 | - | Stable area | 0.54 |
| ≤−0.0001 | −1.96–1.96 | <0.5 | Inconsistent and degradation | 2.37 |
| −0.001–(−0.0001) | −1.96–1.96 | >0.5 | Consistent and slight degradation | 1.00 |
| <−0.001 | ≤−1.96 | >0.5 | Consistent and significant degradation | 0.28 |
Disclaimer/Publisher’s Note: The statements, opinions and data contained in all publications are solely those of the individual author(s) and contributor(s) and not of MDPI and/or the editor(s). MDPI and/or the editor(s) disclaim responsibility for any injury to people or property resulting from any ideas, methods, instructions or products referred to in the content. |
© 2024 by the authors. Licensee MDPI, Basel, Switzerland. This article is an open access article distributed under the terms and conditions of the Creative Commons Attribution (CC BY) license (https://creativecommons.org/licenses/by/4.0/).
Share and Cite
Zhang, X.; Chen, Z.; Jiao, Y.; Cheng, Y.; Zhu, Z.; Wang, S.; Zhang, H. Quantitative Analysis of Vegetation Dynamics and Driving Factors in the Shendong Mining Area under the Background of Coal Mining. Forests 2024, 15, 1207. https://doi.org/10.3390/f15071207
Zhang X, Chen Z, Jiao Y, Cheng Y, Zhu Z, Wang S, Zhang H. Quantitative Analysis of Vegetation Dynamics and Driving Factors in the Shendong Mining Area under the Background of Coal Mining. Forests. 2024; 15(7):1207. https://doi.org/10.3390/f15071207
Chicago/Turabian StyleZhang, Xufei, Zhichao Chen, Yiheng Jiao, Yiqiang Cheng, Zhenyao Zhu, Shidong Wang, and Hebing Zhang. 2024. "Quantitative Analysis of Vegetation Dynamics and Driving Factors in the Shendong Mining Area under the Background of Coal Mining" Forests 15, no. 7: 1207. https://doi.org/10.3390/f15071207
APA StyleZhang, X., Chen, Z., Jiao, Y., Cheng, Y., Zhu, Z., Wang, S., & Zhang, H. (2024). Quantitative Analysis of Vegetation Dynamics and Driving Factors in the Shendong Mining Area under the Background of Coal Mining. Forests, 15(7), 1207. https://doi.org/10.3390/f15071207