Abstract
Tree-ring blue intensity (BI) has the potential to provide information on past summer temperatures of a similar quality to that of tree-ring maximum latewood density and at a substantially reduced cost. To explore the applicability of BI in subtropical regions, the inverted BI for the earlywood, latewood, and the delta BI (DBI) parameters, together with tree-ring width of subalpine fir (Abies fargesii Franch.) in the Shennongjia area of China, were measured, and the corresponding chronologies were developed. The relationships between these chronologies and monthly precipitation, monthly mean minimum temperature, monthly mean temperature, and monthly mean maximum temperature were explored through correlation analysis. Results show that the DBI chronology is closely related to the temperature in August of the current year, indicating that BI, specifically delta BI, data are suitable for use in dendroclimatology studies in subtropical areas. The resultant mean temperature reconstruction for August, based on DBI, explains 40.8% of the temperature variance and is robustly validated using independent periods from the calibration. This pilot study not only highlights the potential of DBI for temperature reconstruction in China but also offers valuable insights into historical climate variations in the Shennongjia region. Moreover, it shows the potential for utilizing such tree-ring data from low-latitude regions to derive past climate data in subtropical warm-humid zones.
1. Introduction
According to recent research [1], 2023 was the warmest northern hemisphere extra-tropical summer over the past 2000 years exceeding the 95% confidence range of natural climate variability by more than 0.5 °C. Climate change is now not only a scientific challenge but also a political issue [2]. Long climate records are essential for evaluating the extent of natural fluctuations in the climate system and placing recent warming in a historical context. However, instrumental meteorological records are often insufficiently long for this purpose, particularly in regions where meteorological measurements commenced later (e.g., East Asia). Tree-ring (TR) data are a valuable high-resolution and exactly-dated proxy for reconstructing the climate over the past hundreds [3,4,5] and even thousands [6,7,8] of years, as they provide important information about the amplitudes of natural climate fluctuations that extend beyond the observational period. However, in general, ring-width data have been shown to be a poor proxy of past summer temperatures even when trees are sampled from temperature-limited tree-line locations [9,10]. Over the last 30 years, however, ring density parameters have provided a robust data source for reconstructing past summer temperatures across many regions of the northern hemisphere [11,12]. Unfortunately, due to the high costs involved in generating density data, including equipment, software, technician training, analytical time, and maintenance costs, only a few tree-ring laboratories around the world have the capability to measure tree-ring density [13]. Tree-ring blue intensity (BI), a method that measures the amount of blue light reflected from tree-ring cores, has been shown to be a robust alternative to tree-ring density and is gaining increasing attention in dendroclimatic studies [13,14,15,16,17,18,19,20]. Unlike tree-ring density, BI is easy and inexpensive to measure. Previous studies demonstrate that when tree-ring width (RW) serves as a weak temperature predictor due to complex growth–climate relationships at lower latitudes (<40° N) [5,21,22], BI can still be strongly representative of local to regional summer temperatures. Although there has been an increasing number of BI-based summer temperature reconstruction studies [5,20,21,23,24,25,26], there is still a paucity of TR blue intensity records for SE Asia. Herein, we highlight the potential of BI to substantially improve on RW-based reconstructions of past temperatures.
In this study, we examine the use of BI data from cross-dated subalpine fir (Abies fargesii Franch.) tree-ring samples in the Shennongjia region of subtropical China (Figure 1). This area is significant as it serves as an ecological green belt in the world-renowned Three Gorges Reservoir region and is a crucial component of the South-to-North Water Transfer Project in China. Abies fargesii Franch. is one of the more widely distributed Chinese firs. It extends from the eastern margin of the Tibet–Qinghai Plateau to southeastern Gansu, southern Shaanxi, western Henan, western Hubei, and northern Hunan. Shennongjia is located at the eastern edge of its distribution range, which spans a vertical distribution from 2000 to 3100 m and dominates the forests above 2500 m. Building on previous research [27] based on tree-ring width data, our objectives are as follows: (1) to investigate the feasibility of using BI data from fir trees, specifically Abies fargesii Franch., in subtropical dendroclimatic research and (2) to extend climate information before the instrument record. This work is an important exploration of using BI in dendroclimatology for subtropical regions and could serve as a reference for reconstructing past climates in similar climatic regions around the globe.
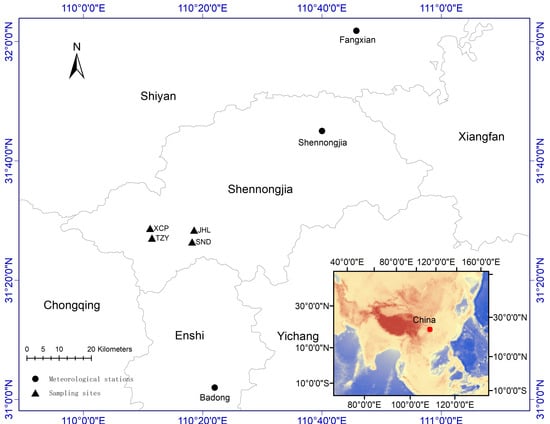
Figure 1.
Locations of tree-ring sampling sites (black triangle) and meteorological stations (black dots).
2. Materials and Methods
2.1. Study Region and Sampling Information
The Shennongjia region, situated along the upper Yangtze River, has an average elevation of 1700 m. Its climate is significantly influenced by the southeast subtropical monsoon, resulting in ample precipitation and moderate mean air temperatures. According to 30-year climate records from the Shennongjia meteorological station (1991–2020), the area experiences an average annual precipitation of 897 mm and a mean monthly temperature of 12.6 °C. Using the CRU TS 4.07 data [28] for the 0.5° grid relevant to the study sites, the actual precipitation at the sampling sites is approximately 2000 mm. The highest temperatures typically occur in July and August, peaking around 23 °C. Tree-ring cores utilized in this study were obtained every few years between 2012 and 2021 from healthy dominant or co-dominant mature trees at breast height (1.3 m above ground surface) in various locations around the Shennongjia region—specifically, Taiziya (TZY), Xiaocongping (XCP), Jinhouling (JHL), and Shennongding (SND), as illustrated in Figure 1 and detailed in Table 1 (excluding the final year, which corresponds to the sampling year). An earlier version of JHL data was used in a pilot experiment study [22]. Sample collection was primarily performed using a 5.15 mm Haglöf Sweden increment borer with a small portion sampled using a 10 mm Haglöf Sweden increment borer. In general, we sampled two cores from each tree parallel to the contour of the slope to reduce abnormalities in tree-ring growth. In a few cases, one core may be sampled when the second core is dangerous or difficult to sample. Sometimes, three cores may be sampled when the other two cores seem to not be in good condition for further analysis.

Table 1.
Sample information.
2.2. Climate Data
There are three meteorological stations around the sampling sites (Figure 1): Shennongjia Meteorological Station, Fangxian Meteorological Station, and Badong Meteorological Station—with meteorological records starting in 1975, 1958, and 1953, respectively. However, none of these stations are directly adjacent to the sampling sites; the closest distance from the sampling sites to the nearest meteorological station is ~45 km. Data from the Badong meteorological station, including monthly precipitation (PRE), monthly mean minimum temperature (TMN), monthly mean temperature (TMP), and monthly mean maximum temperature (TMX), were utilized due to the longer time coverage data compared with the other two stations.
2.3. Chronology Development
All samples were processed following recommended procedures [13], such as air-drying, mounting on wooden holders, and sanding with progressively finer sandpaper (up to 800 grit). Resin extraction was not performed, as the samples from fir do not exhibit a visible heartwood–sapwood color change. Before scanning, the scanners were calibrated using the SilverFast 9 scanner software and an IT8 color card target (IT8.7/2) to ensure consistency between laboratories [25]. The mounted cores were then scanned at 3200 DPI using a flatbed Epson V850 Pro scanner, which was covered by a box with matt black side walls to minimize bias from external ambient light and internal box reflections of light [13]. Tree-ring width and tree-ring blue intensity data were generated using CooRecorder software (9.8.1) [29] in combination with CDendro software (9.8.1). Inverted latewood blue intensity (LWBI), inverted earlywood blue intensity (EWBI), and delta blue intensity (DBI) [18] data were generated using frame specification parameters with a “window” (width-offset-limiting-depth-margin) of 300-3-0-500-0.2 and 200-3-5-200-0.2, respectively. Percentile extraction values 85% and 15%, which have been shown to produce optimal results in previous studies [13,22], were employed to extract light and dark wood reflection intensity information for EWBI and LWBI. All tree-ring data were detrended using ARSTAN with an age-dependent spline with positive trend retention. An initial spline flexibility of 50 years was used, which more naturally tracks the juvenile, while the increasing incremental changes in the spline window tracks the long-term radial growth trajectory better than more rigidly defined approaches, such as negative exponential functions.
2.4. Correlation Analysis and Reconstruction Model Development
Initially, the climate signal in the tree-ring parameters was evaluated by computing Pearson’s correlation coefficients between the tree-ring chronologies and monthly/seasonal PRE, TMN, TPM, TMX from Badong meteorological station. Considering that the climate conditions in the previous year may affect the growth in the current year, the monthly climate from previous September to current October were employed in the analysis. Then, based on the result of the correlation analysis, a simple linear regression analysis was utilized to generate a transfer function to transform the tree-ring data to estimates of past climate. The period from 1953 to 2020 was used for an assessment of the reconstruction. The dataset was first split into a calibration period from 1953 to 1986 and a verification period from 1987 to 2020. Then, the analysis was repeated with a reversed split: the calibration period from 1987 to 2020 and the verification period from 1953 to 1986. To assess the accuracy of the model, the R-squared (R2), the F value (F), and the root mean square error (RMSE) were calculated for the calibration period. Then, R2, RMSE, reduction in error (RE), and coefficient of efficiency (CE) [30] were calculated for the verification period. The Durbin–Watson value (DW) was calculated for the full period.
Secondly, the reconstructed series, using the original and the first differenced transform, were compared with the corresponding CRU TS4.07 temperature data using spatial correlation analysis to assess its robustness and spatial representativeness.
3. Results and Discussion
3.1. Chronology Characteristics
The periods covered by the tree-ring chronologies (XCP, TZY, JHL, and SND) are as follows: XCP spans from 1774 to 2011, TZY from 1811 to 2018, JHL from 1830 to 2020, and SND from 1846 to 2011 (Table 1, Figure 2). Notably, both XCP and TZY extend over more than 200 years, presenting a significant opportunity to potentially extend our climate knowledge prior to the instrumental record through dendrochronological analysis. The chronologies exhibit a consistent growth pattern for the same tree-ring parameter (Figure 2). This consistency suggests a coherence in environmental response across these distinct temporal intervals. Combining data from these four sites enables us to develop more replicated robust and longer reconstruction of past climate variability, contributing to our understanding of the complex interactions driving climatic changes on both local and regional scales.
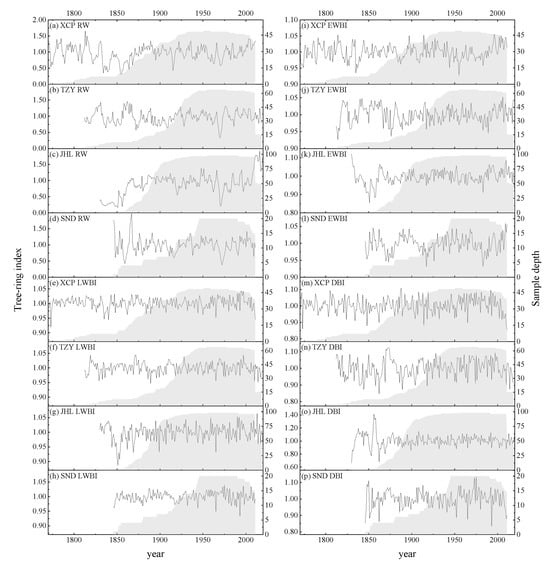
Figure 2.
Chronologies for XCP, TZY, JHL, and SND in Shennongjia.
Figure 3 provides a comprehensive overview of the statistical characteristics of the parameter tree-ring chronologies. Across all sites, RW consistently shows higher coefficient of variation (CV) values, high first-order autocorrelation (AC1), and strong common signal strength (Rbar). For AC1, the order is RW, EWBI, LWBI, and DBI, showing a substantial difference in persistence properties between RW and DBI. Rbar values are low for EWBI, indicating a rather weak signal strength and need more cores to attain a robust chronology. However, the Rbar value of 0.172 to 0.199 for LWBI and DBI shows that for these parameters, one needs to sample about 25 cores to attain an expressed population signal (EPS) value ≥ 0.85 [31].
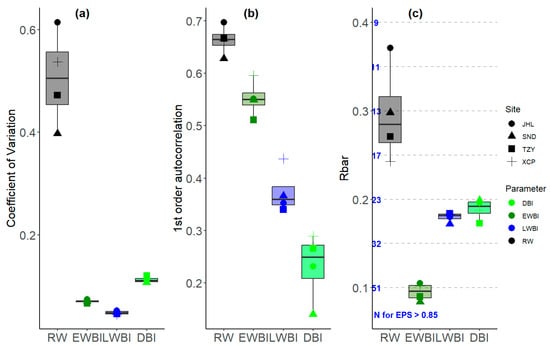
Figure 3.
Statistics of the tree-ring detrended parameter chronologies. Coefficient of variation (a), first-order autocorrelation (b), and Rbar (c).
The higher CV and Rbar values for RW compared to EWBI and LWBI have been observed in previous studies [24,32], and it has been found that more samples are needed to maintain a 0.85 threshold [31] for BI chronologies than for RW chronologies in general. The higher and similar AC1 values for RW and EWBI compared to LWBI and DBI suggest why RW and EWB can express pre-growing season climate while LWBI and DBI typically reconstruct current growing season climate [5]. Previous studies [33,34], including this one, have demonstrated that the different signals expressed by the different tree-ring parameters present a chance to uncover additional climatic information.
For the period 1901–2010 represented by high replication for each site, the pairwise correlation coefficients among various tree-ring parameters for all sites predominantly indicate low or negative values between RW and other tree-ring parameters such as EWBI, LWBI, and DBI. Previous studies [14] have also identified distinct signals of the different TR parameters, which generally represent different aspects of climate influence on growth. Furthermore, a consistent negative correlation is observed between EWBI and DBI across all sites. Conversely, weak but positive correlation coefficients are consistently evident between EWBI and LWBI, while strong correlations between LWBI and DBI are noted across all sites (Figure 4). It should be noted that the patterns between TR parameters in different studies may differ, with one reason being the inconsistent interpretations and understanding of the terminology for BI [18].
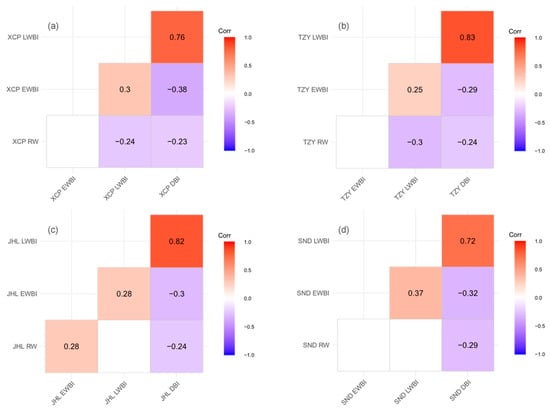
Figure 4.
Pairwise correlation between different tree-ring parameters for XCP (a), TZY (b), JHL (c), and SND (d) for the period 1901–2010. The blank square indicates that the correlation did not reach the significance level of 0.05.
Overall, comparing the same tree-ring parameters between sites, there is a strong common signal between the sites (Figure 5), although this is weaker for RW (range: 0.23–0.57) followed by EWBI (0.49–0.66), LWBI (0.6–0.73) and DBI (0.6–0.78). Principal component analyses were performed for each tree-ring parameter to examine common patterns across the four locations (Table 2). This parameter-specific common variance is further validated over the period 1901–2010, where the variance explained by PC1 from a PCA for RW, EWBI, LWBI and DBI is 58.1%, 68.1%, 73.9%, and 76.4%, respectively.
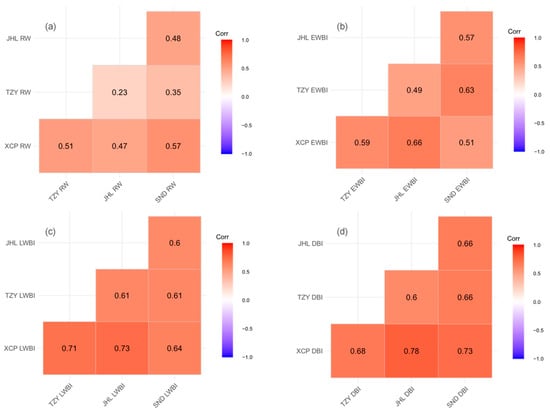
Figure 5.
Pairwise correlation between different sites for RW (a), EWBI (b), LWBI (c), and DBI (d) for the period 1901–2010. The number and color of the box indicate the correlation coefficient.
Table 2.
Results of principal component analysis.
Despite the weaker within-site common signal of the BI parameters compared to the RW parameters (Figure 3), which has been previously noted [32,33,34,35], the BI parameters exhibit a higher inter-site correlation than the RW parameters for Abies fargesii Franch. in the Shennongjia region (Figure 5). Hence, due to the strong common signal between the sites, it is more logical to develop a composite regional chronology for each tree-ring parameter. Therefore, we derived four regional composite chronologies for each parameter (Figure 6) but excluded cores that did not exhibit a significant correlation with the master series at the 0.05 level. Ultimately, we retained 226, 209, 226, and 220 cores out of 231 for RW, EWBI, LWBI, and DBI, respectively. EPS calculations were performed using a window length of 31 years with a 30-year overlap. The results show that in the early stages of all chronologies, when the sample size is small, the EPS value is low and unstable, indicating that the chronologies from this period are not reliable.
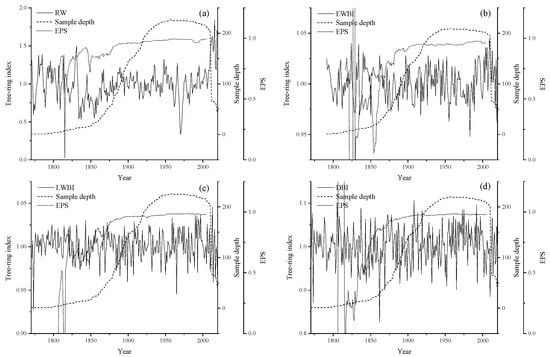
Figure 6.
Composite chronologies for RW (a), EWBI (b), LWBI (c), and DBI (d) in Shennongjia.
3.2. Relationship between Chronologies and Climate Variables
The correlations between the chronologies and climate data (1953–2020) revealed that all chronologies express a temperature response and show weaker relationships with precipitation (Figure 7). As all tree-ring samples were collected at relatively high elevations (Table 1), where there is abundant rainfall, it is not surprising that precipitation does not limit tree growth. Previous studies have demonstrated that tree rings collected at high elevations are significantly influenced by temperature variations due to temperature limitations in the growing season [36].
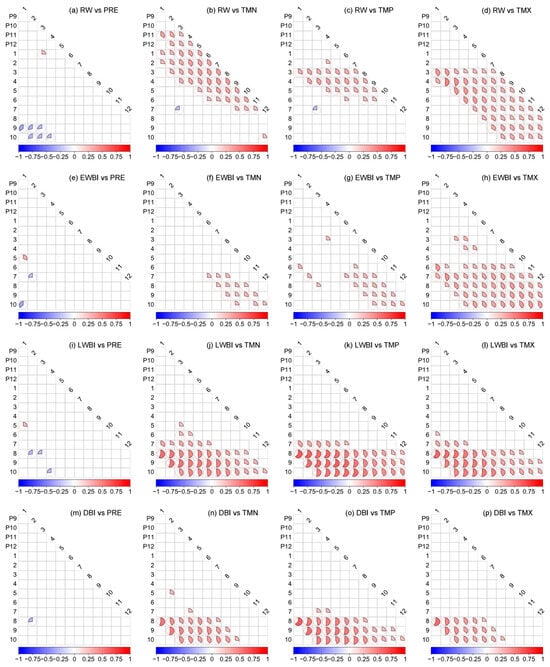
Figure 7.
Correlation coefficients for tree-ring chronologies with PRE, TMN, TMP, and TMX. The figures on the left-hand axis represent the end month of the seasonal period for the correlation analysis, while the diagonals detail the number of consecutive months included in the seasonal window. Both the ratio and color of the shaded portion of the pie denote the correlation coefficient. A blank square indicates that the correlation did not reach the significance level of 0.05.
On the whole, RW exhibits a weak correlation with climate data with relatively higher correlations observed for the mean TMN from the previous November to the current March (r = 0.39) and March–April TMX (r = 0.49) (Figure 7). However, after applying the first difference to both RW and climate data, the previously mentioned correlation results between them did not reach significance at the 0.05 level (Figure 8). This reaffirms that although tree-ring width data may express strong common signals (within and between sites), they may not express a strong climate signal and in fact, the correlations presented in Figure 7 represent the influence of trend on the correlation values rather than a true climate signal. Therefore, the timely and selective incorporation of other tree-ring parameters, such as tree-ring isotopes, tree-ring density, and tree-ring blue intensity, may significantly enhance the depth and breadth of our understanding of past climate data.
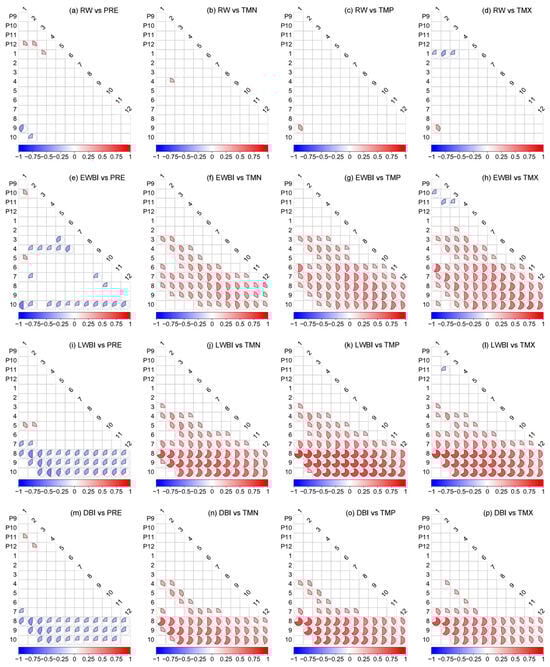
Figure 8.
As Figure 7, but after the tree-ring and climate data have been transformed to 1st differences.
Typically, in the original series, EWBI demonstrates a weak correlation with the aforementioned four climate variables (Figure 7). This result explains why EWBI is a less-explored parameter in dendroclimatic research [14]. However, it is noteworthy that June, June–July, and January–July TMX show significant correlations with EWBI, with values of 0.59, 0.54 and 0.54, respectively, after applying the first difference to both the chronology and climate data (Figure 8). These correlations are weaker for the unfiltered correlations (Figure 7). However, these results may present an opportunity to understand the historical high-frequency TMX fluctuations in aforesaid month and seasons. The mean TMX for the previous December–October and January–October also showed a significant influence on EWBI. However, this may be meaningless because the tree-ring earlywood is not formed so later.
LWBI, as a well-explored parameter in dendroclimatic research [5,21,23], shows a relatively strong relationship with both mean August TMP and TMX in the original series, with correlation coefficients of 0.63 and 0.59, respectively (Figure 7l). Previous studies [5,21,23] have also confirmed that LWBI effectively reflects summer temperature variations. In fact, after applying the first difference to both the LWBI chronology and climate data, the correlation coefficients for TMN, TMP, and TMX significantly improve (Figure 8j–l). For example, August TMP and August TMX rank as the two highest correlations with coefficients of 0.76 and 0.75, respectively.
For DBI, the unfiltered correlation coefficients with August TMN, TMP and TMX rank highest at 0.54, 0.64, and 0.57, respectively. Similar to LWBI, these coefficients also show significant improvement after applying the first difference to both the DBI chronology and climate data, increasing to 0.65, 0.73, and 0.71. As we can see, DBI exhibits slightly better performance than LWBI in capturing low-frequency signals, while it is slightly less effective in high-frequency signals. This reaffirms the potential of both DBI and LWBI in tree-ring research [20,32]. Clearly, LWBI and DBI in this study demonstrate a different and more robust relationship with temperature compared to RW. This finding provides an opportunity to deepen our understanding of temperature variability in subtropical areas and represents a significant advancement beyond traditional research, which has mainly focused on higher-latitude regions [20,32]. As has been shown before, the strong correlations noted above show that despite the weaker signal strength in the BI parameters compared to RW, this does not reflect that these data express a weak climate signal [32,33,34,35,37]. The discrepancy in correlations between RW and climate versus BI and climate (Figure 8), whether species-specific or regional-specific, should be further explored.
3.3. Temperature Reconstruction
Based on the correlation analysis results, a regression analysis was performed to establish the transfer function between the DBI chronology and the August TMP (1953–2020). The derived regression equation is as follows:
TMPAug = 8.009 × DBI + 19.56
TMPAug represents the estimated August mean temperature (in degrees Celsius), while DBI denotes the corresponding tree-ring DBI value for the same year. As shown in Table 3, the reconstruction accounts for 40.81% of the temperature variance over the full calibration period from 1953 to 2020. The F-value is 45.506 with a corresponding p-value of 0.000, indicating high statistical significance. Additionally, the RMSE value stands at 1.05, suggesting the extent of deviation between actual and predicted values. The DW value of 1.719 suggests no significant (99%) autocorrelation in the model residuals. RE and CE, for both validation periods, are consistently positive, indicating an acceptable amount of model fidelity.
Table 3.
Statistics of the August temperature model.
The DBI based August temperature reconstruction covers the period from 1770 to 2020 with enhanced reliability observed since 1865 where EPS > 0.85 (Figure 9c). The average estimated August TMP for the reliable period spanning from 1865 through 2020 was 27.667 °C. An 11-year moving average of the reconstructed temperature series highlights, since 1865, warm periods were predominantly observed from 1869 to 1883 and from 1956 to 1999, while cold periods occurred mainly from 1884 to 1904, 1925 to 1955, and from 2000 to 2020. A year was classified as very warm if it exceeded the mean + 1σ and as cool if it fell below the mean—1σ; the reconstructed series indicated 29 very warm years and 26 very cold years. The cold summers, such as those in 1884, and 1965, may be related to volcanic eruptions, namely Krakatoa in 1883, and Mount Agung in 1963–1964. By contrast, some cold summers, such as those in 1869 and 1889, occurred without any associated volcanic eruption events. Therefore, in addition to the volcanic cooling effect [38], other factors should be given attention in future studies and may reflect larger-scale dynamical processes impacting season climate conditions.
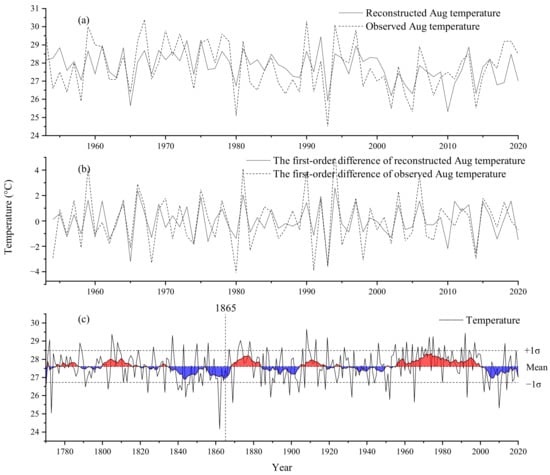
Figure 9.
Comparison of reconstructed and observed August temperatures; unfiltered (a), 1st differenced (b), unfiltered reconstructed August temperatures with a 11-year moving average (c). The red and blue shadows represent warm and cool periods, respectively, based on the 11-year moving average temperature.
As shown in Figure 9a,b, the reconstructed TMP closely aligns with the observed TMP over the common period of 1953–2020, and there is a stronger significant correlation (r = 0.732, p < 0.001) between the two sequences after the 1st difference transform. This indicates that our reconstructed sequence is very robust at high frequencies, but the fact that the reconstruction model passes RE and CE validation and there is no autocorrelation in the residuals suggests that the reconstruction models the lower frequency trends quite well also.
Previous research conducted in the region [27] showed an early growing season temperature signal in RW. However, this temperature signal primarily manifests in low-frequency variations rather than high-frequency variations. In contrast, as has been observed in other BI-based studies in Europe [20], DBI has a substantially stronger temperature signal at interannual timescales than the corresponding RW chronology. This study, unlike previous tree-ring width-based temperature reconstructions [39,40] that show a warming trend in recent decades, shows a gentle temperature change. This difference may result from the reconstructed seasons being different; additionally, the study areas are also not the same.
As well as being well correlated with local temperatures (Figure 10a), the reconstruction coheres strongly with a much larger region especially after 1st differencing (Figure 10b). This latter observation suggests that the interannual signal is robust over an extremely large area across most of China and even as far east as the Korean Peninsula. This indicates that the variability of August temperatures in the Shennongjia area is representative of not just local temperatures but also of larger-scale regional climate patterns. This reaffirms that BI can effectively capture high-frequency temperature changes, although further work is needed to assess whether the weaker correlation for the non-transformed data is related to trend distortion in the DBI records or possible inhomogeneity issues in the instrumental data themselves.
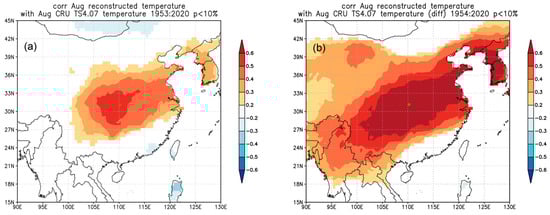
Figure 10.
The field-correlation between the reconstructed August temperature and the CRU TS 4.07 dataset for the period from 1953 to 2020, using both unfiltered data (a) and the first difference (b). Correlation fields were produced using KNMI Climate explorer “http://climexp.knmi.nl (accessed on 23 July 2024)”. The green circle shows the position of the Badong meterological station.
4. Conclusions
In this study, we examined the relationship between RW, EWBI, LWBI, and DBI chronologies with climate to determine if BI can express more climate information than RW data from Abies fargesii Franch. trees in subtropical China. The results are encouraging and suggest that BI is a superior parameter for extracting temperature information from tree rings in subtropical areas. Our findings indicate that DBI, which explains 40.8% of the variance in August temperature, is a promising parameter for reconstructing past climate variability in subtropical regions. Reconstructed results are particularly important for this region with limited historical climate data, as they can provide foundational data for studies related to climate change. Given the longevity of Abies fargesii Franch., exceeding 200 years, and the absence of heartwood/sapwood color differentiation, it is a favorable species for future dendroclimatic research in this region of Asia. By further exploration and network expansion, the temperature reconstruction can be significantly improved in terms of length and spatial coverage with the inclusion of new material [41]. This study serves as a reference for understanding past climates in subtropical, warm–humid regions. It is worth noting that except for fir and spruce, most tree species exhibit visible heartwood–sapwood color changes, which can affect the relationship between tree-ring chronology and climate. Effectively eliminating this color change is crucial and requires further study. Additionally, tree species with very tiny rings may not produce a sharply focused image with a scanner; this issue may be addressed using camera mode.
Author Contributions
Conceptualization, data curation, formal analysis, resource acquisition, visualization, and original draft preparation: Y.Z.; Review and editing: R.W. All authors have read and agreed to the published version of the manuscript.
Funding
This research was funded by the Key Regional Joint Research Program of the National Natural Science Foundation of China, grant no. U23A2021, and the National Natural Science Foundation of China, grant no. 41771227. Rob Wilson was further funded by the NSF/NERC project, grant no. NE/W007223/1—Understanding Trans-Hemispheric Modes of Climate Variability: A Novel Tree-Ring Data Transect spanning the Himalaya to the Southern Ocean.
Data Availability Statement
The data presented in this study are available on request from the corresponding author.
Acknowledgments
We extend our gratitude to Shuai Yuan, Yongdong Qi, Dan Wang, and Zhengsheng Hu for their assistance in sampling tree rings. Yue Wang, Shuai Yuan, and Fanxi Kong conducted initial exploratory investigations.
Conflicts of Interest
The authors declare no conflicts of interest.
References
- Esper, J.; Torbenson, M.; Büntgen, U. 2023 summer warmth unparalleled over the past 2000 years. Nature 2024, 631, 94–97. [Google Scholar] [CrossRef]
- IPCC. Summary for Policymakers. In Climate Change 2023: Synthesis Report. Contribution of Working Groups I, II and III to the Sixth Assessment Report of the Intergovernmental Panel on Climate Change; Core Writing Team, Lee, H., Romero, J., Eds.; IPCC: Geneva, Switzerland, 2023; pp. 1–34. [Google Scholar]
- Cook, E.; Krusic, P.; Anchukaitis, K.; Buckley, B.; Nakatsuka, T.; Sano, M. Tree-ring reconstructed summer temperature anomalies for temperate East Asia since 800 C.E. Clim. Dyn. 2012, 41, 2957–2972. [Google Scholar] [CrossRef]
- Shah, S.K.; Berkelhammer, M.; Li, Q.; Mehrotra, N.; Thomte, L.; Shell, R.; Pandey, U.; Gaire, N.P.; Kathayat, G.; Sinha, A. Regional tree-ring oxygen isotope deduced summer monsoon drought variability for Kumaun-Gharwal Himalaya. Quat. Sci. Rev. 2023, 301, 107927. [Google Scholar] [CrossRef]
- Heeter, K.J.; Harley, G.L.; Maxwell, J.T.; Wilson, R.J.; Abatzoglou, J.T.; Rayback, S.A.; Rochner, M.L.; Kitchens, K.A. Summer temperature variability since 1730 CE across the low-to-mid latitudes of western North America from a tree ring blue intensity network. Quat. Sci. Rev. 2021, 267, 107064. [Google Scholar] [CrossRef]
- Wang, J.; Yang, B.; Ljungqvist, F.C. A millennial summer temperature reconstruction for the eastern tibetan plateau from tree-ring width. J. Clim. 2015, 28, 5289–5304. [Google Scholar] [CrossRef]
- Wilson, R.; Anchukaitis, K.; Briffa, K.R.; Büntgen, U.; Cook, E.; D’Arrigo, R.; Davi, N.; Esper, J.; Frank, D.; Gunnarson, B.; et al. Last millennium northern hemisphere summer temperatures from tree rings: Part I: The long term context. Quat. Sci. Rev. 2016, 134, 1–18. [Google Scholar] [CrossRef]
- Salzer, M.W.; Bunn, A.G.; Graham, N.E.; Hughes, M.K. Five millennia of paleotemperature from tree-rings in the Great Basin, USA. Clim. Dyn. 2014, 42, 1517–1526. [Google Scholar] [CrossRef]
- Huang, R.; Zhu, H.; Liang, E.; Liu, B.; Shi, J.; Zhang, R.; Yuan, Y.; Grießinger, J. A tree ring-based winter temperature reconstruction for the southeastern Tibetan Plateau since 1340 CE. Clim. Dyn. 2019, 53, 3221–3233. [Google Scholar] [CrossRef]
- Keyimu, M.; Li, Z.; Liu, G.; Fu, B.; Fan, Z.; Wang, X.; Wu, X.; Zhang, Y.; Halik, U. Tree-ring based minimum temperature reconstruction on the southeastern Tibetan Plateau. Quat. Sci. Rev. 2021, 251, 106712. [Google Scholar] [CrossRef]
- Fan, Z.-X.; Bräuning, A.; Yang, B.; Cao, K.-F. Tree ring density-based summer temperature reconstruction for the central Hengduan Mountains in southern China. Glob. Planet. Chang. 2009, 65, 1–11. [Google Scholar] [CrossRef]
- Briffa, K.; Osborn, T.; Schweingruber, F.H.; Harris, I.C.; Jones, P.D.; Shiyatov, S.G.; Vaganov, E. Low-frequency temperature variations from a northern tree ring density network. J. Geophys. Res. Space Phys. 2001, 106, 2929–2941. [Google Scholar] [CrossRef]
- Rydval, M.; Larsson, L.; McGlynn, L.; Gunnarson, B.E.; Loader, N.J.; Young, G.H.; Wilson, R. Blue intensity for dendroclimatology: Should we have the blues? Experiments from Scotland. Dendrochronologia 2014, 32, 191–204. [Google Scholar] [CrossRef]
- Cao, X.; Hu, H.; Kao, P.; Buckley, B.M.; Dong, Z.; Chen, X.; Zhou, F.; Fang, K. Improved spring temperature reconstruction using earlywood blue intensity in southeastern China. Int. J. Clim. 2022, 42, 6204–6220. [Google Scholar] [CrossRef]
- McCarroll, D.; Pettigrew, E.; Luckman, A.; Guibal, F.; Edouard, J.L. Blue reflectance provides a surrogate for latewood density of high-latitude pine tree rings. Arct. Antarct. Alp. Res. 2002, 34, 450–453. [Google Scholar] [CrossRef]
- Campbell, R.; McCarroll, D.; Loader, N.J.; Grudd, H.; Robertson, I.; Jalkanen, R. Blue intensity in Pinus sylvestris tree-rings: Developing a new palaeoclimate proxy. Holocene 2007, 17, 821–828. [Google Scholar] [CrossRef]
- Kaczka, R.J.; Spyt, B.; Janecka, K.; Beil, I.; Büntgen, U.; Scharnweber, T.; Nievergelt, D.; Wilmking, M. Different maximum latewood density and blue intensity measurements techniques reveal similar results. Dendrochronologia 2018, 49, 94–101. [Google Scholar] [CrossRef]
- Björklund, J.; Seftigen, K.; Kaczka, R.J.; Rydval, M.; Wilson, R. A definition and standardised terminology for Blue Intensity from Conifers. Dendrochronologia 2024, 85, 126200. [Google Scholar] [CrossRef]
- Kaczka, R.J.; Wilson, R. I-BIND: International Blue intensity network development working group. Dendrochronologia 2021, 68, 125859. [Google Scholar] [CrossRef]
- Fuentes, M.; Salo, R.; Björklund, J.; Seftigen, K.; Zhang, P.; Gunnarson, B.; Aravena, J.-C.; Linderholm, H.W. A 970-year-long summer temperature reconstruction from Rogen, west-central Sweden, based on blue intensity from tree rings. Holocene 2018, 28, 254–266. [Google Scholar] [CrossRef]
- Heeter, K.J.; Harley, G.L.; Maxwell, J.T.; McGee, J.H.; Matheus, T.J. Late summer temperature variability for the Southern Rocky Mountains (USA) since 1735 CE: Applying blue light intensity to low-latitude Picea engelmannii Parry ex Engelm. Clim. Chang. 2020, 162, 965–988. [Google Scholar] [CrossRef]
- Zheng, Y.; Shen, H.; Abernethy, R.; Wilson, R. Experiments of the efficacy of tree ring blue intensity as a climate proxy in central and western China. Biogeosciences 2023, 20, 3481–3490. [Google Scholar] [CrossRef]
- Björklund, J.; Gunnarson, B.E.; Seftigen, K.; Zhang, P.; Linderholm, H.W. Using adjusted Blue Intensity data to attain high-quality summer temperature information: A case study from Central Scandinavia. Holocene 2015, 25, 547–556. [Google Scholar] [CrossRef]
- Wilson, R.; Rao, R.; Rydval, M.; Wood, C.; Larsson, L.; Luckman, B.H. Blue Intensity for dendroclimatology: The BC blues: A case study from British Columbia, Canada. Holocene 2014, 24, 1428–1438. [Google Scholar] [CrossRef]
- Wilson, R.; Anchukaitis, K.; Andreu-Hayles, L.; Cook, E.; D’arrigo, R.; Davi, N.; Haberbauer, L.; Krusic, P.; Luckman, B.; Morimoto, D.; et al. Improved dendroclimatic calibration using blue intensity in the southern Yukon. Holocene 2019, 29, 1817–1830. [Google Scholar] [CrossRef]
- Buckley, B.M.; Hansen, K.G.; Griffin, K.L.; Schmiege, S.; Oelkers, R.; D’arrigo, R.D.; Stahle, D.K.; Davi, N.; Nguyen, T.Q.T.; Le, C.N.; et al. Blue intensity from a tropical conifer’s annual rings for climate reconstruction: An ecophysiological perspective. Dendrochronologia 2018, 50, 10–22. [Google Scholar] [CrossRef]
- Zheng, Y.; Shao, X.; Lu, F.; Li, Y. February–May temperature reconstruction based on tree-ring widths of Abies fargesii from the Shennongjia area in central China. Int. J. Biometeorol. 2016, 60, 1175–1181. [Google Scholar] [CrossRef]
- Harris, I.; Osborn, T.J.; Jones, P.; Lister, D. Version 4 of the CRU TS monthly high-resolution gridded multivariate climate dataset. Sci. Data 2020, 7, 19. [Google Scholar] [CrossRef]
- Maxwell, R.S.; Larsson, L.-A. Measuring tree-ring widths using the CooRecorder software application. Dendrochronologia 2021, 67, 125841. [Google Scholar] [CrossRef]
- Cook, E.R.; Briffa, K.R.; Jones, P.D. Spatial regression methods in dendroclimatology: A review and comparison of two techniques. Int. J. Climatol. 1994, 14, 379–402. [Google Scholar] [CrossRef]
- Wigley, T.M.; Briffa, K.R.; Jones, P.D. On the average value of correlated time series, with applications in dendroclimatology and hydrometeorology. J. Appl. Meteorol. Climatol. 1984, 23, 201–213. [Google Scholar] [CrossRef]
- Wilson, R.; Allen, K.; Baker, P.; Boswijk, G.; Buckley, B.; Cook, E.; D’Arrigo, R.; Druckenbrod, D.; Fowler, A.; Grandjean, M.; et al. Evaluating the dendroclimatological potential of blue intensity on multiple conifer species from Tasmania and New Zealand. Biogeosciences 2021, 18, 6393–6421. [Google Scholar] [CrossRef]
- Blake, S.A.; Palmer, J.G.; Björklund, J.; Harper, J.B.; Turney, C.S. Palaeoclimate potential of New Zealand Manoao colensoi (silver pine) tree rings using Blue-Intensity (BI). Dendrochronologia 2020, 60, 125664. [Google Scholar] [CrossRef]
- Cao, X.; Fang, K.; Chen, P.; Zhang, P.; Björklund, J.; Pumijumnong, N.; Guo, Z. Microdensitometric records from humid subtropical China show distinct climate signals in earlywood and latewood. Dendrochronologia 2020, 64, 125764. [Google Scholar] [CrossRef]
- Wiles, G.C.; Charlton, J.; Wilson, R.J.; D’arrigo, R.D.; Buma, B.; Krapek, J.; Gaglioti, B.V.; Wiesenberg, N.; Oelkers, R. Yellow-cedar blue intensity tree-ring chronologies as records of climate in Juneau, Alaska, USA. Can. J. For. Res. 2019, 49, 1483–1492. [Google Scholar] [CrossRef]
- Frank, D.; Esper, J. Characterization and climate response patterns of a high-elevation, multi-species tree-ring network in the European Alps. Dendrochronologia 2005, 22, 107–121. [Google Scholar] [CrossRef]
- Buras, A. A comment on the expressed population signal. Dendrochronologia 2017, 44, 130–132. [Google Scholar] [CrossRef]
- Yin, H.; Li, M.-Y.; Huang, L. Summer mean temperature reconstruction based on tree-ring density over the past 440 years on the eastern Tibetan Plateau. Quat. Int. 2021, 571, 81–88. [Google Scholar] [CrossRef]
- Cai, Q.; Liu, Y.; Duan, B.; Sun, C. Regional difference of the start time of the recent warming in Eastern China: Prompted by a 165-year temperature record deduced from tree rings in the Dabie Mountains. Clim. Dyn. 2018, 50, 2157–2168. [Google Scholar] [CrossRef]
- Yuan, Y.; Deng, Y.; Gao, L.; Fu, X.; Xu, Y.; Gou, X. Unprecedented recent warming as recorded by tree-ring in the western Qinling Mountains, China. Palaeogeogr. Palaeoclim. Palaeoecol. 2024, 644, 112202. [Google Scholar] [CrossRef]
- Dang, H.; Zhang, K.; Zhang, Y.; Tong, X.; Zhang, Q. Regeneration dynamics of subalpine fir (Abies fargesii) forest across the altitudinal range in the Shennongjia Mountains, central China. J. Plant Ecol. 2013, 6, 36–47. [Google Scholar] [CrossRef][Green Version]


Disclaimer/Publisher’s Note: The statements, opinions and data contained in all publications are solely those of the individual author(s) and contributor(s) and not of MDPI and/or the editor(s). MDPI and/or the editor(s) disclaim responsibility for any injury to people or property resulting from any ideas, methods, instructions or products referred to in the content. |
© 2024 by the authors. Licensee MDPI, Basel, Switzerland. This article is an open access article distributed under the terms and conditions of the Creative Commons Attribution (CC BY) license (https://creativecommons.org/licenses/by/4.0/).