Abstract
The concentrations and ratios of plants C, N, and P serve as important indicators of ecological processes. However, how plant and soil C:N:P relationships and ratios change with forest stand types remain unclear. Here, we analyzed the ecological stoichiometric characteristics by measuring leaf and soil organic C, total N, and P contents in four stand types in Liaocheng, including Populus tomentosa Carrière pure forest, Populus tomentosa–Robinia pseudoacacia L. mixture forests, Platanus orientalis L. pure forest, and Salix matsudana Koidz. pure forests. We find that (1) The N and P leaf contents varied significantly across the four forest stands, with Populus tomentosa–Robinia pseudoacacia mixture forests having higher P levels. Platanus orientalis pure forests had lower C and N but higher P levels compared to others. (2) Uncoupled cycling of P in leaf–soil systems due to environmental influences, but C and N elements showed coupled cycles in some forest stands. (3) Populus tomentosa pure forests, Populus tomentosa–Robinia pseudoacacia mixture forests, Platanus orientalis pure forests are limited by N, and Salix matsudana pure forests are limited by both N and P elements. Overall, environmental factors, in addition to species variations, influence the C, N, P, and C:N:P ratios in leaves and soils of different forest stand types. Enhancing conservation and efficient use of N and P elements is crucial for sustainable plantation forest management to promote optimal growth in the region.
1. Introduction
Ecological stoichiometry is an important method to study the balance of major elements and material cycling of ecosystem components, which can reflect the dynamic balance between energy and chemical elements [1,2,3]. Ecological stoichiometry focuses on the dynamic equilibrium between C, N, and P and their interactions and the demand for nutrients (mainly C, N, and P) by plants [1,4]. C, N, and P are the key biogenic elements for the survival and development of terrestrial organisms. C is known as the structural basis of plants and is relatively stable in plant organisms, accounting for about 50% of dry plant biomass [5,6]. N and P are two essential macronutrients in the life history of plants, and their contents are closely related to the composition and productivity level of plant communities, while their biogeochemical processes affect nutrient cycling, ecosystem processes, and functions [7,8]. At present, ecological stoichiometry has achieved many theoretical results, especially in determining limiting nutrient elements, such as the “limiting element stability hypothesis” [1,9]. Several scholars have analyzed the nutrient elements that limit the growth of the plant by studying the leaf N:P ratio. For example, Hu et al. [10] concluded that the growth of Broussonetia papyrifera in a karst rocky ecosystem is limited by N elements. Through their study, Li et al. [11] found that most of the plants in the Ebinur Lake Reserve are limited by N and P.
Numerous studies have shown that in terrestrial ecosystems, aboveground plants and underground soil are closely interconnected and are easily affected by environmental factors. In addition, the nutrient cycling between plants and soil influences community material cycling and energy flow, which is of great significance for community structure and ecosystem function [12,13]. Plants and soil are intricately linked and engage in a reciprocal relationship. On the one hand, the direct source of plant nutrients is the soil, as plants utilize their root systems to establish extensive contact surfaces for the exchange of substances between the plant and soil. On the other hand, soil serves as a vital ecological factor for plants, with its physicochemical characteristics significantly influencing plant growth [14]. Therefore, analyzing the ecological stoichiometric characteristics of nutrient elements between plants and soil in an ecosystem is of great significance. It clarifies the correlation of nutrient elements between plants and soil, reveals the interactions among elements, and elucidates the relationships of constraints and balance.
The ability of organisms to maintain a relatively stable chemical composition in order to adapt to changes in the external environment during long-term evolution is called ecological stoichiometry homeostasis, which can reflect the physiological and biochemical adaptations of plants to environmental changes [2,15]. Leaves are important organs for plants to carry out photosynthesis, with higher and more stable contents of C, N, and P compared to other organs [16]. Studies have shown that it is the N:P values that most accurately characterize the homeostasis of the plant itself rather than all elements [17]. Therefore, investigating the N and P content and N:P ratio of leaves helps to further understand the ecological adaptability mechanisms of plants. Researchers have carried out many studies on the ecological stoichiometric and homeostasis characteristics in soil and leaves in ecosystems. For example, researchers found that the different salt tolerance patterns led to different homeostasis characteristics in the species by studying the ecological stoichiometry homeostasis characteristics of different halophytes in the Yellow River Delta [18]. In addition to this, in the karst region, the researchers used the loquat as an object to study its homeostasis. It was found that the loquat could regulate its internal physiological well metabolism to adapt to the arid and barren environment of the karst desert area in the karst region [19].
In the past two decades, scientists have conducted a lot of research on ecological stoichiometry and stoichiometry homeostasis characteristics. However, these studies have mainly focused on desertification and highland areas [20,21], with a lack of exploration in the plains. In addition, previous studies on ecological stoichiometry and stoichiometry homeostasis characteristics have mainly focused on natural forest stands and grasslands [22], with a lack of studies on planted forests. Most of these studies have been carried out at the community level, with only a small number of researchers focusing on various types of forest stands for their research [22].
The Yellow River floodplain, located between the Haihe Plain and the Huaibei Plain, is a key ecological safety barrier in China, with high primary productivity and biodiversity. However, in recent years, under the combined influence of climatic factors and human activities, soil erosion and vegetation degradation have occurred in the Yellow River floodplain, and productivity levels and stability have declined [23]. This study was conducted in Liaocheng City in the western part of Shandong Province, where many typical plantation species play a crucial role in maintaining regional biodiversity and ecosystem stability. Therefore, this study was carried out on the ecological stoichiometry and stoichiometry homeostasis characteristics in mainly four forest stand types (Populus tomentosa pure forest, Platanus orientalis pure forest, Populus tomentosa–Robinia pseudoacacia mixture forests, and Salix matsudana pure forests) of Liaocheng city as the research object. The main problems we are answering were (1) How does leaf and soil stoichiometry vary with stand type? (2) What are the limiting nutrients in the four forest stands? (3) Is there a leaf–soil coupling of nutrient elements in different stand types? (4) What are the homeostasis characteristics of different forest stands?
2. Materials and Methods
2.1. Study Area
The study area is located in Gaotang Jiucheng Forest Farm, Guangping Forest Farm, and Donge Yellow River National Park of Liaocheng City, Shandong Province, China (35°47–37°02′ N, 115°16’–116°32′ E) (Figure 1). The study area is the Yellow River floodplain in the western part of Shandong Province. The terrain is flat, and it belongs to the temperate monsoon climate. The average annual temperature in the study area is about 13.1 °C, and the average annual precipitation is 578.4 mm. The frost-free period in the study area is 193–201 days, and the annual average wind speed is 3.4 m/s. The forest stand types in the study area are mainly plantation forests, and the representative tree species, including Populus tomentosa Carrière, Salix matsudana Koidz., Robinia pseudoacacia L., Platanus orientalis L., Fraxinus chinensis Roxb., and Sophora japonica (L.) Schott.
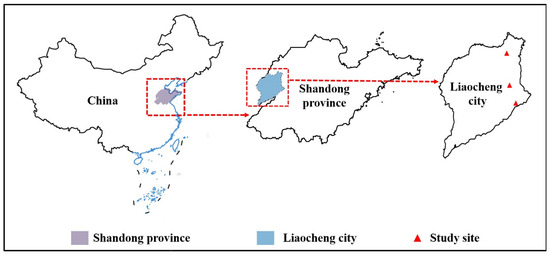
Figure 1.
Location of the study area.
2.2. Sample Plot Setting
In July and August 2022, we conducted an investigation of forest types in the study area. The investigation showed that the main forest stand types were Populus tomentosa pure forests, Populus tomentosa–Robinia pseudoacacia mixture forests, Platanus orientalis pure forests, and Salix matsudana pure forests. These four forest stand types were chosen as research objects. Firstly, according to the relevant literature [24], 20 m × 20 m sample plots were established with distances and boundaries exceeding 10 m. These sample plots were then numbered, including 20 Populus tomentosa pure forests, 18 Populus tomentosa–Robinia pseudoacacia mixture forests, 12 Platanus orientalis pure forests, and 18 Salix matsudana pure forests (Table 1). Secondly, all plants with a diameter at breast height (DBH) above 1 cm in the sample plots were marked and labeled. Finally, the height and DBH of the marked plants were recorded.

Table 1.
Overview of sample plots.
2.3. Samples Collection and Determination
Leaf samples were collected from six randomly selected healthy plants in each plot of pure forest stands and from three healthy plants (spaced >10 m apart) of each of the two species in mixed forest stands, using high pruning shears. Five to ten mature and healthy leaves were collected from the upper and middle parts of each plant in four directions. The leaves were placed in a plastic bag and brought to the laboratory for drying and pulverizing. Subsequently, they were sieved through a 10-mesh sieve and stored in a sealed bag for temporary preservation.
Soil samples were collected using a five-point sampling method from the four corners and center of the 1 m × 1 m small sample squares in each plot. We removed the surface litter layer and collected 0~10 cm soil samples with shovels. The soil sample was mixed evenly in a sealed bag, sieved 10-mesh, and sent to the laboratory for impurity removal, drying, crushing, and temporarily stored in a sealed bag.
The organic carbon content of the leaf and soil was determined using the potassium dichromate volumetric method. The total N content in the soil and leaf was measured using the Kjeldahl method, with the instrument being the Kjeldahl analyzer (KDY-9820). The total phosphorus content was determined using molybdenum-antimony resistance colorimetry and then determined using an ultraviolet spectrophotometer (UV-5900, Shanghai Metash Instruments Co., Ltd., Shanghai, China) [25].
2.4. Data Analysis
The homeostasis index (H) is determined through the following calculation method, the homeostasis model equation:
For easy understanding and calculation, Equation (1) can be log-transformed to linear form:
In Equation (2), where y is the content of leaf N and P or N:P ratio, x is the corresponding N and P content or N:P ratio of the soil, C is a constant, and H is the homeostasis index. When H < 0, H = −H. The magnitude of the H value is positively correlated with the plant’s homeostasis; a larger H value indicates a higher level of stability in the plant. If the regression relationship between lgy and lgx is not significant (p > 0.1), then the plant is considered to be “absolutely stable” [26]. If the regression relationship is significant, the data sets with H > 0 were defined as follows: H < 0.75 were sensitive, 0.75 < H < 2 were weakly sensitive, 2 < H < 4 were weakly homeostatic, and H > 4 were homeostatic [23].
Leaf C, N, P, and C:N:P ratios of the four forest stands were analyzed using one-way ANOVA (one-way analysis of variance), and the significance (p < 0.05) of any differences was determined. While C, N, P, and C:N:P ratios of the soil were analyzed using descriptive statistics. The correlations between leaf–soil C, N, P, and C:N:P ratios in four forest stand types were analyzed using Pearson correlation analysis; the “corrplot” package in R is used to perform Pearson correlation analysis [27]. A linear regression model was employed, utilizing soil stoichiometry as the independent variable and leaf stoichiometry as the dependent variable to examine the steady-state characteristics of various stands. To meet the assumptions of normality, a log-linear transformation of the data was applied. The “lm” function was used for regression analysis, and the “ggplot2” package was used for the regression graph [28]. All statistical analyses were conducted in R 4.2.2. [29].
3. Results
3.1. C, N, P, and C:N:P Ratios in Leaves
The C content varied significantly among different forest stand types (p < 0.05), with the C contents of leaves ranked in the following order: Pl > Sa > Po*Ro > Po (Figure 2a). There is a very significant difference in the N content of the leaves among the four forest stand types (p < 0.01), with the N contents of leaves ranked in the following order: Sa > Pl > Po*Ro > Po (Figure 2b). Furthermore, there is an extremely significant difference in the P content among the four forest stand types (p < 0.001), with the P contents of leaves ranked in the following order: Po*Ro > Po > Pl > Sa (Figure 2c). Additionally, a comparison reveals that the Populus tomentosa–Robinia pseudoacacia mixture forests have slightly higher C, N, and P content than the Populus tomentosa pure forests (Figure 2).
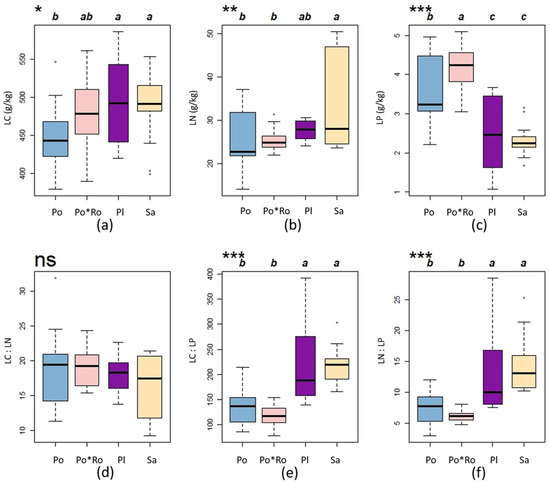
Figure 2.
The characteristics of the ecological stoichiometry in leaves among different forest stand types. Different lowercase letters indicate significant differences. LC represents leave C; LN represents leaves N; LP represents leaves P; blue represents Populus tomentosa pure forests; pink represents Populus tomentosa–Robinia pseudoacacia mixture forests; purple represents Platanus orientalis pure forests; yellow represents Salix matsudana pure forests; (a), (b), and (c) represent the C, N, and P content in leaves among four forest stand types, respectively; (d), (e), and (f)represent the C:N, C:P, and N:P ratios in leaves among four forest stand types, respectively; dot represents outliers. ns, no significance; * p < 0.05; ** p < 0.01; *** p < 0.001, the same is true below.
There is no significant difference in the C:N ratios in the leaves among the four forest stand types (p > 0.1) (Figure 2d). There is an extremely significant difference in the C:P ratios and N:P ratios among the four forest stand types (p < 0.001). The C:P ratios and N:P ratios of Platanus orientalis pure forests and Salix matsudana pure forests in leaves were significantly higher than those in leaves of the other forest stand types (Figure 2e,f).
3.2. C, N, P, and C:N:P Ratios in Soil
The C, N, and P contents of the soil exhibited highly significant variations across the four forest stand types. Specifically, in the Platanus orientalis pure forests, the mean values of soil C and N contents were significantly lower than in the other forest stand types, for 1.78 ± 0.78 g/kg and 0.58 ± 0.08 g/kg, respectively. The N contents of the soil showed very significant variations across the four forest stand types, while the C and N contents of soil ranked in the following order: Sa > Po*Ro > Po > Pl. The P contents in the soil of the Populus tomentosa pure forests were similar to that of the Populus tomentosa–Robinia pseudoacacia mixture forests, yet both were lower compared to the other two forest stand types (Table 2).
Table 2.
The characteristics of the C, N, P, and C:N:P ratios in soil among different forest stand types (mean ± SD). Different lowercase letters indicate significant differences.
The C:N ratio showed very significant differences among the four forest stand types, while the C:P and N:P of the soils of the four forest stand types showed extremely significant differences. Additionally, the ranking of C:P and N:P ratios for the four types of forest stands is Po*Ro > Po > Sa > Pl, and the ranking of C:N:P ratios for the four types of forest stands is Sa > Po*Ro > Po > Pl (Table 2).
3.3. Stoichiometric Relationships within the Leaf–Soil Continuum
In general, apart from the Platanus orientalis pure forests, the other three forest stand types exhibited a strong positive correlation between soil C to soil P ratio (SC:SP) and soil N to soil P ratio (SN:SP). Additionally, there was an extremely significant positive correlation between soil C (SC) and soil N (SN), while leaf N (LN) showed a significantly strong negative correlation with leaf C to leaf N ratio (LC:LN), as well as with leaf P (LP) and leaf C to leaf P ratio (LC:LP). By individually examining each forest stand type based on the correlation analysis results, it was evident that in the Populus tomentosa pure forests, there was a highly significant negative correlation between leaf N (LN) and soil C to soil N ratio (SC:SN), and a positive correlation between leaf C to leaf N ratio (LC:LN) and soil C to soil N ratio (SC:SN). There is a negative correlation of LP with SC:SP and SN:SP in Populus tomentosa–Robinia pseudoacacia mixture forest. In the Platanus orientalis pure stand, LC showed highly significant positive correlations with SC and SC:SN, and positive correlations with SC:SP. In the Salix matsudana pure forests, there is an extremely significant negative correlation between LN and SN but a highly significant positive correlation between LN and SC:SN (Figure 3).
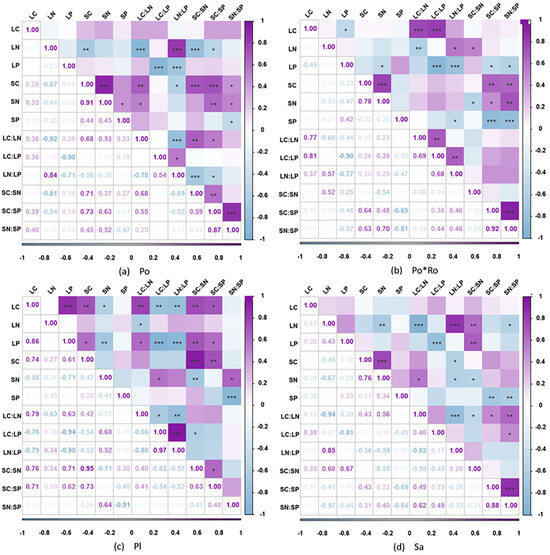
Figure 3.
Correlation analysis of leaf–soil C, N, P, and C:N:P ratios in four forest stand types. * p < 0.05; ** p < 0.01; *** p < 0.001.
3.4. Homeostasis Analysis of leaf N, P, and N:P Ratios
The homeostasis characteristics were different in leaf N, P, and N:P of different forest stands. The N of Populus tomentosa pure forests and Salix matsudana pure forests had weak homeostasis with H values of −2.84 and −2.38, respectively (Figure 4a,j). The N:P of Populus tomentosa–Robinia pseudoacacia mixture forests and Salix matsudana pure forests belonged to the homeostasis with H values of 10 and −4.92, respectively (Figure 4f,i). Except for the ones mentioned above, the rest are not significant (p > 0.1) in stoichiometry and belong to the absolute steady state (Figure 4).
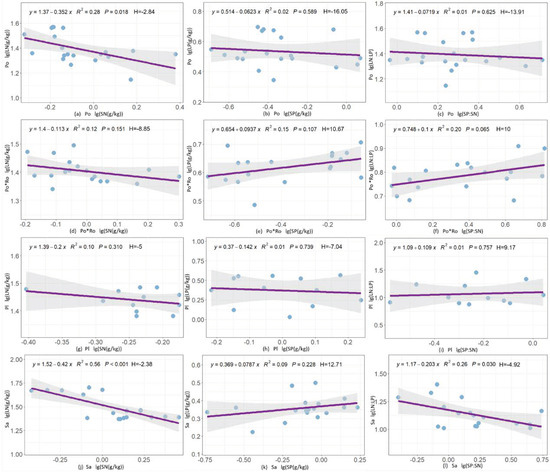
Figure 4.
Homeostasis analysis of leaf N, P, and N:P ratios in four forest stand types. Blue dots represent the data for each sample plot; Purple line represents the regression line between the soil and the leaves.
4. Discussion
4.1. C, N, P, and C:N:P Ratios of Leaf and Soil among Different Forest Stand Types
Except for Populus tomentosa pure forests (455.63 g/kg), the leaf C content of other forest stand types is higher than that of 492 species of terrestrial plants worldwide (464 g/kg) [30]. The leaf N and P contents of the four forest stand types are higher than the global scale N and P contents (20.60 and 1.99 g/kg), the national scale N and P contents (18.6 and 1.21 g/kg) [3]. However, through comparison, it was found that the N content in Platanus orientalis pure forests and Salix matsudana pure forests leaves is significantly higher than in other forest stand types. This may be due to the higher precipitation in this region compared to other areas, and Li [31] found that there is a positive correlation between leaf N content and precipitation through research. The large surface area of Platanus orientalis requires more N synthase for photosynthesis, which may also be a contributing factor to the high N content of Platanus orientalis pure stands’ leaves. In contrast to N, the concentration of P in leaves exhibited a decline as precipitation levels increased [31]. Consequently, the Platanus orientalis pure forests and Salix matsudana pure forests displayed lower P content in their leaves compared to the other two forest stands. Additionally, by comparing Populus tomentosa pure forests with Populus tomentosa–Robinia pseudoacacia mixture forests, it was found that the C, N, and P contents of the leaves in the Populus tomentosa–Robinia pseudoacacia mixture forests are higher than those in the Populus tomentosa pure forests. This phenomenon may be because forest stands composed of multiple species are more effective at utilizing environmental resources than forest stands composed of a single species.
Leaf C:N and C:P ratios represent the nutrient use efficiency and C assimilation capacity of plants. Research shows that the C:N and C:P ratios of leaves are inversely proportional to the efficiency of plants in utilizing N and P [32]. The N:P ratio serves as a metric for evaluating the extent to which a forest stand may be constrained by the availability of N and P elements (N:P < 14 indicates that the plant is limited by N supply, while N:P > 16 indicates a limitation in P supply. When 14 < N:P <16, it signifies that plants are restricted by both N and P availability) [9]. Among the four forest stand types in this study, Populus tomentosa pure forests, Populus tomentosa–Robinia pseudoacacia mixture forests, and Platanus orientalis pure forests mainly exist N limitation, and Salix matsudana pure forests are limited by both N and P elements. After comprehensive consideration, it is believed that the different tree species and environment are the primary driving factors causing this difference [21]. This answers the characterization and differences of C, N, P, and C:N:P ratios in the leaves of different stand types, as well as the limiting elements of different stands.
This study indicates that the average soil C, N, and P contents of the four vegetation groups were 4.58 g/kg, 0.96 g/kg, and 0.68 g/kg, respectively. This result aligns with findings from other studies conducted in the Yellow River floodplain sediments, which are located in a region somewhat comparable to our own research site [33,34]. Interestingly, the soil C and N content of the Platanus orientalis pure forests was particularly low, at 1.78 g/kg and 0.58 g/kg, respectively. This large difference can be ascribed to the varied soil properties and herbaceous cover [35] (Table 1), smaller herbaceous cover of Platanus orientalis pure forests in the study area resulting in low soil C content in the forest stand. Although the C and N contents in Platanus orientalis pure forests are low, the P content is notably high, reaching 1.04 g/kg. Litter and rock weathering are the main sources of soil P [36]. During the sample collection, we observed a thick layer of litter accumulating on the ground surface in the Platanus orientalis pure forests. Thus, a large litter accumulation could be responsible for higher P content in this region. Although the total phosphorus content in the soil was not deficient, the alkaline nature of the soil in the Platanus orientalis pure forests created limitations on phosphorus availability (Table 1). The alkaline conditions make phosphorus highly prone to soil fixation, resulting in reduced phosphorus activity and effective phosphorus content that can be utilized by trees for growth and development [19].
Soil C:N ratio usually reflects the mineralization ability and quality level of soil C and N, which is inversely proportional to the decomposition rate of organic matter and soil mineralization [37]. There was a significant difference in the soil C:N ratios among different forest stand types (p < 0.01). The C:P ratio can reflect the effectiveness of the P element and also measure the potential of microorganisms to release and fix P elements [38]. The average soil C:N ratio, C:P ratio, and N:P ratio were calculated as 4.68, 9.16, and 1.63, respectively, all lower than the national levels (C:N from 10.1 to 12.1, C:P ≈ 61.0, N:P ≈ 5.1) [39]. The low organic carbon content has resulted in a low C:N ratio. Our study findings indicate that the herbaceous cover in the four forest stands is relatively low (Table 1). Therefore, the organic matter produced through photosynthesis is reduced, which in turn affects carbon accumulation. Furthermore, all forest stands included in this study consist of planted forests with extremely low biodiversity. This lack of biodiversity can negatively influence ecosystem stability and disrupt the carbon cycle, ultimately limiting the accumulation of organic carbon. Additionally, the soil type in the study area is sandy soil, which has a low capacity for water and nutrient retention. This condition leads to the rapid decomposition of soil organic matter, consequently affecting the overall carbon content of the soil. All of the above reasons have resulted in excessively low soil carbon content in our study area. Probably, the parent material in these soils from the Yellow River plain present a high P content, as C:P ratio values were unusually low in this study. Therefore, the C:N and C:P ratios in our study are lower than those in other studies. In addition, the C:N ratio and C:P ratio demonstrate the high rate of soil organic matter decomposition and the high potential for retaining P in the study field soil, and this phenomenon is more obvious in the Platanus orientalis forest stands. The primary factor contributing to this occurrence is the comparatively lower levels of soil carbon and nitrogen in relation to national averages, while soil p levels are higher than national levels. This answers the stoichiometric characteristics of soil in different forest stand types.
4.2. Correlation Analysis of C, N, P, and C:N:P Ratios in Leaf–Soil of Four Forest Stand Types
The processes of C, N, and P cycling between plants and soils are fundamental components of ecosystems, and their correlation greatly impacts vegetation succession [37]. Numerous research investigations have demonstrated a strong correlation between the C, N, and P in both soil compositions and plants [38,40]. In the four forest stands we examined, there was no correlation between soil P and leaf P, which is in agreement with previous studies [10]. This phenomenon could be attributed to the diminished presence of P generated through microbial decomposition in the soil, hindering its reabsorption by plants. Consequently, a lack of association between leaf P levels and soil P content is observed [41]. In Populus tomentosa pure forests, there was a positive correlation between LC:LN and SC:SN, which indicated that soil C and N mainly originated from leaves, thus leading to a better correlation between leaves and soil. There was a notable positive relationship between SC and LC in Platanus orientalis pure forests. This suggests that the C in the soil significantly impacts the absorption of nutrients by plants, and the processes of C cycling within the leaf–soil system mutually affect each other. There was a negative correlation between LN and SN; SN:SP in Salix matsudana pure stands. The main reason for this phenomenon is that before the leaves fall, they fail to transfer nutrients to living organisms or less transfer, resulting in a large amount of N being retained in the litter. However, due to the close proximity of the Salix matsudana pure stands to the Yellow River, the soil moisture content is higher than the other three forest stands (Table 1), leading to the N in the litter being rapidly decomposed and returned to the soil. Various environmental factors play a crucial role in influencing the conversion and transformation of nutrients between plants and soil [42]. Hence, it is probable that environmental factors play a role in influencing nutrient elements that do not exhibit significant correlations in the leaf–soil cycling mechanisms across the four forest stands. This answers the third question we raised.
4.3. Evaluation of Plant Homeostasis
Plants are able to keep a consistent balance of nutrients by regulating their internal stability, which helps them maintain ideal growth levels and adjust to variations in external conditions like soil nutrients [23,43]. In terms of elemental N homeostasis, Populus tomentosa–Robinia pseudoacacia mixture forests and Platanus orientalis pure forests exhibit higher homeostatic levels compared to Populus tomentosa pure forests and Salix matsudana pure forests. For the Populus tomentosa–Robinia pseudoacacia mixture forests, this elevation in N homeostasis is primarily attributed to the nitrogen-fixing capabilities of Robinia pseudoacacia, which decreases the reliance of leaf N content on soil nutrient availability. Moreover, since N homeostasis is negatively correlated with soil C content, the lower soil C levels observed in Platanus orientalis pure forests may significantly contribute to their elevated N homeostasis. The HN:P ratio serves as a more accurate indicator of a plant’s ability to maintain nutrient homeostasis. Among the four forest types examined, Populus tomentosa pure forests and Platanus orientalis pure forests displayed higher N:P homeostasis than the Populus tomentosa–Robinia pseudoacacia mixture forests and Salix matsudana pure forests. This suggests that Populus tomentosa and Platanus orientalis forests tend to utilize nutrients more conservatively, which enables them to sustain slower growth rates even in nutrient-poor environments. In contrast, the Populus tomentosa–Robinia pseudoacacia mixture forests and Salix matsudana pure forests demonstrate greater adaptability to their respective environments [23]. In addition, among the four forest stands, the N, P, and N:P ratios of Platanus orientalis pure forests were in an absolutely stable state, indicating that Platanus orientalis pure forests have higher stability and dominance [17]. On the other hand, the N of Populus tomentosa pure forests and Salix matsudana pure forests are more adaptable to environmental changes. This analyses the homeostasis characteristics of different forest stands and answers the fourth question we asked. Due to this study only covering leaf–soil stoichiometric characteristics of the forest stands, further research on the stoichiometry characteristics of litter is lacking. Further studies should add stoichiometry characteristics of litter in the future to reveal the plantations C, N, and P and their stoichiometric relationships in the leaf–soil–litter system in order to provide theoretical guidance for the vegetation restoration of the degraded ecosystems in the Yellow River floodplain of western Shandong.
5. Conclusions
The study results indicate that the C:N and C:P ratios are lower than those in other studies. This may be due to low herbaceous cover and low biodiversity. Therefore, in future management practices, it is essential to increase herbaceous cover and biodiversity. In addition, our results reveal that Salix matsudana pure forests are limited by both N and P elements, while the other three forest stands are limited by N elements. Therefore, in future plantation management, appropriate N fertilizer should be considered to improve the situation of N limitation for plant growth. In future forest management, we can preferentially select some tree species with nitrogen-fixing plants, like leguminous mixed with other species. By optimizing the planting density and species combination of artificial forests, we can promote the interaction among plants within the forest stand, and, thereby, the utilization efficiency of nitrogen is enhanced.
Author Contributions
X.L. conceived the idea, planned the research, and designed the experiments. Material preparation, data collection, and analysis were performed by H.L. The first draft of the manuscript was written by H.L. All authors have read and agreed to the published version of the manuscript.
Funding
This work was supported by grants from the Key Research and Development Program of Liaocheng City (No. 2021GY01), the National Natural Science Foundation of China (No. 31901210), The Open Project of Liaocheng University Landscape Architecture Discipline (No. 31946221214), and the Doctoral Startup Fund of Liaocheng University (No. 318051822).
Data Availability Statement
Data are contained within the article.
Acknowledgments
We would like to thank Xijun Guo, Guimin Zhang, and Haixiang Shi for assistance with selecting the sample plot.
Conflicts of Interest
The authors declare no conflict of interest.
References
- Elser, J.; Hamilton, A. Stoichiometry and the New Biology: The Future Is Now. PLoS Biol. 2007, 5, 181–183. [Google Scholar] [CrossRef]
- Sterner, R.W.; Elser, J.J. Ecological Stoichiometry: The Biology of Elements from Molecules to the Biosphere; Princeton University Press: Princeton, NJ, USA, 2003. [Google Scholar] [CrossRef]
- Han, W.; Fang, J.; Guo, D.; Zhang, Y. Leaf nitrogen and phosphorus stoichiometry across 753 terrestrial plant species in China. New Phytol. 2005, 168, 377–385. [Google Scholar] [CrossRef]
- Sardans, J.; Janssens, I.A.; Ciais, P.; Obersteiner, M.; Peñuelas, J. Recent advances and future research in ecological stoichiometry. Perspect. Plant Ecol. 2021, 50, 125611. [Google Scholar] [CrossRef]
- Schade, J.D.; Kyle, M.; Hobbie, S.E.; Fagan, W.F.; Elser, J.J. Stoichiometric tracking of soil nutrients by a desert insect herbivore. Ecol. Lett. 2003, 6, 96–101. [Google Scholar] [CrossRef]
- Zhang, C.; Zeng, F.; Zeng, Z.; Du, H.; Zhang, L.; Su, L.; Lu, M.; Zhang, H. Carbon, Nitrogen and Phosphorus Stoichiometry and Its Influencing Factors in Karst Primary Forest. Forests 2022, 13, 1990. [Google Scholar] [CrossRef]
- Reich, P.B.; Tjoelker, M.G.; Machado, J.-L.; Oleksyn, J. Universal scaling of respiratory metabolism, size and nitrogen in plants. Nature 2006, 439, 457–461. [Google Scholar] [CrossRef]
- Reich, P.B. Global biogeography of plant chemistry: Filling in the blanks. New Phytol. 2005, 168, 263–266. [Google Scholar] [CrossRef]
- Tessier, J.T.; Raynal, D.J. Use of Nitrogen to Phosphorus Ratios in Plant Tissue as an Indicator of Nutrient Limitation and Nitrogen Saturation. J. Appl. Ecol. 2003, 40, 523–534. [Google Scholar] [CrossRef]
- Hu, Q.; Sheng, M.; Bai, Y.; Jie, Y.; Xiao, H. Response of C, N, and P stoichiometry characteristics of Broussonetia papyrifera to altitude gradients and soil nutrients in the karst rocky ecosystem, SW China. Plant Soil. 2022, 475, 123–136. [Google Scholar] [CrossRef]
- Li, M.; Sun, J.; Chen, X.; Liu, J. Leaf-soil stoichiometry and homeostasis characteristics of desert-related plants. Arid. Zone Res. 2024, 41, 104–113. [Google Scholar] [CrossRef]
- Van der Heijden, M.G.A.; Bardgett, R.D.; Van Straalen, N.M. The unseen majority: Soil microbes as drivers of plant diversity and productivity in terrestrial ecosystems. Ecol. Lett. 2010, 11, 296–310. [Google Scholar] [CrossRef]
- Bardgett, R.D.; Bowman, W.D.; Kaufmann, R.; Schmidt, S.K. A temporal approach to linking aboveground and belowground ecology. Trends Ecol. Evol. 2005, 20, 634–641. [Google Scholar] [CrossRef] [PubMed]
- Schreeg, L.A.; Santiago, L.S.; Wright, S.J.; Turner, B.L. Stem, root, and older leaf N:P ratios are more responsive indicators of soil nutrient availability than new foliage. Ecology 2014, 95, 2062–2068. [Google Scholar] [CrossRef]
- Hessen, D.O.; Gren, G.R.I.; Anderson, T.R.; Elser, J.J.; De Ruiter, P.C. Carbon sequestration in ecosystems: The role of stoichiometry. Ecology 2004, 85, 1179–1192. [Google Scholar] [CrossRef]
- Minden, V.; Kleyer, M. Internal and external regulation of plant organ stoichiometry. Plant Biol. 2014, 16, 897–907. [Google Scholar] [CrossRef]
- Zhang, T.; Liu, W.; Huang, J.; Hu, T.; Tang, D.D.; Chen, Q. Characteristics of plant ecological stoichiometry homeostasis. Guihaia 2019, 39, 701–712. [Google Scholar] [CrossRef]
- Zhao, Y.; Li, T.; Sun, J.; Liu, J.; Fu, Z. Study on ecological stoichiometry homeostasis characteristics of different halophytes in the Yellow River Delta. Land. Degrad. Dev. 2024, 35, 784–797. [Google Scholar] [CrossRef]
- Hu, T.; Xiong, K.; Yu, Y.; Wang, J.; Wu, Y. Ecological stoichiometry and homeostasis characteristics of plant-litter-soil system with vegetation restoration of the karst desertification control. Front. Plant Sci. 2023, 14, 1224691. [Google Scholar] [CrossRef] [PubMed]
- Urbina, I.; Grau, O.; Sardans, J.; Ninot, J.M.; Peñuelas, J. Encroachment of shrubs into subalpine grasslands in the Pyrenees changes the plant-soil stoichiometry spectrum. Plant Soil. 2020, 448, 37–53. [Google Scholar] [CrossRef]
- Liu, J.; Gou, X.; Wang, F.; Liu, J.; Zhang, F. Seasonal patterns in the leaf C:N:P stoichiometry of four conifers on the northeastern Tibetan Plateau. Glob. Ecol. Conserv. 2023, 47, e2632. [Google Scholar] [CrossRef]
- Wang, L.; Arif, M.; Zheng, J.; Li, C. Patterns and drivers of plant carbon, nitrogen, and phosphorus stoichiometry in a novel riparian ecosystem. Front. Plant Sci. 2024, 15, 1354222. [Google Scholar] [CrossRef] [PubMed]
- Persson, J.; Fink, P.; Goto, A.; Hood, J.M.; Jonas, J.; Kato, S. To be or not to be what you eat: Regulation of stoichiometric homeostasis among autotrophs and heterotrophs. Oikos 2010, 119, 741–751. [Google Scholar] [CrossRef]
- Bao, B.; Chang, M.; Jin, S.; Li, X.; Xie, H. Periodic Flooding Decoupled the Relations of Soil C, N, P, and K Ecological Stoichiometry in a Coastal Shelterbelt Forest of Eastern China. Forests 2023, 14, 2270. [Google Scholar] [CrossRef]
- Bao, S. Soil and Agricultural Chemistry Analysis; China Agricultural Press: Beijing, China, 2000. [Google Scholar]
- Hood, J.M.; Sterner, R.W. Diet mixing: Do animals integrate growth or resources across temporal heterogeneity? Am. Nat. 2010, 176, 651–663. [Google Scholar] [CrossRef] [PubMed]
- Wei, T.; Viliam, S. R Package ‘corrplot’: Visualization of a Correlation Matrix, (Version 0.92). 2021. Available online: https://github.com/taiyun/corrplot (accessed on 12 June 2024).
- Wickham, H. ggplot2: Elegant Graphics for Data Analysis; Springer: New York, NY, USA, 2016. [Google Scholar]
- The RDevelopment Core Team. R: A Language and Environment for Statistical Computing, v. 4.2.2; R Foundation for Statistical Computing: Vienna, Austria, 2022.
- Elser, J.J.; Fagan, W.F.; Denno, R.F.; Dobberfuhl, D.R.; Folarin, A.; Huberty, A.; Interlandi, S.; Kilham, S.S.; Mccauley, E.; Schulz, K.L.; et al. Nutritional constraints in terrestrial and freshwater food webs. Nature 2000, 408, 578–580. [Google Scholar] [CrossRef] [PubMed]
- Li, J.; Xu, W.; Xiong, G.; Wang, Y.; Zhao, C. Leaf nitrogen and phosphorus concentration and the empirical regulations in dominant woody plants of shrublands across southern China. Chin. J. Plant Ecol. 2017, 41, 31–42. [Google Scholar] [CrossRef]
- Hao, Y.; Zhou, L.; Wu, H.; Wang, S. Comparison of ecological stoichiometric characteristics of leaf-litter-soil in four types of Fraxinus mandshurica plantations. J. Nanjing For. Uni. 2019, 43, 101–108. [Google Scholar] [CrossRef]
- Wang, Y.; Yang, H.; Zhou, O.; Gulimia, I.; Duan, J.; Jia, L.; Xi, B. Chemical stoichiometry characteristics of various organs of trees in high-density Populus tomentosa pulp forests under water-nitrogen coupling. J. Beijing For. Univ. 2023, 45, 68–79. [Google Scholar] [CrossRef]
- Di, N.; Xi, B.; Jeremiah, R.P.; Wang, Y.; Li, G.; Jia, L. Root biomass distribution of triploid Populus tomentosa under wide- and narrow-row spacing planting schemes and its responses to soil nutrients. Chin. J. Plant Ecol. 2013, 37, 961–971. [Google Scholar] [CrossRef]
- Feng, X.; Yan, Y.; Zhang, X.; Zhang, C.; Geng, Z.; Hu, F.; Xu, C. Temporal and Spatial Variations of Soil Organic Carbon and the Influencing Factors in Shanxi Province in Recent 30 Years. Environ. Sci. 2024. [Google Scholar] [CrossRef]
- De La Casa, J.; Sardans, J.; Galindo, M.; Peñuelas, J. Stoichiometry of litter decomposition under the effects of climate change and nutrient enrichment: A meta-analysis. Plant Soil. 2024. [Google Scholar] [CrossRef]
- Bragazza, L.; Fontana, M.; Guillaume, T.; Scow, K.M.; Sinaj, S. Nutrient stoichiometry of a plant-microbe-soil system in response to cover crop species and soil type. Plant Soil. 2021, 461, 517–531. [Google Scholar] [CrossRef]
- Sardans, J.; Rivas-Ubach, A.; Peñuelas, J. The C:N:P stoichiometry of organisms and ecosystems in a changing world: A review and perspectives. Perspect. Plant Ecol. 2012, 14, 33–47. [Google Scholar] [CrossRef]
- Tian, H.; Chen, G.; Zhang, C.; Melillo, J.M.; Hall, C.A.S. Pattern and variation of C:N:P ratios in China’s soils: A synthesis of observational data. Biogeochemistry 2010, 98, 139–151. [Google Scholar] [CrossRef]
- Ballantyne, F., IV; Menge, D.N.L.; Ostling, A.; Hosseini, P. Nutrient recycling affects autotroph and ecosystem stoichiometry. Am. Nat. 2008, 171, 511–523. [Google Scholar] [CrossRef] [PubMed]
- Zheng, S.; Cha, X.; Sun, L.; Guo, H.; Zhao, Q.; Wei, X.; Wang, Y.; Dong, Q. Study on the Characteristics of Soil Ecological Stoichiometry and Non-Structural Carbon in Different Forest Ages of Fraxinus malacophylla. J. Nucl. Agric. Sci. 2024, 38, 364–373. [Google Scholar] [CrossRef]
- Jing, L.; Zhou, Y.; Lv, C.; Zhao, J.; Lei, G. Characterization of the soil and leaf C, N, and P stoichiometry of poplar plantations of three different stand ages in Dongting Lake wetland, China. Perspect. Plant Ecol. 2018, 38, 6530–6538. [Google Scholar] [CrossRef]
- Spohn, M. Element cycling as driven by stoichiometric homeostasis of soil microorganisms. Basic Appl. Ecol. 2016, 17, 471–478. [Google Scholar] [CrossRef]
Disclaimer/Publisher’s Note: The statements, opinions and data contained in all publications are solely those of the individual author(s) and contributor(s) and not of MDPI and/or the editor(s). MDPI and/or the editor(s) disclaim responsibility for any injury to people or property resulting from any ideas, methods, instructions or products referred to in the content. |
© 2024 by the authors. Licensee MDPI, Basel, Switzerland. This article is an open access article distributed under the terms and conditions of the Creative Commons Attribution (CC BY) license (https://creativecommons.org/licenses/by/4.0/).