Abstract
Abundant genetic variation among the geographical provenances of Juglans mandshurica. The biomass and allometry of 3-year-old J. mandshurica seedlings were studied among 21 Chinese provenances to understand the variations in biomass allocation in depth. Standardized major axis (SMA) regression analysis was used to analyze the allometry relationship between the organs and whole plants or between the organs of plants from different provenances. Pearson correlation analysis determined the correlation of various biomass traits and the geographical and climatic factors of provenances. Significant variations (p < 0.001) in seedling biomass and its distribution were observed among the different provenances. The root, stem, leaf, aboveground, and total biomasses of Hongshi, Ji’an, Fangzheng, and Kuandian provenances were the highest, but their root allocation and root–shoot ratios were all lower. This phenomenon is just the opposite in the Lushuihe provenance. An extremely marked positive correlation (p < 0.001) was detected among the root, stem, leaf, aboveground, and total biomasses, but there were significant negative correlations (p < 0.001) among the biomass allocation ratios (except between root allocation and root–shoot ratios). The organs, aboveground, and total biomasses were mainly positively affected by annual mean precipitation except for leaf biomass. The allometric growth relationship between the organs or between the organs (except roots) and whole plants of J. mandshurica changed remarkably among the provenances (p < 0.05). The organ–biomass allocation in J. mandshurica seedlings conspicuously varied among the different provenances, which was mainly caused by the genetic variations in the seeds. This study provided the basis for the selection of optimal provenances for J. mandshurica seedlings.
1. Introduction
Biomass is one of the primary biological and functional characteristics of plants, which reflects their biomaterial-accumulation status and the ability to use environmental resources [1]. The relative amount of biomass in the various components (root, stem, leaf, etc.), termed “biomass allocation,” is influenced by both genetic characteristics and environmental factors [2]. Biomass and its allocation to each organ of different plant species have a great diversity, even within species [3,4] or in half-sib families [5], due to genetic variations. However, this variation could also be caused by usual changes in body size [6,7]. Different organs of an organism naturally grow at defined rates; in some cases, in proportions, but not in others [8]. This growth pattern, called allometry or an allometric relationship, is used to reveal the nonlinear quantitative relationship between the organ and total biomasses or between the biomasses of two different organs [9]. It has been widely used in the study of the structures and functions of plant components [10,11], especially in the analysis of the relative growth relationship between plant–organ biomasses [12], becoming a crucial means to examine biomass allocation. Allometric growth analysis is also used to compare the growth relationships of plant organs among provenances or families and to determine whether the allometric growth trajectory changes between organs or between organs and individual plant sizes, laying a theoretical foundation for further revealing the effects of genetics on plant growth and biomass allocation [13,14,15].
Juglans mandshurica is the leading companion tree species in the mixed forests of broad-leaved trees and Pinus koraiensis in northeast China. It is widely distributed in the mountains of northeast China (Liaodong region and Changbai, Wanda, and Lesser Khingan Mountains) [16]. The wood material of J. mandshurica is of excellent quality, hard and dense, with a shiny and beautiful texture. Hence, it is widely used in the military, buildings, furniture, musical instruments, and sports equipment industries [17,18]. It also has great medicinal value, with the bark and leaves used as a medicine [19]. In addition, the seeds are highly nutritious and have a high oil content [20]. In conclusion, J. mandshurica is a precious woody, grain, and oil tree, having a high ecological and economic value.
Excessive logging has nearly exhausted the natural forests of J. mandshurica, and certain excellent germplasm resources have gradually reduced [21]. Thus, it is urgent to carry out scientifically sound and effective protection of such genetic resources. Understanding the genetic variation of J. mandshurica is a prerequisite for formulating scientific conservation strategies and also a basis for selecting the optimal provenances and families. Phenotypic trait analysis is a quick and straightforward method to ascertain genetic variations. Therefore, the variations in the early stages of offspring among the provenances were mainly studied with respect to the traits of tree height, ground diameter, diameter at breast height, and others [22,23]. However, only a few studies have analyzed variations in the biomass allocation of seedlings from different geographical provenances. In this study, 630 seedlings from 21 geographical provenances were used as research materials for measuring the biomass of each organ and comparing the differences in biomass and its distribution among provenances. Simultaneously, the relationship between geographical and climatic factors of the provenances with the seedling biomass and its allocation was analyzed. Allometric growth equations of the seedlings from the different provenances were developed. Allometric growth indices were applied to analyze the variations in the growth of seedlings from the different provenances. It was investigated whether the variations in seedling biomass allocation among the provenances were due to organ-specific allometric growth rates to understand the underlying mechanisms further. This study can provide a theoretical basis for the selection of provenances that will be optimal for J. mandshurica seedlings in the future.
2. Materials and Methods
2.1. Materials
The experimental materials were derived from 21 provenances: Kuandian (KD), Qingyuan (QY), Huanren (HR), and Fushun (FS) in the Liaoning Province; Fangzheng (FZ), Shangzhi (SZ), Taoshan (TS), Linkou (LK), Wuchang (WC), and Dashitou (DST) in the Heilongjiang Province; and Shihu (SH), Huinan (HN), Ji’an (JA), Wangqing (WQ), Lushuihe (LSH), Helong (HL), Sanchaizi (SCZ), Hunchun (HC), Hongshi (HS), Shulan (SL), and Jiaohe (JH) in the Jilin Province (Figure 1). A field investigation was conducted from December 2018 to February 2019 to determine the seed collection stands in the provenance areas. Those selected were the natural stands of J. mandshurica, with a canopy density of ≥0.7, an area of >10 hm2, and an average age of 40–60 years. From the candidate stands, 30 excellent trees were selected for each provenance based on the selection principle of the excellent trees, and seeds were collected at the same time. The distance between them was >50 m, and their geographical location and altitude were recorded. Seeds were collected in October 2019. In total, 30 seeds were selected for each excellent tree, and all the seeds (a total of 900 seeds) selected from 30 excellent trees in each provenance were mixed and considered the representative seeds of that provenance. All the seeds from 21 provenances were treated with mixed sand stratification to promote germination before sowing. The experiment was conducted in a completely randomized block design with three blocks, each block containing 21 plots and 1 plot per provenance. In total, 300 seeds were sown using the dibble sowing method in each plot with a density of 0.3 m × 0.3 m in 2020. During the growth period, loosening soil, weeding and watering should be carried out in a timely manner. The same care and management measures were adopted for seedlings from all provenances. The average values of latitude, longitude, altitude, and climatic factors of the 30 excellent trees during positioning in the various provenances are shown in Table 1. According to the geographical location of different provenances, climate factors, such as the annual mean temperature and precipitation for many years, were obtained from Worldclim Download of Global Climate Date http://worldclim.org (accessed on 5 January 2020) using ArcGIS 10.2 software [24].
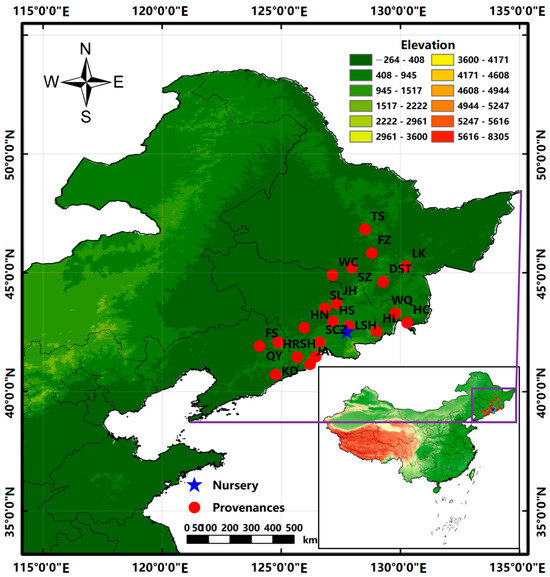
Figure 1.
Map showing the provenances and nursery location.

Table 1.
Geographical allocation, air temperature, and precipitation of the sites from the 21 provenances selected for the collection of J. mandshurica.
2.2. Study Area
The experimental site was located in the Hongwei Nursery of the Lushuihe seed orchard (127°45′ E, 42°32′ N), Baishan City, Jilin Province (Figure 1), at an altitude of 635 m. The annual mean temperature was about 2.9 °C, the lowest average monthly temperature was −40.5 °C, the highest average monthly temperature was 20.2 °C, the average yearly sunshine duration was 2398 h, the annual mean precipitation was 894.00 mm, and the average yearly frost-free period was 110 d. The area has a temperate monsoon climate, and the soil was mainly dark brown with a small amount of white pulpy soil.
2.3. Biomass Acquisition and Measurement
At the end of August 2022, 20 seedlings were randomly selected from each provenance to obtain a total of 420 plants from the 21 provenances for biomass collection. Each seedling was completely removed from its microenvironment in strict accordance with the sampling standards of the “full excavation method”. The soil of the roots was carefully washed with water while keeping the roots intact, and the roots were air-dried in a cool and ventilated place. The roots, stems, and leaves of each seedling were separated, dried at 80 °C in the oven to constant weight, and weighed on an analytical balance (Ohaus, NJ, USA, accuracy 0.0001 g) to obtain the dry weight, i.e., the biomass of each organ. The total biomass (root + stem + leaf biomass), aboveground biomass (stem + leaf biomass), allocation ratio per organ (biomass per organ/total biomass), and root–shoot ratio (root biomass/aboveground biomass) were calculated.
2.4. Data Analysis
Microsoft Excel 2010 was used to sort out and analyze the data. The IBM SPSS 27.0 software package was employed for variance analysis of the organ, aboveground, and total biomasses, along with the allocation ratio of each organ and root–shoot ratio. The Levene test was first used to analyze the homogeneity of variance, and the LSD method was employed for multiple comparisons when the variance was homogeneous and ANOVA results showed significant differences. When the variance was not homogeneous, the Welch test was used to analyze the differences among provenances. When the results of the Welch test showed significant differences, the Tamhane method was employed for pairwise comparison. The R language “corrplot” package was utilized for Pearson correlation analysis and to draw a correlation heat map of the biomass traits with the geographical and climatic factors of provenances.
Based on the biomass data of the twenty seedlings from each provenance, the allometric growth equation between any two organs or between the total biomass and the biomass of each organ was developed. The equation was expressed as a power function () [25]. The linear conversion was (). lg represents a logarithmic function with base 10, Y and X represent the organ biomass and total biomass or the biomass of two different organs, represents intercept, and represents slope, which is the allometry index. When , the growth rate was equal, and when , it was allometric [26]. The equations between the organs and whole plants or organs of plants were obtained by standardized major axis (SMA) regression analysis for different provenances [27]. The optimal slope and 95% confidence interval (CI) were obtained, and the significance of the variations among the slopes of different provenances or between a slope and 1.0 were compared. A slope significantly different from 1.0 indicated an allometric growth relationship. On the contrary, proximity to 1.0 represented an isokinetic growth relationship. Multiple comparisons continued if the difference among the slopes was marked; if not, the common slope and its 95% CI were considered. Moreover, it was further analyzed whether a variation in the Y-axis direction (significance of the intercept difference) among the comparison data groups under the common slope occurred, and multiple comparisons were made if the difference was significant. The SMA analysis was performed using the Smatr Version 2.0 software of R. Allometric growth equation curves of the different provenances were plotted using the Origin 2022 software.
3. Results
3.1. Biomass of J. mandshurica Seedlings
The results of the variance analysis are shown in Table 2. The biomass of each organ (root, stem, leaf, and aboveground) and the total biomass among different provenances varied markedly (p < 0.001). Analyses of the means and multiple comparisons are shown in Table 3. The total biomass of HS plants was the most prominent (55.35 g); there was no remarkable difference among HS, JA (45.70 g), FZ (44.63 g), SCZ (43.51 g), and KD (42.42 g) plants, but there were significantly more than the other provenances. The total biomass of the plants from LSH (12.39 g) was the least. The maximum biomass (HS) was 4.47-fold higher than the minimum (LSH). Similarly, the aboveground biomass of HS plants was the most extensive (28.07 g). There was no conspicuous difference among HS, FZ (24.47 g), JA (24.32 g), KD (22.46 g), and SL (18.84 g) plants. The smallest aboveground biomass was of the plants from LSH (4.54 g), which accounted for only 16.17% of that of HS. The root, stem, and leaf biomasses of HS, JA, FZ, and KD plants were all the largest, and those of LSH plants were the smallest.
Table 2.
Variance analysis for organ biomass and allocation ratio of J. mandshurica seedlings among different provenances.
Table 3.
Biomass of the J. mandshurica seedlings from the different geographical provenances.
For each provenance, the order of organ allocation ratios of plants was root > stem > leaf (Figure 1). There were extreme variations in the biomass allocation ratios among the different provenances (p < 0.01) (Table 2). The root allocation ratios of HR (0.655), LSH (0.643), HC (0.642), and SCZ (0.635) plants were the largest, while those of QY (0.440) and FZ (0.442) plants were the smallest. The stem allocation ratios of QY (0.428) and FZ (0.423) plants were the highest, followed by TS, WQ, JA, and others, with that of HC plants (0.227) being the least. The leaf allocation ratios of DST (0.201) and KD (0.168) plants were the largest, while those of TS (0.090), HL (0.081), and LSH (0.057) plants were the smallest. The root–shoot ratios of HC and HR plants were the greatest, both >2.0; those of KD, JA, WQ, QY, and FZ plants were <1.0; and those of the plants from the remaining provenances ranged from 1.0 to 2.0 (Figure 2). Combined with biomass analysis, the root, stem, leaf, aboveground, and total biomasses of HS, JA, FZ, and KD plants were all highest, while the root biomass allocation and root–shoot ratios of these provenances were lower. On the contrary, the organ, aboveground, and total biomasses of plants from the LSH provenance were the least, but the root biomass allocation and root–shoot ratio were all larger.
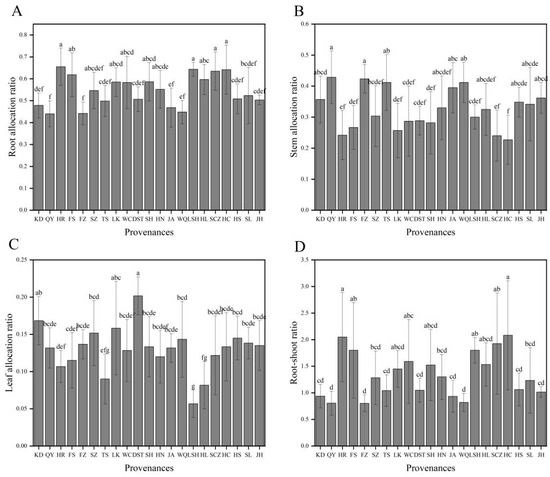
Figure 2.
Organ allocation ratios of J. mandshurica seedlings from the different geographical provenances. Notes: (A–D) indicate root, stem, and leaf allocation ratios and root–shoot ratios of different provenances, respectively. Varying lowercase letters indicate statistically significant differences (p < 0.05).
3.2. Allometric Growth Relationship between the Organs and Whole Plants for J. mandshurica Seedlings
There were significant or extremely significant allometric or isokinetic growth relationships between the whole plants and roots (except SL), stems (except HR, LK, WC, SH, HN, HL, and HC), leaves (except FS, SZ, LK, HL, SCZ, HC, and JH), and the aboveground parts (except HR, FS, WC, HN, HL, and HC) (Table 4). The total plant and root biomasses were used as the independent and dependent variables, respectively. The allometric growth equations of all provenances were fitted. There was no marked variation in allometry growth indices (slopes) among the different provenances (p > 0.05). Therefore, there was a common slope of 1.058 (95% CI = 0.965–1.162), indicating the consistency of the growth trajectories of the roots of the plants from the different provenances (Table 4, Figure 3A). The slopes of QY, HR, LK, WC, DST, HN, WQ, HL, HC, and JH plants were conspicuously higher than the theoretical value of 1.0 (p < 0.05), suggesting that the root growth rates were remarkably more elevated than the plant growth rates. However, the slopes of KD, SZ, and TS seedlings were significantly < 1.0 (p < 0.05), indicating a markedly lesser root growth rate than the whole plant growth rate. There were no remarkable differences between the allometric growth indices for FS, FZ, SH, JA, LSH, SCZ, and HS plants and 1.0 (p > 0.05), stipulating that the roots and whole plants grew at an equal rate. Under a common slope, the allometry equation y-intercept was the largest for LSH, i.e., when the whole plants were the same size, the root biomass of LSH plants was the largest (Table 4, Figure 3A).
Table 4.
Allometric growth relationship between the organs and whole plants of J. mandshurica seedlings from the different geographical provenances.
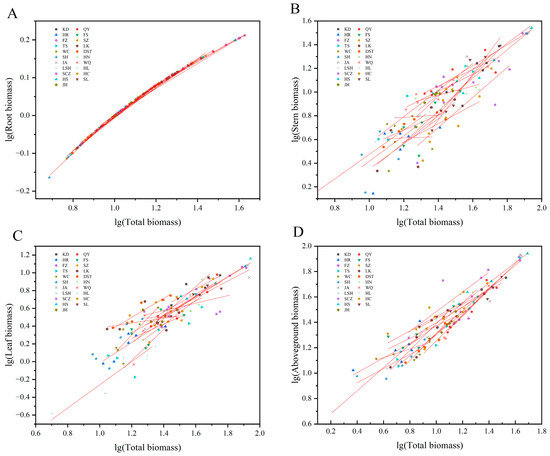
Figure 3.
Allometric growth relationship between the organs of J. mandshurica seedlings and the whole plants from the different geographical provenances. Notes: (A–D) indicate the allometric growth equations fitted between the total biomass and root, stem, leaf, and aboveground biomass of plants from the different provenances, respectively.
The slopes between the whole plants and stems, whole plants and leaves, and whole plants and aboveground parts were all markedly varied among the provenances (p< 0.05), with no common slope. These results indicated that the allometric growth trajectories of the aboveground organs of the J. mandshurica seedlings from the different provenances had changed significantly when the total plant biomasses were used as independent variables (Table 4, Figure 3B–D). The stem growth rate was substantially higher than the whole plant growth rate for KD, FS, SZ, TS, JA, SCZ, HS, SL, and JH plants because the allometry growth indices were significantly > 1.0 (p < 0.05). The stem growth rates of QY, FZ, DST, and WQ plants were considerably lower than the whole plant growth rates (p < 0.05). The stem growth rates of LSH plants were elevated at the same pace as the whole plant growth rate. The leaf growth rate was significantly higher than the whole plant growth rate for KD, QY, HR, FZ, TS, WC, DST, SH, HN, WQ, LSH, HS, and SL plants. The leaves grew at the same rate as the whole plants in JA (Table 4, Figure 3B,C). The aboveground parts growth rates of KD, SZ, TS, SH, SCZ, HS, and SL plants were markedly more than the whole plant growth rates, while it was the opposite in QY, FZ, LK, DST, and WQ plants. The aboveground parts grew at the same rate as the whole plants in JA, LSH, and JH (Table 4, Figure 3D).
3.3. Allometric Growth Relationship between the Organs of J. mandshurica Seedlings
Significant or extremely significant allometric or isokinetic growth relationships were observed between roots and stems (except WC and HL), roots and leaves, stems and leaves (except LK, HL, and JH), and aboveground parts and roots (except WC) in J. mandshurica seedlings (Table 5). The slopes between roots and stems, roots and leaves, stems and leaves, and aboveground parts and roots varied remarkably among the different provenances (p < 0.05), with no common slope. These results indicated that the allometric growth trajectories of the different organs of J. mandshurica seedlings changed significantly (Figure 4). The slopes of the equations fitted by the roots and stems from the plants of different provenances ranged from 0.317 to 1.754. Among these, the slopes of KD, HR, FS, SZ, TS, LK, DST, SH, JA, LSH, SCZ, HS, and SL plants were significantly < 1.0 (p < 0.05), while those of QY, FZ, HN, WQ, and JH plants were substantially > 1.0 (p < 0.05), showing an allometric growth relationship. The slope of HC plants did not significantly differ from 1.0, indicating an isokinetic growth relationship. The QY, FZ, HN, WQ, and JH plants demonstrated higher root growth rates compared with the stem growth rates, while the opposite was observed in KD, HR, FS, SZ, TS, LK, DST, SH, JA, LSH, SCZ, HS, and SL plants (Table 5, Figure 4A). The slopes of the equations fitted by roots and leaves from the different provenances ranged from 0.539 to 1.550. The root growth rates of KD, QY, HR, FS, SZ, TS, WC, SH, HN, WQ, LSH, HL, HS, and SL plants were markedly lesser than the leaf growth rates, while the opposite was detected in LK, SCZ, and JH plants. The roots and leaves of FZ, DST, JA, and HC plants had an isometric growth relationship (Table 5, Figure 4B). The slopes of the equations fitted by stems and leaves from the plants of the different provenances ranged from 0.410 to 1.721. The stem growth rates of KD, HR, FS, SZ, JA, SCZ, and SL plants were conspicuously more than leaf growth rates, while the opposite was observed in QY, FZ, TS, WC, DST, SH, HN, WQ, and LSH plants. The stems grew at the same rate as the roots in HC and HS plants (Table 5, Figure 4C). The slopes of the equations fitted by aboveground parts and roots from the different provenances ranged from 0.550 to 2.729. The aboveground part growth rates of KD, HR, FS, SZ, TS, SH, LSH, HS, and SL plants were remarkably higher than the root growth rates, while the contrary was seen in QY, FZ, LK, DST, HN, WQ, HL, HC, and JH plants. The aboveground parts of JA and SCZ plants grew at the same rate as the roots (Table 5, Figure 4D).
Table 5.
Allometric growth relationship between the organs of J. mandshurica seedlings from the different geographical provenances.
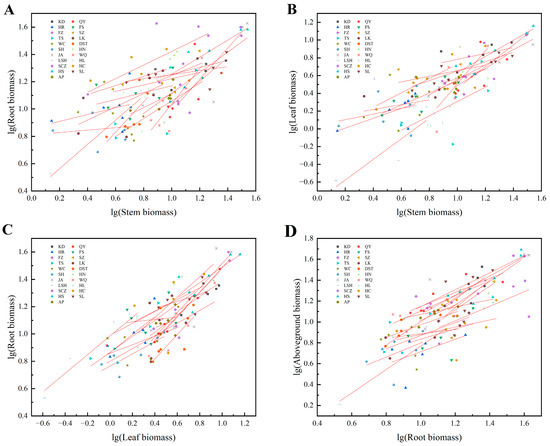
Figure 4.
Allometric growth relationship between the organs of J. mandshurica seedlings from the different geographical provenances. Notes: (A–D) indicate the allometric growth equations fitted between stem and root biomass, stem and leaf biomass, leaf and root biomass, root and aboveground biomass of plants from different provenances, respectively.
3.4. Correlations Analysis of Various Biomass Traits and Geographical and Climatic Factors
The analysis of the correlations between traits is shown in Figure 5. A highly significant positive correlation (p < 0.001) was observed between the root, stem, leaf, aboveground, and total biomasses. The most significant correlation coefficient was 0.99 (between stem and aboveground biomasses), followed by 0.95 (between aboveground and total biomasses), 0.94 (between root and total biomasses), 0.92 (between stem and total biomasses), 0.91 (between leaf and aboveground or total biomasses), 0.83 (between stem and leaf biomasses), 0.80 (between root and leaf biomasses), 0.79 (between root and aboveground biomasses), and 0.74 (between root and stem biomasses).
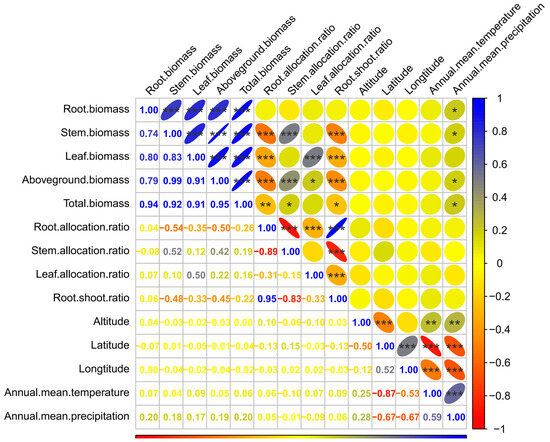
Figure 5.
Correlation analysis of various biomass traits and the geographical and climatic factors. * indicates a statistically significant correlation at p < 0.05 level; ** indicates an extremely significant correlation at p < 0.01 level; *** indicates an extremely significant correlation at p < 0.001 level.
The correlations between root allocation ratio and stem, leaf, aboveground, and total biomass were significantly negative (p < 0.01), with respective values of −0.54, −0.35, −0.50, and −0.26. A similar relationship appeared between the root–shoot ratio and the biomass of each organ (except root), with respective values of −0.48, −0.33, −0.45, and −0.22. A remarkable positive correlation was found between the stem allocation ratio and stem (0.52), or aboveground (0.42), or total biomasses (0.19). The leaf allocation ratio also had a marked positive correlation with leaf (0.50) and aboveground biomasses (0.22). There were significant negative correlations between the biomass allocation ratios (except between root allocation and root–shoot ratios). The root allocation ratio was remarkably positively correlated with the root–shoot ratio and had a correlation coefficient of 0.95 (p < 0.001).
Among the geographical and climatic factors, only the annual mean precipitation had a significant correlation with the biomass of each organ (except leaf biomass), aboveground, and total biomasses, and the correlation was positive. There was no significant correlation between the annual mean precipitation and biomass allocation ratio of each organ. The correlation coefficients between the annual mean precipitation and root, stem, aboveground, and total biomasses were 0.20, 0.18, 0.19, and 0.20, respectively. Other factors, such as altitude, latitude, longitude, and annual mean temperature, had no remarkable associations with the biomass and biomass allocation ratio of each organ.
4. Discussion
4.1. Biomass and Its Allocation in Seedlings of J. mandshurica from Different Provenances
In the same growing environment, the target traits of J. mandshurica have significant variation in provenances and families, which is called genetic variation [28,29,30]. Therefore, J. mandshurica has great potential for genetic improvement. In this study, the seedlings of J. mandshurica from 21 provenances were compared and analyzed from the perspective of biomass and its allocation. Significant differences were found among the 21 provenances regarding the total biomass, biomass of each organ, biomass allocation ratio of each organ, or root–shoot ratio (Table 2 and Table 3, Figure 2). These results were similar to the biomass and its allocation in Picea likiangensis [31] and Pinus brutia [32] at the seedling stage. In a study of the broad-leaved tree Quercus castaneifolia, the biomasses of roots, stems, and leaves and their distribution were also significantly different among different provenances [33]. Under the same growth environment, cultivation measures, and growth period, the seedlings showed different growth trends and biomass distribution patterns, which was mainly due to genetic differences. As a result, their ability to respond to the same environment during growth was inconsistent [34]. The provenance-specific variations in biomass and its allocation for J. mandshurica seedlings provided the basis for the early selection of superior provenances. The root, stem, leaf, aboveground, and total biomasses of HS, JA, FZ, and KD plants were all highest, while the root biomass allocation and root–shoot ratios of these provenances plants were lower. The phenomenon was exactly reversed in LSH. These results showed inconsistent synergistic changes between the organ or total biomasses and root allocation or root–shoot ratios of J. mandshurica seedlings from the different provenances. Similar results have been found in the studies of Pinus yunnanensis [35] and Machilus pauhoi [36]. It is known that allocation to roots enhances with increasing stress, such as a decrease in nutrient levels, water availability, or temperature [37,38,39]. In a stressful environment, roots use relatively more nutrient resources for plant survival, leaving less for the shoots [40,41]. Plants from LSH (native provenance) had the least root, stem, leaf, aboveground, and total biomasses but the most root biomass allocation and root–shoot ratios, indicating that they had more robust resistance to stress. This is mainly because the native provenance has a high degree of adaptability to the local natural and cultivated conditions and has strong tolerance and resistance to local adverse climatic conditions and diseases and pests [42]. This ability is the result of the long-term adaptation of the plants to the environment [43]. The organs and total biomasses of HS, JA, FZ and KD were significantly higher than those of the local provenance LSH, so they could be selected as excellent provenances for the area under suitable environmental conditions [44].
4.2. Allometric Growth Relationship of J. mandshurica Seedlings from Different Provenances
Plants have an extraordinary ability to coordinate the growth rates of their organs to ensure a tight balance between the biomass invested in the shoots and roots. Pearsall proved this concept for the first time by applying allometric growth analysis to plants [45]. In such an analysis, a robust linear relationship exists between the lg-transformed biomass of the shoots and roots. Parameter (slope or intercept) analysis of simulated lines can reveal the difference and contrast between the parts and whole or parts and other parts of a species or a class of species [46]. Due to ontogenetic drift, plant biomass allocation may vary with plant size, i.e., variations in biomass allocation may be caused only by differences in plant size, and allometric growth trajectories between organs or between organs and plant size do not change markedly [46,47]. In this study, the stems and whole plants, leaves and whole plants, and aboveground parts and whole plants of J. mandshurica from different geographical provenances exhibited both allometric and isokinetic growth. The allometric growth index showed remarkable variations among the different provenances (Table 4), i.e., the allometric growth trajectories between the stems, leaves, aboveground parts, and plants of J. mandshurica changed markedly. The same phenomenon also occurred between the organ biomasses (Table 5). These results indicated that the variations in biomass allocation among the seedlings from the different provenances were due to divergent relative growth rates between the organs or between organs and individual size, not only caused by the alterations in the size of each individual [14]. The allometric trajectories of roots and the whole plants biomasses of J. mandshurica seedlings were identical, indicating that the root biomass of plants from the different provenances increased in equal allometry index with plant growth [48]. According to the allometric growth relationship theory, a constant allometric growth index occurs between any two organs of plants on a global scale [25]. An isokinetic growth relationship with an allometric growth index of 1 was observed between the aboveground and belowground biomasses, while a constant power exponential allometry relationship (at 3/4) occurred between leaf and belowground biomasses [9]. Nevertheless, many actual survey data studies have found an incongruous allometry index between organs or between the organ and individual size of a plant at a small scale [12], which may be caused by variations in genetic characteristics determined by systematic taxonomic status [6]. In this study, there was no conspicuous variation in the allometry indices between the root and whole plant biomass among the different provenances, and there was a common slope. An isokinetic growth relationship was detected between the aboveground and belowground biomass in the plants of JA and SCZ. These results were consistent with theoretical predictions. However, the plants of 18 provenances (except JA, SCZ, and WC) revealed an allometric growth relationship between the aboveground and belowground biomass, with allometric growth indices significantly greater than or less than 1.0, respectively. Additionally, the plants from four provenances demonstrated equal leaf and root growth rates. These results were inconsistent with the theoretical hypothesis. Despite belonging to the same species, no consistent allometric growth indices were detected between the organs of J. mandshurica seedlings from the different provenances, which suggested that the variations in the genetic characteristics of J. mandshurica seedlings might be caused by the long-term influence of geographical and climatic factors of the different provenances [35]. The variation in this allometric relationship between the same species has even been observed in families and clones [6,15]. The genetics-based variation in allometric growth indices between the various organs of J. mandshurica from the different provenances provided the possibility for the early selection of superior provenances of J. mandshurica.
4.3. Correlations of the Biomass Traits, Allocation Rates in J. mandshurica, and Geographical and Climatic Factors
A robust positive correlation between root, stem, leaf, aboveground, and total biomasses has often been reported in several studies [49,50]. Similar results were observed in this study, i.e., there was a very significant positive correlation between biomass traits. The root allocation and root–shoot ratios were negatively correlated with stem, leaf, aboveground, and total biomasses [51]. Geographical and climatic factors can enhance the genetic variations among J. mandshurica populations, and the long-term selection of ecological factors in the different geographical provenances can lead to specific adaptive variations among the J. mandshurica populations [28,52]. Water is the basic condition for plant photosynthesis, growth, and reproduction; sufficient precipitation helps plants to absorb more nutrients and thus promotes the increase in biomass. In 1984, Brown and Lugo [53] studied the relationship between tropical forest vegetation growth and precipitation, and the results showed that suitable precipitation could promote the accumulation of plant biomass. In this study, the correlation analysis of biomass and its allocation in J. mandshurica seedlings with the geographic and climatic factors of provenances indicated that the organs, aboveground, and total biomasses were mainly positively affected by the annual mean precipitation, except for leaf biomass (Figure 5). This result was similar to that of Liu’s study on the effects of forest age and climate factors on the organ biomass of several typical pine forests [54]. In Liu’s study, annual mean precipitation had a significant positive correlation with the aboveground biomass of Pinus massoniana and the trunk, branch, and aboveground biomass of Pinus tabulaeformis, and it had no significant correlation with the leaf biomass of the two species.
5. Conclusions
This study investigated the biomass allocation and allometry of J. mandshurica seedlings from different provenances, which varied significantly due to different relative growth rates between the organs of plants or between the organs and whole plants. The root, stem, leaf, aboveground, and total biomass of the plants from the HS, JA, FZ, and KD provenances were the highest, but their root allocation and root–shoot ratios were lower. There were not always synergistic changes between the organ biomass or total biomass and root allocation ratios or root–shoot ratios of J. mandshurica seedlings from different provenances. The organ and total biomasses were mainly affected by annual mean precipitation except for leaf biomass. The varying allometry relationships between the organs of J. mandshurica plants from the various provenances led to different biomass allocation patterns, which further reflected the rich genetic variation of J. mandshurica among the geographical provenances. Compared with the whole plant growth rates, SL and SZ plants had higher stem growth rates, while WC plants had elevated leaf growth rates. In spite of this, the allometric growth relationship of plants might change with age [12], so this raises the questions of whether the biomass allocation and allometry from infancy to maturity would show greater differentiation due to genetic differences in the provenance region with the growth of J. mandshurica seedlings, or whether there will be a synergistic change in biomass allocation and allometry due to the same breeding environment in the later stage? A long-term follow-up study is needed in the future.
Author Contributions
Conceptualization: F.W. and Y.Y. (Yuchun Yang); Date curation: F.W., Y.Y. (Yelei Yang) and Y.L.; Formal analysis: F.W. and Y.Y. (Yelei Yang); Funding acquisition: Y.Y. (Yuchun Yang); Investigation: F.W., J.W. and Y.L.; Methodology: F.W. and Y.L.; Project administration: J.W.; Resources: H.W. and Y.S.; Supervision: J.W. and Z.L.; Validation: Y.Y. (Yelei Yang); Writing—original draft: F.W.; Writing—review and editing: Y.Y. (Yuchun Yang) and Z.L. All authors have read and agreed to the published version of the manuscript.
Funding
The authors declare that this study received funding from the Jilin Province Science and Technology Development Plan Project (No. 20230508006RC). The funder was not involved in the study design, collection, analysis, interpretation of data, the writing of this article, or the decision to submit it for publication.
Data Availability Statement
The data are available from the corresponding author on reasonable request.
Acknowledgments
The authors would like to thank all the staff at the Hongwei Nursery of the Lushuihe seed orchard for the acquisition of the samples and their assistance in the completion of the study. We also thank Bullet Edits Limited for the linguistic editing and proofreading of the manuscript.
Conflicts of Interest
Authors Hongyan Wang and Yanying Song were employed by the company Jilin Forestry Industry Lushuihe Forestry Co., Ltd. The remaining authors declare that the research was conducted in the absence of any commercial or financial relationships that could be construed as a potential conflict of interest.
References
- Poorter, H.; Niklas, K.J.; Reich, P.B.; Oleksyn, J.; Poot, P.; Mommer, L. Biomass allocation to leaves, stems and roots: Meta-analyses of interspecific variation and environmental control. New Phytol. 2012, 193, 30–50. [Google Scholar] [CrossRef] [PubMed]
- Li, B.; Suzuki, J.I.; Hara, T. Competitive ability of two Brassica varieties in relation to biomass allocation and morphological plasticity under varying nutrient availability. Ecol. Res. 2010, 14, 255–266. [Google Scholar] [CrossRef]
- Aranda, I.; Alia, R.; Ortega, U.; Dantas, A.K.; Majada, J. Intra-specific variability in biomass partitioning and carbon isotopic discrimination under moderate drought stress in seedlings from four Pinus pinaster populations. Tree Genet. Genomes 2010, 6, 169–178. [Google Scholar] [CrossRef]
- De-Miguel, S.; Pukkala, T.; Assaf, N.; Shater, Z. Intra-specific differences in allometric equations for aboveground biomass of eastern Mediterranean. Pinus brutia. Ann. For. Sci. 2014, 71, 101–112. [Google Scholar] [CrossRef]
- Ingwers, M.W.; Mcguire, M.A.; Aubrey, D.P.; Bhuiyan, R.A.; Teskey, R.O. Half-sibling loblolly pine clones exhibited intraspecific variation, a G × E interaction, and differences in stable isotope composition in response to soil moisture availability. Environ. Exp. Bot. 2017, 138, 88–98. [Google Scholar] [CrossRef]
- Chmura, D.J.; Guzicka, M.; Rokowski, R.; Chalupka, J. Variation in aboveground and belowground biomass in progeny of selected stands of Pinus sylvestris. Scand. J. For. Res. 2013, 28, 724–734. [Google Scholar] [CrossRef]
- Sillett, S.C.; Pelt, V.R.; Carroll, L.A.; Jim, C.; Coonen, E.J.; Iberle, B. Allometric equations for Sequoia sempervirens in forests of different ages. For. Ecol. Manag. 2019, 2019, 433–447. [Google Scholar] [CrossRef]
- Noriyuki, O.; Hiroshi, T.; Akio, F.; Muhamad, A. Changes in shoot allometry with increasing tree height in a tropical canopy species, Elateriospermum tapos. Tree Physiol. 2002, 22, 625–632. [Google Scholar]
- Niklas, K.J. Modelling below- and above-ground biomass for non-woody and woody plants. Annu. Bot. 2005, 95, 315–321. [Google Scholar]
- Nunes, L.J.R.; Meireles, C.I.R.; Gomes, C.J.P.; Ribeiro, N.M.C.A. Allometric, growth, and biomass estimation models for Acacia dealbata Link.: A case study in Serra da Estrela Natural Park (Portugal). Environments 2022, 9, 104. [Google Scholar] [CrossRef]
- Kizha, A.; Han, H.S. Predicting aboveground biomass in second growth coast redwood: Comparing localized with generic allometric models. Forests 2016, 7, 96. [Google Scholar] [CrossRef]
- Poorter, H.; Jagodzinski, A.M.; Ruiz-Peinado, R.; Kuyah, S.; Luo, Y.J.; Oleksyn, J.; Usoltsev, V.A.; Buckley, T.N.; Reich, P.; Sack, L. How does biomass distribution change with size and differ among species? An analysis for 1200 plant species from five continents. New Phytol. 2015, 208, 736–749. [Google Scholar] [CrossRef] [PubMed]
- Aspinwall, M.J.; King, J.S.; Mckeand, S.E. Productivity differences among loblolly pine genotypes are independent of individual-tree biomass partitioning and growth efficiency. Trees 2013, 27, 533–545. [Google Scholar] [CrossRef]
- Stovall, J.P.; Fox, T.R.; Seiler, J.R. Short-term changes in biomass partitioning of two full-sib clones of Pinus taeda L. under differing fertilizer regimes over 4 months. Trees 2012, 26, 951–961. [Google Scholar] [CrossRef]
- Stovall, J.P.; Fox, T.R.; Seiler, J.R. Allometry varies among 6-year-old Pinus taeda (L.) clones in the Virginia Piedmont. For. Sci. 2013, 59, 50–62. [Google Scholar] [CrossRef]
- Zhang, H.G.; Deng, J.F.; Zhang, L.; Xu, Y.L. Variation regularity among provenances of Juglans mandshurica and family selection. J. Northwest For. Univ. 2011, 26, 91–95. (In Chinese) [Google Scholar]
- Nikaido, T.; Liu, L.; Li, W.; Koike, K. Two new naphthalenyl glucosides and a new phenylbutyric acid glucoside from the fruit of Juglans mandshurica. Heterocycles 2004, 63, 1429–1436. [Google Scholar] [CrossRef]
- Bao, Y.H.; Yu, Y.Y.; Pan, L.N. The study on the nutritive components and water-soluble protein extraction of Juglans mandshurica maxim kernel. Adv. Mater. Res. 2011, 236–238, 1863–1866. [Google Scholar] [CrossRef]
- Min, B.S.; Kwon, O.K.; Park, B.Y.; Kim, Y.H.; Lee, H.K. Apoptosis-inducing activity of galloylglucoses from Juglans mandshurica in human promyeloid leukemic HL-60 cells. Nat. Prod. Sci. 2004, 10, 48–53. [Google Scholar]
- Saida, H.; Zehra, B.; Saiqa, T.; Tahira, P.; Sadia, S.; Fizza, N.; Huma, J.; Darakhshan, H.J. Effects of walnuts (Juglans regia) on learning and memory functions. Plant Food. Hum. Nutr. 2011, 66, 335–340. [Google Scholar]
- Wang, Z.H.; Zhang, H.; Tong, B.Q.; Han, B.; Liu, D.; Zhang, P.; Hu, D. EST-SSR marker-based investigation on genetic diversity and genetic structure of Juglans mandshurica Maxim. in Shandong Province of China. Genet. Resour. Crop Evol. 2022, 70, 981–991. [Google Scholar] [CrossRef]
- Xia, H.; Zhao, G.H.; Zhang, L.S.; Sun, X.Y.; Yin, S.P.; Liang, D.Y.; Li, Y.; Zheng, M.; Zhao, X.Y. Genetic and variation analyses of growth traits of half-sib Larix olgensis families in northeastern China. Euphytica 2016, 212, 1–11. [Google Scholar]
- Wang, F.; Zhang, Q.H.; Tian, Y.G.; Yang, S.C.; Wang, H.W.; Wang, L.K.; Li, Y.L.; Zhang, P.; Zhao, X.Y. Comprehensive assessment of growth traits and wood properties in half-sib Pinus koraiensis families. Euphytica 2018, 214, 202–216. [Google Scholar] [CrossRef]
- Hijmans, R.J.; Cameron, S.E.; Parra, J.L.; Jones, P.G.; Jarvis, A. Very high resolution interpolated climate surfaces for global land areas. Int. J. Climatol. 2005, 25, 1965–1978. [Google Scholar] [CrossRef]
- Enquist, B.J.; Niklas, K.J. Global allocation rules for patterns of biomass partitioning in seed plants. Science 2002, 295, 1517–1520. [Google Scholar] [CrossRef] [PubMed]
- Yang, B.; Xue, W.; Yu, S.; Zhou, J.Y.; Zhang, W.H. Effects of stand age on biomass allocation and allometry of Quercus Acutissima in the central loess plateau of China. Forests 2019, 10, 41. [Google Scholar] [CrossRef]
- Warton, D.I.; Weber, N.C. Common slope tests for bivariate errors-in-variables models. Biom. J. 2015, 44, 161–174. [Google Scholar] [CrossRef]
- Zhang, Q.H.; Yu, S.H.; Pei, X.N.; Wang, Q.C.; Lu, A.J.; Cao, Y.; Tigabu, M.; Feng, J.; Zhao, X.Y. Within-and between-population variations in seed and seedling traits of Juglans mandshurica. For. Res. 2022, 33, 1711. [Google Scholar]
- Yuan, X.L.; Qi, Y.H.; Liu, Z.L.; Zhou, Z.J.; Mao, Z.J. Provenance selection of Juglans mandshurica Maxim. and the effects of environmental factors. Bull. Bot. Res. 2013, 33, 468–476. [Google Scholar]
- Yuan, X.L. The Early Juglans mandshurica Maxim. Excellent Provenance and Pedigree Selection and Seedling Environmental Factors Impact Assessment. Master’s Thesis, Northeast Forestry University, Harbin, China, 2013. (In Chinese). [Google Scholar]
- Lin, L.; Luo, J. Variation in traits of Picea likiangensis var. linzhiensis seedlings from different provenances. For. Res. 2014, 27, 557–561. [Google Scholar]
- Isik, F.; Isik, K.; Lee, S.J. Genetic variation in Pinus brutia Ten. in Turkey: I. Growth, biomass and stem quality traits. Silvae Genet. 1999, 48, 293–302. [Google Scholar]
- Sustani, F.B.; Jalali, S.G.; Sohrabi, H.; Shirvani, A. Biomass allocation of chestnut oak (Quercus castaneifolia C.A. Mey) seedlings: Effects of provenance and light gradient. For. Sci. 2014, 11, 443–450. [Google Scholar] [CrossRef]
- Liu, J.H.; Li, Z.X.; Zhang, H.G.; Song, L.X.; Yang, Y. Analysis of variation in growth traits of different species and families of Juglans mandshurica. J. Northeast For. Univ. 2023, 51, 9–17. (In Chinese) [Google Scholar]
- Li, X.; Li, K.; Duan, A.A.; Cui, K.; Gao, C.J. Biomass allocation and allometry of Pinus yunnanensis seedlings from different provenances. J. Beijing For. Univ. 2019, 41, 41–50. (In Chinese) [Google Scholar]
- Zou, Y.; Li, B.; Peuelas, J.; Sardans, J.; Yu, H.; Chen, X.; Deng, X.; Cheng, D.; Zhong, Q. Response of functional traits in Machilus pauhoi to nitrogen addition is influenced by differences of provenances. For. Ecol. Manag. 2022, 513, 120207. [Google Scholar] [CrossRef]
- Ivo, M.; Schmid, B.; Weiner, J. The effect of nutrient availability on biomass allocation patterns in 27 species of herbaceous plants. Perspect. Plant Ecol. Evol. Syst. 2000, 3, 115–127. [Google Scholar]
- Ehdaie, B.; Layne, A.P.; Waines, J.G. Root system plasticity to drought influences grain yield in bread wheat. Euphytica 2012, 186, 219–232. [Google Scholar] [CrossRef]
- Lahti, M.; Aphalo, P.J.; Finér, L.; Ryyppo, A.; Lehto, T.; Mannerkoski, H. Effects of soil temperature on shoot and root growth and nutrient uptake of 5-year-old Norway spruce seedlings. Tree Physiol. 2005, 7, 115–122. [Google Scholar] [CrossRef]
- Gedroc, J.J.; McConnaughay, K.D.M.; Coleman, J.S. Plasticity in root/shoot partitioning: Optimal, ontogenetic, or both? Funct. Ecol. 1996, 10, 44–50. [Google Scholar] [CrossRef]
- Wilson, A.M.; Thompson, K. A comparative study of reproductive allocation in 40 British grasses. Funct. Ecol. 1989, 3, 297–302. [Google Scholar] [CrossRef]
- Chen, X.Y.; Shen, X.H. Forest Tree Breeding; Higher Education Press: Beijing, China, 2005; pp. 54–55. (In Chinese) [Google Scholar]
- Poorter, A.H.; Nagel, O. The role of biomass allocation in the growth response of plants to different levels of light, CO2, nutrients and water: A quantitative review. Aust. J. Plant Physiol. 2000, 27, 595–607. [Google Scholar]
- Hossain, M.K.; Islam, S.A.; Islam, Q.N.; Tarafdar, M.A.; Zashimuddin, M. Growth and biomass productions of the international provenance trial of Gliricidia sepium in Bangladesh. Chittagong Univ. Stud. Sci. 2015, 8, 77–82. [Google Scholar]
- Pearsall, W.H. Growth studies VI. On the relative sizes of growing plant organs. Ann. Bot. 1927, 41, 549–556. [Google Scholar] [CrossRef]
- Weiner, J. Allocation, plasticity and allometry in plants. Perspect. Plant Ecol. Evol. Syst. 2004, 6, 207–215. [Google Scholar] [CrossRef]
- Sultan, S.E. Phenotypic plasticity and plant adaptation. Plant Biol. 2013, 44, 363–383. [Google Scholar] [CrossRef]
- Ma, L.; Fu, D.H.; Su, T.; Wang, L.; Pu, X.Y.; Li, S.L. Biomass allocation and allometry of Paris polyphylla var. yunnanensis with different altitudes. Lishizhen Med. Mater. Medica Res. 2023, 34, 697–701. (In Chinese) [Google Scholar]
- Minden, V.; Kleyer, M. Testing the effect-response framework: Key response and effect traits determining above-ground biomass of salt marshes. J. Veg. Sci. 2011, 22, 387–401. [Google Scholar] [CrossRef]
- Kleyer, M.; Trinogga, J.; Piqueras, M.C.; Blasius, B. Trait correlation network analysis identifies biomass allocation traits and stem specific length as hub traits in herbaceous perennial plants. J. Ecol. 2019, 107, 829–842. [Google Scholar] [CrossRef]
- Rweyongeza, D.M.; Yeh, F.C.; DHIR, N.K. Heritability and correlations for biomass production and allocation in white spruce seedlings. Silvae Genet 2005, 54, 228–235. [Google Scholar] [CrossRef][Green Version]
- Wang, B.S.; Mao, J.F.; Zhao, W.; Wang, X.R. Impact of geography and climate on the genetic differentiation of the subtropical pine Pinus yunnanensis. PLoS ONE 2013, 8, e67345. [Google Scholar] [CrossRef]
- Brown, S.; Lugo, A.E. Biomass of tropical forests: A new estimate based on forest volumes. Science 1984, 223, 1290–1293. [Google Scholar] [CrossRef] [PubMed]
- Liu, L.U. Effects of Stand Age and Climate on Organs Biomass of Several Typical Pine Forests in China. Master’s Thesis, North China Electric Power University, Beijing, China, 2016. (In Chinese). [Google Scholar]


Disclaimer/Publisher’s Note: The statements, opinions and data contained in all publications are solely those of the individual author(s) and contributor(s) and not of MDPI and/or the editor(s). MDPI and/or the editor(s) disclaim responsibility for any injury to people or property resulting from any ideas, methods, instructions or products referred to in the content. |
© 2024 by the authors. Licensee MDPI, Basel, Switzerland. This article is an open access article distributed under the terms and conditions of the Creative Commons Attribution (CC BY) license (https://creativecommons.org/licenses/by/4.0/).