Abstract
Ecological stoichiometry is essential for investigating biogeochemical cycling in an ecosystem. Thinning, a management practice that closely mimics natural processes, significantly influences stand structure and microclimate, thereby affecting nutrient cycling. Nonetheless, seasonal variations in ecological stoichiometry across the leaf-litter-soil continuum under different thinning regimes remain inadequately understood. In this study, we evaluated three thinning methods (strip filling (SF), ecological thinning (ET), and forest gap (FG)) to investigate the stoichiometric characteristics of Cupressus funebris Endl (C. funebris). within the leaf-litter-soil system in Southwest China. The samples were collected during four distinct seasonal periods: early dry season (January–March, EDS), late dry season (April–June, LDS), early wet season (July–September, EWS), and late wet season (October–December, LWS). The results indicated that the (1) carbon (C), nitrogen (N), and phosphorus (P) contents and C:N:P ratio in leaves, litter, and soils varied widely and were strongly influenced by thinning method and season. (2) In the EDS, the soil TP content significantly decreased by 36.9% (p < 0.05), 41.67% (p < 0.05), and 17.9% (p < 0.05) under ET, FG, and SF treatments compared to the pure C. funebris forest (PC). (3) Compared to the PC, the leaf organic C content under ET significantly increased by 6.6% (EDS, p < 0.05), 8.4% (EWS, p < 0.05), 24.8% (LDS, p < 0.05), and 11.5% (EWS, p < 0.05). (4) Under identical thinning methods, the contents of litter C, litter N, litter P, leaf N, and leaf P (excluding litter C in SF) were found to be highest in the LWS. Conversely, the ratios of litter C:N, litter C:P, litter N:P, leaf C:N, leaf C:P, leaf N:P, soil N:P, and soil C:P (except for the ratios of litter N:P in ET and FG) were observed to be lowest in the LWS. (5) Season and thinning method significantly affected the internal stability of P stoichiometric homeostasis, and litter P under ET (EWS) was categorized as “plastic” (p < 0.1, 0.75 < H). (6) The results of the structural equation model show that the thinning method has a direct positive impact on leaf C, N, and P contents and a direct negative impact on the chemical stoichiometry of leaves and soil. Season has a direct positive impact on soil C, N, and P contents, as well as on the chemical stoichiometry of litter and leaves; however, they have a direct negative impact on leaf C, N, and P contents. This study contributes to C. funebris plantation management and provides basic information for global stoichiometric analysis.
1. Introduction
Carbon (C), nitrogen (N), and phosphorus (P) are essential elements that play pivotal roles in maintaining and regulating biogeochemical cycles within terrestrial ecosystems [1]. The study of C:N:P ecological stoichiometry offers valuable insights into the biogeochemical dynamics of nutrients and energy flow between plants and soil, thereby elucidating the significant ecological implications of these processes [2]. It is widely recognized that N and P are the most prevalent limiting nutrients in terrestrial ecosystems and are capable of regulating plant productivity and influencing C sequestration [3]. Numerous studies have investigated the stoichiometric properties of plant tissues or soil at regional or global scales to analyze nutrient cycling and elemental limitations in plants [3,4,5,6,7,8]. However, contemporary research on ecological stoichiometry has predominantly concentrated on individual components such as leaves, litter, and soil [3,4,6,7,8]. Comprehensive investigations encompassing the entire leaf-litter-soil continuum are scarce.
Thinning is a primary technique for the near-natural transformation of artificial forests and has been extensively employed in forest management practices. This method is principally categorized into strip thinning, gap creation, and ecological thinning [7,9,10,11,12]. For example, forest gaps can induce resource and environmental heterogeneity by changing environmental factors such as light, temperature, and moisture, thereby directly or indirectly influencing the energy flow within plant and soil systems [9]. Ecological thinning, which is a primary management practice for improving the growth of the remaining trees, can stimulate energy cycling by changing the soil microclimate and nutrient dynamics of the remaining trees [7,12]. Strip filling, a technique widely employed in artificial forest management, has been shown to significantly improve the ecological and economic benefits of these forests [11]. Importantly, thinning practices can inevitably influence C:N:P ecological stoichiometry by altering the environmental conditions within plantation forests [7,9,11,12]. Thinning potentially regulates the cycling of C, N, and P by altering the microclimate as well as the quality and quantity of organic matter and microbial properties [7,12]. For instance, Zhou et al. [7] demonstrated that thinning promotes N and P cycling in forest soils and increases soil fertility. However, Muscolo et al. [13] suggested that thinning may reduce litterfall inputs to the soil. Conversely, Yang et al. [14] suggested that thinning may increase litterfall input. Furthermore, the effects of thinning on N2O emissions remain ambiguous [10]. Consequently, the effects of thinning on C:N:P ecological stoichiometry are difficult to generalize because of differences in origin, tree species, stand density, site quality, stand age, thinning methods, and climatic conditions [4,7,8].
Plants employ specific strategies to adapt to their surrounding environment, and their physiological metabolism fluctuates across different seasons, thereby affecting the stoichiometric ratios of C, N, and P in plants [15]. For example, Orgeas et al. [16] found that sampling timing significantly affects the stoichiometry of C, N, and P in Quercus variabilis Blume leaves. Townsend et al. [17] revealed that plant growth is constrained by P during the rainy season and N during the dry season. Li and Wang [18] observed that the contents and stoichiometry of C, N, and P in plantations showed pronounced seasonal changes on the Loess Plateau. Consequently, when investigating ecological stoichiometry, it is imperative to account for seasonal dynamics to enhance our understanding of temporal variations in C, N, and P.
Cupressus funebris Endl. (C. funebris) is an important, rapidly growing tree species utilized in afforestation efforts for the Yangtze River Shelter Forest Project, valued for its substantial social, economic, and ecological contributions [19,20,21]. However, a high initial planting density has precipitated a range of issues, including markedly reduced water storage capacity, diminished biodiversity, and soil degradation, which have collectively led to a substantial decline in ecological services [14,21,22]. According to the third-phase project plan for the construction of the protective forest system in the Yangtze River Basin (2011–2020), the Chinese government has implemented a series of thinning methods since 2010 to enhance the ecological functions of C. funebris [14]. These methods, which include strip filling, forest gap, and ecological thinning, have been used to optimize the structure of artificial C. funebris forests [14,19]. Previous research on the effects of various thinning methods on C. funebris has predominantly focused on biomass, root system architecture, stand structure, and plant diversity [14,19,20,21,23]. However, studying the stoichiometric characteristics of C:N:P and their seasonal dynamics within the leaf-litter-soil system in C. funebris plantations can provide valuable insights into the adaptation strategies and nutrient limitations of these ecosystems. Therefore, it is imperative to investigate the processes of material and energy circulation within the leaf-litter-soil system to gain a comprehensive understanding of the ecological characteristics and functions of C. funebris artificial forests under various thinning methods. Such insights are essential for vegetation restoration and forest management strategies in the study area. In this study, we selected three thinning methods (strip filling, forest gap, and ecological thinning) and one natural forest. We sampled plant leaves, leaf litter, and soil samples in four seasons to investigate C, N, and P contents, stoichiometry, and stoichiometric homeostasis in Southwest China.
2. Materials and Methods
2.1. Study Site and Experimental Design
The study site is situated in Linshan Township (31°15′–31°18′ N, 105°25′–105°29′ E), Yanting County, Sichuan Province, Southwest China. It lies between 400 and 650 m above sea level. In the study area, the climate is subtropical humid monsoon, with an annual mean temperature of 17.3 °C and 826 mm of precipitation. The soil type in the region is Cambisols, as classified in the WRB [14]. The tree layer within the study area predominantly consists of C. funebris, which was planted at a density of 4000–6000 trees/hectare in the 1970s. The understory shrubs mainly included Coriaria nepalensis Wall. and Vitex negundo L. The understory herbaceous plants included Carex stipitinux C. B. Clarke ex Franch., Cyclosorus acuminatus (Houtt.) Nakai, Imperata cylindrica (L.) P. Beauv., and Pogonatherum crinitum (Thunb.) Kunth. Between 2005 and 2008, the Sichuan Academy of Forestry conducted thinning management experiments on monoculture cypress plantations of similar aspects, slopes, and altitudes. The experiments included strip filling (SF), ecological thinning (ET), and forest gap (FG). In this study, we selected C. funebris forests (including SF, ET, and FG) under three thinning management regimes as the treatments, with unmodified pure Cupressus funebris forests (PC) as the control (Table 1). The three thinning modes primarily aimed to reduce forest stand density. Strip filling was conducted through artificial logging to establish strips with widths ranging from 4 m to 10 m. The resultant forest gaps generated by artificial logging encompass areas between 50 and 200 m2, as measured by the vertical projection of the canopy space onto the ground. Ecological thinning was implemented by selectively removing a portion of cypress trees, thereby maintaining 10%–25% of the original density.

Table 1.
Overview of the sample site.
All the samples were collected between September 2021 and June 2022. Based on the tropical forest division, we collected samples in the early dry season (January–March, EDS), late dry season (April–June, LDS), early wet season (July–September, EWS), and late wet season (October–December, LWS) [14]. Four plots (20 × 20 m in size and 50 m apart) separated by at least 1 km were selected for each thinning type with a similar latitude, longitude, altitude, and coverage; all the selected trees in the plots were approximately 20 years old. In addition, five 5 × 5 m subplots were selected in each plot, for a total of 20 subplots. In each subplot, trees of similar health and age were randomly and evenly selected for the collection of plant samples (leaves and litter). In addition, a litter trap (1 × 1 m in size and 50 cm above the ground) made of nylon with a mesh size of 1 mm was placed randomly under each selected tree to collect litter. For each tree, we collected five branches from the inner, middle, and outer parts of each crown canopy, and mature leaves without plant diseases or insect pests were selected and transported to the laboratory. We then collected the newly fallen and undecomposed leaf litter in litter traps. Finally, soil was collected in layers (0–20 cm) within each subplot using the “S” sampling method. A soil sample composition of 20 points (approximately 2 kg) was randomly collected from each subplot. At different time intervals, 20 plant leaf, litter, and soil samples were collected per treatment, corresponding to 20 replicates. In total, 320 samples of plant leaves, litter, and soil were collected (four treatments × four plots × five subplots × four seasons). Each leaf and litter sample weighed approximately 250 g.
2.2. Laboratory Analysis
After being delivered to the lab, the plant leaf and litter samples were first oven-dried for 30 min at 105 °C and then dried further at 65 °C until they reached a consistent weight. The soil samples were then air-dried. After being ground with a ball mill, all samples were sieved through a 0.15-mm sieve and then stored. The organic C (OC) content of the soil and plants was analyzed using the potassium dichromate volumetric method [24]. Soil and plant total nitrogen (TN) content was determined using the semi-micro Kjeldahl method [24]. The total phosphorus (TP) content of soils and plants was determined using the HClO4-H2SO4 digestion–molybdenum antimony anticolorimetric method [24].
2.3. Data Analysis
To ascertain the extent of stoichiometric homeostasis, we used the methodology described by Persson et al. [25]. This pivotal parameter was derived quantitatively by using the following mathematical equation:
where x is the resource soil stoichiometry, y is the nutrient stoichiometry of the organism (leaves or litter), and c is a constant. Therefore, H is the slope of the regression between log(x) and log(y) and should have values between 0 and 1. As the slope was expected to be equal to or >0, one-tailed tests with α = 0.1 were used. If the regression relationship was non-significant (p > 0.1), H was set to zero and the organism was considered “strictly homeostatic”. Species with H = 1 were considered non-homeostatic. All datasets with significant regressions and 0 < H < 1 were classified as “homeostatic” (0 < H ≤ 0.25), “weakly homeostatic” (0.25 < H ≤ 0.5), “weakly plastic” (0.5 < H ≤ 0.75), or “plastic” (0.75 < H) [25].
All the data were checked for homogeneity of variance and normality. Then, a one-way analysis of variance (ANOVA) with the least significant difference (LSD) test was used to identify differences in the content and stoichiometry of C, N, and P among the four management practices and seasons. It is important to note that a significance level of p < 0.05 was used to determine significant differences in the analysis. Subsequently, the values were summarized by their average and standard deviation (AV ± SD). Principal component analysis (PCA) was performed using the “corrplot” package. We used the “lavaan” package to construct the structural equation model (SEM). And considered to pass the test when the p-value (chi-square) was larger than 0.05. Microsoft Excel 2010, R 4.0.3 (R Development Core Team, 2020), and AI 22.0 software were used for data analysis, tabulation, and graphing.
3. Results
3.1. OC, TN, and TP Contents and Their Seasonal Variation Characteristics in the Leaves, Litter, and Soil of C. funebris Forests
As described in Table 2, the data demonstrated that thinning methods, seasons, and their interactions had a significant impact on the content of soil OC, leaf OC, litter TN, and litter TP (p < 0.001). The thinning method had a significant impact on leaf TN content and litter TN content (p < 0.001) but had no significant impact on soil TN content, soil TP content, or leaf TP content (p > 0.05). Season had a significant impact on soil OC content, leaf OC content, soil TN content, leaf TN content, litter TN content, soil TP content, and litter TP content (p < 0.001), as well as leaf TP content and litter OC content (p < 0.05). The interaction effect between thinning method and season had a significant impact on the TN and TP content of litter (p < 0.001), a significant impact on soil TP content (p < 0.01), and no significant impact on the TN content of soil and leaves (p > 0.05). As shown in Table 3, the OC, TN, and TP contents of leaves, litter, and soil were 378–497 g·kg−1, 10.1–13.7 g·kg−1, and 0.84–1.31 g·kg−1 (leaves); 300–429 g·kg−1, 5.7–12.6 g·kg−1, and 0.31–1.07 g·kg−1 (litter); and 10–32 g·kg−1, 0.9–1.5 g·kg−1, and 0.41–1.04 g·kg−1 (soil), respectively.
Table 2.
The impact of thinning methods, seasons, and their interactive effects on the stoichiometry of C, N, and P in C. funebris forests.
Table 3.
C, N, and P contents and seasonal variations in the leaf-litter-soil system under different thinning methods.
3.1.1. OC, TN, and TP Contents under Different Thinning Methods in the Leaves, Litter, and Soil of Cupressus funebris Forests
During the EWS and EDS, there was no significant difference in the OC and TN contents of the leaves among the three thinning methods compared to the PC (p > 0.05). Similarly, during the EWS and LDS, there was no significant difference in the TP content of the leaves among the three thinning methods compared to the PC (p > 0.05). During the LDS, there was no significant difference in the OC and TN contents of leaves under SF (p > 0.05), but it was significantly reduced under the ET treatment (p < 0.05) compared to the PC. During the EDS, there was no significant difference in the TP content of leaves under SF (p > 0.05), but it was significantly reduced under ET and FG treatments (p < 0.05) compared to the PC. In the LWS, the OC content in leaves significantly decreased only under SF (p < 0.05), whereas the TN and TP contents significantly increased under other treatments (p < 0.05) compared to the PC.
Except for litter TP content under SF in the LDS (p < 0.05), there was no significant difference in litter TN and TP contents among the three thinning methods during the EWS, LDS, and LWS compared to the PC (p > 0.05). Notably, compared to the PC, litter OC content under ET significantly increased by 6.56% (EDS, p < 0.05), 8.38% (EWS, p < 0.05), 24.77% (LDS, p < 0.05), and 11.45% (LWS, p < 0.05).
There was no significant difference in the soil TN content between the three thinning methods and PC in the four seasons (p > 0.05). In the EDS, the soil OC content significantly increased by 7.85% (p > 0.05), 51.39% (p < 0.05), and 59.94% (p < 0.05) under ET, FG, and SF treatments, respectively, whereas the soil TP content significantly decreased by 36.90% (p < 0.05), 41.67% (p < 0.05), and 17.86% (p < 0.05), respectively, compared to the PC. In the LDS, the soil OC content was significantly reduced by 28.61% (p > 0.05), 52.37% (p < 0.05), and 32.95% (p < 0.05) under the ET, FG, and SF treatments, respectively. There was no significant difference in the soil TP content (p > 0.05).
3.1.2. OC, TN, and TP Contents in Different Seasons in the Leaves, Litter, and Soil of C. funebris Forests
As shown in Table 3, under the same thinning methods, season had significant effects on the OC, TN, and TP contents in the leaf-litter-soil system (p < 0.05). Overall, the litter OC, litter TN, litter TP, leaf TN, and leaf TP contents (except for litter OC content in SF) were the highest in the LWS. The soil OC, TN, and TP contents (except for the soil OC content in FG) were the highest in the LDS. The leaf OC content (except for SF) was the highest in the EWS.
3.2. C:N:P Stoichiometry and Its Seasonal Variation Characteristics in the Leaves, Litter and Soil of C. funebris Forests
As shown in Table 2, the thinning method had no significant impact on the leaf N:P ratio (p > 0.05). Season had a significant impact on the soil C:N ratio, soil C:P ratio, leaf C:N ratio, leaf C:P ratio, litter C:N ratio, litter N:P ratio, and litter C:P ratio (p < 0.001), as well as the soil N:P ratio (p < 0.01). The interaction effect between thinning method and season had a significant impact on the soil C:N ratio, leaf C:N ratio, litter C:N ratio, soil C:P ratio, leaf C:P ratio, litter C:P ratio, soil N:P ratio, leaf N:P ratio, and litter N:P ratio (p < 0.001). As shown in Table 4, the C:N, C:P, and N:P ratios of leaves, litter, and soil were 28.43–47.89, 310.34–541.30, and 10.28–13.00 (leaves); 30.60–66.27, 343.84–1298.66, and 11.09–24.24 (litter); and 7.61–26.07, 13.12–55.89, and 1.29–2.76 (soil), respectively.
Table 4.
Ecological stoichiometry and seasonal variations in the leaf-litter-soil system under different thinning methods.
3.2.1. C:N:P Stoichiometry under Different Thinning Methods in the Leaves, Litter, and Soil of C. funebris Forests
As shown in Table 4, the thinning method had no significant impact on the ratios of leaf C:N (in the EDS) and leaf N:P (in the LDS and EWS) (p > 0.05). In the same seasons, the ratios of litter C:N, C:P, and N:P of the PC were significantly lower than those under SF (p < 0.05), and the ratios of leaf N:P under FG were significantly lower than those under the other thinning methods (p < 0.05). Overall, the ratios of soil C:N, soil C:P, soil N:P, leaf C:N, and leaf C:P of the PC (except for the ratios of soil C:N, soil C:P, and soil N:P in the EDS) were significantly higher than those under other thinning methods (p < 0.05) in the same seasons.
3.2.2. C:N:P Stoichiometry in Different Seasons in the Leaves, Litter, and Soil of C. funebris Forests
As shown in Table 4, under the same thinning methods, season had significant effects on the C:N, C:P, and N:P ratios in the plant-litter-soil system (p < 0.05). Overall, the ratios of litter C:N, litter C:P, litter N:P, leaf C:N, leaf C:P, leaf N:P, soil N:P, and soil C:P (except for the ratios of litter N:P under ET and FG) were the lowest in the LWS.
3.3. Stoichiometric Homeostasis
The results of the degree of the stoichiometric homeostasis of C, N, P, C:N, C:P, and N:P in the leaves and litter are shown in Table 5.
Table 5.
Relationships between log10-transformed C, N, and P contents and C:N, C:P, and N:P in leaves, litter, and soil for PC, SF, ET, and FG in different seasons.
The C content in the leaves and litter was not significantly affected by any season or thinning method (p > 0.1). However, the C content in leaves and litter under FG (LWS), SF (LWS), and ET (EWS) was categorized as “homeostatic” (p < 0.1, 0 < H ≤ 0.25).
The N content in leaves and litter was not significantly affected by any season or thinning method (p > 0.1). However, the leaf N content in the PC (LDS) was categorized as “homeostatic” (p < 0.1, 0 < H ≤ 0.25), and the litter N content under FD (LDS) was categorized as “weakly homeostatic” (p < 0.1, 0.25 < H ≤ 0.5).
Season and thinning method significantly affect the internal stability of P stoichiometric homeostasis. The litter P content under SF (EDS) and PC (LDS) was categorized as “weakly homeostatic” (p < 0.1, 0.25 < H ≤ 0.5). The leaf P content under FG (EDS) was categorized as “weakly homeostatic” (p < 0.1, 0.25 < H ≤ 0.5). The leaf P content under SF (EWS) and SF (LDS) was categorized as “homeostatic” (p < 0.1, 0 < H ≤ 0.25). However, the litter P content under ET (EWS) was categorized as “plastic” (p < 0.1, 0.75 < H). All others were “strictly homeostatic” (p > 0.1).
The C:N stoichiometry in leaves and litter was not significantly affected by season or thinning method (p > 0.1). However, the litter C:N stoichiometry under FG (EDS) was categorized as “homeostatic” (p < 0.1, 0 < H ≤ 0.25), and litter C:N stoichiometry in the PC (LDS) was categorized as “weakly homeostatic” (p < 0.1, 0.25 < H ≤ 0.5).
The C:P stoichiometry in leaves and litter was not significantly affected by season or thinning method (p > 0.1). However, the leaf C:P stoichiometry under ET (LDS) was categorized as “plastic” (p < 0.1, 0.75 < H), and the C:P stoichiometry in leaves and litter under FG (EDS) was categorized as “homeostatic” (p < 0.1, 0 < H ≤ 0.25).
The N:P stoichiometry in leaves and litter was not significantly affected by season or thinning method (p > 0.1). However, the leaf N:P stoichiometry under FG (EDS), PC (EWS), and SF (LDS) was categorized as “homeostatic” (p < 0.1, 0 < H ≤ 0.25), and litter N:P stoichiometry under ET (EWS) was categorized as “weakly homeostatic” (p < 0.1, 0.25 < H ≤ 0.5).
3.4. Relationships of C, N, and P Contents and Ecological Stoichiometry in the Plant-Litter-Soil System
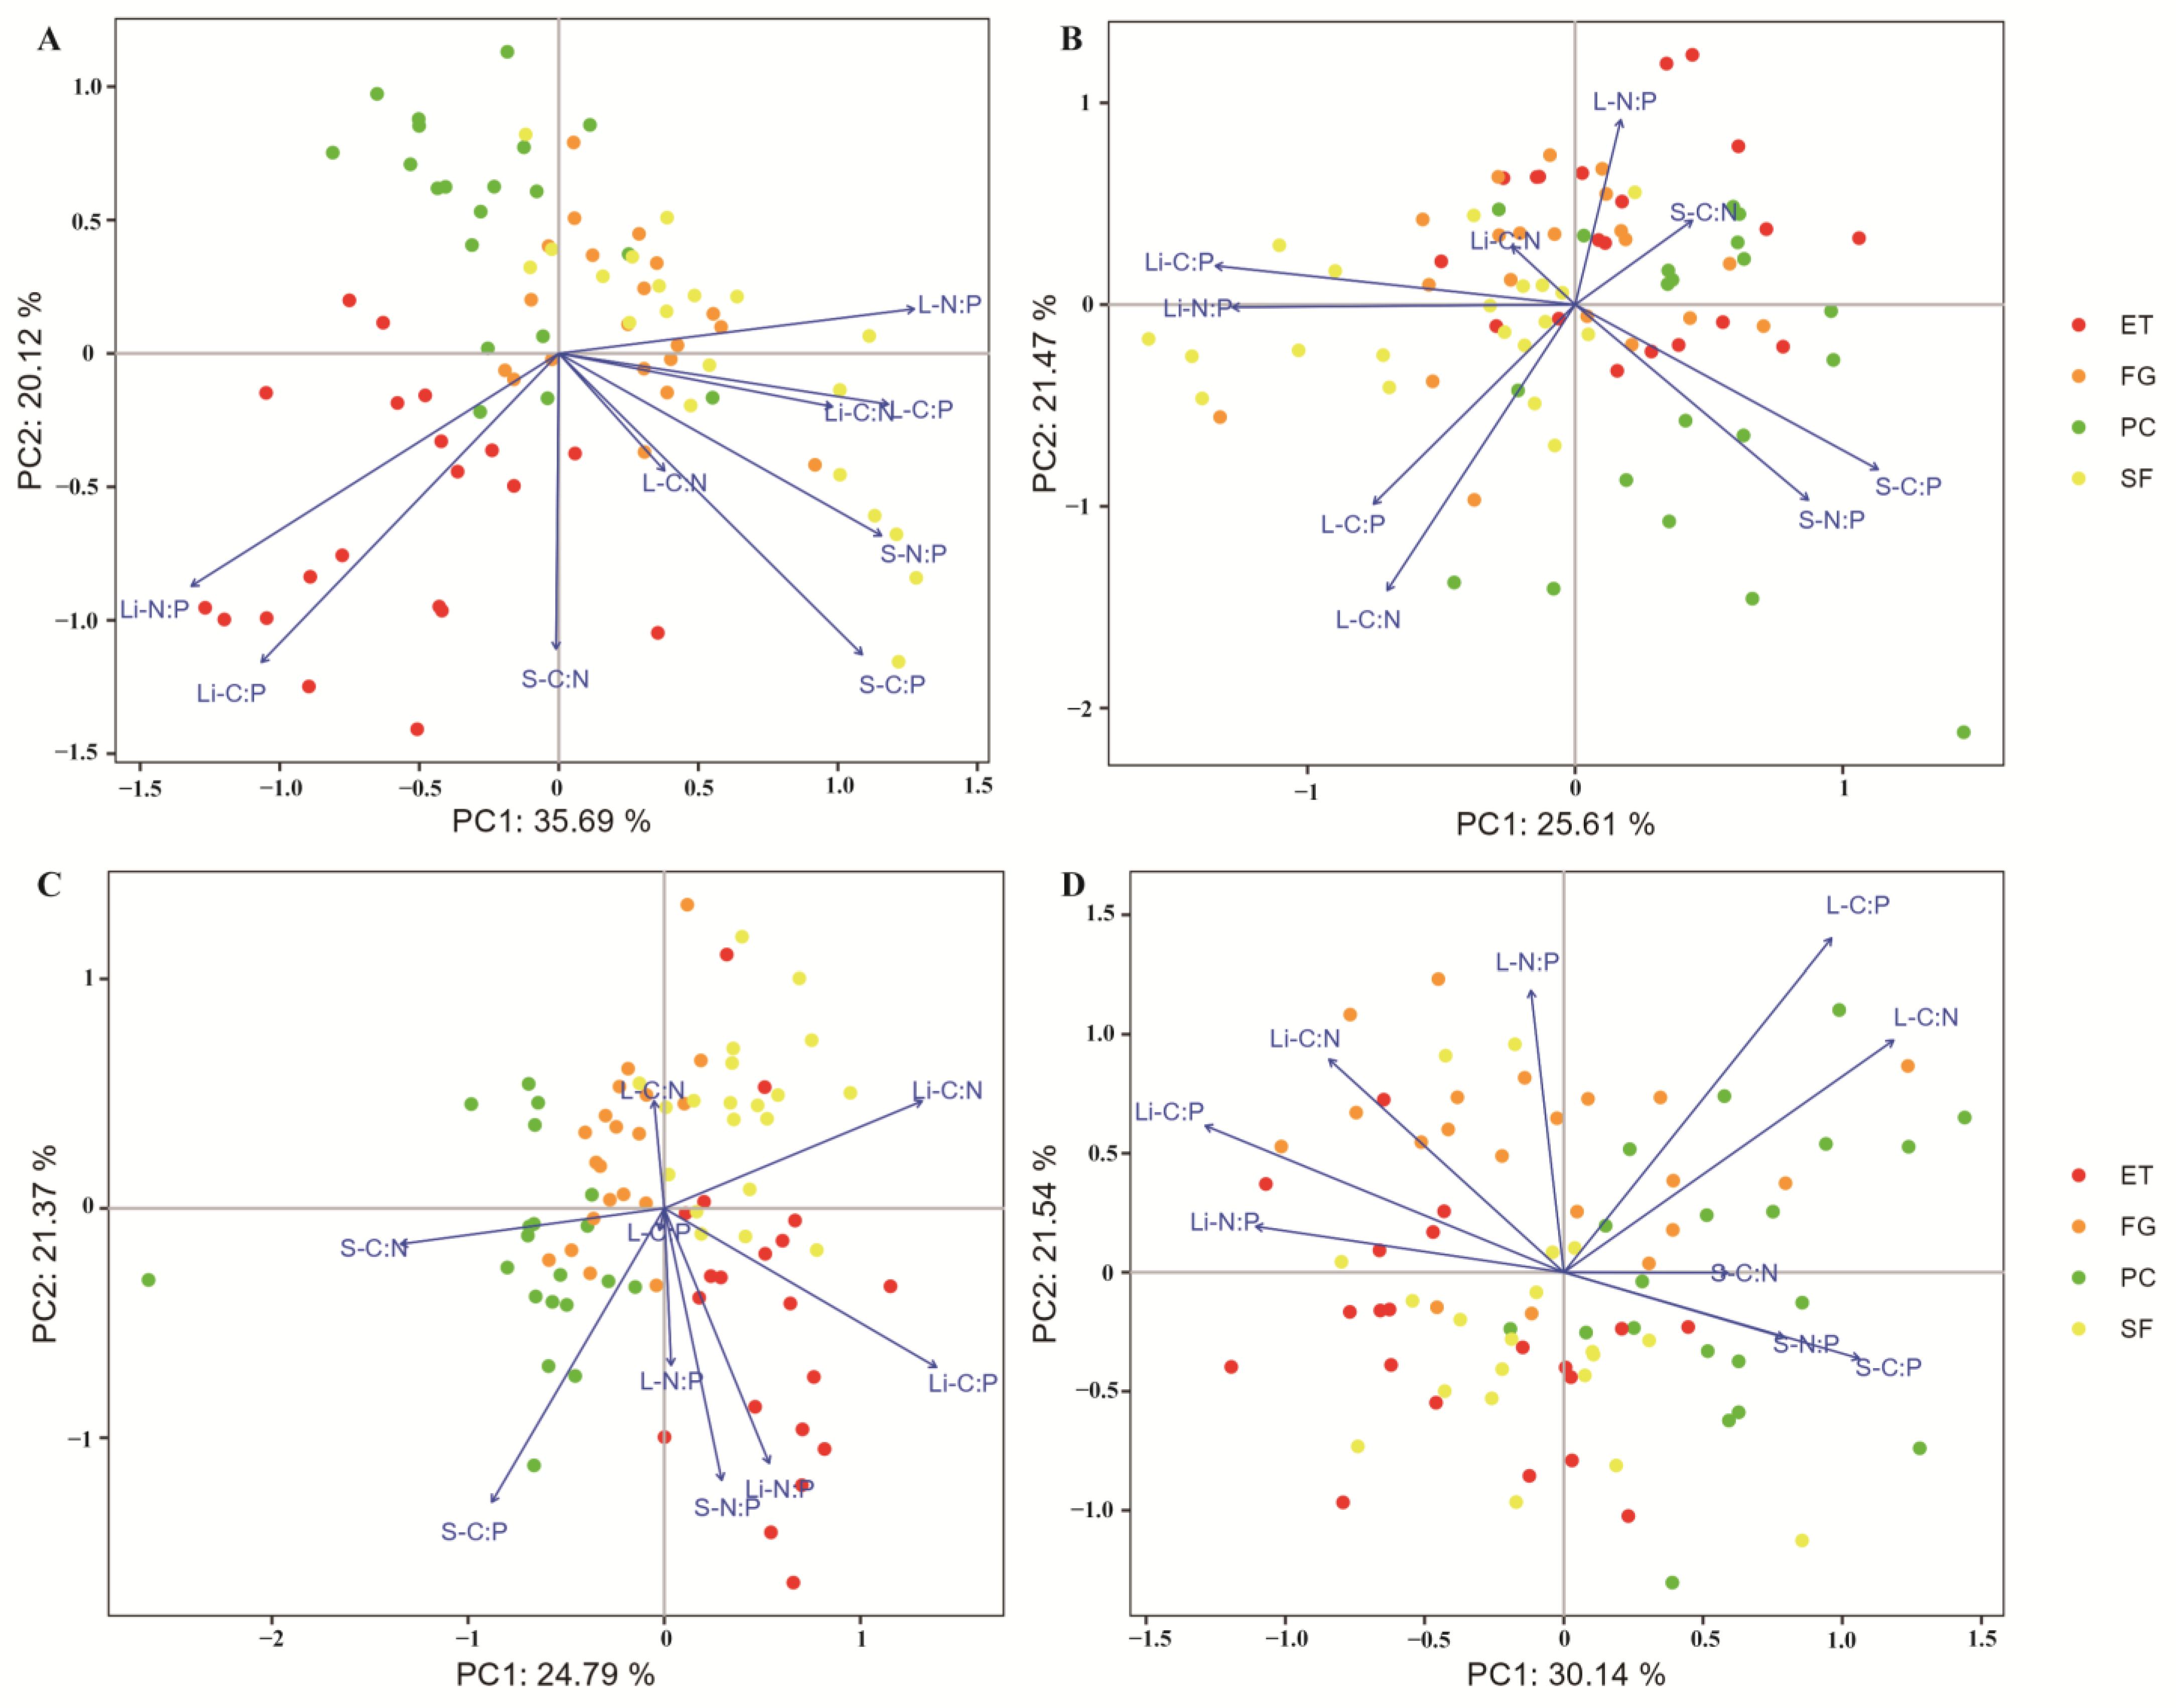
Principal component analysis (PCA) showed that in the EDS, there was a significant negative correlation between litter TP and soil TP, litter TN, leaf TP, leaf TN, and leaf OC (Figure 1A). The litter N:P ratio was significantly positively correlated with the litter C:P ratio and significantly negatively correlated with the leaf N:P ratio (Figure 2A).
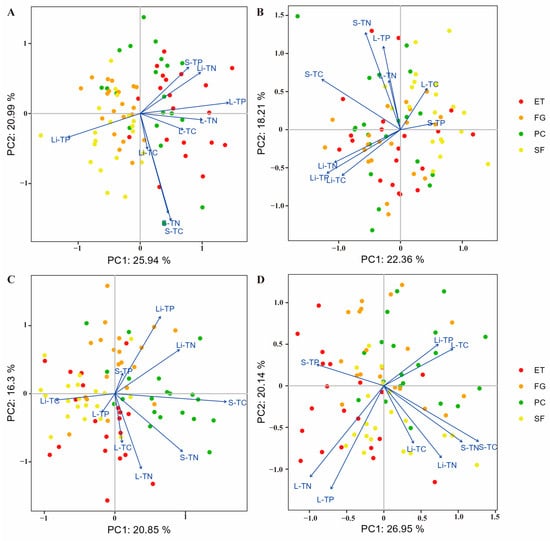
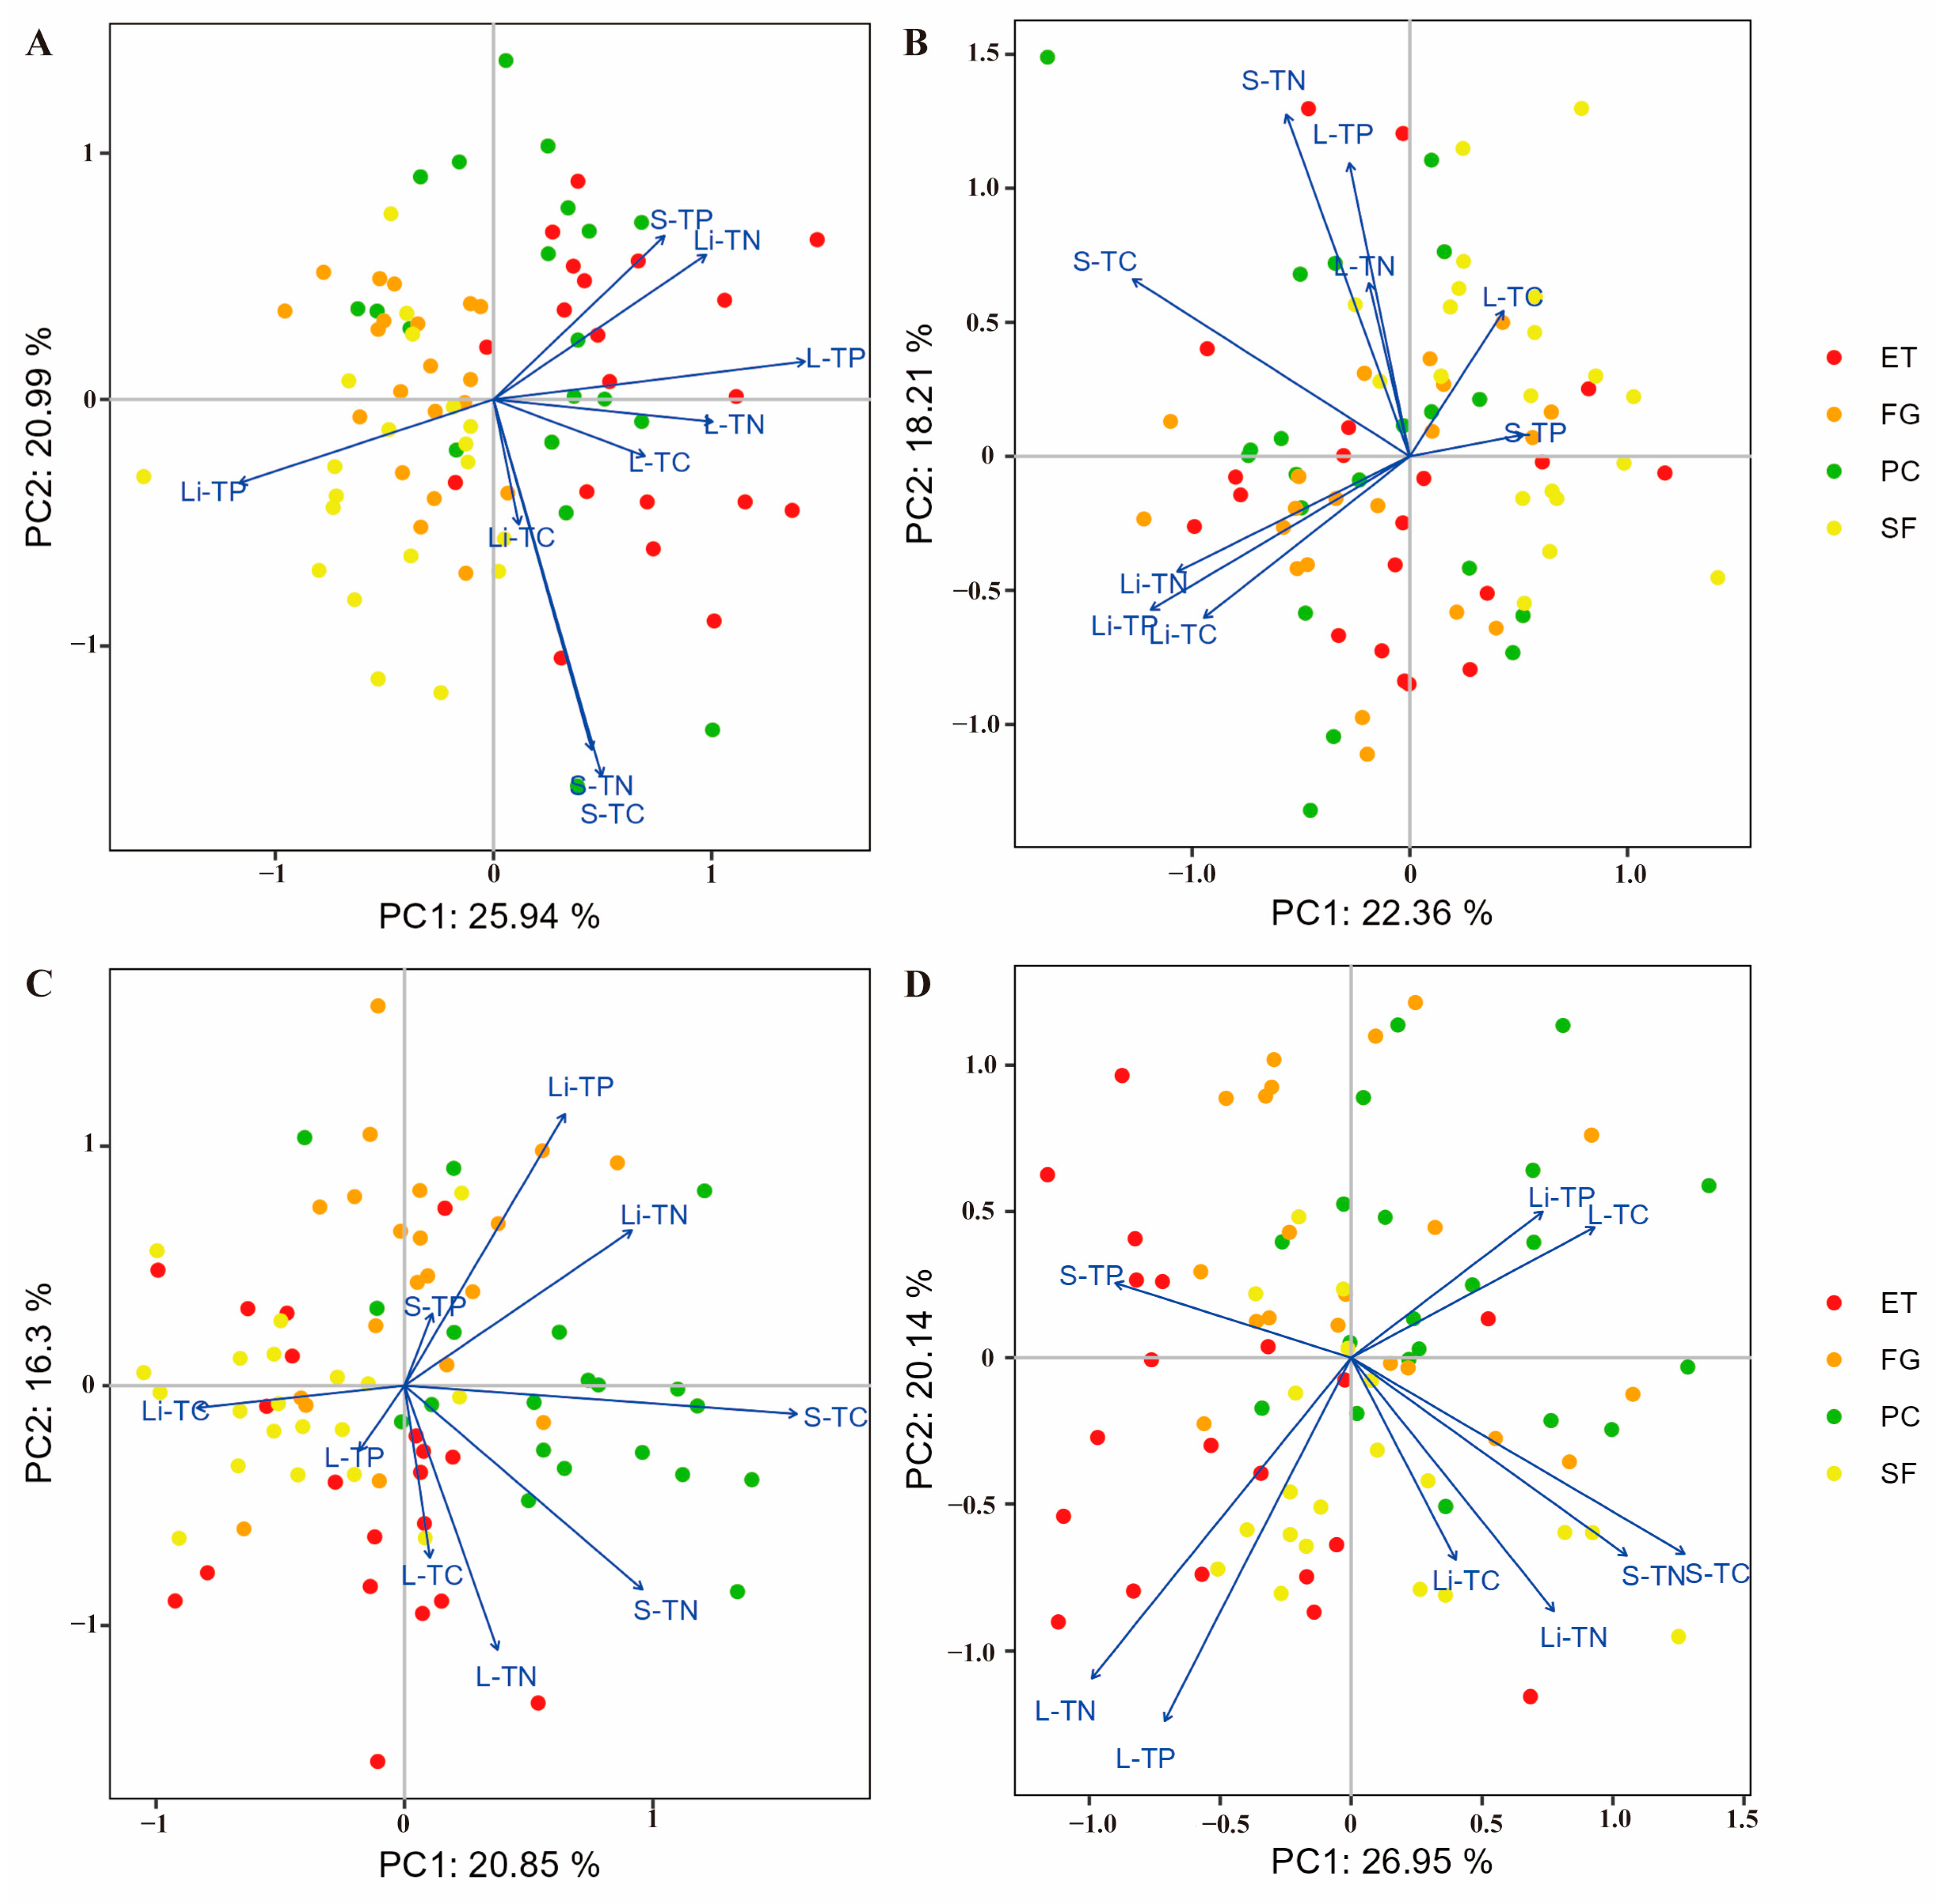
Figure 1.
PCA was used to identify the relationships between C, N, and P contents in the plant-litter-soil system: (A) EDS, (B) EWS, (C) LDS, and (D) LWS. In all the diagrams, the percentages on the ordination axes indicate the explained variance. S-TC: soil organic carbon, S-TN: soil total nitrogen, S-TP: soil total phosphorus, L-TC: leaf organic carbon, L-TN: leaf total nitrogen, L-TP: leaf total phosphorus, Li-TC: litter organic carbon, Li-TN: litter total nitrogen, and Li-TP: litter total phosphorus.
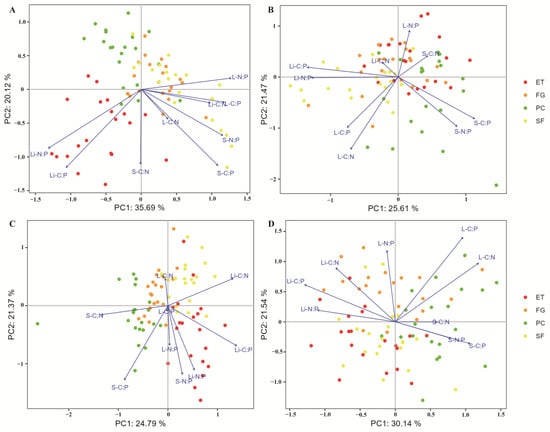
Figure 2.
PCA was used to identify the relationships between C, N, and P stoichiometry in the plant-litter-soil system: (A) EDS; (B) EWS; (C) LDS; (D) LWS. In all the diagrams, the percentages on the ordination axes indicate the explained variance. S-C:N: soil C:N ratio; S-C:P: soil C:P ratio; S-N:P: soil N:P ratio; L-C:N: leaf C:N ratio; L-C: leaf C:P ratio; L-N:P: leaf N:P ratio; Li-C:N: litter C:N ratio; Li-C:P: litter C:P ratio; and Li-N:P: litter N:P ratio.
In the EWS, litter TP was significantly positively correlated with litter TN and litter OC and significantly negatively correlated with leaf OC and soil TP (Figure 1B). The litter N:P ratio was significantly positively correlated with the litter C:P ratio and significantly negatively correlated with the soil N:P ratio and soil C:P ratio (Figure 2B).
In the LDS, litter TP was significantly positively correlated with litter TN and soil TP and significantly negatively correlated with leaf OC, leaf TN, and leaf TP (Figure 1C). The litter N:P ratio was significantly positively correlated with the soil N:P ratio and leaf N:P ratio and significantly negatively correlated with the leaf C:N ratio (Figure 2C).
In the LWS, litter TP was significantly positively correlated with leaf OC and significantly negatively correlated with leaf TN and TP (Figure 1D). The litter N:P ratio was significantly positively correlated with the litter C:P ratio and litter C:N ratio and significantly negatively correlated with the soil N:P ratio, soil C:P ratio, and soil C:N ratio (Figure 2D).
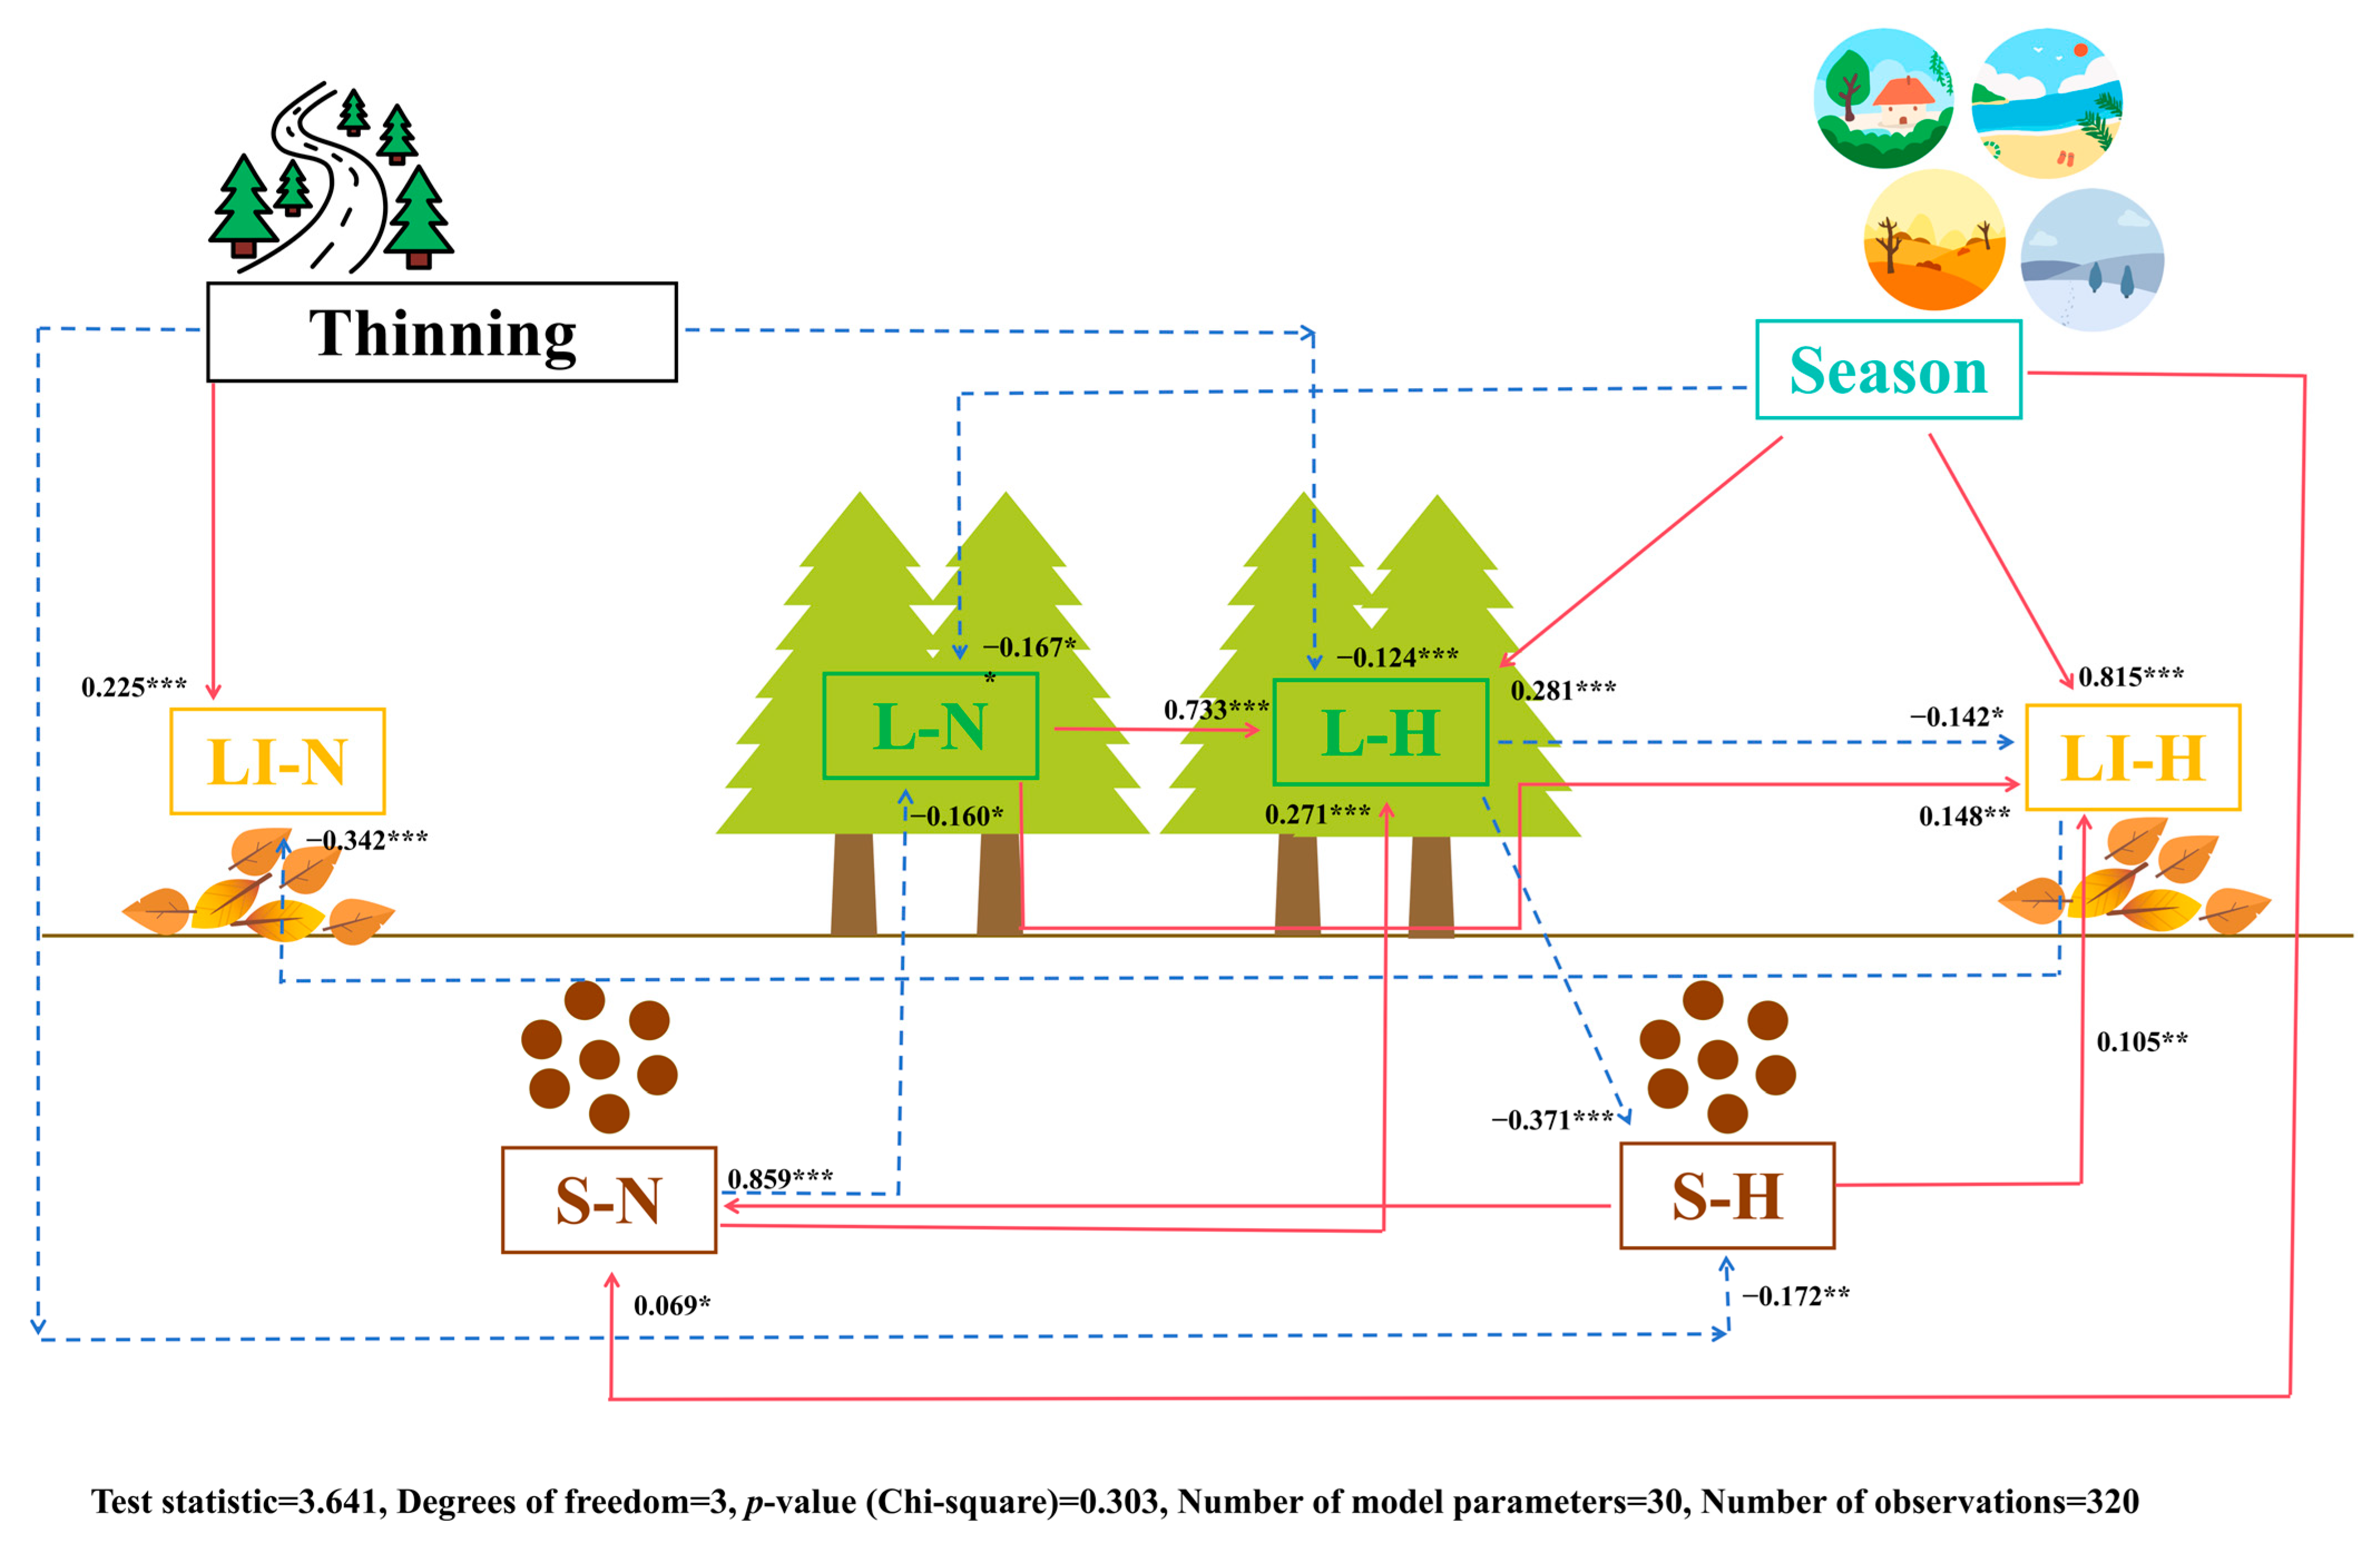
The SEM (Figure 3) indicates that LI-N was indirectly positively affected by the thinning method and indirectly negatively correlated with LI-H. LI-H was indirectly positively affected by season, L-N, and S-H and had indirect negative correlations with L-H. L-H was indirectly positively affected by season, L-N, and S-N and had indirect negative correlations with the thinning method. L-N had indirect negative correlations with season and S-N. S-N was indirectly and positively affected by season and S-H.
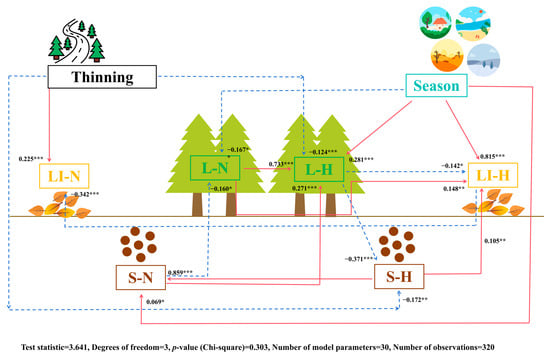
Figure 3.
Structural equation models representing hypothesized causal relationships among management methods, seasons, nutrients in the soil, litter, and leaves, and C, N, and P stoichiometry in the soil, litter, and leaves. The arrows depict casual relationships: red and full lines indicate positive effects, and blue and dashed lines indicate negative effects. Adjacent to the arrows are standardized path coefficients, which indicate the effect size of the relationship. * p < 0.05, ** p < 0.01, and *** p < 0.001. S-N: soil nutrient; S-H: soil C, N, and P stoichiometry; LI-N: litter nutrient; LI-H: litter C, N, and P stoichiometry; L-N: leaf nutrient; L-H: leaf C, N, and P stoichiometry.
4. Discussion
4.1. Differences in C, N, and P Contents and Stoichiometry in Leaves, Litter, and Soil
Previous research has shown that thinning significantly increases soil C, N, and P contents [6]. Some researchers have theorized that thinning can open the upper canopy, leading to warmer and wetter soils, enhanced microbial activity, and, ultimately, faster nitrogen cycling [26,27,28]. On the other hand, other researchers believe that thinning reduces the amount of litter entering the soil, limiting soil N cycling [13]. However, our study showed that soil TN was not affected by intercropping, regardless of season. Zhou et al. [7] conducted a meta-analysis of 1228 observations from 115 studies worldwide and showed that intercropping did not significantly affect soil TN, which corroborated our findings. However, this finding is inconsistent with the results of previous studies [13,26,27,28]. This may be due to the complex mechanism of soil nitrogen cycling, which is influenced by factors such as forest biological communities, climate, and thinning systems (thinning intensity and recovery year after thinning) [7].
Koerselman and Meuleman [29] pointed out that N:P < 14 indicates N limitation. However, our research showed that the soil C:N, C:P, and N:P ratios of the three thinning methods were lower than the global forest soil average C:N (12.4), average C:P (81.9), and average N:P (6.6) (Table 3). Cleveland and Liptzin [30] suggested that soil is restricted by the N supply. Mosca et al. [31] also found that thinning could reduce the input of litter into the soil, thereby limiting soil N cycling. This may be because although thinning did not affect soil TN content, ET can significantly increase soil TP. Zhou et al. [7] also found that thinning resulted in a 6.1% increase in soil TP. Most research results have shown that thinning not only leads to an increase in input soil residues but also stimulates the growth of understory plants, requiring a large amount of P, which can mobilize the redistribution of soil P [7,32,33].
Thinning is a key driving factor affecting soil C cycling as the partial logging of forests can alter forest plant biodiversity and functional trait composition [34]. Some studies have shown that thinning can lead to soil OC loss by reducing the litter input [35]. Other studies suggest that thinning can slow down litter decomposition and increase the accumulation of soil OC [36]. The main reason for the contrasting results is the different climatic conditions and tree species characteristics at the study site [36]. Our results indicate that thinning reduces soil OC accumulation but significantly increases litter OC content. This phenomenon may be attributable to the effects of thinning on the canopy openness and microenvironmental conditions. Thinning disrupts the characteristic buffering and stable microclimate of closed-canopy forests, thereby impairing microbial activity and litter decomposition. Additionally, it influences the activities of soil saprophytic and detrital organisms, which are crucial agents in the decomposition of litter and soil organic matter [37,38,39].
Plants primarily obtain N and P from the soil, and the soil nutrient content plays a significant role in regulating the stoichiometry of C, N, and P in plants [40]. Our results showed that the leaves had the highest C, N, and P contents (Table 2). This is because leaves are responsible for photosynthesis and require sufficient C, N, and P to synthesize various enzymes for biochemical reactions [41]. Sterner and Elser [42] suggested that homeostatic organisms can maintain stable levels of various elements and their ratios in fluctuating environments. This ability demonstrates how organisms have adapted to their environment over many generations [43]. In general, the most active organ has the greatest need for essential elements, such as N and P [41]. Based on this, Zhang et al. [41] proposed the hypothesis that highly active organs would exhibit stricter N:P stoichiometry homeostasis to ensure optimal material and energy efficiency. In this study, we found that N, P, and N:P homeostasis was highest in the litter, followed by leaves, supporting the hypothesis that more active organs have a higher capacity to maintain relatively stable element contents and ratios.
4.2. Effects of Season on C, N, and P Contents and Stoichiometry in Leaves, Litter, and Soil
Seasonal fluctuations in C, N, and P contents and stoichiometry in leaves, litter, and soil play a critical role in regulating plant community responses to environmental changes [44]. The prevailing scholarly consensus posits that plants achieve a relative equilibrium with their external environment by regulating their nutritional attributes and physiological processes. Additionally, the stoichiometry of plant ecosystems exhibits seasonal variability [45,46]. Our results showed that seasons have a direct positive impact on soil C, N, and P contents, as well as the chemical stoichiometry of litter and leaves, whereas they have a direct negative impact on leaf C, N, and P contents.
Climate drives plant N-use strategies and plant-soil interactions. Rivas-Ubach et al. [15] argued that plants use specific strategies to adapt to their environment and physiological metabolism changes in different seasons, thereby affecting their C, N, and P stoichiometry. Elser et al. [47] found that species with high relative growth rates tend to have low foliar N:P ratios. Our results showed that litter C, litter N, litter P, leaf N, and leaf P contents for all thinning methods were the highest in the LWS, and among the ecological stoichiometric ratios, the C:N, C:P, and N:P ratios of litter; C:N, C:P, and N:P ratios of leaves; and C:P and N:P ratios of soil were the lowest in the LWS, which is not consistent with some previous research results [18,48]. The reasons for these trends are as follows: (1) In the LWS, the litter mass is constantly rising as microorganisms decompose it to release N. This decomposition also increases the N content of the litter [49]. (2) Plants transport accumulated organic matter from their leaves to other plant parts for storage, which requires a large amount of transport proteins, resulting in a significant increase in the leaf N content [50]. (3) Zhou et al. [7] found that the effect sizes of N cycling processes were significantly correlated with the mean annual precipitation and mean annual temperature, suggesting that these N fluxes are more sensitive to thinning in warm and humid regions. The climatic conditions in the study area were characterized by dryness during the LDS and EWS, with increased rainfall occurring during the LWS.
5. Conclusions
The C, N, and P contents and stoichiometric homeostasis of C. funebris in the plant-litter-soil system have different trends under different thinning methods and seasonal variations. Overall, the C, N, and P contents and C:N:P ratio in leaves, litter, and soils varied widely and were strongly influenced by thinning method and season. Season and thinning method significantly affect the internal stability of P stoichiometric homeostasis, and the litter P content under ET (EWS) was categorized as plastic. The results of the structural equation model show that thinning method has a direct positive impact on the C, N, and P contents of the leaves and a direct negative impact on the chemical stoichiometry of leaves and soil. Season has a direct positive impact on soil C, N, and P contents as well as the chemical stoichiometry of litter and leaves, whereas they have a direct negative impact on leaf C, N, and P contents. Therefore, when artificially managing C. funebris forests, it is necessary to consider a combination of thinning and seasonal dynamics and develop appropriate nurturing management measures. However, studying the stoichiometry of C, N, and P during a single year can lead to uncertain results due to the annual variability. Therefore, in future research, it will be necessary to observe the stoichiometry of C, N, and P over several consecutive years.
Author Contributions
All authors contributed to the study conception and design. Material preparation and data collection and analysis were performed by X.J., J.Y. (Jingtian Yang), Y.Y., J.Y. (Jiaping Yang), Q.D., H.Z., K.Z., N.X., D.L., M.L., J.Y. (Jiayi Yuan) and Q.W. The first draft of the manuscript was written by X.J. and Q.W. All authors commented on the previous versions of the manuscript. All authors have read and agreed to the published version of the manuscript.
Funding
This research was financially supported by the National Natural Science Foundation of China (32071747), the Sichuan Provincial Science and Technology Department Project (2023NSFSC1194, 2022NSFSC1175, and 2023NSFSC0750), the Ecological and Security Key Laboratory of Sichuan Province, China (ESP2204), and the Scientific Research Project of Mianyang Normal University (QD2022A02).
Data Availability Statement
Data and materials can be obtained from the authors upon reasonable request.
Conflicts of Interest
The authors have no relevant financial or non-financial interests to disclose.
References
- Gruber, N.; Galloway, J.N. An Earth-system perspective of the global nitrogen cycle. Nature 2008, 451, 293–296. [Google Scholar] [CrossRef]
- Chen, H.; Xiang, Y.; Yao, Z.; Zhang, Q.; Li, H.; Cheng, M. Stability of C:N:P Stoichiometry in the Plant–Soil Continuum along Age Classes in Natural Pinus tabuliformis Carr. Forests of the Eastern Loess Plateau, China. Forests 2023, 14, 44. [Google Scholar] [CrossRef]
- Lin, Y.; Lai, Y.; Tang, S.; Qin, Z.; Liu, J.; Kang, F.; Kuang, Y. Climatic and edaphic variables determine leaf C, N, P stoichiometry of deciduous Quercus species. Plant Soil 2022, 474, 383–394. [Google Scholar] [CrossRef]
- Skovsgaard, J.P.; Vanclay, J.K. Forest site productivity: A review of the evolution of dendrometric concepts for even-aged stands. Forestry 2008, 81, 13–31. [Google Scholar] [CrossRef]
- Bai, X.; Wang, B.; An, S.; Zeng, Q.; Zhang, H. Response of forest species to C:N:P in the plant-litter-soil system and stoichiometric homeostasis of plant tissues during afforestation on the Loess Plateau, China. CATENA 2019, 183, 104186. [Google Scholar] [CrossRef]
- Qiu, X.; Wang, H.; Peng, D.; Liu, X.; Yang, F.; Li, Z.; Cheng, S. Thinning drives C:N:P stoichiometry and nutrient resorption in Larix principis-rupprechtii plantations in North China. For. Ecol. Manag. 2020, 462, 117984. [Google Scholar] [CrossRef]
- Zhou, T.; Wang, C.; Zhou, Z. Thinning promotes the nitrogen and phosphorous cycling in forest soils. Agric. For. Meteorol. 2021, 311, 108665. [Google Scholar] [CrossRef]
- Rajeev, J.; Kumar, K.C.J.; Prasad, D.P.; Utpal, D. Exploring the Impact of Thinning Operations on Forest Ecosystems in Tropical and Temperate Regions Worldwide: A Comprehensive Review. J. Resour. Ecol. 2023, 14, 1227–1242. [Google Scholar] [CrossRef]
- Dupuy, J.M.; Chazdon, R.L. Interacting effects of canopy gap, understory vegetation and leaf litter on tree seedling recruitment and composition in tropical secondary forests. For. Ecol. Manag. 2008, 255, 3716–3725. [Google Scholar] [CrossRef]
- Han, M.; Zhu, B. Changes in soil greenhouse gas fluxes by land use change from primary forest. Glob. Chang. Biol. 2020, 26, 2656–2667. [Google Scholar] [CrossRef]
- Wu, L.J.; Li, W.Z.; Wei, W.; Yang, Y.L.; Lin, J.; Wu, Q.G. Effects of Alnus cremastogyne-Cupressus funebris strip reform on soil C:N:P stoichiometry of Cupressus funebris forests in a hilly area of central Sichuan Basin. Chin. J. Appl. Environ. Biol. 2020, 26, 425–432. [Google Scholar] [CrossRef]
- Zhao, B.; Ballantyne, A.P.; Meng, S.; Zhao, G.; Zheng, Z.; Zhu, J.; Cao, J.; Zhang, Y.; Zhao, X. Understory plant removal counteracts tree thinning effect on soil respiration in a temperate forest. Glob. Chang. Biol. 2022, 28, 6102–6113. [Google Scholar] [CrossRef] [PubMed]
- Muscolo, A.; Sidari, M.; Mercurio, R. Influence of gap size on organic matter decomposition, microbial biomass and nutrient cycle in Calabrian pine (Pinus laricio, Poiret) stands. For. Ecol. Manag. 2007, 242, 412–418. [Google Scholar] [CrossRef]
- Yang, Y.; Yang, H.; Wang, Q.; Dong, Q.; Yang, J.; Wu, L.; You, C.; Hu, J.; Wu, Q. Effects of Two Management Practices on Monthly Litterfall in a Cypress Plantation. Forests 2022, 13, 1581. [Google Scholar] [CrossRef]
- Rivas-Ubach, A.; Sardans, J.; Pérez-Trujillo, M.; Estiarte, M.; Peñuelas, J. Strong relationship between elemental stoichiometry and metabolome in plants. Proc. Natl. Acad. Sci. USA 2012, 109, 4181–4186. [Google Scholar] [CrossRef] [PubMed]
- Orgeas, J.; Ourcival, J.-M.; Bonin, G. Seasonal and spatial patterns of foliar nutrients in cork oak (Quercus suber L.) growing on siliceous soils in Provence (France). Plant Ecol. 2003, 164, 201–211. [Google Scholar] [CrossRef]
- Townsend, A.R.; Cleveland, C.C.; Asner, G.P.; Bustamante, M.M.C. Controls over foliar N:P ratios in tropical rain forests. Ecology 2007, 88, 107–118. [Google Scholar] [CrossRef]
- Liu, R.; Wang, D. C:N:P stoichiometric characteristics and seasonal dynamics of leaf-root-litter-soil in plantations on the loess plateau. Ecol. Indic. 2021, 127, 107772. [Google Scholar] [CrossRef]
- Chen, S.L.; Zhao, M.; Li, X.W.; Fan, C.; Xiao, B.R. Study on plant diversity and niche characteristics of dominant her-baceous populations under different reconstruction patterns in low efficiency stands of Cupressus funebri. Acta Ecol. Sin. 2018, 38, 143–155. [Google Scholar]
- Wang, Y.; Chen, S.; He, W.; Ren, J.; Wen, X.; Wang, Y.; Li, X.; Chen, G.; Feng, M.; Fan, C. Shrub Diversity and Niche Characteristics in the Initial Stage of Reconstruction of Low-Efficiency Cupressus funebris Stands. Forests 2021, 12, 1492. [Google Scholar] [CrossRef]
- He, W.; Luo, C.; Wang, Y.; Wen, X.; Wang, Y.; Li, T.; Chen, G.; Zhao, K.; Li, X.; Fan, C. Response Strategies of Root System Architecture to Soil Environment: A Case Study of Single-Species Cupressus funebris Plantations. Front. Plant Sci. 2022, 13, 822223. [Google Scholar] [CrossRef]
- Wu, B.; Qi, S. Effects of Underlay on Hill-Slope Surface Runoff Process of Cupressus funebris Endl. Plantations in Southwestern China. Forests 2021, 12, 644. [Google Scholar] [CrossRef]
- Baran, J.; Pielech, R.; Kauzal, P.; Kukla, W.; Bodziarczyk, J. Influence of forest management on stand structure in ravine forests. For. Ecol. Manag. 2020, 463, 118018. [Google Scholar] [CrossRef]
- Bao, S.D. Soil and Agriculture Chemistry Analysis; China Agriculture Press: Beijing, China, 2010. [Google Scholar]
- Persson, J.; Fink, P.; Goto, A.; Hood, J.M.; Jonas, J.; Kato, S. To be or not to be what you eat: Regulation of stoichiometric homeostasis among autotrophs and heterotrophs. Oikos 2010, 119, 741–751. [Google Scholar] [CrossRef]
- Hassett, J.E.; Zak, D.R. Aspen Harvest Intensity Decreases Microbial Biomass, Extracellular Enzyme Activity, and Soil Nitrogen Cycling. Soil Sci. Soc. Am. J. 2005, 69, 227–235. [Google Scholar] [CrossRef]
- Ma, S.; Concilio, A.; Oakley, B.; North, M.; Chen, J. Spatial variability in microclimate in a mixed-conifer forest before and after thinning and burning treatments. For. Ecol. Manag. 2010, 259, 904–915. [Google Scholar] [CrossRef]
- Ma, J.; Kang, F.; Cheng, X.; Han, H. Moderate thinning increases soil organic carbon in Larix principis-rupprechtii (Pinaceae) plantations. Geoderma 2018, 329, 118–128. [Google Scholar] [CrossRef]
- Koerselman, W.; Meuleman, A.F.M. The Vegetation N:P Ratio: A New Tool to Detect the Nature of Nutrient Limitation. J. Appl. Ecol. 1996, 33, 1441. [Google Scholar] [CrossRef]
- Cleveland, C.C.; Liptzin, D. C:N:P stoichiometry in soil:is there a “Redfield ratio”for the microbial biomass? Biochemistry 2007, 85, 235–252. [Google Scholar]
- Mosca, E.; Montecchio, L.; Scattolin, L.; Garbaye, J. Enzymatic activities of three ectomycorrhizal types of Quercus robur L. in relation to tree decline and thinning. Soil Biol. Biochem. 2007, 39, 2897–2904. [Google Scholar] [CrossRef]
- Tian, H.; Cheng, X.; Han, H.; Jing, H.; Liu, X.; Li, Z. Seasonal Variations and Thinning Effects on Soil Phosphorus Fractions in Larix principis-rupprechtii Mayr. Plantations. Forests 2019, 10, 172. [Google Scholar] [CrossRef]
- Rocha, J.H.T.; Menegale, M.L.; Rodrigues, M.; Gonçalves, J.L.d.M.; Pavinato, P.S.; Foltran, E.C.; Harrison, R.; James, J.N. Impacts of timber harvest intensity and P fertilizer application on soil P fractions. For. Ecol. Manag. 2019, 437, 295–303. [Google Scholar] [CrossRef]
- Henneron, L.; Chauvat, M.; Archaux, F.; Akpa-Vinceslas, M.; Bureau, F.; Dumas, Y.; Ningre, F.; Richter, C.; Balandier, P.; Aubert, M. Plasticity in leaf litter traits partly mitigates the impact of thinning on forest floor carbon cycling. Funct. Ecol. 2018, 32, 2777–2789. [Google Scholar] [CrossRef]
- Xu, S.; Liu, L.L.; Sayer, E.J. Variability of above-ground litter inputs alters soil physicochemical and biological processes: A meta-analysis of litterfall-manipulation experiments. Biogeosciences 2013, 10, 7423–7433. [Google Scholar] [CrossRef]
- González, G.; Lodge, D.J.; Richardson, B.A.; Richardson, M.J. A canopy trimming experiment in Puerto Rico: The response of litter decomposition and nutrient release to canopy opening and debris deposition in a subtropical wet forest. For. Ecol. Manag. 2014, 332, 32–46. [Google Scholar] [CrossRef]
- García-Palacios, P.; Maestre, F.T.; Kattge, J.; Wall, D.H. Climate and litter quality differently modulate the effects of soil fauna on litter decomposition across biomes. Ecol. Lett. 2013, 16, 1045–1053. [Google Scholar] [CrossRef]
- Henneron, L.; Aubert, M.; Bureau, F.; Dumas, Y.; Ningre, F.; Perret, S.; Richter, C.; Balandier, P.; Chauvat, M. Forest management adaptation to climate change: A Cornelian dilemma between drought resistance and soil macro-detritivore functional diversity. J. Appl. Ecol. 2015, 52, 913–927. [Google Scholar] [CrossRef]
- Joly, F.; Milcu, A.; Scherer-Lorenzen, M.; Jean, L.; Bussotti, F.; Dawud, S.M.; Müller, S.; Pollastrini, M.; Raulund-Rasmussen, K.; Vesterdal, L.; et al. Tree species diversity affects decomposition through modified micro-environmental conditions across European forests. New Phytol. 2017, 214, 1281–1293. [Google Scholar] [CrossRef]
- Gusewell, S. N:P ratios in terrestrial plants:variation and functional significance. New Phytol. 2004, 164, 243–266. [Google Scholar] [CrossRef]
- Zhang, J.; Li, M.; Xu, L.; Zhu, J.; Dai, G.; He, N. C: N: P stoichiometry in terrestrial ecosystems in China. Sci. Total Environ. 2021, 795, 148849. [Google Scholar] [CrossRef]
- Sterner, R.W.; Elser, J.J. Ecological Stoichiometry: The Biology of Elements from Molecules to the Biosphere; Princeton University Press: Princeton, NJ, USA, 2002. [Google Scholar]
- Yu, Q.; Elser, J.J.; He, N.P.; Wu, H.H.; Chen, Q.S.; Zhang, G.M.; Han, X.G. Stoichiometric homeostasis of vascular plants in the Inner Mongolia grassland. Oecologia 2011, 166, 1–10. [Google Scholar] [CrossRef]
- Dong, C.; Qiao, Y.; Cao, Y.; Chen, Y.; Wu, X.; Xue, W. Seasonal Variations in Carbon, Nitrogen and Phosphorus Stoichiometry of a Robinia pseudoacacia Plantation on the Loess Hilly Region, China. Forests 2021, 12, 214. [Google Scholar] [CrossRef]
- Wright, I.J.; Westoby, M. Nutrient concentration, resorption and lifespan: Leaf traits of Australian sclerophyll species. Funct. Ecol. 2003, 17, 10–19. [Google Scholar] [CrossRef]
- Yang, Y.; Luo, Y. Carbon: Nitrogen stoichiometry in forest ecosystems during stand development. Glob. Ecol. Biogeogr. 2011, 20, 354–361. [Google Scholar] [CrossRef]
- Elser, J.J.; Fagan, W.F.; Kerkhoff, A.J.; Swenson, N.G.; Enquist, B.J. Biological stoichiometry of plant production: Metabolism, scaling and ecological response to global change. New Phytol. 2010, 186, 593–608. [Google Scholar] [CrossRef]
- Li, H.; Crabbe, M.J.C.; Xu, F.; Wang, W.; Ma, L.; Niu, R.; Gao, X.; Li, X.; Zhang, P.; Ma, X.; et al. Seasonal variations in carbon, nitrogen and phosphorus concentrations and C:N:P stoichiometry in different organs of a Larix principis-rupprechtii Mayr. plantation in the Qinling Mountains, China. PLoS ONE 2017, 12, e0185163. [Google Scholar] [CrossRef]
- Robbins, C.J.; Matthaeus, W.J.; Cook, S.C.; Housley, L.M.; Robison, S.E.; Garbarino, M.A.; LeBrun, E.S.; Raut, S.; Tseng, C.Y.; King, R.S. Leaf litter identity alters the timing of lotic nutrient dynamics. Freshw. Biol. 2019, 64, 2247–2259. [Google Scholar] [CrossRef]
- Zhang, Q.; Zhou, J.; Li, X.; Yang, Z.; Zheng, Y.; Wang, J.; Lin, W.; Xie, J.; Chen, Y.; Yang, Y. Are the combined effects of warming and drought on foliar C:N:P: Kstoichiometry in a subtropical forest greater than their individual effects? For. Ecol. Manag. 2019, 448, 256–266. [Google Scholar] [CrossRef]
Disclaimer/Publisher’s Note: The statements, opinions and data contained in all publications are solely those of the individual author(s) and contributor(s) and not of MDPI and/or the editor(s). MDPI and/or the editor(s) disclaim responsibility for any injury to people or property resulting from any ideas, methods, instructions or products referred to in the content. |
© 2024 by the authors. Licensee MDPI, Basel, Switzerland. This article is an open access article distributed under the terms and conditions of the Creative Commons Attribution (CC BY) license (https://creativecommons.org/licenses/by/4.0/).