Abstract
Quercus rehderiana Hand.-Mazz. belongs to Quercus sect. Heteroallenes’ of the Fagaceae family. It is widely distributed in forests with rocky and non-rocky desertification in Guizhou Province of Southwest China. However, our knowledge of the adaptation strategies of Quercus in forests with rocky desertification is surprisingly lacking. In this study, 16 leaf traits (morphological, anatomical, and chemical) of Quercus rehderiana were investigated in 15 individuals in five 20 × 20 m quadrants of forests with rocky and non-rocky desertification. The aim was to analyze their strategies of adaptation to arid and poor-soil environments in forests with rocky desertification. The results showed that Quercus rehderiana leaves in forests with rocky desertification had a greater leaf thickness, specific leaf area, abaxial epidermis thickness, and sponge mesophyll thickness but a lower leaf area than in forests with non-rocky desertification. Quercus rehderiana leaves in forests with rocky desertification had higher calcium and magnesium concentrations and a higher N:P ratio but lower potassium and phosphorus concentrations than in forests with non-rocky desertification. The results of principal component analysis showed that forests with rocky desertification tended to show resource-conserving strategies with thicker leaf tissue and a lower nutrient concentration, while forests with non-rocky desertification tended to show resource acquisition strategies with a greater leaf area and potassium concentration. In resource-poor environments, species that adopt conservative resource strategies are more likely to survive; therefore, we forecasted that more conservative, slow-growing Quercus rehderiana will be more stable over time.
1. Introduction
Quercus rehderiana Hand.-Mazz. is a genus of Quercus in the Fagaceae family that has important ecological significance and economic value for reasons including biodiversity maintenance, soil and water conservation, carbon storage, and energy demand [1]. Over the last few decades, the distribution range and original habitat of Quercus have gradually decreased due to the intensification of climate change and human disturbances combined with the lack of sustainable management [2]. Many species of animals associated with ecological connections, with plants of this genus especially, suffer from this [3,4]. Therefore, the stability of the ecosystem and the sustainable development of the social economy (in terms of fodder, fuelwood, charcoal, agricultural tools, bee boxes, etc.) are seriously threatened [5]. To date, a number of previous studies have focused on the population structure; spatial distribution [2,6,7]; and adaptations of the leaf, stem, and root traits of Quercus to different altitude gradients and environmental factors [8,9,10]. It is worth noting that Quercus rehderiana is distributed in forests with both rocky and non-rocky desertification in Guizhou Province [2]. However, a comprehensive understanding of the mechanism of adaptation of the functional traits of Quercus rehderiana to forests with rocky desertification is still lacking.
Plants with resource-acquiring ecological strategies have a greater specific leaf area, photosynthetic rate, and nutrient concentration, while those with resource-conserving strategies have the opposite [11,12]. Previous studies found that leaves in forests with rocky desertification adopted resource-conservating adaptation strategies because of their higher photosynthetic rate, water use efficiency, photosynthetic rate, phosphorus concentration, and adaxial and abaxial epidermis thickness than those of leaves of non-karst forest trees [13]. It is still an open question as to whether plants in forests with rocky desertification use resource-conservating or resource-acquiring strategies. Therefore, a comparative analysis of the functional traits of plants in forests with rocky and non-rocky desertification is helpful in revealing the physiological and ecological adaptation of plants to habitats that have undergone rocky desertification [13,14,15].
Due to water scarcity in forests with rocky desertification, plants need thicker leaves and leaf tissues and a greater specific leaf area but a lower leaf area and leaf dry matter content to maintain water storage in the plant body and capture more light resources. Therefore, we hypothesized that Quercus rehderiana leaves in forests with rocky desertification have a greater specific leaf area, leaf thickness, abaxial epidermis thickness, and spongy mesophyll thickness but a lower leaf area and leaf dry matter content than those in forests with non-rocky desertification. In addition, forests with rocky desertification have poor soil (more P limitation) and are rich in calcium and magnesium, resulting in the enrichment of calcium and magnesium in plants but lower phosphorus and potassium concentrations. Therefore, we hypothesized that Quercus rehderiana leaves in forests with rocky desertification have higher calcium and magnesium concentrations and a higher N:P ratio but lower phosphorus and potassium concentrations than in forests with non-rocky desertification. The results of this study are of practical significance for the prediction of the population dynamics of Quercus with the frequency of drought events and the aggravation of rocky desertification.
2. Materials and Methods
2.1. Study Site
The study area was located in Weining, Bijie City, northwestern Guizhou Province (103°36′–104°30′ E, 26°30′–27°25′ N; 2200 m a.s.l.). The study site is influenced by the monsoon climate, and the mean annual precipitation is ca. 1000 mm. The mean annual temperature is 12 °C. The soil types include yellow soil, yellow brown soil, and purple soil, and the pH value is 5.50. Due to disturbances and destruction resulting from human activities, the shrub and herb layers are sparse. The shrub layer mainly includes Corylus yunnanensis, Coriaria nepalensis, and Rhododendron simsii. The herbaceous layers include Plantago asiatica, Prunella vulgaris, Rubia cordifolia, Viola philippica, and a variety of ferns, such as Aratiostegia perdurans [16].
Rocky desertification is a phenomenon of vegetation and soil degradation and land productivity decline, and large areas of rock are exposed to the surface due to natural climate change and unreasonable human activities [17]. The environment of high temperatures, drought, and poor soil in forests with rocky desertification seriously restricts the growth and development of vegetation [18]. In addition, the soil in forests with rocky desertification is typically deficient in phosphorus [19] and rich in calcium [20].
2.2. Sampling
The classification of rocky desertification and non-rocky desertification is based on Li’s report; that is, the vegetation coverage of forests with rocky desertification is less than 50%, the rock exposure is more than 60%, and the average soil thickness is less than 15 cm [21]. From July to September 2021, five 20 m × 20 m quadrats were set on top of a mountain with low vegetation coverage, high rock exposure, and a thin soil layer, representing forests with rocky desertification. Five 20 m × 20 m quadrats were set on the foot of the mountain, where there was high vegetation coverage, low rock exposure, and a thick soil layer, representing forests with non-rocky desertification. We divided each 20 m × 20 m quadrat into four small quadrats of 10 m × 10 m. There was no Quercus rehderiana Hand.-Mazz. in some of the small quadrats in the forests with rocky desertification. Therefore, we selected 3 out of 4 small quadrats and selected Quercus rehderiana near the center of each small quadrat to collect leaves. For every individual, we used high pruning to cut branches and collected intact, healthy, mature, and sun-exposed leaves. We put the leaf samples into a sampling box containing an ice pack and brought it back to the laboratory for later trait measurement.
2.3. Trait Measurements
Plant functional traits are morpho-physio-phenological traits that potentially impact plant fitness through their effects on individuals’ growth, reproduction, and survival [22]. The leaf is an important organ of plant photosynthesis and is the most sensitive to environmental changes [11]. The effects of environmental changes on plant populations and communities are often reflected by the functional traits of leaves [23]. The functional traits of plant leaves indicate plants’ resource acquisition and utilization abilities and their resistance to adversity [24,25]. The synergistic or trade-off relationship of multiple leaf traits reflects the ecological strategy of plants [11,26,27].
Leaf functional traits were determined according to Cornelissen et al. (2003) [28] and Perez-Harguindeguy et al. (2016) [29]. Three to five leaf samples (one individual selected only three leaf samples, and twenty-nine individuals selected five leaf samples) were collected per individual to measure the leaf area (LA) using an HP Scanjet M231 scanner and the ImageJ software (https://imagej.en.softonic.com/ accessed on 22 May 2023). We measured the leaf fresh weight using an electronic balance (0.0001 g), and then leaf samples were oven-dried at 70 °C for 48 h. The specific leaf area (SLA) and dry matter content (LDMC) of the leaves were calculated. The SLA was the leaf area divided by the leaf dry weight. The LDMC was the dry weight divided by the fresh weight. Five to seven leaf tissue cross-section pictures were taken using a Binocular Biological Microscope (Leica DM2500, Wetzlar, Germany), and the leaf thickness (LT), adaxial epidermis thickness (Ada), abaxial epidermis thickness (Aba), palisade mesophyll thickness (PT), and spongy mesophyll thickness (ST) values were measured using the ImageJ Software (https://imagej.en.softonic.com/ accessed on 22 May 2023).
Leaf N, P, K, Ca, and Mg play an important role in organism composition and the regulation of the physiological mechanisms of plant growth and development [30]. The dried leaf samples were ground to a fine powder with a crusher and then passed through a 60-mesh sieve. The nitrogen concentration (N) and carbon concentration (C) were measured with a Dumas-type combustion C-N elemental analyzer (Vario MAX CN, Elementar Analysensysteme GmbH, Hanau, Germany). Phosphorus (P), potassium (K), calcium (Ca), and magnesium (Mg) were measured with an inductively coupled plasma atomic-emission spectrometer (iCAP 7400, Thermo Fisher Scientific, Bremen, Germany) [31,32]. The C:N ratio was calculated as a proxy of carbon assimilation when plants absorbed nutrients [33]. The N:P ratio was calculated as an indicator of nutrient limitation [34].
2.4. Data Analyses
Data on the leaf functional traits were used for single individuals. All data were log10-transformed to an approximate normal distribution before analysis. The difference between leaf traits was analyzed using an independent-sample t-test with the stats package. The correlation between traits was analyzed with Pearson’s correlation using the Hmisc package. A principal component analysis (PCA) was used to evaluate trait associations using the vegan package. All analyses were performed in R version 4.4.0 (R Core Team 2024).
3. Results
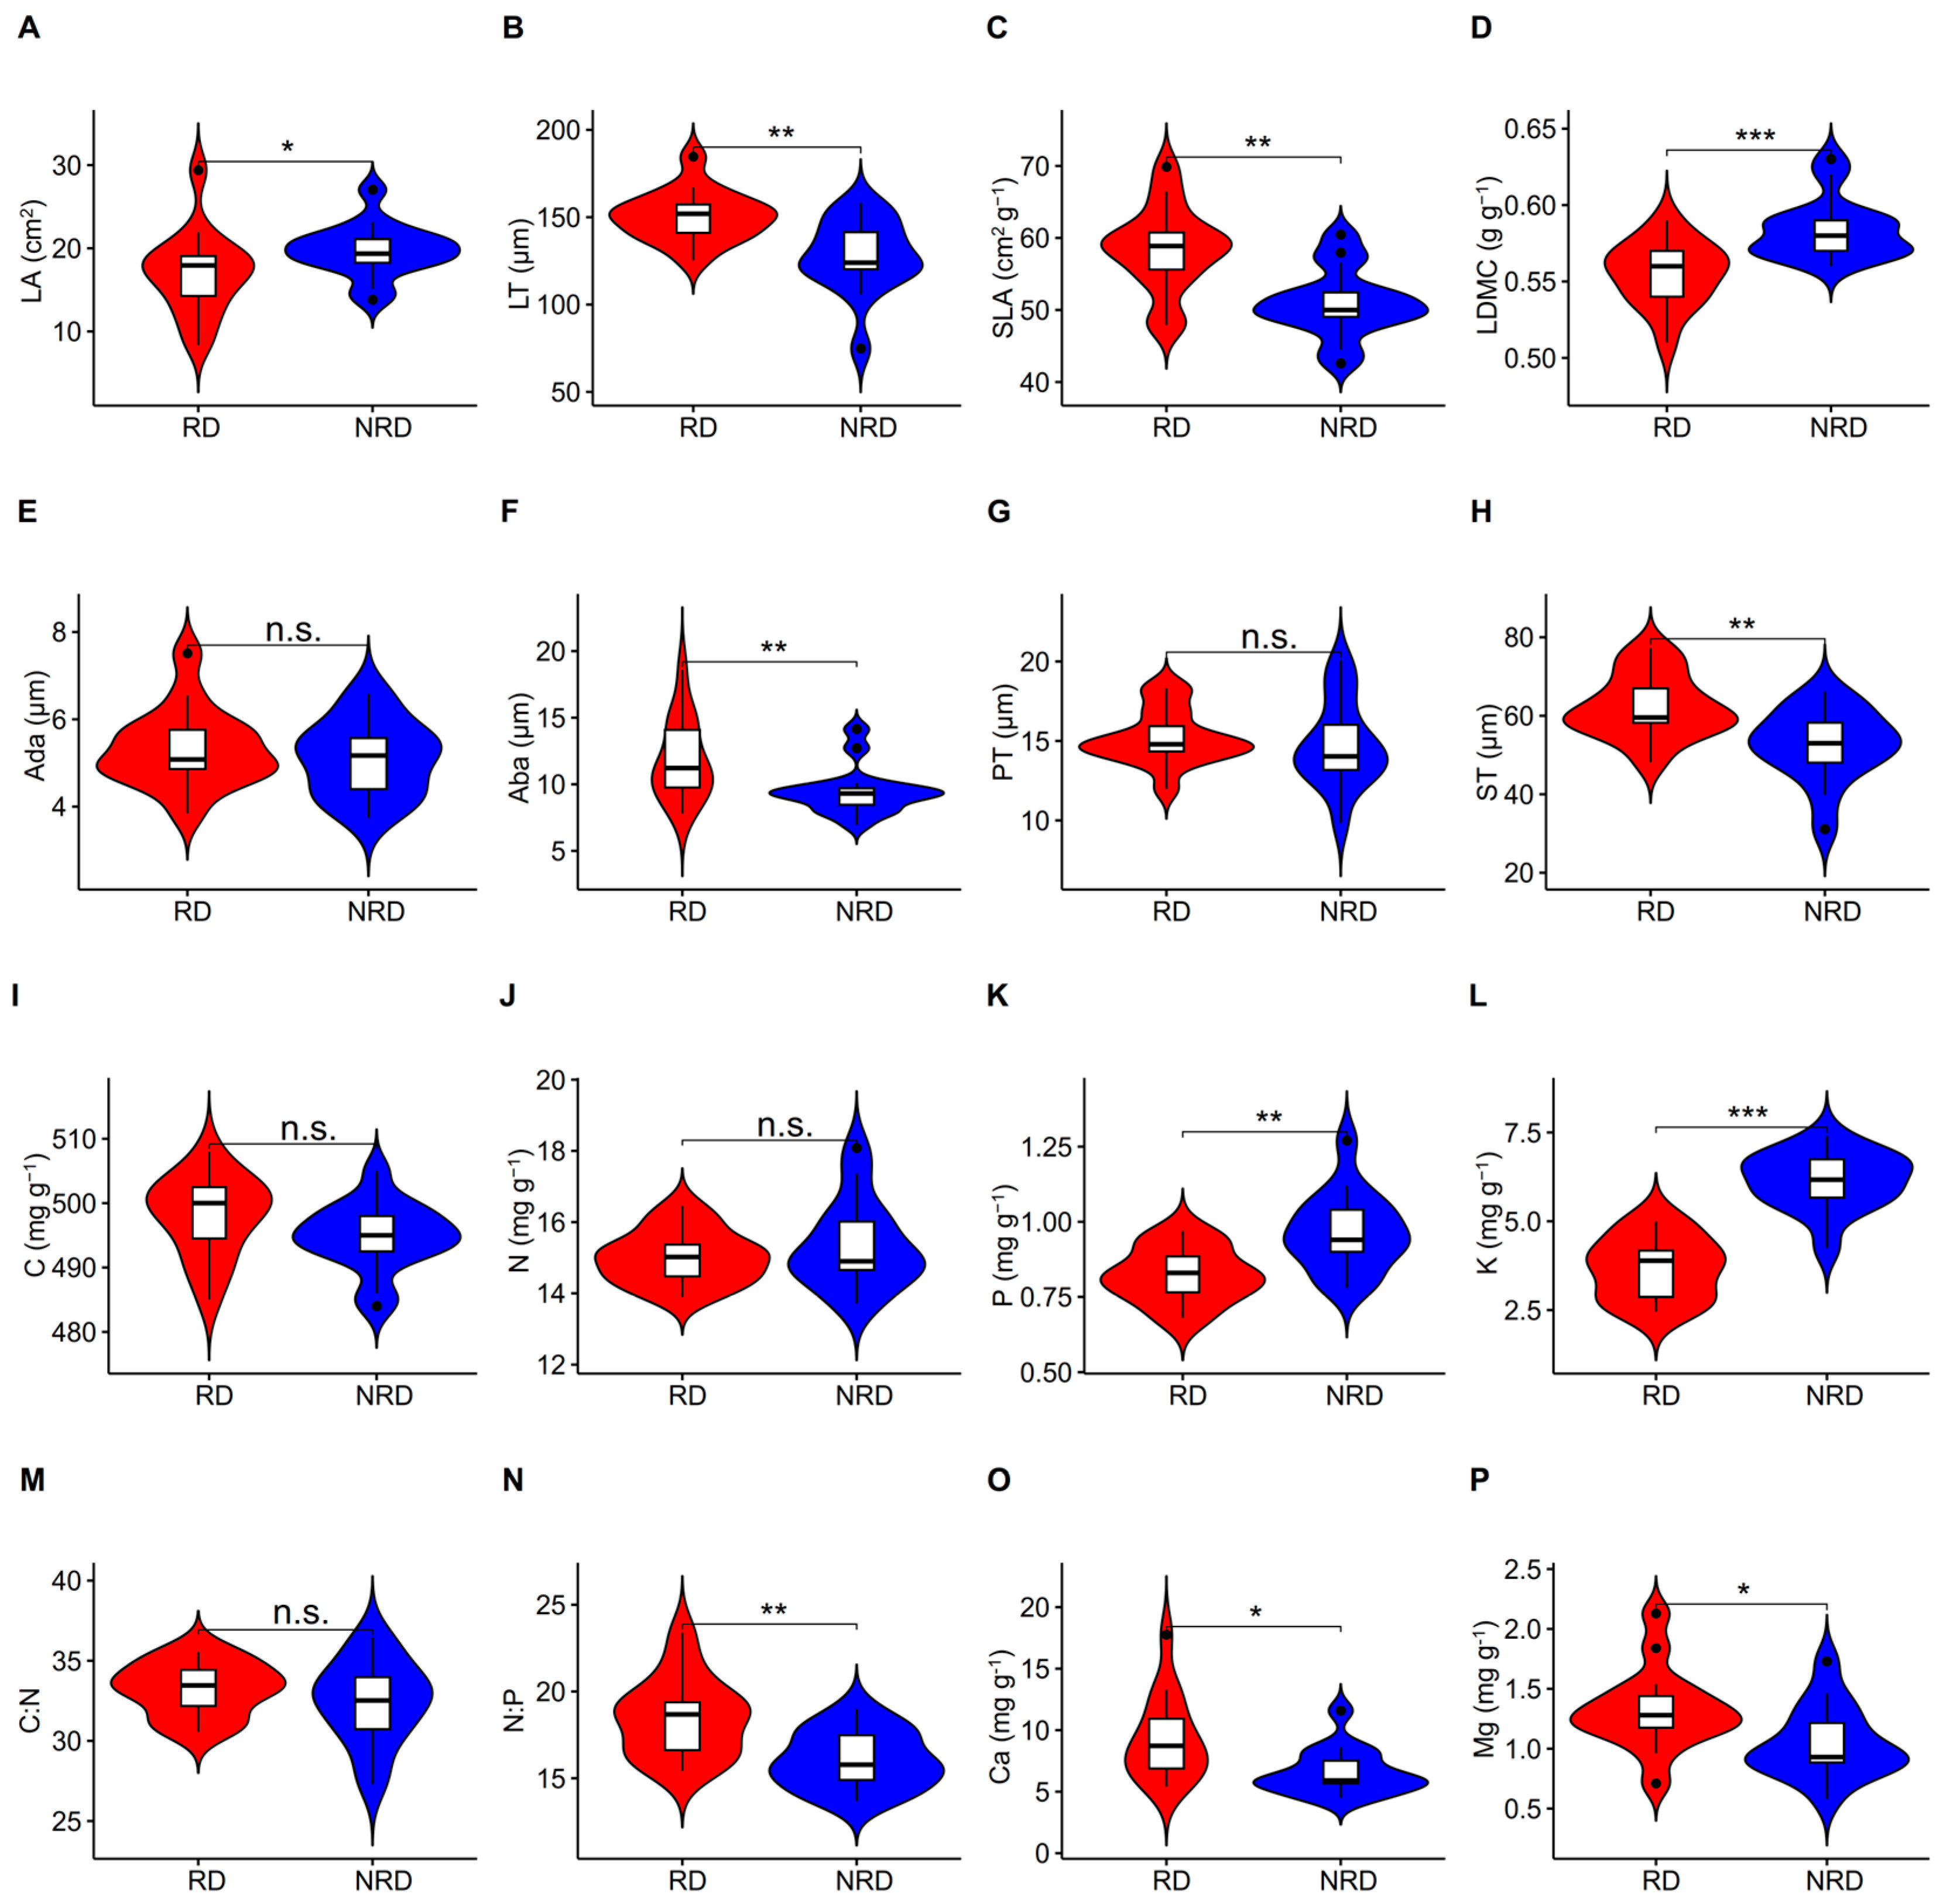
The LA, LDMC, P, and K in the forests with non-rocky desertification were significantly higher than those in the forests with rocky desertification (Figure 1A,D,K,L; Table S1). The LT, SLA, Aba, ST, N:P, Ca, and Mg in the environment with rocky desertification were significantly higher than those in forests with non-rocky desertification (Figure 1B,C,F,H,N,O,P). There were no significant differences in Ada, PT, C, N, and C:N between forests with rocky and non-rocky desertification (Figure 1E,G,I,J,M; Table S1).
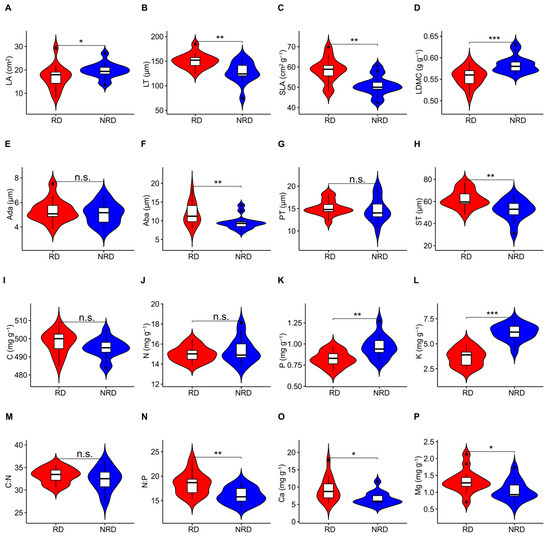
Figure 1.
T-test for differences in leaf traits between forests with rocky and non-rocky desertification. LA, leaf area; LT, leaf thickness; SLA, specific leaf area; LDMC, leaf dry matter content; Ada, adaxial epidermis thickness; Aba, abaxial epidermis thickness; PT, palisade mesophyll thickness; ST, spongy mesophyll thickness; N, nitrogen concentration; C, carbon concentration; P, phosphorus concentration; K, potassium concentration; C:N, C:N ratio; N:P, N:P ratio; Ca, calcium concentration; Mg, magnesium concentration. (A–P) indicates the serial number of figures. *, p < 0.05; **, p < 0.01; ***, p < 0.001.
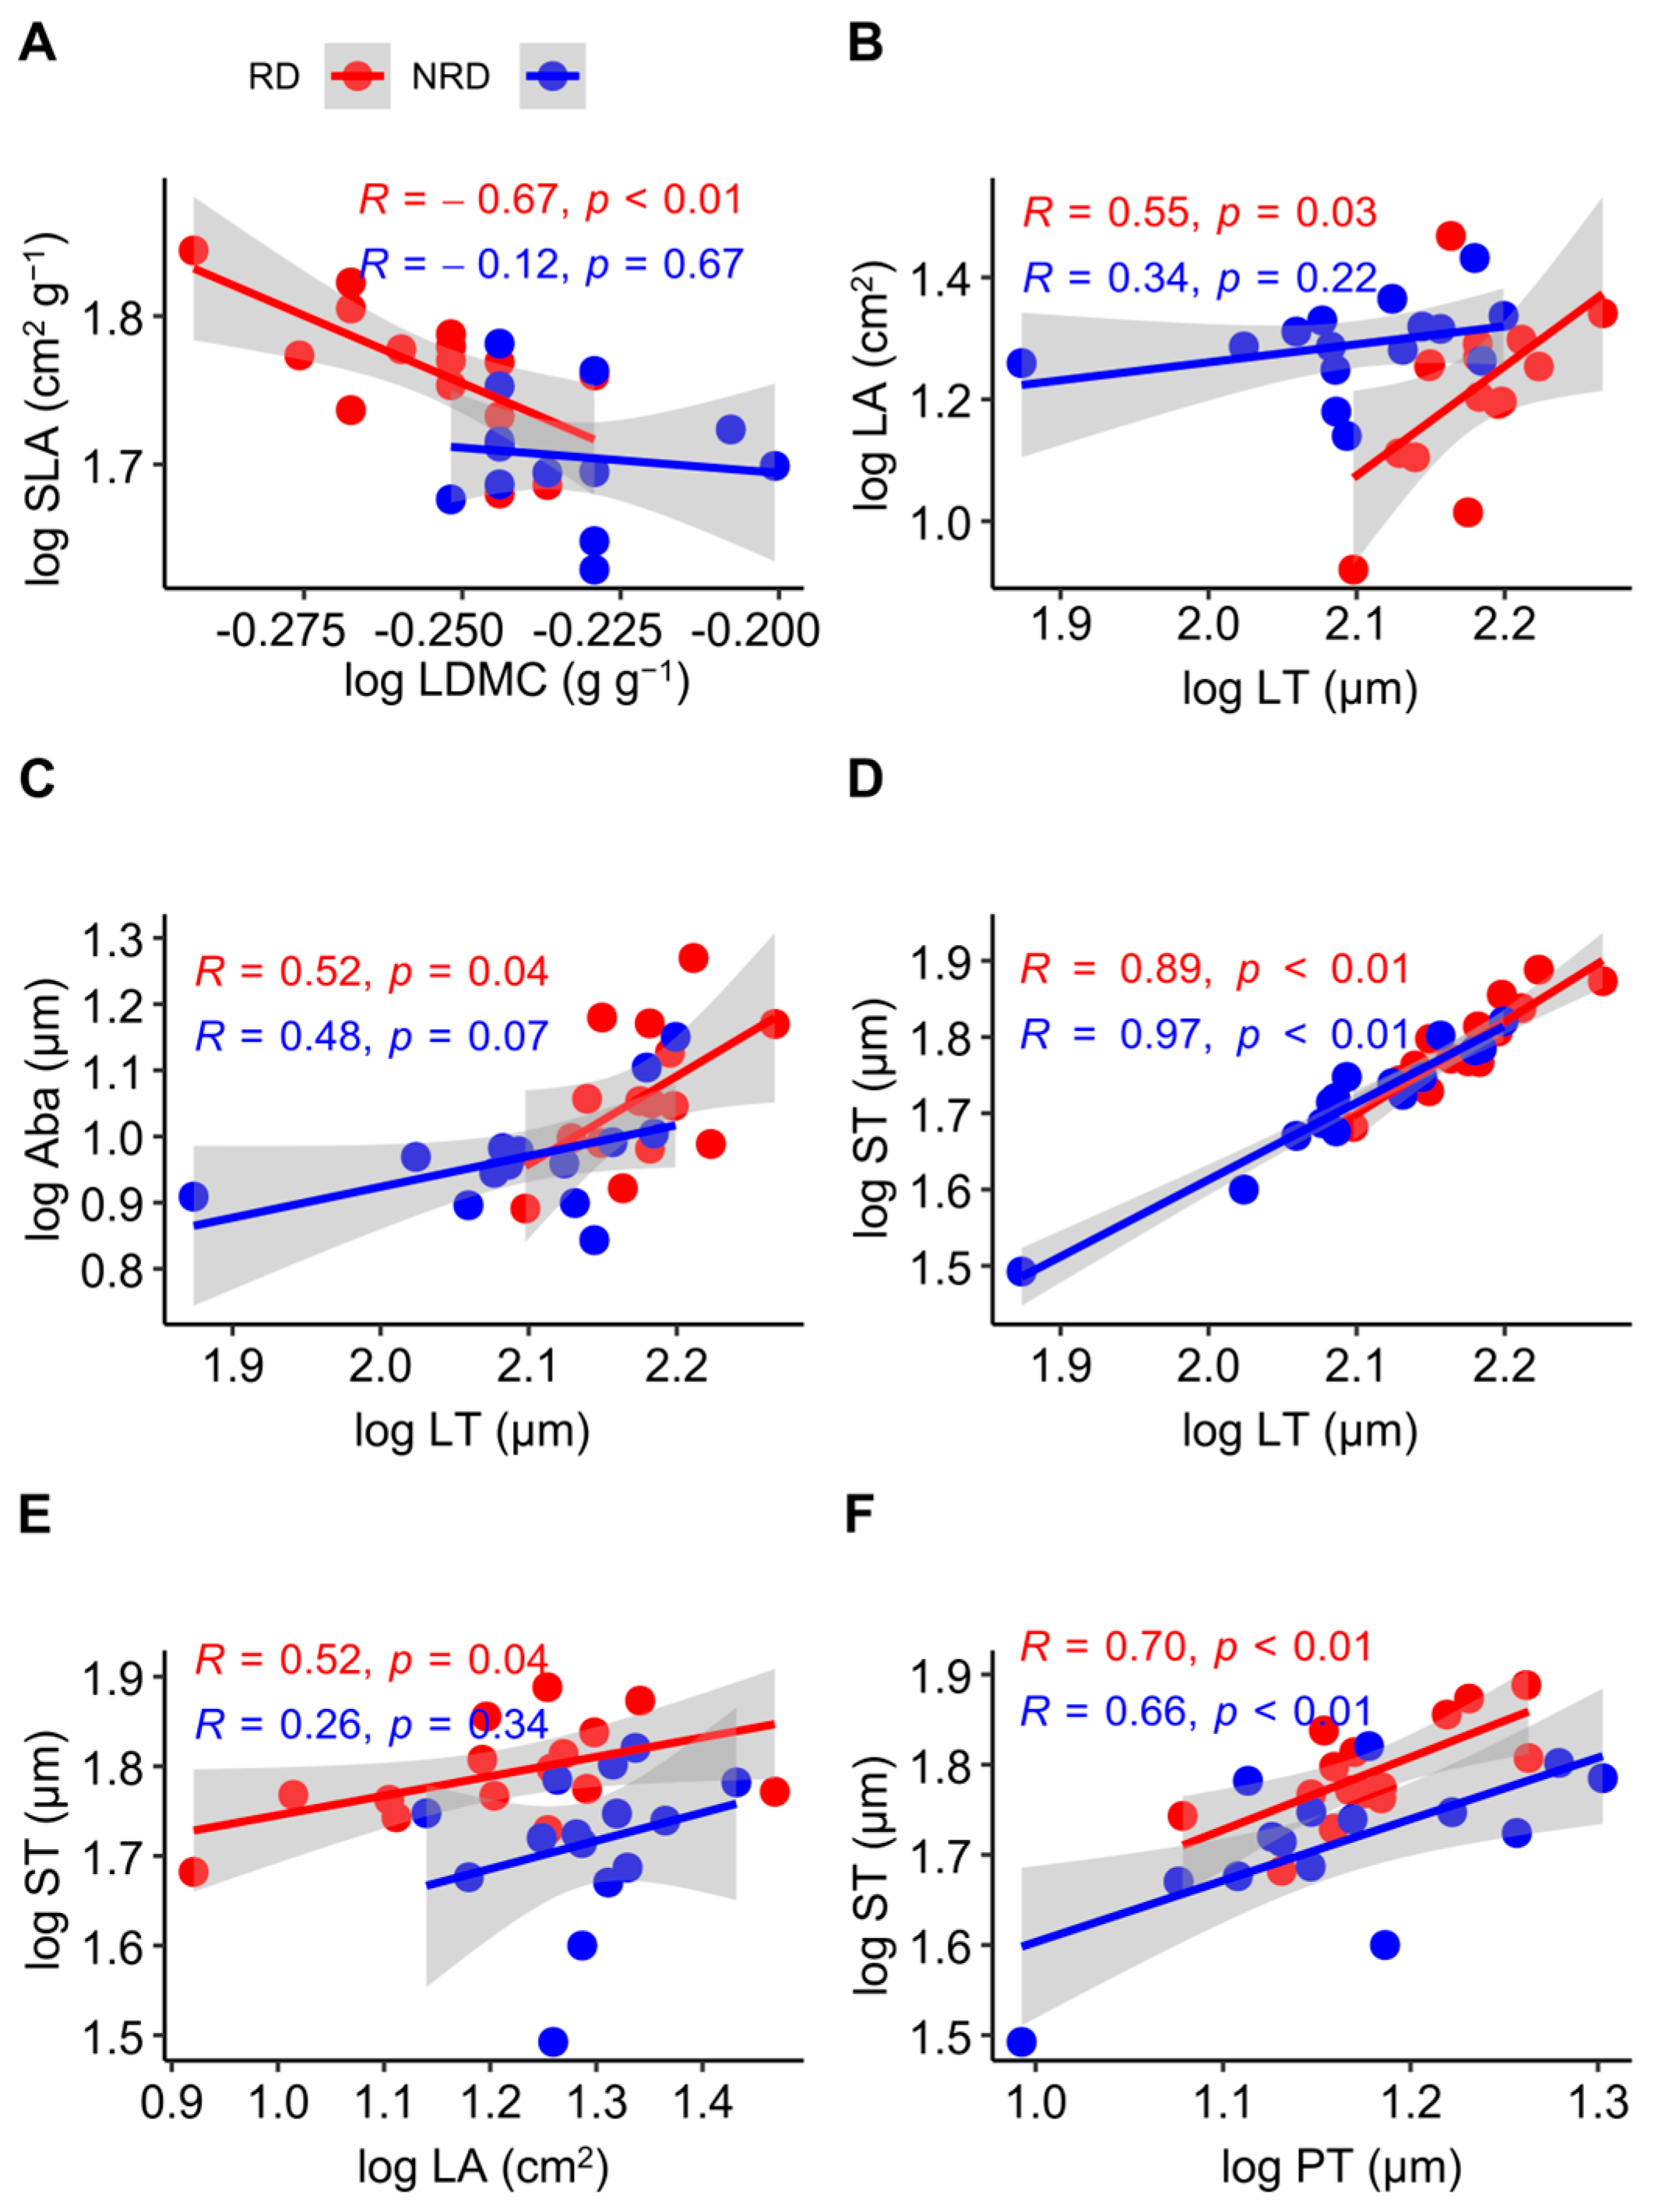
For the leaf morphological and anatomical traits, the SLA was negatively related to the LDMC in forests with rocky desertification (R = −0.67, p < 0.01), but this relationship was not significant in forests with non-rocky desertification (R = −0.12, p = 0.67) (Figure 2A). LT was positively related to LA (R = 0.55, p = 0.03) (Figure 2B) and Aba (R = 0.52, p = 0.04) (Figure 2C) in forests with non-rocky desertification, but this relationship was not significant in forests with non-rocky desertification (R = 0.34, p = 0.22; R = 0.48, p = 0.07). LT was positively related to ST both in forests with non-rocky desertification (R = 0.97, p < 0.01) and forests with rocky desertification (R = 0.89, p < 0.01) (Figure 2D). ST was positively related to LA in forests with rocky desertification (R = 0.52, p = 0.04), but this relationship was not significant in forests with non-rocky desertification (R = 0.26, p = 0.34) (Figure 2E). PT was positively related to ST both in forests with non-rocky desertification (R = 0.66, p < 0.01) and in forests with rocky desertification (R = 0.70, p < 0.01) (Figure 2F).

Figure 2.
Pearson’s correlation between leaf morphological and anatomical traits in Quercus rehderiana Hand.-Mazz. in forests with rocky and non-rocky desertification. LA, leaf area; LT, leaf thickness; SLA, specific leaf area; LDMC, leaf dry matter content; Aba, abaxial epidermis thickness; PT, palisade mesophyll thickness; ST, spongy mesophyll thickness. RD, rocky desertification; NRD, non-rocky desertification. (A–F) indicates the serial number of figures. p < 0.05, significant difference; p > 0.05, no significant difference; R, correlation coefficient.
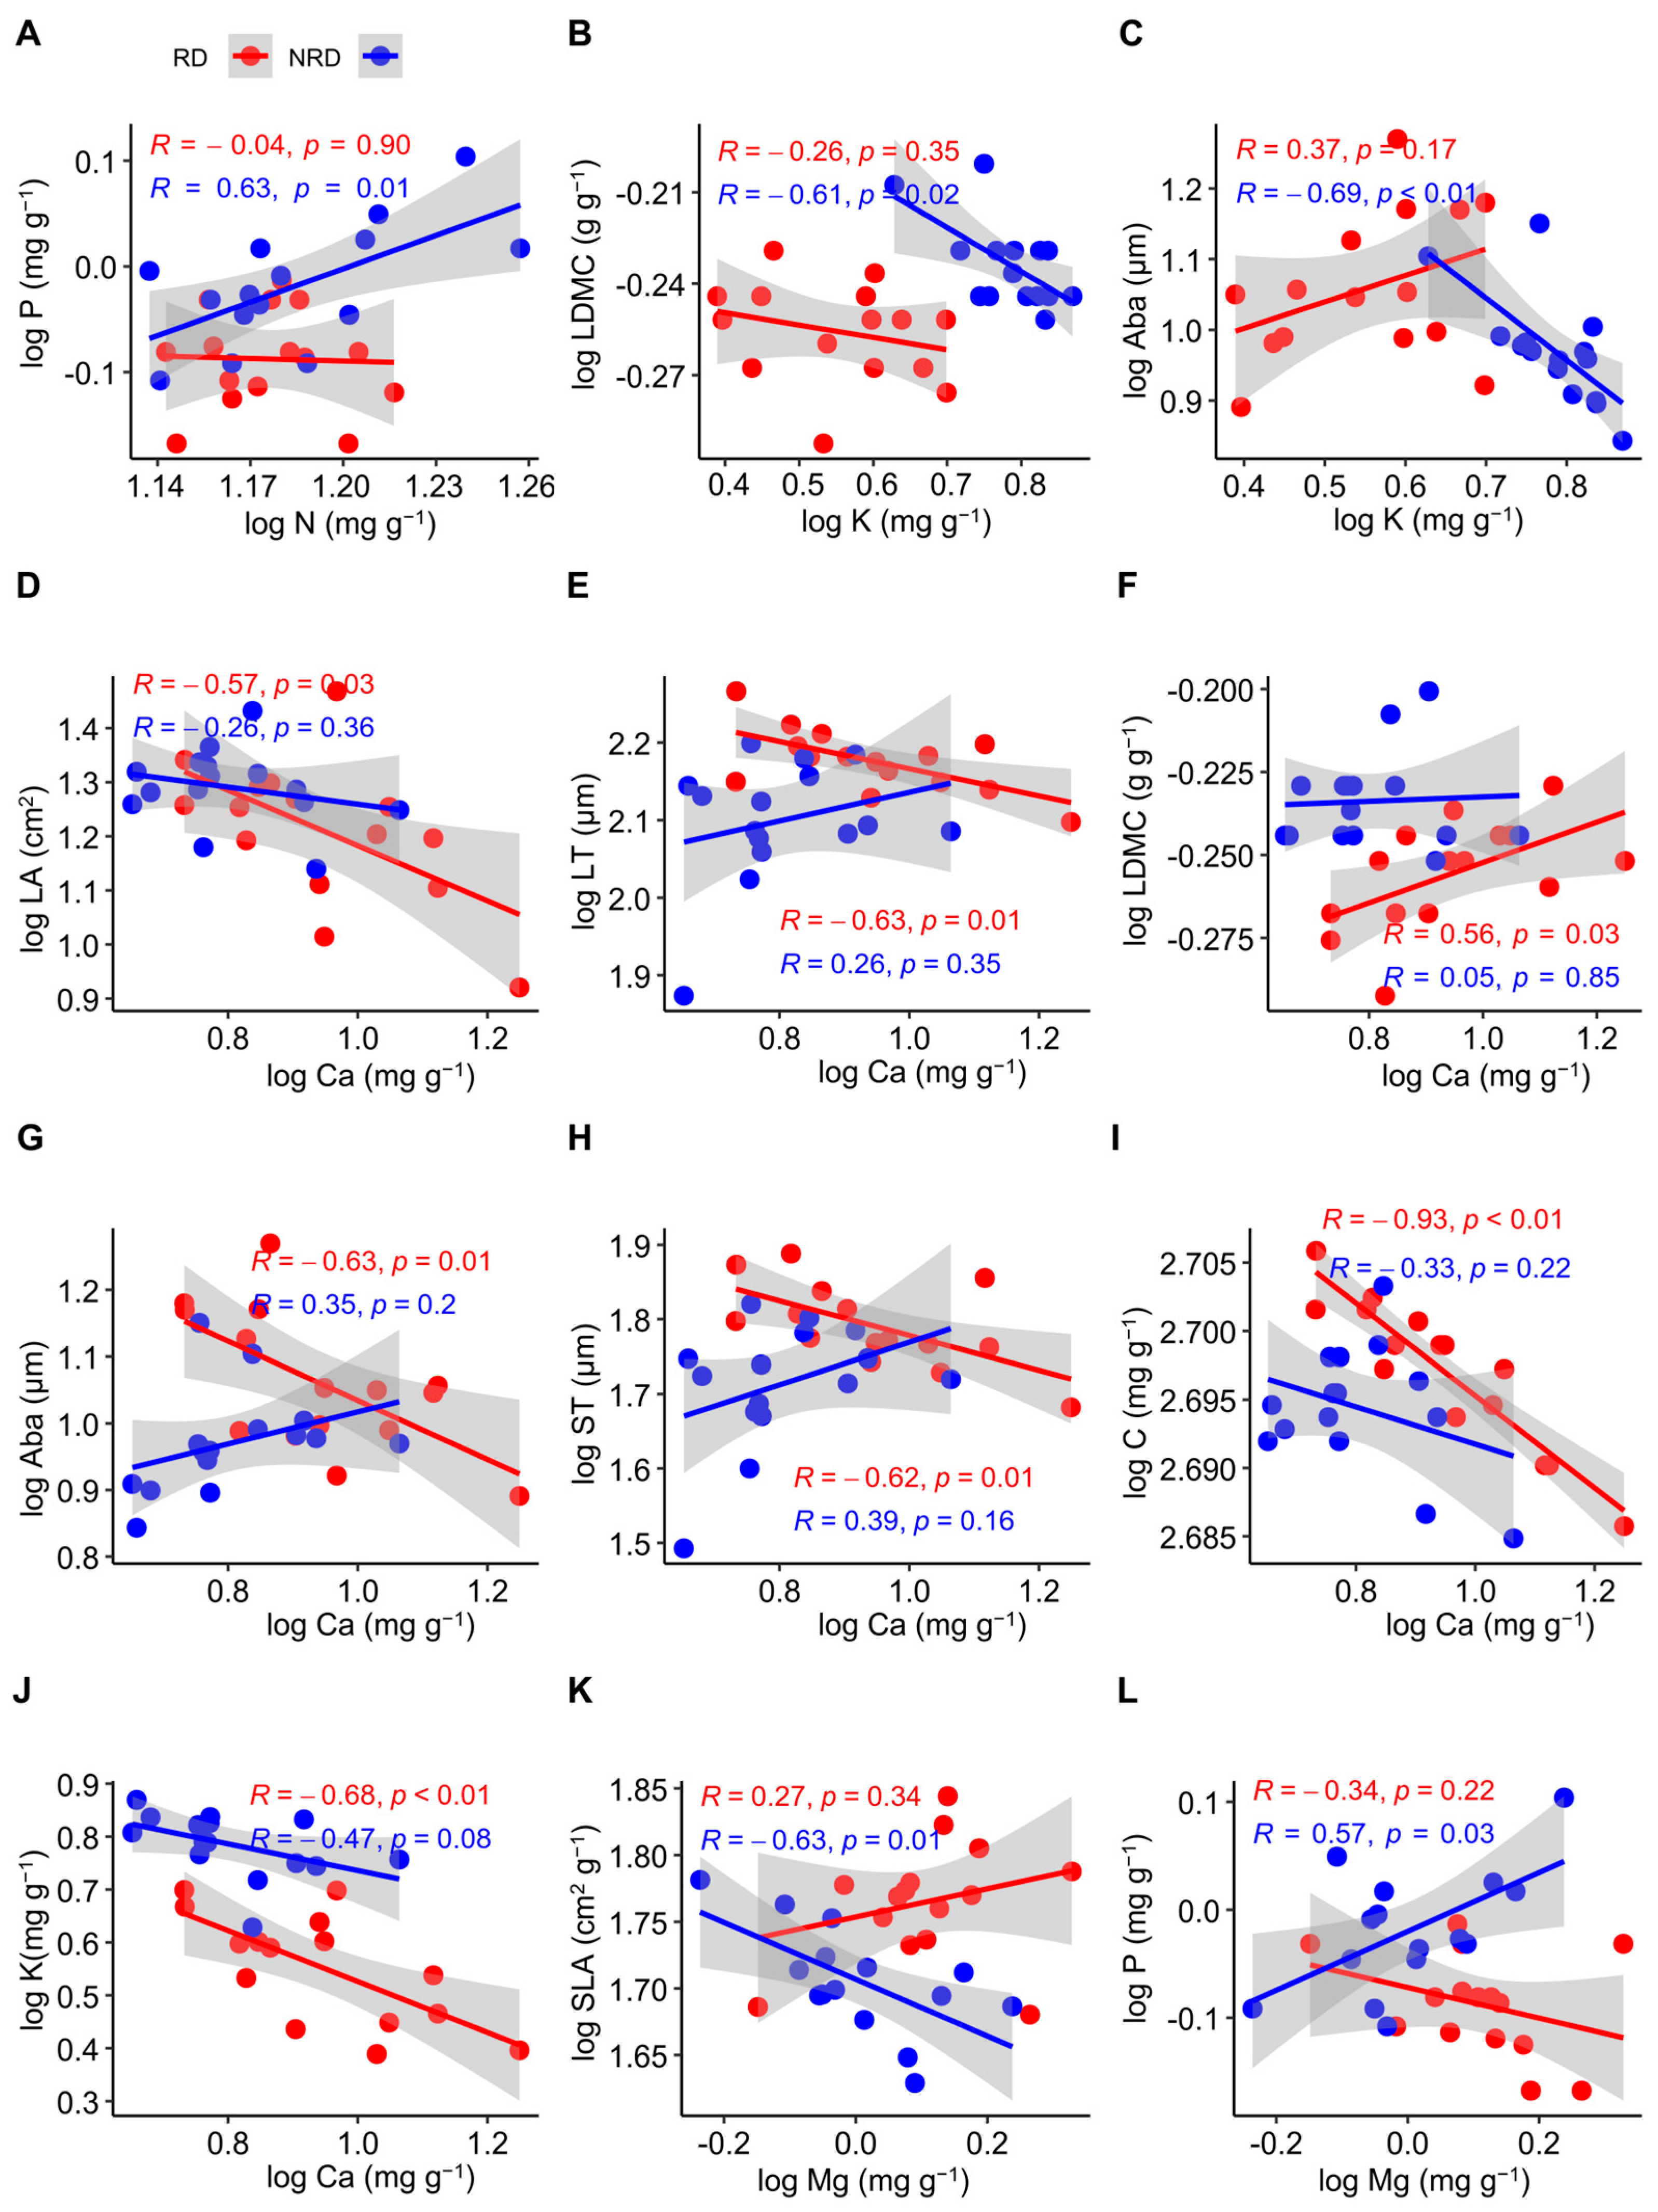
For all of the functional traits, N was positively related to P in forests with non-rocky desertification (R = 0.63, p = 0.01), while these were non-significantly negatively related in forests with rocky desertification (R = −0.04, p = 0.90) (Figure 3A). The LDMC was negatively related to K in forests with non-rocky desertification (R = −0.61, p = 0.02), but this relationship was not significant in forests with rocky desertification (R = −0.26, p = 0.35) (Figure 3B). K was negatively related to Aba in forests with non-rocky desertification (R = −0.69, p < 0.01), while these were non-significantly positively related in forests with rocky desertification (R = 0.37, p = 0.17) (Figure 3C). Ca was negatively related to LA (R= −0.57, p = 0.03) (Figure 3D), C (R= −0.93, p < 0.01) (Figure 3I), and K (R = −0.68, p < 0.01) (Figure 3J) in forests with rocky desertification, but this relationship was not significant in forests with non-rocky desertification (R = −0.26, p = 0.36; R= −0.33, p = 0.22; R = −0.47, p = 0.08). Ca was negatively related to LT (R = −0.63, p = 0.01) (Figure 3E), Aba (R = −0.63, p = 0.03) (Figure 3G), and ST (R = −0.62, p = 0.01) (Figure 3H) in forests with rocky desertification, while these were non-significantly positively related in forests with non-rocky desertification (R = 0.26, p = 0.35; R = 0.35, p = 0.20; R = 0.39, p = 0.16). Ca was positively related to the LDMC in forests with rocky desertification (R = 0.56, p = 0.03), but this relationship was not significant in forests with non-rocky desertification (R = 0.33, p = 0.22) (Figure 3F). Mg was negatively related to SLA in forests with non-rocky desertification (R = −0.63, p = 0.01) (Figure 3K), while these were non-significantly positively related in forests with rocky desertification (R = 0.27, p = 0.34). Mg was positively related to P in forests with non-rocky desertification (R = 0.57, p = 0.03) (Figure 3L), while these were non-significantly negatively related in forests with rocky desertification (R = −0.34, p = 0.22).
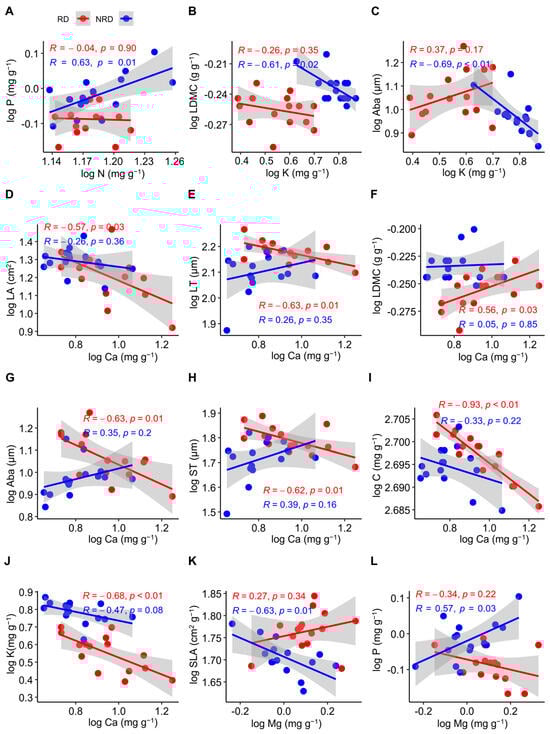
Figure 3.
Pearson’s correlations between functional traits of Quercus rehderiana in areas with rocky and non-rocky desertification. N, nitrogen concentration; P, phosphorus concentration; LDMC, leaf dry matter content; K, potassium concentration; Aba, abaxial epidermis thickness; LA, leaf area; LT, leaf thickness; ST, spongy mesophyll thickness C, carbon concentration; Ca, calcium concentration; Mg, magnesium concentration. RD, rocky desertification, NRD, non-rocky desertification. (A–L) indicates the serial number of figures. p < 0.05, significant difference; p > 0.05, no significant difference; R, correlation coefficient.
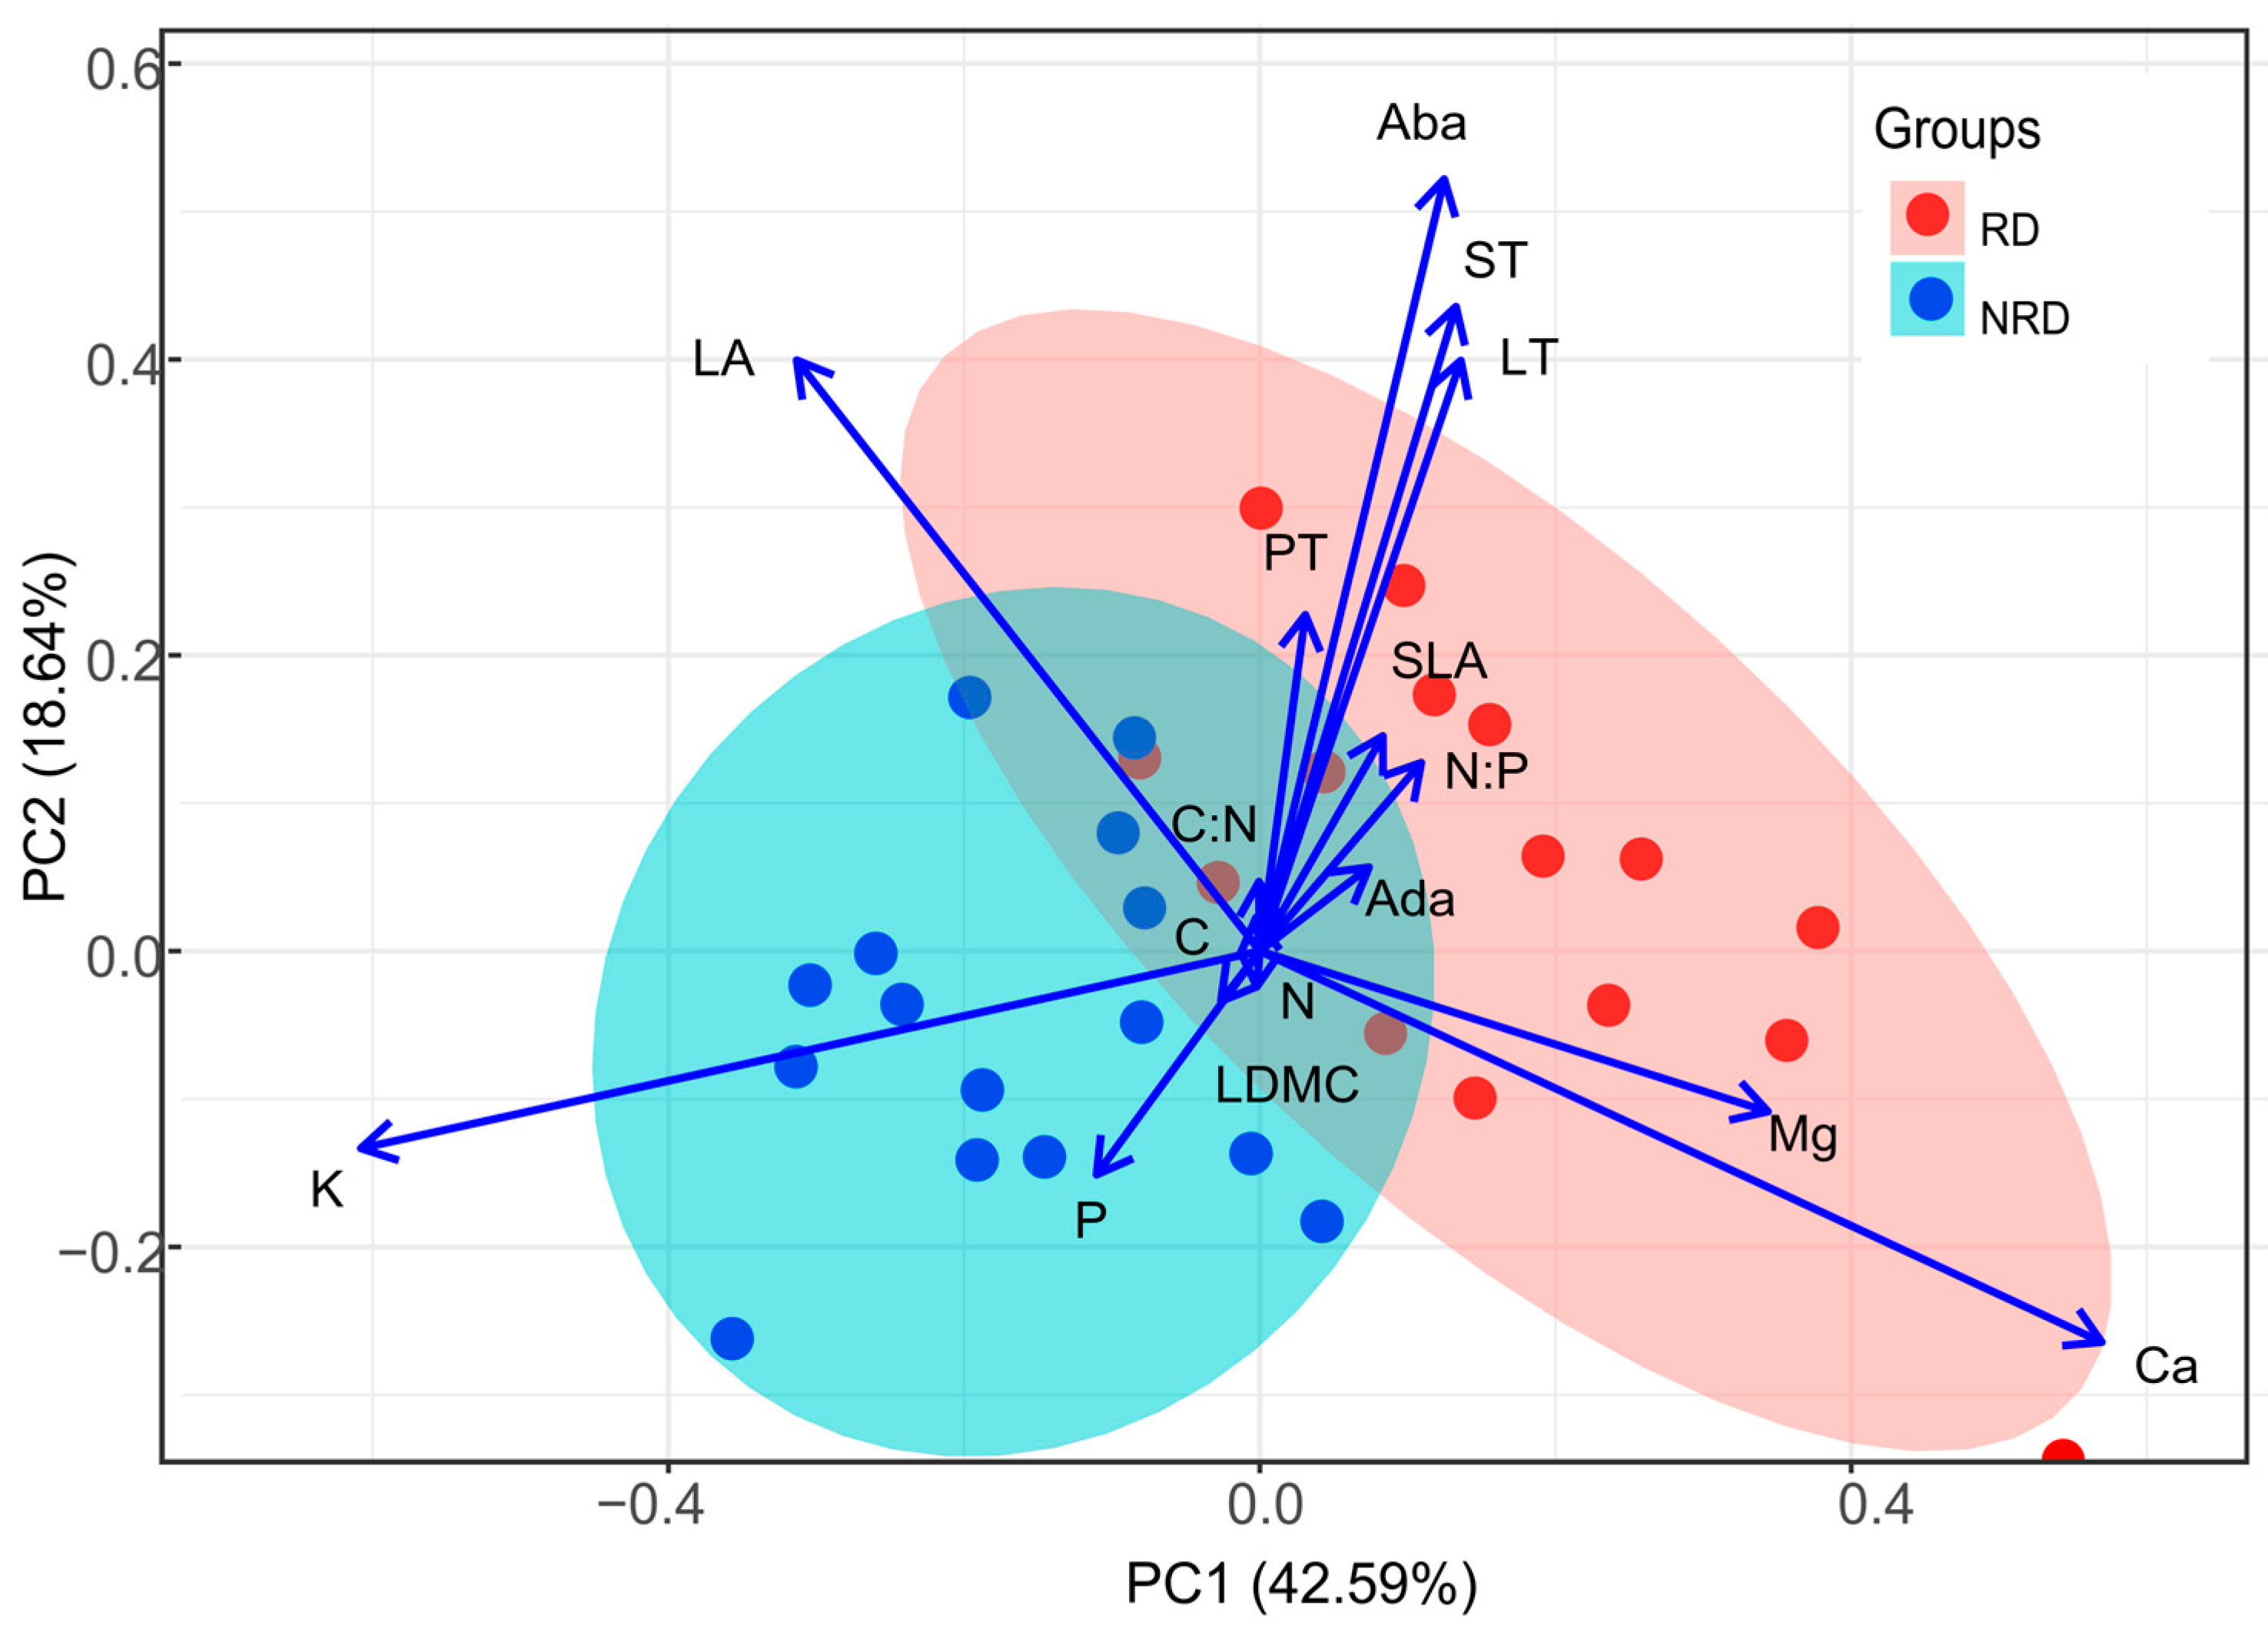
The results of the principal component analysis based on 16 traits of 30 individuals showed that the first and second components accounted for 42.59% and 18.64% of the total variance, respectively (Figure 4). The first axis was positively correlated with traits that were representative of leaf Mg and Ca concentrations. At the opposite end were individuals with high LA and K. The second axis correlated positively with Aba, ST, and LT and negatively with P. The forests with rocky desertification exhibited a negative correlation with high leaf area, high phosphorus concentration, and potassium concentration, indicating the adoption of a resource-acquiring strategy. Individuals with rocky desertification and non-rocky desertification overlapped less in the multivariate trait space, indicating that the resource strategies were different (Figure 4).
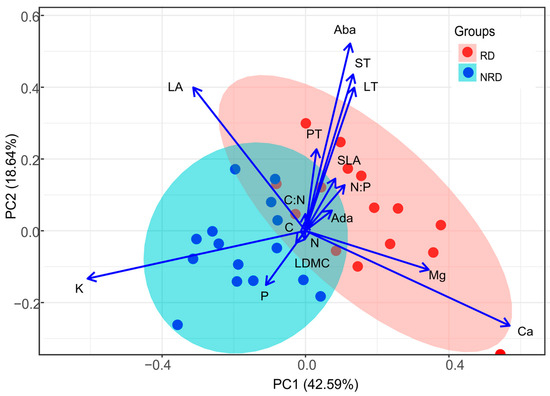
Figure 4.
The biplot of the first two axes of the principal component analysis (PCA) for the relationships of leaf functional traits and the loadings of the fifteen individuals in forests with rocky desertification and fifteen individuals in forests with non-rocky desertification. RD, rocky desertification; NRD, non-rocky desertification. See the text for trait abbreviations. All leaf traits were log10-transformed before the analysis.
4. Discussion
Our results showed that Quercus rehderiana Hand.-Mazz. leaves in forests with rocky desertification had higher LT, SLA, Aba, and ST but lower LA and LDMC than those in forests with non-rocky desertification, which was consistent with our first hypothesis (Figure 1). Regarding leaf nutrients, forests with rocky desertification had higher N:P ratios and Ca and Mg concentrations but lower P and K concentrations, which was consistent with our second hypothesis. Interestingly, another study in Guizhou Province found that plants in forests with rocky desertification had higher LT, LA, SLA, and LDMC than those in forests with non-rocky desertification [35]. The Ca and Mg concentrations in the leaves of plants in forests with rocky desertification were higher than those of plants in forests with non-rocky desertification; however, there were no significant differences in the leaf N and P concentrations [14,36].
Compared with Quercus aquifolioides (Table 1), the leaves of Quercus rehderiana in forests with both rocky and non-rocky desertification had lower LT, SLA, PT, and ST but higher LA, while the LDMC was similar [37,38]. Compared with other studies of leaf nutrients (Table 2), the C concentration and C:N ratio of Quercus rehderiana leaves in forests with both rocky and non-rocky desertification were higher than those in other species of Quercus [9,39,40,41]. The N concentration in Quercus rehderiana leaves in forests with both rocky and non-rocky desertification was higher than that in Quercus sect. Heterobalanus as reported by Li et al. (2018) [39] and in Quercus aquifolioides as reported by Liu et al. (2012) [41], but it was lower than the value reported by Li et al. (2023) [9]. The P and K concentrations of Quercus rehderiana leaves in forests with both rocky and non-rocky desertification were lower than those in other species of Quercus (Table 2) [9,38,41]. The Ca concentrations in Quercus rehderiana leaves in forests with both rocky and non-rocky desertification were higher than those in Quercus aquifolioides [41]. The Mg concentration in Quercus rehderiana leaves was similar to that in Quercus aquifolioides [41] in forests with rocky desertification, but it was lower in forests with non-rocky desertification. The N:P ratio in Quercus rehderiana leaves in forests with both rocky and non-rocky desertification was similar to that in Quercus variabilis [40] but lower than that in Quercus semicarpifolia [9] and Quercus semicarpifolia [40], while it was higher than that in Quercus aquifolioides [41] and other species of Quercus sect. Heterobalanus [39]. This difference can be influenced by genetic and environmental factors such as elevation, rainfall, temperature, and soil type.

Table 1.
Leaf morphological traits of different Quercus species according to different scholars. RD, forests with rocky desertification; NRD, forests with non-rocky desertification.
Table 2.
Leaf nutrients of different Quercus species according to different scholars. RD, forests with rocky desertification; NRD, forests with non-rocky desertification.
LT is related to resource acquisition, water and nutrient conservation and utilization efficiency, and carbon dioxide assimilation in plants [42,43]. Plants with thicker leaves are more efficient at conserving and using water and nutrients [44]. LT is usually thinner in humid and nutrient-rich areas than in harsh environments [45]. Our study found that the leaves of Quercus rehderiana in forests with rocky desertification (150.70 µm vs. 127.77 µm) were thicker than those in forests with non-rocky desertification, which indicated that soil nutrients and other environmental resources in forests with rocky desertification are poor. Interestingly, studies in different regions have found different results (Table 3). In particular, Zhang et al. (2020) reported that the LT was greater in forests with rocky desertification than in forests with non-rocky desertification in Guizhou Province [35]. However, Fu et al. (2019) found that there were no significant differences in LT between forests with rocky and non-rocky desertification in Yunnan Province [13]. This may be related to the use of stable rock water by species in tropical and subtropical forests with rocky desertification [46,47]. SLA reflects the resource utilization and conservation capacity of plants [48]. Generally, a high SLA indicates that tree species adopt resource-acquiring strategies [49]. Our study found that the SLA of Quercus rehderiana in forests with rocky desertification (58.52 cm g−1 vs. 50.99 cm g−1) was significantly higher than that in forests with non-rocky desertification. The results of this study were similar to those of a study on rocky desertification in Guizhou Province [35]. However, a study in Yunnan Province did not find significant differences in SLA between forests with rocky and non-rocky desertification [13]. This may have been due to the fact that Guizhou is cloudy in comparison with the climatic conditions in Yunnan Province, and plants enhance light capture by increasing their SLA to adapt to environmental conditions with less light [50]. We found that the leaves of forests with rocky desertification had a higher Aba (11.80 µm vs. 9.49 µm) and ST (62.35 µm vs. 52.58 µm) than those in forests with non-rocky desertification, which was partly consistent with the results of other studies on mountains with rocky desertification [51]. The anatomical traits of plants in mountainous areas with rocky desertification include thicker palisade tissue, tightly packed spongy mesophyll, and a thicker epidermis to resist drought or reduce water loss during transpiration [50,52]. Previous studies acknowledged that LA is closely related to plant water status and influences the light capture and carbon acquisition abilities of plants, thereby influencing photosynthesis [53,54,55]. The LDMC is related to leaf resistance, and plants with high LDMC can survive well in resource-poor habitats [28]. Plants in areas with rocky desertification generally present a combination of low leaf area and high leaf dry matter content (LDMC), which means that plants adapt to the physiological drought caused by a shallow karst soil layer and soil water leakage [50]. The results of our study also confirmed that forests with rocky desertification had a lower LA and higher LDMC.
We found that the leaf P concentration was lower in forests with rocky desertification (0.82 mg g−1 vs. 0.97 cm g−1) than in forests with non-rocky desertification, which was consistent with the report by Fu et al. (2017) (Table 3) [13]. This may have been caused by the availability of P in the soil [56]. K is involved in stomatal movement, osmotic regulation, and enzyme activation, and it can increase the photosynthetic rate of plants by increasing the chlorophyll content [56,57]. However, studies on K in forests with rocky desertification are few compared with studies on other elements [58]. The results showed that the content of Ca (9.29 mg g−1 vs. 6.61 cm g−1) and Mg (1.33 mg g−1 vs. 1.05 cm g−1) concentrations in forests with rocky desertification was significantly higher than that in forests with non-rocky desertification, which was consistent with the results for other forests with rocky desertification [59]. This may have been due to the chemical dissolution of soluble carbonate rocks by groundwater and surface water in karst areas, which makes the soil rich in Ca and Mg and causes them to accumulate in plants [60]. The leaf N:P ratio can be used as an important indicator of plant nutrient limitation, and it was divided into three levels: N:P ratio < 14 (N limitation) and > 16 (P limitation), and 14 ≤ N:P ratio ≤ 16 (limitation of N and P or not) [34,61,62]. We found that the N:P ratios in forests with both rocky and non-rocky desertification were higher than 16, indicating that P is a growth-limiting nutrient for Quercus rehderiana, supporting our second hypothesis.
Table 3.
Differences in leaf traits between forests with rocky and non-rocky desertification according to different scholars. An en-dash indicates that data could not be obtained from the figures.
Table 3.
Differences in leaf traits between forests with rocky and non-rocky desertification according to different scholars. An en-dash indicates that data could not be obtained from the figures.
| Trait | Forests with Rocky Desertification | Forests with Non-Rocky Desertification | Significance | Reference |
|---|---|---|---|---|
| LT | 17 | 19.75 | P < 0.01 | This study |
| − | − | P < 0.05 | [35] | |
| 188 | 176 | P > 0.05 | [13] | |
| SLA | 58.52 | 50.99 | P < 0.01 | This study |
| − | − | P < 0.05 | [35] | |
| 157 | 158 | P > 0.05 | [13] | |
| Aba | 11.8 | 9.49 | P < 0.01 | This study |
| 13.53 | 11.2 | P > 0.05 | [51] | |
| ST | 62.35 | 52.58 | P < 0.01 | This study |
| 45.29 | 72.45 | P < 0.05 | [51] | |
| P | 0.82 | 0.97 | P < 0.01 | This study |
| 1.74 | 1.12 | P < 0.05 | [13] | |
| Ca | 9.29 | 6.61 | P < 0.05 | This study |
| 2.19 | 0.92 | P < 0.05 | [59] | |
| Mg | 1.33 | 1.05 | P < 0.05 | This study |
| 0.33 | 0.2 | P < 0.05 | [59] |
Functional correlations among plant functional traits exist, and they represent the fundamental trade-offs or synergies among these traits [11,27,63]. In the present study, we found negative correlations between SLA and LDMC in forests with rocky desertification (Figure 2). These correlations have been well-established in previous studies (Table 4) [44,64]. We found that LA was significantly and positively correlated with LT in forests with rocky desertification, which was consistent with the findings of Zhong et al. (2018) [50] and Long et al. (2023) [65]. In addition, we found that LA was positively related to ST. Plants with a greater light demand also tend to have a higher leaf water storage capacity and resistance to the diffusion of CO2 to the blade surface [66,67]. The positive correlation between leaf area and leaf tissue thickness in this study implies that plants in forests with rocky desertification need to capture more light resources while preventing water loss from leaves due to high-temperature transpiration. However, the Ca in plant leaves was significantly negatively correlated with the thickness of various tissues in habitats with rocky desertification (Figure 3). This may be because Ca can form calcium pectinate with pectic acid, thereby stabilizing the structure of cell walls and actively promoting the formation of cytoplasm and organelles, thus reducing the investment in supporting structural tissues [68,69]. It is concluded that C is negatively correlated with Ca, indicating that a higher Ca concentration in plants is not conducive to C storage; thereby, plant primary productivity decreases [70]. In this study, there was a significant negative correlation between Ca and K in forests with rocky desertification. Large amounts of Ca are not conducive to the absorption of other elements, such as Mg and K [71]. This indicates that there is an obvious antagonistic effect on the selective absorption of Ca and K in forests with rocky desertification. Similar results were also reported in a study of plant communities in Maolan National Nature Reserve [72].
Table 4.
Correlations of paired traits according to different scholars.
5. Conclusions
In summary, we compared the differences in 16 leaf traits of Quercus rehderiana Hand.-Mazz. in forests with rocky and non-rocky desertification. We found that leaf morphological, anatomical, and nutrient traits have obvious differences between forests with rocky and non-rocky desertification. Forests with non-rocky desertification had thick leaves, a high tissue thickness, and high nutrient concentrations, while forests with rocky desertification had a high calcium and magnesium content.
There were synergistic and trade-off relationships among leaf functional traits. We inferred that Quercus rehderiana in forests with rocky desertification adopted a resource-conserving strategy to adapt to the arid and poor soil of environments with rocky desertification. Species with resource-conserving strategies are more stable over time. Accordingly, our findings have practical significance for the prediction of the population dynamics of Quercus with the frequency of drought events and the aggravation of rocky desertification.
Supplementary Materials
The following supporting information can be downloaded at: https://www.mdpi.com/article/10.3390/f15081439/s1, Table S1. The mean value and SE for leaf area, leaf thickness, specific leaf area, leaf dry matter content, adaxial epidermis thickness, abaxial epidermis thickness, palisade mesophyll thickness, spongy mesophyll thickness, carbon concentration, nitrogen concentration, phosphorus concentration, potassium concentration, C:N ratio, N:P ratio, calcium concentration, and magnesium concentration of Quercus rehderiana Hand.-Mazz. in forests with rocky and non-rocky desertification.
Author Contributions
X.-L.B. and W.-J.L. conceived and designed the experiment. X.-L.B., T.F., S.Z. and Y.C. collected data. X.-L.B. and B.H. analyzed the data. X.-L.B. and W.-J.L. wrote the manuscript. All authors have read and agreed to the published version of the manuscript.
Funding
This study was financially supported by the Bijie Science and Technology Project (bikelianhe[2023]23), the Bijie Science and Technology Project (bikelianhe[2023]10), the Project of Guizhou Science and Technology Fund (qiankehejichu-ZK-[2024]key077), the Guizhou Provincial Science and Technology Project (qiankehejichu-ZK-[2022]yiban167), the Bijie Talent Team of Biological Protection and Ecological Restoration in Liuchong River Basin (202112), and the Regional First-Class Discipline of Ecology in Guizhou Province (XKTJ[2020]22).
Data Availability Statement
Data are contained within the article and Supplementary Materials.
Acknowledgments
The authors thank the Public Technology Service Center of Xishuangbanna Tropical Botanical Garden, Chinese Academy of Sciences for analyzing the foliar nutrient concentrations and offering an electron microscope. The Weining County Forestry Bureau provided logistic support.
Conflicts of Interest
The authors declare no conflicts of interest.
References
- Lu, L.M.; Mao, L.F.; Yang, T.; Ye, J.F.; Liu, B.; Li, H.L.; Sun, M.; Miller, J.T.; Mathews, S.; Hu, H.H.; et al. Evolutionary history of the angiosperm flora of China. Nature 2018, 554, 234–238. [Google Scholar] [CrossRef] [PubMed]
- Wang, X.F.; Duan, Y.X.; Jin, L.L.; Wang, C.Y.; Peng, M.C.; Li, Y.; Wang, X.H.; Ma, Y.F. Prediction of historical, present and future distribution of Quercus Sect. Heterobalanus based on the optimized MaxEnt model in China. Acta. Ecol. Sin. 2023, 43, 6590–6604. [Google Scholar]
- Yang, Y.; Yi, X. Partial acorn consumption by small rodents: Implication for regeneration of white oak, Quercus Mongolica. Plant Ecol. 2012, 213, 197–205. [Google Scholar] [CrossRef]
- Silaeva, T.; Andreychev, A.; Kiyaykina, O.; Balčiauskas, L. Taxonomic and ecological composition of forest stands inhabited by forest dormouse Dryomys nitedula (Rodentia: Gliridae) in the Middle Volga. Biologia 2021, 76, 1475–1482. [Google Scholar] [CrossRef]
- Rawat, B.; Rawat, J.M.; Purohit, S.; Singh, G.; Sharma, P.K.; Chandra, A.; Begum, J.P.S.; Venugopal, D.; Jaremko, M.; Qureshi, K.A. A comprehensive review of Quercus semecarpifolia Sm.: An ecologically and commercially important Himalayan tree. Front. Ecol. Evol. 2022, 10, 961345. [Google Scholar] [CrossRef]
- Zhao, C.Y.; Lu, S.F.; Li, R.L.; Yin, X.J.; Teng, J.; Gao, W.J.; Wang, Y. Geographical distribution of main subtropical evergreen Quercus trees in southwest China under climate change. J. Trop. Subtrop. Bot. 2024, 32, 357–366. [Google Scholar]
- Wang, G.Y.; Luo, J.; Xu, A.S. Spatial Pattern and Population Regulation of Quercus aquifolioides in the Sejila Mountains, Tibet, China. Chin. J. Appl. Environ. Biol. 2010, 16, 148–153. [Google Scholar] [CrossRef]
- Chai, Y.; Zhang, X.; Yue, M.; Liu, X.; Li, Q.; Shang, H.; Meng, Q.; Zhang, R. Leaf traits suggest different ecological strategies for two Quercus species along an altitudinal gradient in the Qinling Mountains. J. For. Res. 2015, 20, 501–513. [Google Scholar] [CrossRef]
- Li, H.B.; Chen, S.; Huang, Y.H.; Kang, D.X.; Wu, J.R.; Ma, H.C. Ecological stoichiometry and homeostasis of alpine Quercus semicarpifolia leaves in subalpine zone of Hengduan Mountains. Bull. Bot. Res. 2023, 43, 923–931. [Google Scholar]
- Chen, L.; Li, Y.L.; Ning, Z.Y.; Yang, H.L.; Zhan, J.; Yao, B. Response mechanisms of woody plant to drought stress: A review based on plant hydraulic traits. Acta. Ecol. Sin. 2024, 44, 2688–2705. [Google Scholar]
- Wright, I.J.; Reich, P.B.; Westoby, M.; Ackerly, D.D.; Baruch, Z.; Bongers, F.; Cavender-Bares, J.; Chapin, T.; Cornelissen, J.H.C.; Diemer, M.; et al. The worldwide leaf economics spectrum. Nature 2004, 428, 821–827. [Google Scholar] [CrossRef]
- Reich, P.B. The world-wide ‘fast–slow’plant economics spectrum: A traits manifesto. J. Ecol. 2014, 102, 275–301. [Google Scholar] [CrossRef]
- Fu, P.L.; Zhu, S.D.; Zhang, J.L.; Finnegan, P.M.; Jiang, Y.J.; Lin, H.; Fan, Z.X.; Cao, K.F. The contrasting leaf functional traits between a karst forest and a nearby non-karst forest in south-west China. Funct. Plant Biol. 2019, 46, 907–915. [Google Scholar] [CrossRef] [PubMed]
- Wan, C.Y.; Yu, J.R.; Zhu, S.D. Differences in leaf traits and trait correlation networks between karst and non-karst forest tree species. Chin. J. Plant Ecol. 2023, 47, 1386–1397. [Google Scholar] [CrossRef]
- Zhang, Y.B.; Zhou, C.Y.; Lv, W.Q.; Dai, L.H.; Tang, J.G.; Zhou, S.Q.; Huang, L.H.; Li, A.D.; Zhang, J.L. Comparative study of the stoichiometric characteristics of karst and non-karst forests in Guizhou, China. J. For. Res. 2019, 30, 799–806. [Google Scholar] [CrossRef]
- He, B.; Li, Q.; Chen, Q.; Li, W.; You, P. Altitudinal pattern of species diversity of Pseudotsuga sinensis community in northwestern Guizhou, China. Ecol. Environ. Sci. 2021, 30, 1111–1120. [Google Scholar]
- Wang, S.J. The most serious eco-geologically environmental problem in southwestern China-karst rocky desertification. Bull. Mineral. Petrol. Geochem. 2003, 22, 657–666. [Google Scholar]
- Liu, C.C.; Liu, Y.G.; Guo, K. Ecophysiological adaptations to drought stress of seedlings of four plant species with different growth forms in karst habitats. Chin. J. Plant Ecol. 2011, 35, 1070–1082. [Google Scholar]
- Niinemets, Ü.; Kull, K. Co-limitation of plant primary productivity by nitrogen and phosphorus in a species-rich wooded meadow on calcareous soils. Acta Oecol. 2005, 28, 345–356. [Google Scholar] [CrossRef]
- Li, Q.; Cao, J.; Yu, L. Biogeochemical effect of karst soil on the element concentrations in the leaves of two species of Flos Lonicerae. Plant Soil. Environ. 2008, 54, 486–492. [Google Scholar] [CrossRef]
- Li, R.L.; Wang, S.J.; Xiong, K.N.; Li, F.Q. A study on rocky desertification evaluation index system-a case study of Guizhou Province. Tro. Geo. 2004, 24, 145–149. [Google Scholar]
- Violle, C.; Navas, M.L.; Vile, D.; Kazakou, E.; Fortunel, C.; Hummel, I.; Garnier, E. Let the concept of trait be functional! Oikos 2007, 116, 882–892. [Google Scholar] [CrossRef]
- Laughlin, D.C.; Gremer, J.R.; Adler, P.B.; Mitchell, R.M.; Moore, M.M. The net effect of functional traits on fitness. Trends Ecol. Evol. 2020, 35, 1037–1047. [Google Scholar] [CrossRef] [PubMed]
- Reich, P.B.; Oleksyn, J. Global patterns of plant leaf N and P in relation to temperature and latitude. PNAS 2004, 101, 11001–11006. [Google Scholar] [CrossRef]
- Onoda, Y.; Westoby, M.; Adler, P.B.; Choong, A.M.F.; Clissold, F.J.; Cornelissen, J.H.C.; Díaz, S.; Dominy, N.J.; Elgart, A.; Enrico, L.; et al. Global patterns of leaf mechanical properties. Ecol. Lett. 2011, 14, 301–312. [Google Scholar] [CrossRef]
- Verheijen, L.M.; Aerts, R.; Bonisch, G.; Kattge, J.; van Bodegom, P.M. Variation in trait trade-offs allows differentiation among predefined plant functional types: Implications for predictive ecology. New Phytol. 2016, 209, 563–575. [Google Scholar] [CrossRef] [PubMed]
- Messier, J.; Lechowicz, M.J.; McGill, B.J.; Violle, C.; Enquist, B.J. Interspecific integration of trait dimensions at local scales: The plant phenotype as an integrated network. J. Ecol. 2017, 105, 1775–1790. [Google Scholar] [CrossRef]
- Cornelissen, J.H.; Lavorel, S.; Garnier, E.; Díaz, S.; Buchmann, N.; Gurvich, D.E.; Reich, P.B.; Ht, S.; Morgan, H.D.; van der Heijden, M.G.A.; et al. A handbook of protocols for standardised and easy measurement of plant functional traits worldwide. Aust. J. Bot. 2003, 51, 335–380. [Google Scholar] [CrossRef]
- Perez-Harguindeguy, N.; Diaz, S.; Garnier, E.; Lavorel, S.; Poorter, H.; Jaureguiberry, P.; Bret-Harte, M.S.; Cornwell, W.K.; Craine, J.M.; Gurvich, D.E.; et al. Corrigendum to: New handbook for standardised measurement of plant functional traits worldwide. Aust. J. Bot. 2016, 64, 715–716. [Google Scholar] [CrossRef]
- Taiz, L.; Zeiger, E. Plant Physiology, 5th ed.; Sinauer Associates: Sunderland, MA, USA, 2010. [Google Scholar]
- Zhu, S.D.; Cao, K.F. Contrasting cost–benefit strategy between lianas and trees in a tropical seasonal rain forest in southwestern China. Oecologia 2010, 163, 591–599. [Google Scholar] [CrossRef]
- Zhang, K.Y.; Yang, D.; Zhang, Y.B.; Ellsworth, D.S.; Xu, K.; Zhang, Y.P.; Chen, Y.J.; He, F.; Zhang, J.L. Differentiation in stem and leaf traits among sympatric lianas, scandent shrubs and trees in a subalpine cold temperate forest. Tree Physiol. 2021, 41, 1992–2003. [Google Scholar] [CrossRef]
- Ågren, G.I. The C: N: P stoichiometry of autotrophs–theory and observations. Ecol. Lett. 2004, 7, 185–191. [Google Scholar] [CrossRef]
- Koerselman, W.; Meuleman, A.F. The vegetation N:P ratio: A new tool to detect the nature of nutrient limitation. J. Appl. Ecol. 1996, 33, 1441–1450. [Google Scholar] [CrossRef]
- Zhang, S.; Zhang, Y.; Xiong, K.; Yu, Y.; Min, X. Changes of leaf functional traits in karst rocky desertification ecological environment and the driving factors. Global. Ecol. Conserv. 2020, 24, e01381. [Google Scholar] [CrossRef]
- Tang, S.B.; Liu, J.F.; Lambers, H.; Zhang, L.L.; Liu, Z.F.; Lin, Y.T.; Kuang, Y.W. Increase in leaf organic acids to enhance adaptability of dominant plant species in karst habitats. Ecol. Evol. 2021, 11, 10277–10289. [Google Scholar] [CrossRef]
- Wang, C.; Lu, J.; Zhou, C.; Yao, H.; Jianyang, L.; La, B. Altitude distribution of leaf functional traits of Quercus aquifolioides in southeastern Tibet. J. For. Environ. 2021, 41, 366–372. [Google Scholar]
- Guo, W.; Zhuo, M.; He, Z.; Ren, Y.; Qu, X.; Fang, J. Anatomical characteristics and environmental adaptability of Quercus aquifolioides leaf in Sejila mountain, Southeastern Tibet. J. Southwest. For. Univ. 2022, 42, 33–38. [Google Scholar]
- Li, L.; Hu, J.; Yu, Q.; Yang, X.; Li, T.; Liu, Q. Stoichiometric characteristics of carbon, nitrogen and phosphorus in Quercus Sect. Heterobalanus shrubs in the Hengduan Mountain, China. Mt. Res. 2018, 36, 878–888. [Google Scholar]
- Cai, G.J.; Suo, P.C.; Zhang, L.M.; Fu, Y.H.; Li, A.D. C, N, P stoichiometric characteristics in different organs of three constructive plants in Karst peak-cluster depressions in southern Guizhou, Southwest China. J. Guizhou Norm. Univ. 2021, 39, 36–44. [Google Scholar]
- Liu, Q.L.; Xu, X.M.; Liu, X.L.; Wen, Z.Y.; Liu, S.R. Characteristics of macronutrient variation in leaves of Quercus aquifolioides along with the altitudinal gradients on the Balangshan Mountain in Wolong Nature Reserve, China. J. Sichuan For. Sci. and Technol. 2012, 33, 1–6. [Google Scholar]
- Witkowski, E.T.F.; Lamont, B.B. Leaf specific mass confounds leaf density and thickness. Oecologia 1991, 88, 486–493. [Google Scholar] [CrossRef] [PubMed]
- Garnier, E.; Navas, M.L.; Grigulis, K. Plant Functional Diversity: Organism Traits, Community Structure, and Ecosystem Properties. Oxford University Press: New York, NY, USA, 2016. [Google Scholar]
- Wu, T.H.; Long, C.L.; Xiong, L.; Liu, Q. Variation and adaptation of functional leaf traits of different plant types in karst forests. Chin. J. Appl. Environ. Biol. 2023, 29, 1043–1049. [Google Scholar]
- Liu, J.H.; Zeng, D.H.; Lee, D.K. Leaf traits and their interrelationships of main plant species in southeast Horqin sandy land. Chin. J. Ecol. 2006, 15, 921–925. [Google Scholar]
- Deng, Y.; Ke, J.; Wu, S.; Jiang, G.H.; Jiang, Z.C.; Zhu, A.J. Responses of plant water uptake to groundwater depth in limestone outcrops. J. Hydrol. 2020, 590, 125377. [Google Scholar] [CrossRef]
- Ding, Y.L.; Nie, Y.P.; Chen, H.S.; Wang, K.L.; Querejeta, J.I. Water uptake depth is coordinated with leaf water potential, water-use efficiency and drought vulnerability in karst vegetation. New Phytol. 2021, 229, 1339–1353. [Google Scholar] [CrossRef] [PubMed]
- Lambers, H.; Chapin, F.S.; Pons, T.L. Plant Physiological Ecology; Springer: New York, NY, USA, 1998. [Google Scholar]
- Poorter, H.; Niinemets, U.; Poorter, L.; Wright, I.J.; Villar, R. Causes and consequences of variation in leaf mass per area (LMA): A meta-analysis. New Phytol. 2009, 182, 565–588. [Google Scholar] [CrossRef] [PubMed]
- Zhong, Q.L.; Liu, L.B.; Xu, X.; Yang, Y.; Guo, Y.M.; Xu, H.Y.; Cai, X.L.; Ni, J. Variations of plant functional traits and adaptive strategy of woody species in a karst forest of central Guizhou Province, southwestern China. J. Plant Ecol. 2018, 42, 562–572. [Google Scholar]
- Ge, Y.; Wang, S. A study on the relationship between anatomical structures of plant leaves and δ13C values with different backgrounds in a karst catchment basin. Earth Environ. 2008, 36, 36–46. [Google Scholar]
- Rong, L.; Wang, S.; Liu, N.; Yang, L. Leaf anatomical characters and its ecological adaptation of the pioneer species in the karst mountain area-with a special reference to the Huajiang canyon of Guizhou. J. MT. Sci. 2005, 23, 35–42. [Google Scholar]
- Milla, R.; Reich, P.B. The scaling of leaf area and mass: The cost of light interception increases with leaf size. Proc. R. Soc. London Ser. B 2007, 274, 2109–2115. [Google Scholar] [CrossRef]
- Yin, Q.; Tian, T.; Han, X.; Xu, J.; Chai, Y.; Mo, J.; Lei, M.L.; Wang, L.; Wang, L. The relationships between biomass allocation and plant functional trait. Ecol. Indic. 2019, 102, 302–308. [Google Scholar] [CrossRef]
- Guimarães, Z.T.M.; Dos Santos, V.A.H.F.; Nogueira, W.L.P.; de Almeida Martins, N.O.; Ferreira, M.J. Leaf traits explaining the growth of tree species planted in a Central Amazonian disturbed area. For. Ecol. Manag. 2018, 430, 618–628. [Google Scholar] [CrossRef]
- Roelfsema, M.R.G.; Hedrich, R. In the light of stomatal opening: New insights into ‘the Watergate’. New Phytol. 2005, 167, 665–691. [Google Scholar] [CrossRef] [PubMed]
- Kirkby, E.A. Introduction, definition, and classification of nutrients. In Marschner’s Mineral Nutrition of Plants; Academic Press: Cambridge, MA, USA, 2023; pp. 3–9. [Google Scholar]
- Wu, P.; Cui, Y.C.; Zhao, W.J.; Hou, Y.J.; Zhu, J.; Ding, F.J.; Yang, W.B. Leaf stoichiometric characteristics of 68 typical plant species in Maolan National Nature Reserve, Guizhou, China. Acta Ecol. Sinca. 2020, 40, 5063–5080. [Google Scholar]
- Liu, Q.; Wang, Z. Nutrient characteristics of typical plant leaves in karst and non-karst regions of southwest China. Hunan Shengtai Kexue Xuebao 2024, 11, 10–17. [Google Scholar]
- Ji, F.T.; Li, N.; Deng, X. Calcium contents and high calcium adaptation of plants in karst areas of China. Chin. J. Plant Ecol. 2009, 33, 926–935. [Google Scholar]
- Aerts, R.; Chapin, F.S., III. The mineral nutrition of wild plants revisited: A re-evaluation of processes and patterns. Adv. Ecol. Res. 1999, 30, 1–67. [Google Scholar]
- Güsewell, S. N:P ratios in terrestrial plants: Variation and functional significance. New Phytol. 2004, 164, 243–266. [Google Scholar] [CrossRef]
- Westoby, M.; Wright, I.J. Land-plant ecology on the basis of functional traits. Trends Ecol. Evol. 2006, 21, 261–268. [Google Scholar] [CrossRef]
- Cheng, W.; Yu, Y.H.; Xiong, K.N.; Zhang, Y.; Xu, M.; Tan, D.J. Leaf functional traits of dominant species in karst plateau-canyon areas. Guihaia 2019, 39, 1039–1049. [Google Scholar]
- Long, Q.Z.; Du, H.; Su, L.; Zeng, F.P.; Lian, Z.W.; Peng, W.X.; Liu, K.P.; Tan, W.N. Variation of plant functional traits and adaptive strategies in karst evergreen deciduous broad-leaved forest. Acta. Ecol. Sin. 2023, 43, 8875–8883. [Google Scholar]
- Reich, P.B.; Walters, M.B.; Ellsworth, D.S.; Vose, J.M.; Gresham, C.; Bowman, W.D. Relationships of leaf dark respiration to leaf nitrogen, specific leaf area and leaf life-span: A test across biomes and functional group. Oecologia 1998, 114, 471–482. [Google Scholar] [CrossRef]
- Niinemets, Ü. Global-scale climatic controls of leaf dry mass per area, density, and thickness in trees and shurbs. Ecology 2001, 82, 453–469. [Google Scholar] [CrossRef]
- Zhou, W.; Wang, H. The physiological and molecular mechanisms of calcium uptake, transport, and metabolism in plants. Chin. Bull. Bot. 2007, 24, 762–778. [Google Scholar]
- Fu, R.; Meng, X.X.; Chai, S.F. Research progresses on the relationship between plants and calcium environment. North. Hortic. 2019, 3, 161–166. [Google Scholar]
- Yang, Y.; Xu, X.; Xu, Y.; Ni, J. Adaptation strategies of three dominant plants in the trough-valley karst region of northern Guizhou province, southwestern China, evidence from associated plant functional traits and ecostoichiometry. Earth Environ. 2020, 48, 413–423. [Google Scholar]
- Zhao, P.; Tan, J.F.; Jie, X.L.; Yue, C.P.; Zhao, Y.P.; Han, Y.L.; Zhen, Y. The relationship between potassium and calium/magnesium in tobacco when potash is applied. Acta Tab. Sin. 2000, 6, 23–26. [Google Scholar]
- Zhou, T. Stoichiometric characteristics and adaptation mechanisms of typical karst forest plants in microhabitats. Master’s Thesis, Guizhou University, Guiyang, China, 2022. [Google Scholar]
Disclaimer/Publisher’s Note: The statements, opinions and data contained in all publications are solely those of the individual author(s) and contributor(s) and not of MDPI and/or the editor(s). MDPI and/or the editor(s) disclaim responsibility for any injury to people or property resulting from any ideas, methods, instructions or products referred to in the content. |
© 2024 by the authors. Licensee MDPI, Basel, Switzerland. This article is an open access article distributed under the terms and conditions of the Creative Commons Attribution (CC BY) license (https://creativecommons.org/licenses/by/4.0/).