Abstract
The aim of this paper is to evaluate changes in Italy’s competitiveness in the global wood products market, with a particular focus on wooden furniture and wood panels, both final and intermediate products of the crucial wooden furniture supply chain. The analysis is conducted through a cross-country comparison using trade flow matrices and various descriptive indices: Market Share, Trade Competitiveness Index, Balassa’s Revealed Comparative Advantage Index, and the Symmetric Balassa Index. Furthermore, this study also examines intra-industry trade using the Grubel–Lloyd Index. While each index has its limitations when used individually, their combined analysis can provide a more comprehensive view. The study covers the period from 1996 to 2019, using data from FAO and COMTRADE sources. The results show that Italy maintains a significant position in the international furniture market, although this position has deteriorated over time. Conversely, Italy remains a net importer of wood panels. Trade flows have become more concentrated, with Canada and Germany still holding importance in the international market. However, Asian countries have now become the core of the commercial network. China has emerged as the leading exporting country in all product categories considered, with Vietnam and Malaysia also increasing in importance. Noteworthy progress has also been recorded by Russia and Poland in Europe. Additionally, the study discusses the implications of these findings for rural development, particularly in regions dependent on the wood-product sectors.
1. Introduction
The wood sector can significantly contribute to the rural development of Italy, particularly in its internal and marginalized areas, which are characterized by agro-forestry due to their hilly and mountainous terrain. This industry not only supports local economies through job creation and income generation but also promotes sustainable land management practices [1]. In regions where agriculture may be less viable due to terrain or climate, the wood sector provides an alternative source of livelihood, helping to reduce rural depopulation and preserve cultural heritage. Furthermore, the sustainable management of forests contributes to environmental conservation, combating soil erosion, and enhancing biodiversity. Indeed, policymakers are increasingly attentive to forests, given the wide variety of ecosystem services they provide. The European Union (EU) has shown growing interest in forests.
The EU has recognized the importance of forests, including the economic valorization of forest resources and biodiversity conservation as crucial components of the overall Rural Development Programs (RDPs). This approach was reinforced by the 2021 “New European Forestry Strategy 2030”, based on the European Green Deal, which highlights forests as key in combating climate change. Nevertheless, while forests are expected to contribute to an increase in the supply of sustainable, renewable materials and energy through so-called “wood mobilization”, at the European level much attention is paid to the gap between wood potentially and actually harvested [2].
In Italy, the financial emphasis on forestry measures within RDPs has grown since the 2007–2013 programming period. The latest Strategic Plan, aligned with the National Forestry Strategy approved in 2022, allocates around half a billion euros for forestry infrastructure to ensure environmental protection and to manage silvo-pastoral activities, preventing the cultural abandonment of mountainous areas [3]. Additional financing instruments, such as supply chain contracts, have also been introduced to support forestry sector development [3].
Despite renewed interest and some authors highlighting Italy as a forestry country [4], there are still knowledge gaps regarding the Italian forestry sector and its potential development. While the Italian forest surface continues to grow, there are no specific studies on Italy’s position and trends in the global market for primary and secondary processed-wood products. Consequently, there is a lack of an adequate knowledge base to inform strategies for promoting the development of the sector and the regions most involved in it. On the other hand, the development of these rural areas is closely tied to the performance of the Italian market in the global trade of wood products. Although the association between forest resources and the trade balance of wood products appears to be non-systematic, Koebel et al. [5] found that, at a comparable level of forest resource (as hectares per inhabitant), Italy, Germany, and Austria benefit from a favorable trade balance of wood products. This suggests that Italy’s competitive position could improve with enhanced productivity of its forest resources, even though other industry-specific variables also play a crucial role. Historically, traditional exports of wooden products have benefited from maintaining the productive function of forests, essential for sustaining settlements in high hills and mountainous rural areas. Conversely, the abandonment of forestry production in many inland areas has contributed to their depopulation.
Wood products have been a key component of international trade, with the market reaching a value of over USD 310 billion in 2022 [6]. Traditionally, trade in wood products such as roundwood, sawn wood, wood-based panels, paper, paperboard, pulp, and wooden furniture has been regionally concentrated. In 2019–2020, Europe held nearly 50% of the global export value, while North America and Asia each accounted for about 19% [6]. However, the landscape has evolved over the past two decades due to the rise of Asian countries, the Russian Federation, and Eastern European nations [7,8]. This shift underscores the importance of forest-products trade in addressing scarcity and enhancing welfare in the forest sector.
Several researchers have extensively analyzed international wood-products trade using descriptive indicators of competitiveness. Studies have either examined overall trade patterns or focused on specific countries. Hashiramoto et al. [9] noted significant shifts in the global wood-products trade since the late 1990s, with traditional exporters like the USA, Canada, and several European countries losing market shares to emerging exporters such as China, Vietnam, Indonesia, Turkey, and Poland. Long et al. [10] corroborated these findings, highlighting the growing prominence of China and other Asian countries in global wood–forest-product competition. North American and European countries remain core players, but developing Asian nations are gaining significant influence. The complexity of the trade network for resource-based wood–forest products is much less than that for deeply processed products. Liu et al. [11] studied the evolution of the global wood-products trade, analyzing changes in network indicators for 235 countries from 1988 to 2021. Their results revealed that the number of countries participating in the global trade is increasing, and trade relationships among countries are deepening. The core countries in the global trade include North American and European nations, but some developing Asian countries with abundant forest and labor resources are gradually gaining leading positions and jointly controlling the global wood-products market. Rossato et al. [12] focused on the wood-pulp sector, comparing the comparative advantages of major producers. They found that, while most countries demonstrated comparative advantages, Finland, Canada, and Sweden appeared as leaders, with China showing a comparative disadvantage. The wood-pulp industry significantly benefits the export economies of Brazil, Finland, Canada, and Sweden.
Numerous studies have explored the competitiveness of individual countries, with particular emphasis on China due to its significant advancements in manufacturing and exporting wood products. Han et al. [13] assessed the competitiveness of Chinese wooden furniture compared to other leading trading countries using indices such as Balassa’s Revealed Comparative Advantage (RCA), Market Share (MS), and Trade Competitiveness (TC). Their results showed that China transitioned from a comparative disadvantage to a high comparative advantage, maintaining a strong position in the labor-intensive wooden furniture industry. These findings were confirmed by Chao et al. [14].
Fewer studies have focused on European countries, with some exceptions being Germany [15] and Slovakia [16]. Dieter and Englert [15] analyzed the competitiveness of the German forest industry in the international timber market, concluding that, while Germany does not specialize in wood products, it remains a leading player in the global forest industry, with above-average export growth for semi-finished wood products such as pulp, paper, paperboard, sawn wood, and wood-based panels.
Palus et al. [16] examined the trade competitiveness of Slovakia’s wood-processing industry compared to Visegrad group countries using indicators like the Trade Specialization Index, Export/Import Ratio, Standard Grubel–Lloyd Index, RCA, and Vollrath’s Revealed Competitiveness. They found that Slovakia had a revealed comparative advantage in most products, with increasing intra-industry specialization corresponding to the level of value added to products.
Despite Italy’s historical importance in the forestry sector and as an exporter of secondary processed wood products, specific studies on Italy are lacking. Since Italy’s leadership in some wood product markets has shown signs of declining competitiveness in recent years [17], this paper aims to fill a knowledge gap by analyzing Italy’s competitiveness in the global wood products market from 1996 to 2019, focusing on wooden furniture and wood panels.
Moreover, we considered intra-industry trade, which has never been investigated for the products considered here, not only for Italy. The analysis ends in 2019 to avoid distortions caused by the COVID-19 pandemic and the Russia–Ukraine war (To illustrate, if the value of world trade in wood products was USD 244 billion in 2019, it rose to USD 310 billion in 2022, but decreased to USD 236 billion in 2023. A similar fluctuating trend is observed for trade flows of furniture and panels. After 2019, trade values surged but returned to pre-pandemic levels by 2023. Taking the three-year average for 2020–2022 would give a distorted view of trade flows, which could only be accurately interpreted with data from at least 2024, which are currently unavailable [6]. Other authors following the same criteria have made a similar choice, defining 2019 as “the most recent normal year before the shocks caused by SARS-CoV-2 pandemic and by the Russia-Ukraine war” [18].
Several methods may be adopted to assess the competitiveness of a country in international trade. In this paper, to identify the changes that occurred in Italy’s competitive position compared to those of the main competing countries on the international market, we first analysed the trends in Market Shares of the main international exporters as a prerequisite for choosing the countries to include in export–import flow matrices [19]. Then, using Balassa’s RCA index, RSCA, and Trade Competitiveness (TC) indices, we examined the changes in Italy’s comparative advantages against more competitive countries. Moreover, using the Grubel–Lloyd index, we also investigated Intra-Industry Trade (IIT), which refers to the trade involving the exchange of similar goods, never studied for the products considered here, not only for Italy. As documented by an extensive literature [20,21], thanks to the intensification of north–south shipments in the manufacturing sector in recent decades, quality differentiation plays an important role in international trade. By combining these multiple indices, this study not only provides a detailed and comprehensive picture of Italy’s competitiveness in a sector that has been somewhat neglected by the literature, but also establishes a robust framework for other researchers to replicate the analysis for other countries.
2. Materials and Methods
In order to evaluate the competitiveness of Italy in the global market of wood and wood products, and to trace long-term trends, we used the data available in the UN Comtrade database considering the period 1996–2019 [6]. The product classification is based on the Harmonized International System (HIS), a worldwide six-digit code framework grouping and categorizing exported merchandise and goods [6]. Table 1 displays the list of detailed codes for the categories of products that were specifically analyzed, including furniture and panels. The main leading exporting countries have been selected for each assortment. Moreover, since comparative advantages are related to the relative factor endowments [22] and per capita income is a widely accepted index for the relative abundance of physical and human capital, the selected nations are divided into four groups according to their per capita gross national income (GNI). Thus, the correspondence between belonging to a given level of income and a given geographical area becomes evident (Table 2). Overall, we selected at least ten countries for each assortment. Then, for each country, we extracted export and import data to calculate the matrices and indices specified in the next short sub-paragraphs.

Table 1.
Description of HIS groups for furniture and panels.
Table 2.
Main exporting countries in wood products grouped per capita GNI.
2.1. Matrices of Exchange Flows
To analyse the trade patterns of the main exporting countries of wood fuel, Hillring [19] computed matrices to cross-analyse the data for exporting and importing countries. In these matrices, the exporting countries are at the top of the columns, while the importing ones are across the lines. Unlike Hillring [19], we consider data in value and not in volume to make considerations relating the different assortments considered—very different from each other in terms of unit values. For each country, data refer to the 2018–2019 average value of imports and exports. The tables consider the 10 largest exporters, presented individually. The remaining are aggregated in the column ‘Exp-other’. The individual cells show the value of the imports by the country in the line from the country in column (We computed three kinds of matrices. The first reports the absolute values of trade flows; the second reports the percentage shares of the country’s total export flow to the countries in the rows; the third reports the percentage values of total imports of the country in the row from the exporting countries at the top of the columns. Due to space constraints, in the paper we report only matrices with absolute values).
2.2. Market Share Index
The Market Share (MS) index gives us an idea of the comparative advantage of a country in an economic sector. For a given assortment, it measures the countries’ market share in the global market and is calculated by:
where MSij is the market share, Xij are the exports of the i-th commodity of country j, while Xiw are the world exports of the i-th commodity.
2.3. Revealed Comparative Advantage Index
The Revealed Comparative Advantage (RCA) index, defined by Balassa [23], measures the level of a country’s competitiveness in international trade in a commodity category. The index compares the weight of a given commodity on the total export of a country with the weight of the same good on the total world export. It can be calculated by
Xij are the exports of the ith commodity of country j; ∑iXij are the total exports of country j; ∑jXij are the world exports of commodity I; and ∑j∑iXij are the total world exports.
A country has a revealed comparative advantage in a commodity when the RCA index is greater than 1, while when the index value is less than 1 the country has a revealed comparative disadvantage.
Some authors [13] have further specified the magnitude of comparative advantages and disadvantages. If the value of the RCA index > 2.5, the country has an extremely strong advantage; if 1.25 < RCA < 2.5, the country has a strong advantage; when 0.8 < RCA < 1.25, the country has a moderate advantage; values in the range 0 < RCA < 0.8 denote a weak disadvantage; finally, RCA < 0 is a comparative disadvantage. The RCA index has some shortcomings. Firstly, it has an asymmetric distribution ranging from 0 to +∞, with a demarcation value of 1 (or 100). Furthermore, including only export flows, RCA overlooks the international fragmentation of production processes. So, as in the study by Algieri et al. [18], we have also computed other indices.
2.4. Revealed Symmetric Comparative Advantage
The Revealed Symmetric Comparative Advantage (RSCA) was proposed by Dalum [24]. Its value ranges from −1 to 1 (with a demarcation value of 0). A value larger than zero indicates that country j has a revealed comparative advantage in i. A value less than zero points to a comparative disadvantage in product i for country j.
2.5. Trade Competitiveness
Since RCA does not consider the imports, many authors have argued that it is biased, especially in the case of a great country. So, we considered the TC index that expresses if a country is a net exporter or importer in a sector. It is measured by the ratio between the export–import balance and total foreign trade of a given commodity:
where Xij are the exports of the i-th commodity of country j, while Mij indicates the value of imports. The index takes values between −1 and +1, and can also be expressed as a percentage. If the country is totally importing, the index value is −1, while if the country is totally exporting the value is +1.
2.6. Intra-Industry Trade Index
Given the state of the debate in the literature, in this paper we chose to analyze intra-industrial trade following Grubel and Lloyd [25], who proposed two indices: Bij and Bj.
Bij measures the intra-industry trade for a given good i, Xij and Mij are the values of country j’s exports and imports of good i. For a country j and a good i, the index measures the intra-industry trade as a percentage of the total trade of a good i. Its value can range from 0 to 100:0 when either Xij or Mij is zero, that is when there is no intra-industry trade, and 100 when Xij and Mij have the same value, so that all trade in the good i is intra-industry trade.
In addition to Bij, Grubel and Lloyd [25] proposed another index which refers to a homogeneous aggregate of goods traded by a country with a given group of other countries. This index, Bj, gives a summary measure of intra-industry trade in country j, at any given level of aggregation.
As Bij, Bj gives a measure of the total intra-industry trade of a country with respect to total trade. It can be calculated for a set of similar goods to highlight the extent of intra-industry trade in similar products, for example because they satisfy the same consumption needs, albeit with some differences, or because they belong to the same production value chain. In our analysis, since we considered aggregate products, we used Bj.
3. Results
3.1. Italy’s Wood–Forest Products Sector
According to the Italian National Forest and Carbon Sinks Inventories (INFCI), the total forest area (forest and other wooded land) would have increased from 8.67 M ha in 1985 to 11.05 M ha in 2015, so 36% of the national surface would be covered by woods [26,27]. The annual woody increase is approximately 38.4 million Cubic Meters (MCM) but, due to natural losses and environmental–landscape constraints, only 30 MCM are harvested [28]. Important value chains originate from this huge natural capital supply, such as those of furniture and paper, for which Italy continues to have a highly respectable competitive position in the world market [17]. However, in the last twenty years, Italy has lost positions in the international ranking, especially as a furniture-exporting country [17].
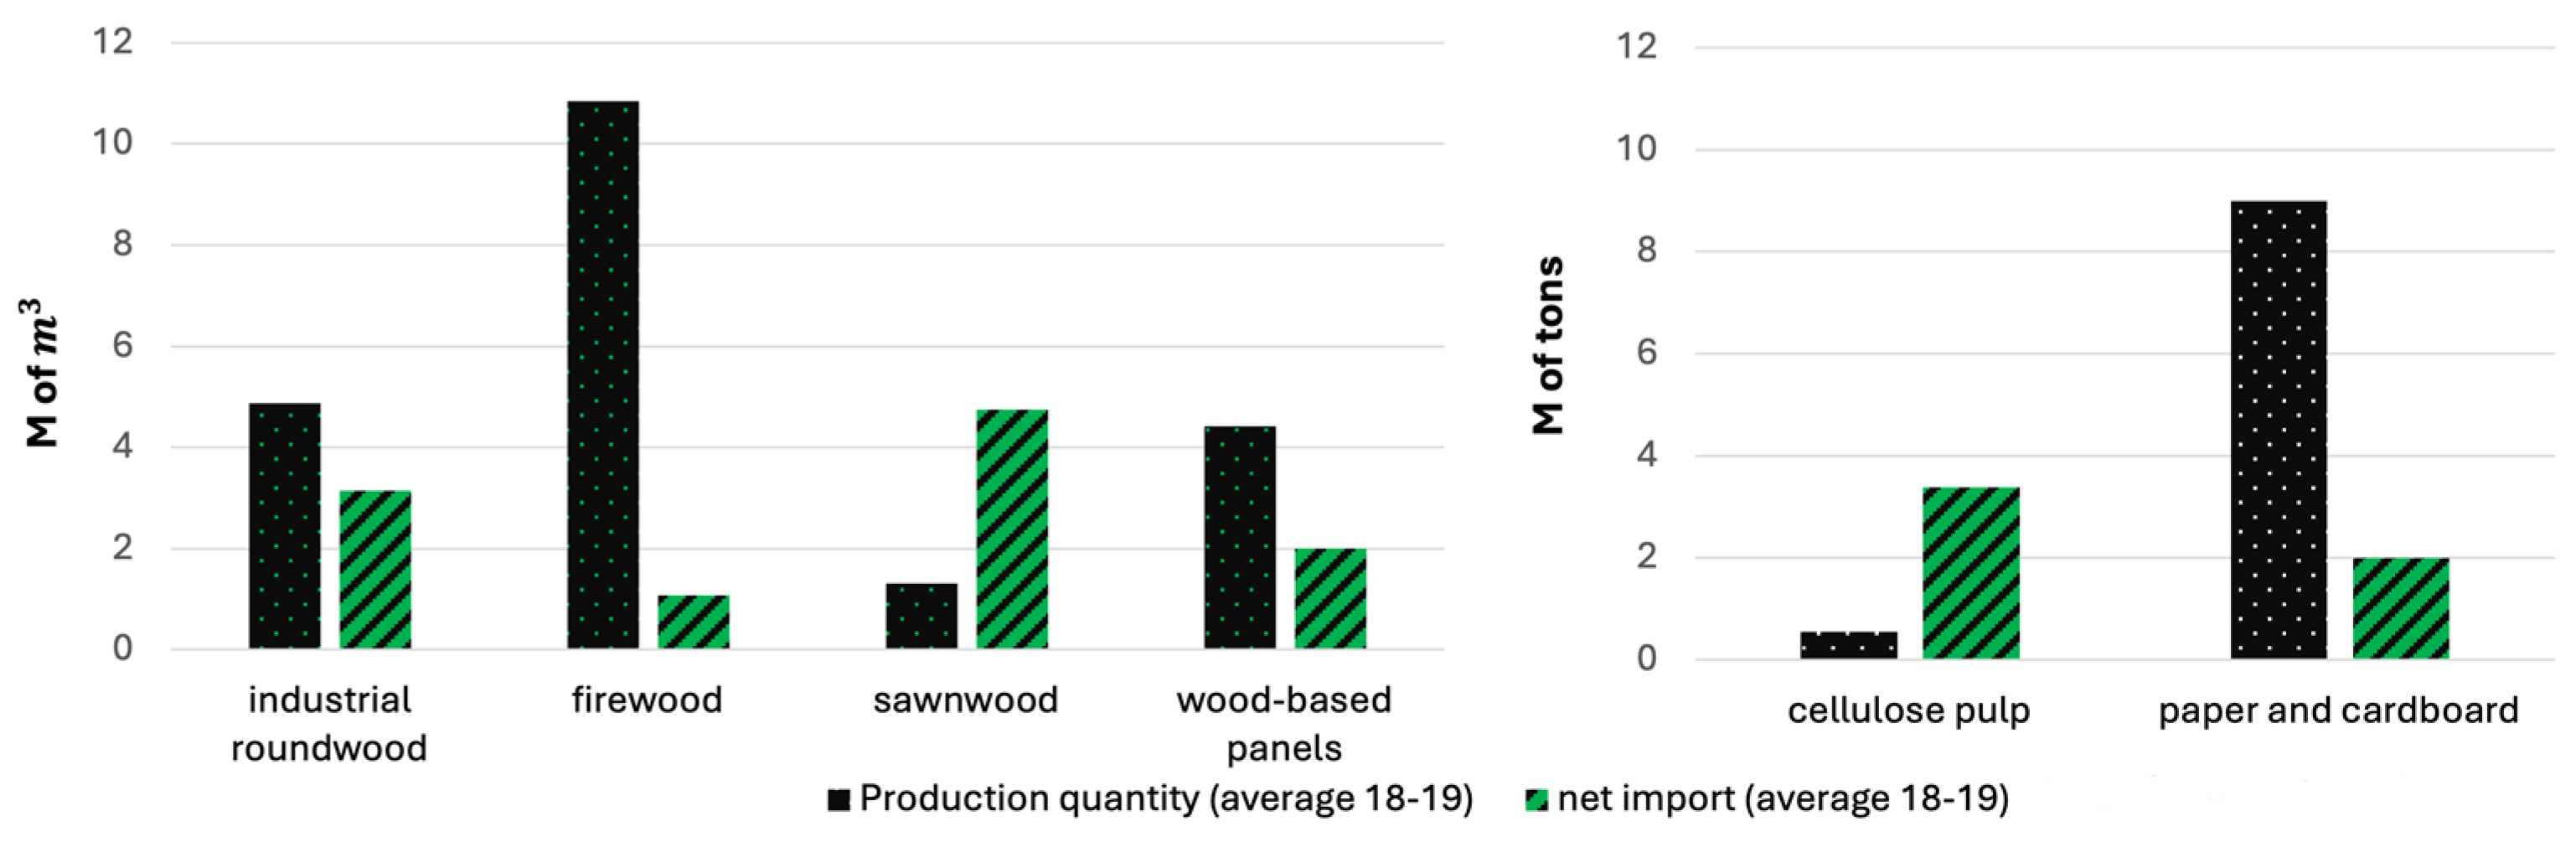
The wood industry sector consists of 46,538 companies employing about 303,721 employees, with a total added value of €25.4 billion—1.64% of the national added value [17]. The wooden furniture–furnishing chain is one of the most important forestry supply chains. In 2018–2019, its exports reached EUR 3.84 billion. Regardless of this important entrepreneurial reality, the national production of raw materials and manufactured assortments does not meet internal needs. Italy is a net importer of industrial roundwood, firewood, and semi-finished products such as sawn wood, cellulose, paper, and cardboard (Figure 1).
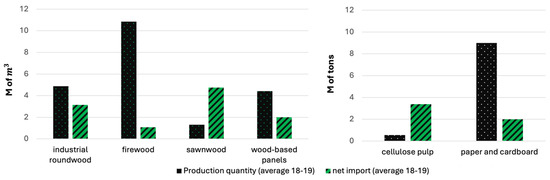
Figure 1.
Production and net imports of some wood products (average value 2018–2019; M of cubic meters and M of tons). Source: our calculations from FAO data.
To give a preliminary overview of the production and the Italy’s position in the international trade, we first analysed production data, export data, and import data of roundwood, firewood, sawn wood, wood-based panels, paper, paperboard, pulp, and furniture. Data were sourced from FAO [29] and COMTRADE [6]. Raw roundwood is an aggregate comprising industrial roundwood and firewood, but only a fraction given to industrial use can feed wood-building, wooden furniture, and paper–cardboard supply chains. In the last 20 years, the trends of roundwood and firewood production have increased slightly and, despite the national production, Italy is a net importer of both products (Figure S1 in the Supplementary Materials). Production trends of veneer and plywood are similar, with a sharp decline occurring between 2007/2008 and 2019. Net imports of veneers showed an increasing trend until 2008, followed by a decreasing one that still continues today. Net imports of plywood show almost the same tendency, increasing until 2005, with a peak of 0.4 MCM. From 2016, they increased again, exceeding production. After 2018, both production and net imports decreased. This probably reflects the slump in domestic demand linked to the generalized negative economic situation and to the production trends of the wooden furniture and wood-building industry, for which both panels and plywood are important intermediate goods (Figure S2 in the Supplementary Materials).
Paper and cardboard have, by far, the highest production levels, reaching almost 9 M tons every year (Figure S3 in the Supplementary Materials). These first data show that paper–cardboard products prevail, followed by roundwood, firewood, panels, veneer, and plywood. However, since the data are voluminous, they may provide an incomplete and even distorted idea. So, in the following, we will consider exports and imports in value terms. We will limit the analysis to furniture and wood panels because furniture is one of the most important categories for determining the competitive position of Italy in the international market, while panels have a great importance as intermediate goods in wooden furniture and wood-building value chains. The data in value, considering net exports, reveal that wooden furniture is a very important category. Between 2010 and 2019, the average annual export value was almost USD 4 billion (17% compared to 1996–1997), while that of net exports was USD 3.2 billion (Figure 2). In 2019, more than a quarter of Italian exports went to France and the USA, which are among the major importers of Italian furniture (Table 3). Other major European importers are Germany and the United Kingdom, while among Asian countries, China is the main importer. Moreover, the United States, Germany, France, Spain, the United Kingdom, Russia, and China together represent almost 50 percent of Italian manufacturing exports [17].
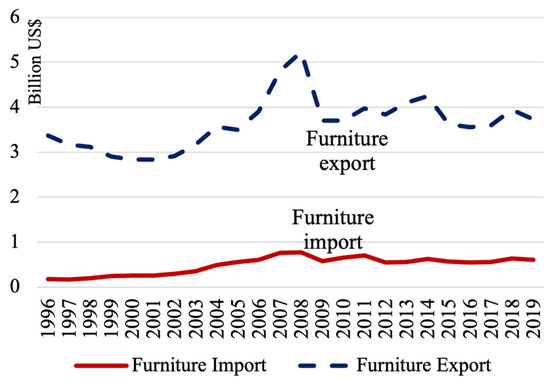
Figure 2.
Italian exports and imports of wooden furniture (billions of dollars). Source: our calculations from COMTRADE data.
Table 3.
Main importing countries for Italian furniture in 2019.
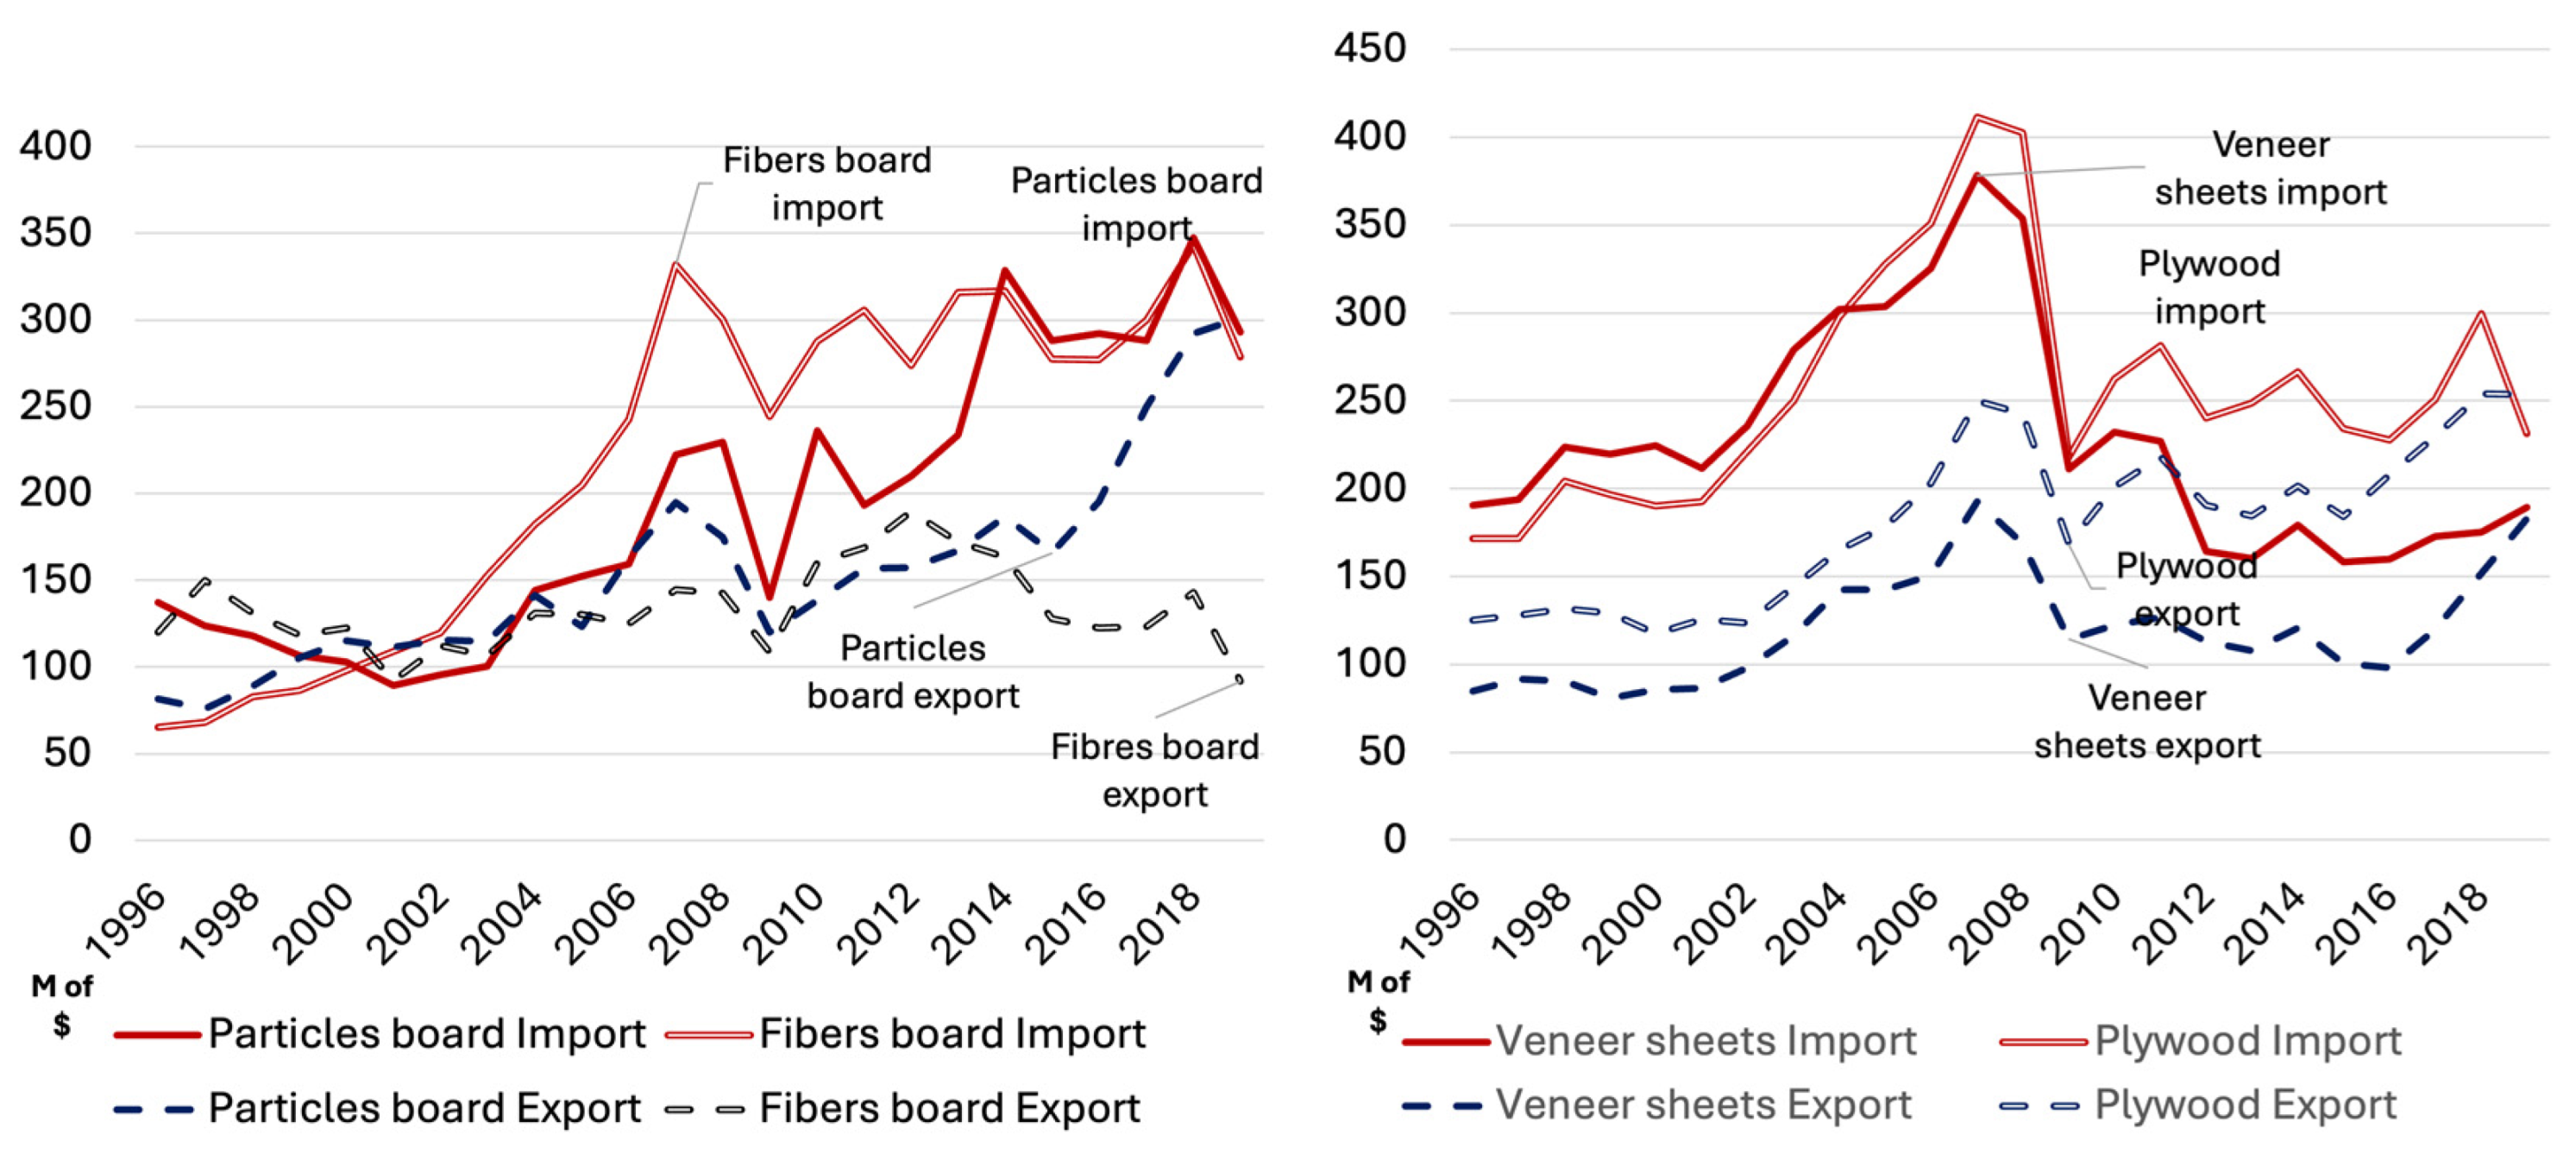
Regarding wood panels, data in value confirm that Italy is a net importer, but exports of particleboards have started to rise again after the 2007–2008 financial global crisis (Figure 3).
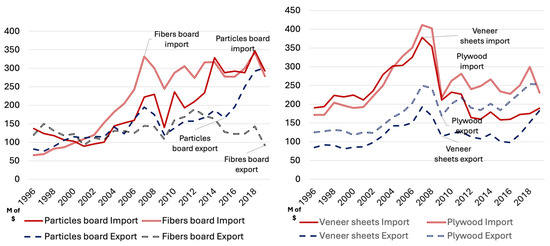
Figure 3.
Italian exports and imports of panels (millions of dollars). Source: our calculations from COMTRADE data.
The value data confirm the importance of furniture in determining the position of Italy in the international market, but also the strong dependence on foreign countries for panels—important intermediate goods. Furthermore, the data show a drop in production and exports of many of these products since 2000. Although in some cases there had been a recovery, the financial crisis of 2007–2008 led to drops in production and demand for furniture. Their production and exports shrunk drastically in 2008 and have not yet recovered. Among panels, only particleboards have reached pre-crisis levels.
3.2. Italy’s Competitive Position in the Wooden Furniture Sector
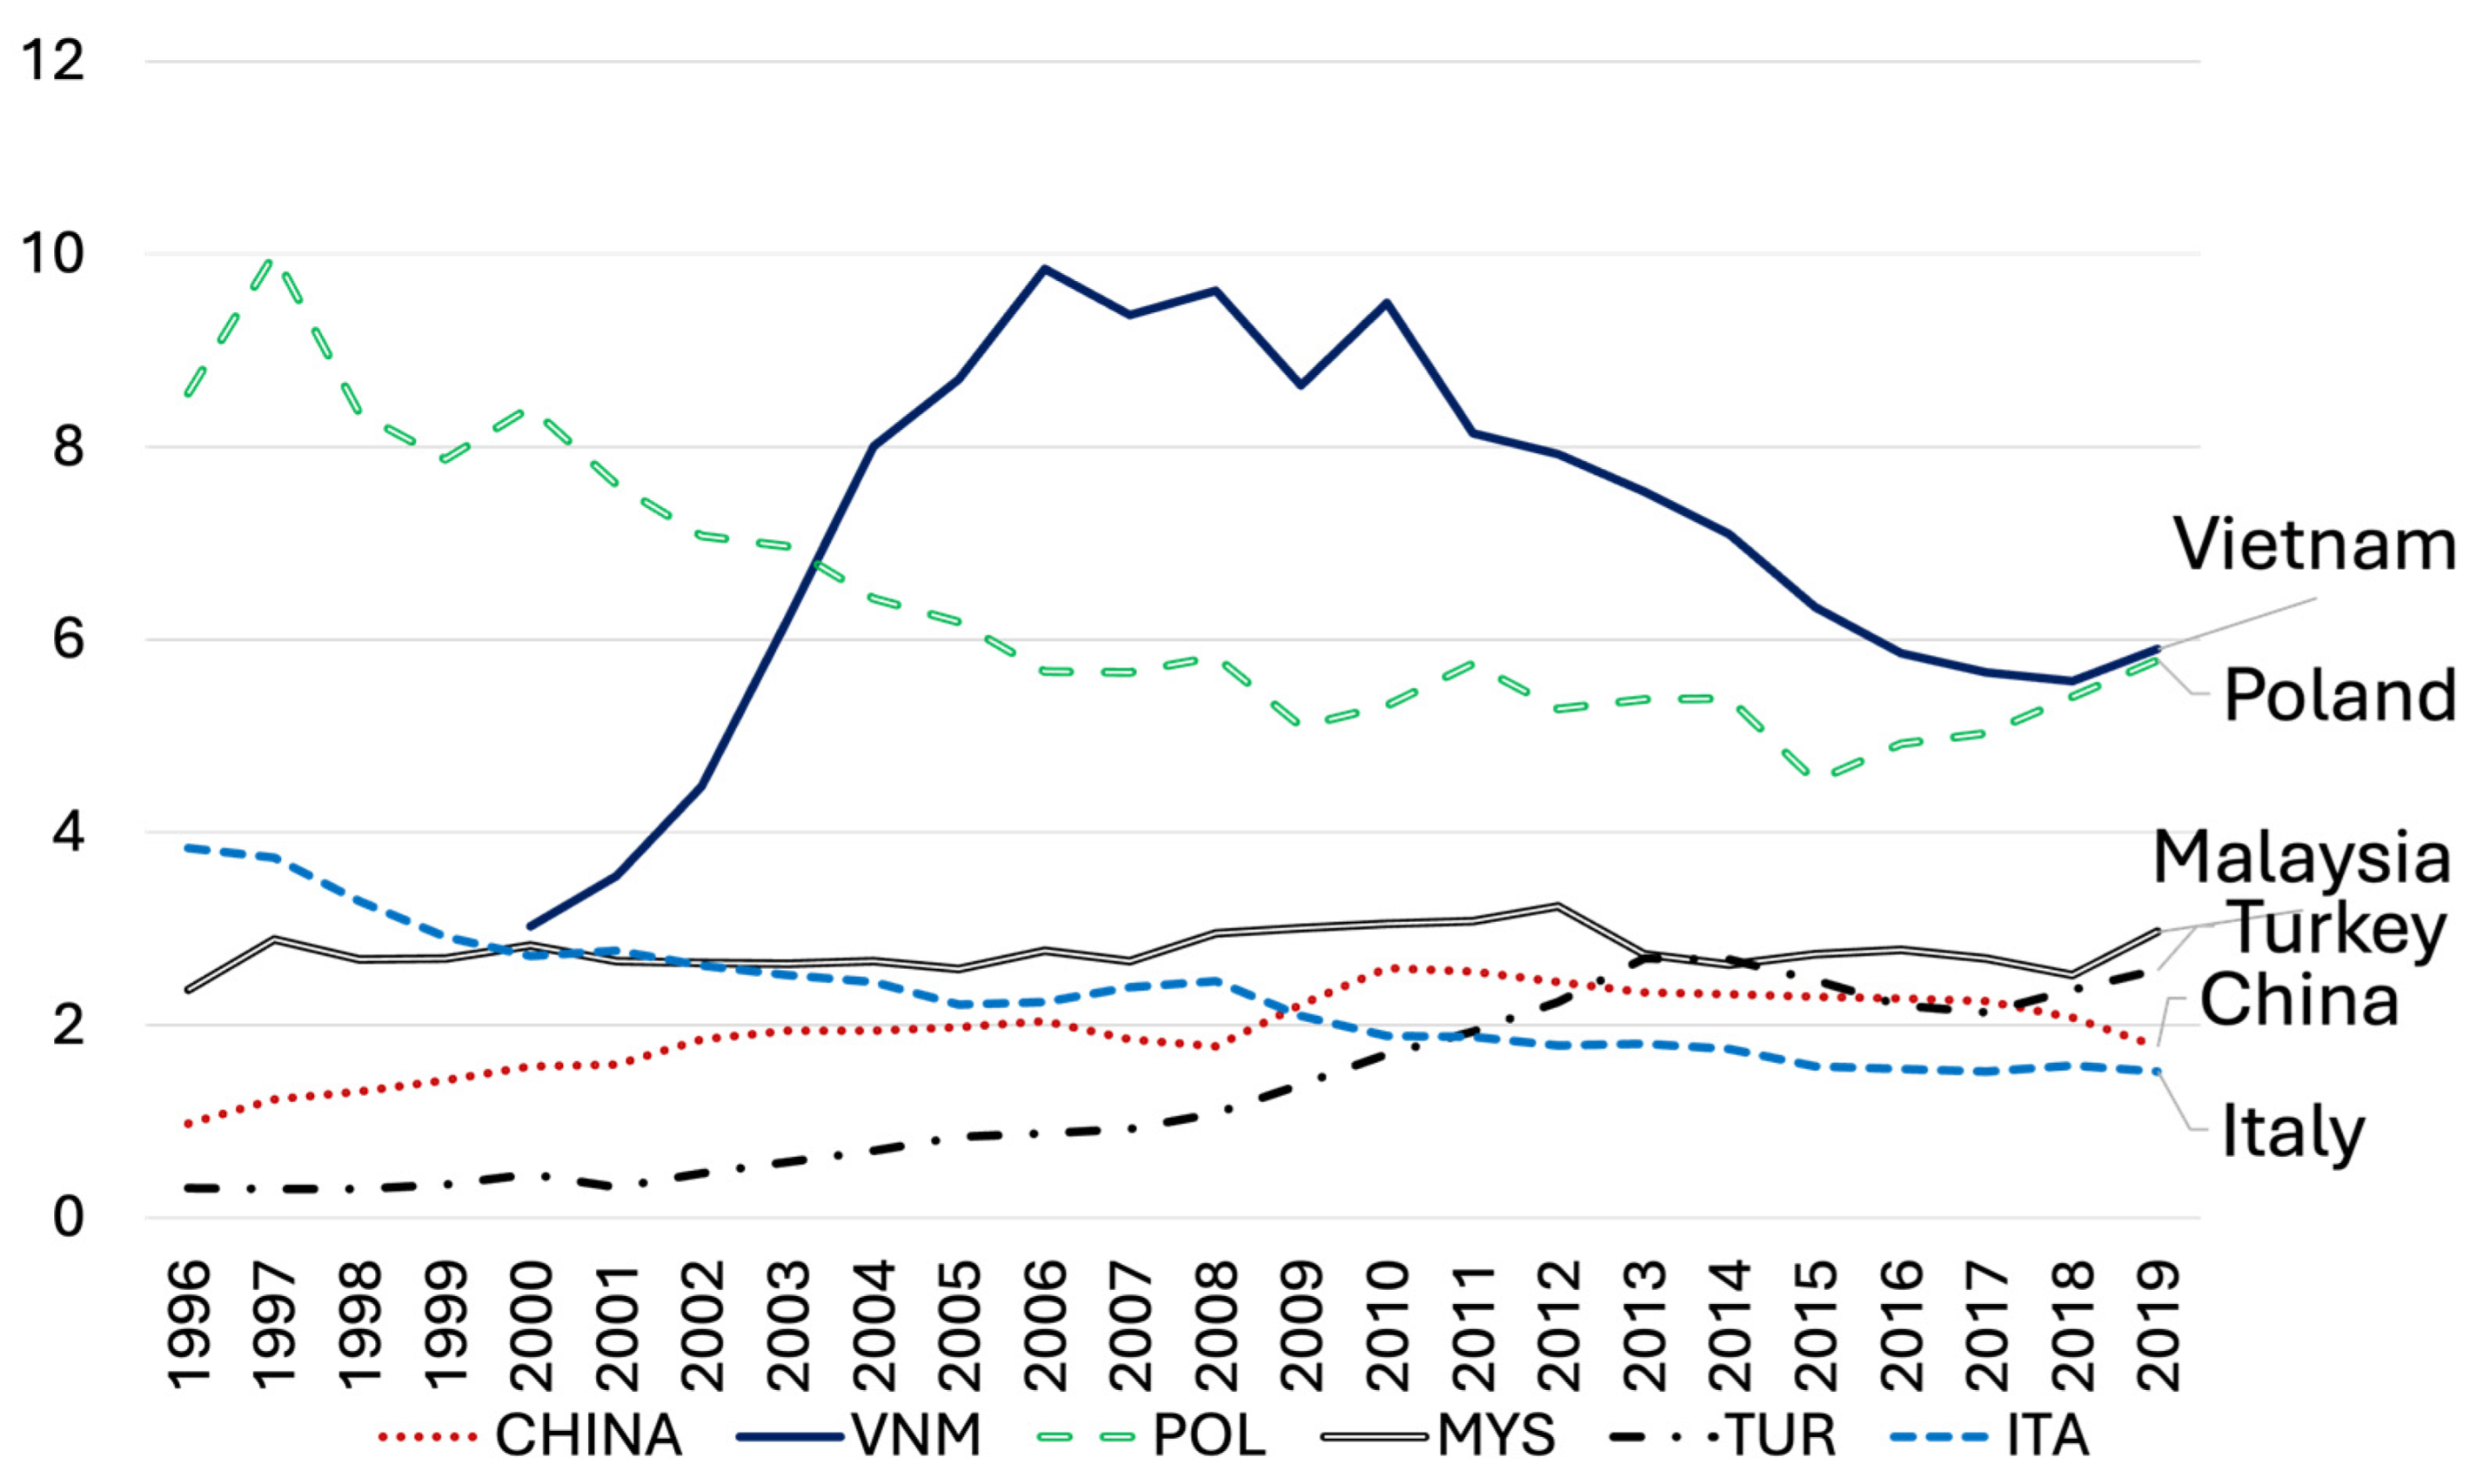
As specified in Table 2, the analysis focuses on four wooden furniture categories: office, kitchen, bedroom, and other. We aggregated the data obtaining the macro category of wooden furniture. Over the past two decades, there has been significant growth in the global market of wooden furniture and two noteworthy trends: the increase in the concentration of export flows and the shift of the main exporting countries from those with high per capita income to those with medium–low per capita income, mainly located in Asia. This dynamic is not separate from the changes in world trade between the last years of the 20th century and the first 20 years of the 21st. The rise of China and other middle and low-middle-income Asian countries is the most important aspect of changing international equilibriums, together with the weaknesses of some Western countries, among which is Italy, while others, like Germany, have maintained their position [30]. In 1996, the value of world’s export of furniture was USD 17.4 billion, and in 2019 it reached USD 47.4 billion, that is +172% with an average annual growth of 7.5%. At the same time, the concentration of the world’s wooden furniture exports increased with important changes in the group of major furniture-exporting countries—those contributing to more than 70% of the global market. (In 1996, the top ten leading countries covered 67% of the global market. By 2019, this share had increased to 73%, having previously peaked at 75% in 2015). Figure 4 shows that in 1996 the world market was still dominated by high-income countries, with Italy in the first position, followed by Germany, Denmark, Canada, France, the USA, and Sweden. However, in the first ten exporting countries there were also Poland and Malaysia, but the former accounted for more than 43% of the global market. In the following years, medium- and low-income countries replaced the high-income ones. In 2000, China entered the group of ten leading countries with a MS of 6%. In the same year, the MS values of Italy, Canada, and Germany drastically dropped to 14%, 10%, and 8.5%, respectively. Afterwards, Malaysia, Indonesia, and Vietnam greatly improved their positions. So, during the period considered, Italy not only lost its world-leading position with a drop in its market share from 19.3% to 7.6%, but it also ranked fifth worldwide, behind China, Germany, Vietnam, and Poland. In 2019, China became the leader in the world market, with an MS equal to 24.5%, accounting with Malaysia and Vietnam for 39%, thus moving the largest geographical area of origin of wooden furniture from Europe to Asia. It is worth noting that, in 2001, China joined the World Trade Organization (WTO), massively boosting its exports. Several European countries such as France, Belgium, and Denmark disappeared from the ranking while, in contrast to the strong negative trend of Europe, Poland doubled its MS (8%). Among non-European countries, Canada continued to have an important position. Finally, the top ten exporting countries increased their importance in the global furniture trade, from 67% in 1996 to 73% in 2019, confirming the growing concentration of the world’s wooden furniture market.
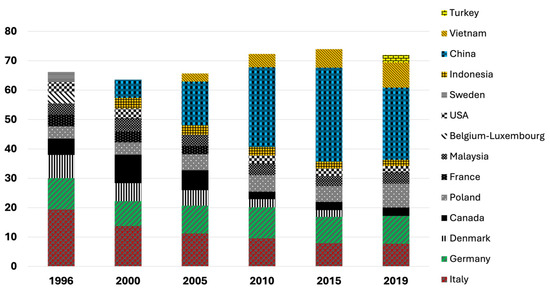
Figure 4.
Trends of Market Share of the main exporting countries of wooden furniture. Source: our calculations from COMTRADE data.
The analysis of the matrices of import and export flows (Table 4) allows us to detail the global scenario.
Table 4.
Trade in furniture. Average values 2018–2019 (M of dollars).
The data support the downsizing of Italy, despite the affirmation of China as a giant. The main markets for Italian furniture are France and the USA. They absorb 14% and 12% of Italian exports. Obviously, these values correspond to very different shares of the imports of the two countries: 21% for France and 3% for the USA. The other main importers of Italian furniture are Germany and the United Kingdom, with 7% and 6%, respectively, while among Asian countries, China is the main importer with a share of 6%. Furthermore, Germany, France, the United Kingdom, the United States, Russia, and China together represent more than 40 percent of Italian manufacturing flows [17]. Italian production, therefore, significantly feeds the European and world markets: about 18% and 8% of Swiss and German imports, and more than 7% of those of the United Kingdom. In terms of a general picture, the USA is the world leader as the main destination of world exports of furniture. The USA absorbs practically all of Canada’s and Mexico’s exports (98% and 97%, respectively), and the largest share from Asian countries: 63% of Vietnamese exports, 50% of those of Indonesia, 44% of those of Malaysia, and 38% of those of China. In addition to Italy, the main European trading partners with the USA are France and Poland. But among all the countries listed, the United States mostly imports from China, Vietnam, and Canada (34%, 17%, and 9% of total USA imports, respectively). Since the first half of the 2000s, the United States has tried to counter China’s presence in its market by introducing anti-dumping duties. The result was a negative depressive effect on Chinese exports to the United States but a positive diversion effect on exports of other countries such as Vietnam and Malaysia. China, on the other hand, expanded its exports to other markets, such as the United Kingdom and Australia, maintaining strong commercial growth of wooden furniture around the world [31]. In Europe, Germany is the leader, and its exports cover substantial shares of the total wooden furniture imports of Austria (65%), Switzerland (41%), Belgium (40%), France (32%), and The Netherlands (30%). The quality of Italian furniture is preferred even by geographically faraway countries: 58% of Russian imports, 29% of Chinese imports, more than 9% of Saudi Arabian imports, and about 12% of Hong Kongese imports come from Italy. The distribution of Italian exports shows that the imports of Germany, its main European competitor, did not affect Italy’s position in extra-European markets. It is probable that factors linked to product quality continued to give to Italian furniture a respectable position in the world [17]. Moreover, as some authors have pointed out, it is worth stressing that Germany’s position derives from a strong mercantilist policy which was implemented at the introduction of the euro and which has contributed to the erosion of the competitive position of not only Italy but also of weaker countries in the eurozone in general [30]. Considering the RCA trends, we must note a loss of comparative advantages of Italy (Figure 5). The RCA index’s three-year average dropped from 3.86 to 2.7, causing Italy to fall from second to fourth position (Table S1 in the Supplementary Materials). Nonetheless, the country still maintained an extremely strong comparative advantage, on both the international and European scenes. The comparison with other countries is very interesting. Among Western countries, the value of the index of Canada decreased, even if it continued to indicate a moderate comparative advantage. Vietnam, completely absent from the international scenario at the beginning of the period, took the first position at the end of it. China moved from sixth to seventh place, also improving its comparative advantage. The same was true of Malaysia and Indonesia, in third and fifth positions, respectively. In Europe, Poland, even moving to second position, confirmed the importance of its comparative advantages, while Germany lost position in the ranking but gained in terms of value of the index. This is testament to a productive liveliness that is not present in Italy. In summary, the evolution of the RCAs underpins the drastic reduction in Italy’s MS. Despite its leading position, Germany had an RCA index value of just over 1 and ranked ninth, having experienced only a slight improvement. Almost all the middle- and low-income countries showed an increasing RCA trend; by contrast, high-income countries experienced a downward trend. Recall that a disadvantage of the RCA index is that it is asymmetric in nature. The RSCA results, taking into account the asymmetry reported in the same table, clearly demonstrate the non-existence of appreciable differences in the levels of specialization and in the comparative advantages of the countries considered.
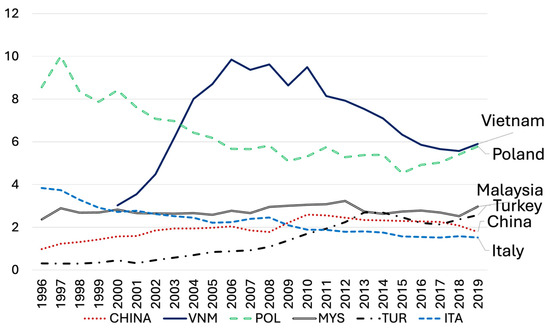
Figure 5.
Trends in RCA for wooden furniture in selected countries. Source: our calculations from COMTRADE data.
The trends of the TC index (Table S1 in the Supplementary Materials) show that, at the beginning of the study period, all the countries, except for the USA, Germany, and Turkey, were net exporting countries. Italy, Indonesia, Malaysia, China, and Poland had a value almost equal to 1, but from 2004 the situation worsened for Italy (TC value is 0.71), which remained a net exporting country but with a reduced role, at both a European and global level. The same happened for Poland, Indonesia, and China, while Germany, Vietnam, and Turkey switched from net importers to net exporters. At the end of the period, Vietnam, China, and Indonesia were in the first, second, and third positions, respectively. These results confirm the need to also consider the intra-industry trade to explain countries’ positions in international trade because a country may be simultaneously an importer and exporter of a given product, and its trade flows may not be related to any level of specialization.
For each country and for every year, we calculated the Bj index [25] for the aggregate of products in Table 2. The intra-industry trade analysis allows us to clarify apparent contradictions. At the beginning of the period, the Western countries, such as Germany, the USA, Turkey, and Canada, had the highest incidence of intra-industry trade, while, for Asian countries, it was irrelevant. In particular, the position of Germany stands out with an index of 88, followed by Turkey and Canada, 63.7 and 43.6, respectively (Table 5). (We computed Grubel–Lloyd indices for every year from 1996 to 2019. Due to space constraints, in the paper we only present the average values of three sub-periods because we have verified that the trends do not change). Italy was in a middle position, but over the study period its average value increased from 10.6 to 27.6. This reveals that the weight of intra-industry trade on total furniture exports almost tripled, but Italy remained a very specialized country. Intra-industry trade increased for every country except Vietnam, the value of which remained negligible. Now, it is interesting to draw a comparison between Italy and Germany. The competitive position of the two countries cannot be explained considering only the indexes of comparative advantages. For Germany IIT prevails, for Italy it does not. According to the theoretical synthesis of Fontagné and Freudenberg [32], the main trading partners of Germany are high-income countries, mainly European ones. On the contrary, for Italy, which has more diversified markets and which exports significantly to China, the old comparative advantages are still at work.
Table 5.
Grubel–Lloyd indices for furniture.
3.3. Italy’s Competitive Position in the Wood-Based Panels Sector
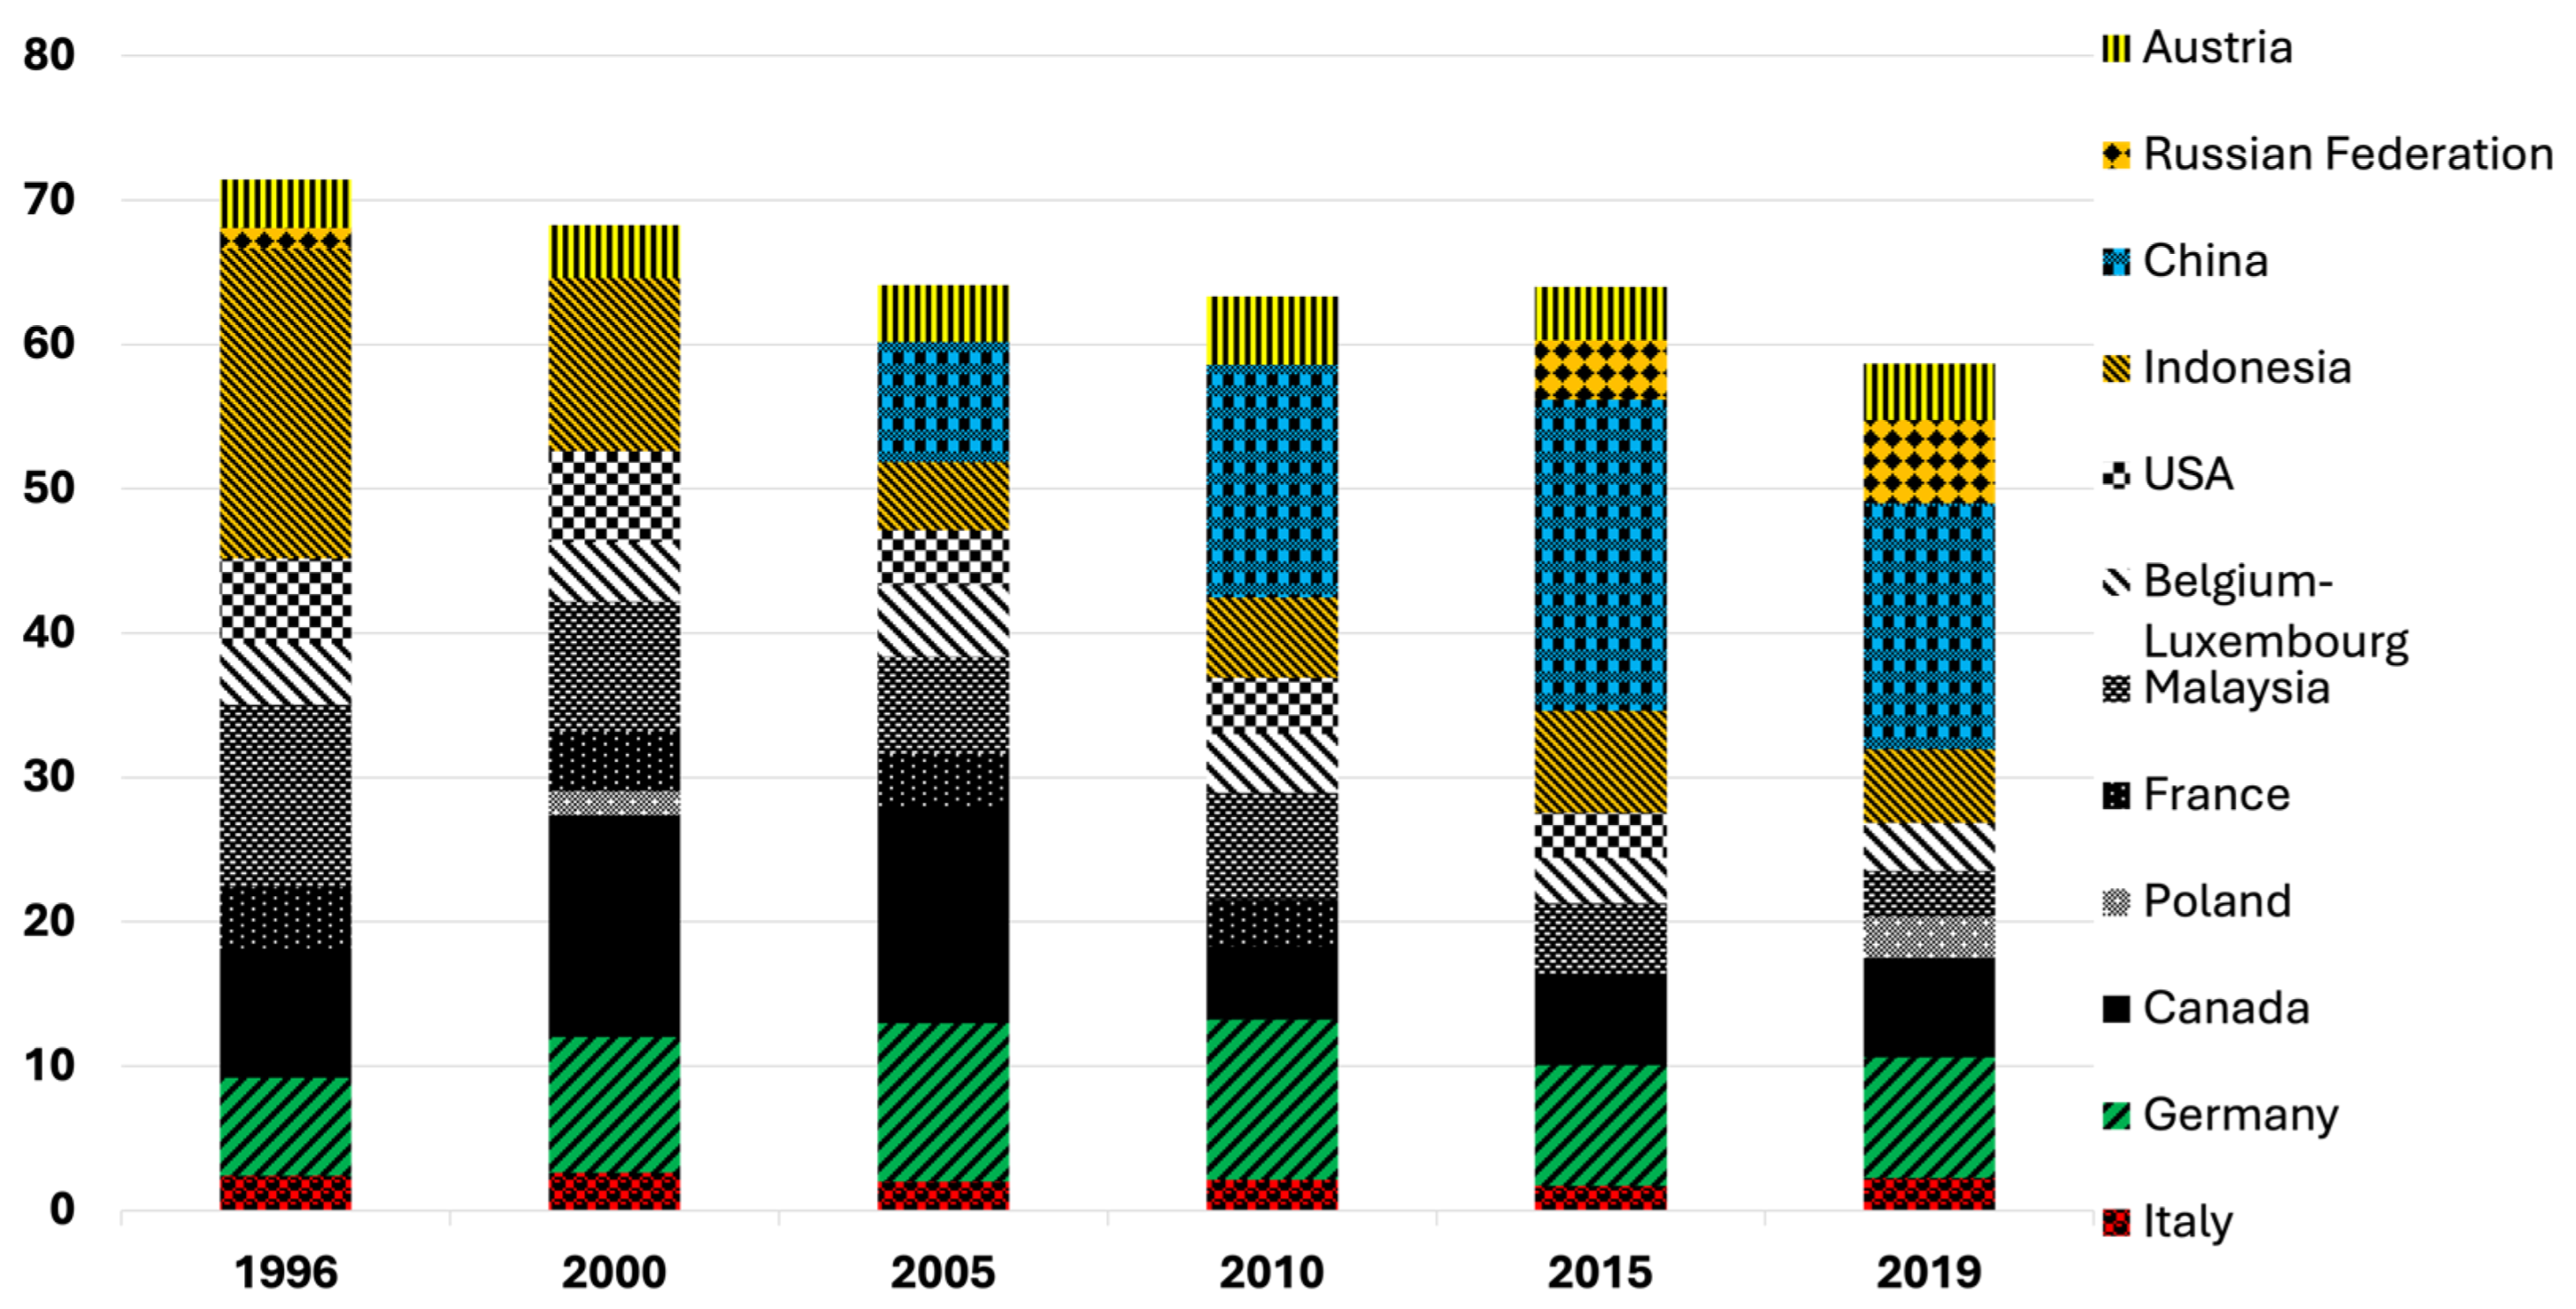
Between 1996 and 2019, the value of world exports of wood-based panels increased from USD 17 billion to USD 36 billion, and some important changes occurred. First, at the beginning of the study period, the main trading nations were Indonesia and Malaysia, with an MS of 22% and 13%, respectively (Figure 6). The other important trading countries were Canada (MS = 9%) and, in Europe, Germany, Belgium, and Austria (MS: almost 7%, 4%, and 3%). The position of Italy fluctuated between 2% and 3% of the world market and, at the end of the period, was in tenth position. Therefore, Italy is not among the main exporters of these product categories, and the changes that occurred in the world market have affected other countries. Russia, almost non-existent in the market at the end of the 1990s, reached a notable position in 2019 with an MS = 6%, positioning itself in fourth position. In Asia, as already in the furniture sector, we witness the leap of the Chinese giant to the detriment of Indonesia and Malaysia, which experienced a strong decrease in their MS: more than 16 and 9 percentage points, respectively. China reached 17% of the global market, with peaks above 20% in previous years, thus moving to the first position. In this scenario, the weight of Canada and Europe remain stable. Among European countries, Italy, with an MS = 2.2%, is not characterized as an important country, while Germany, which at the end of the period had an MS of 8% (having previously reached values even higher than 10%), was in second position, followed by Austria at 4%, Poland at 3%, and France at 2.7%. The exports of Poland experiences a growing trend, as already seen for furniture. (In 1996, the top ten leading countries covered 71% of the global market. By 2019, this share had decreased to 60%. The analysis is limited to these countries because the remaining ones have individual market shares lower than 2%. The objective was to compare Italy’s position with that of the main exporting countries).

Figure 6.
Trends of Market Share of the main exporting countries of wood-based panels. Source: our calculations from COMTRADE data.
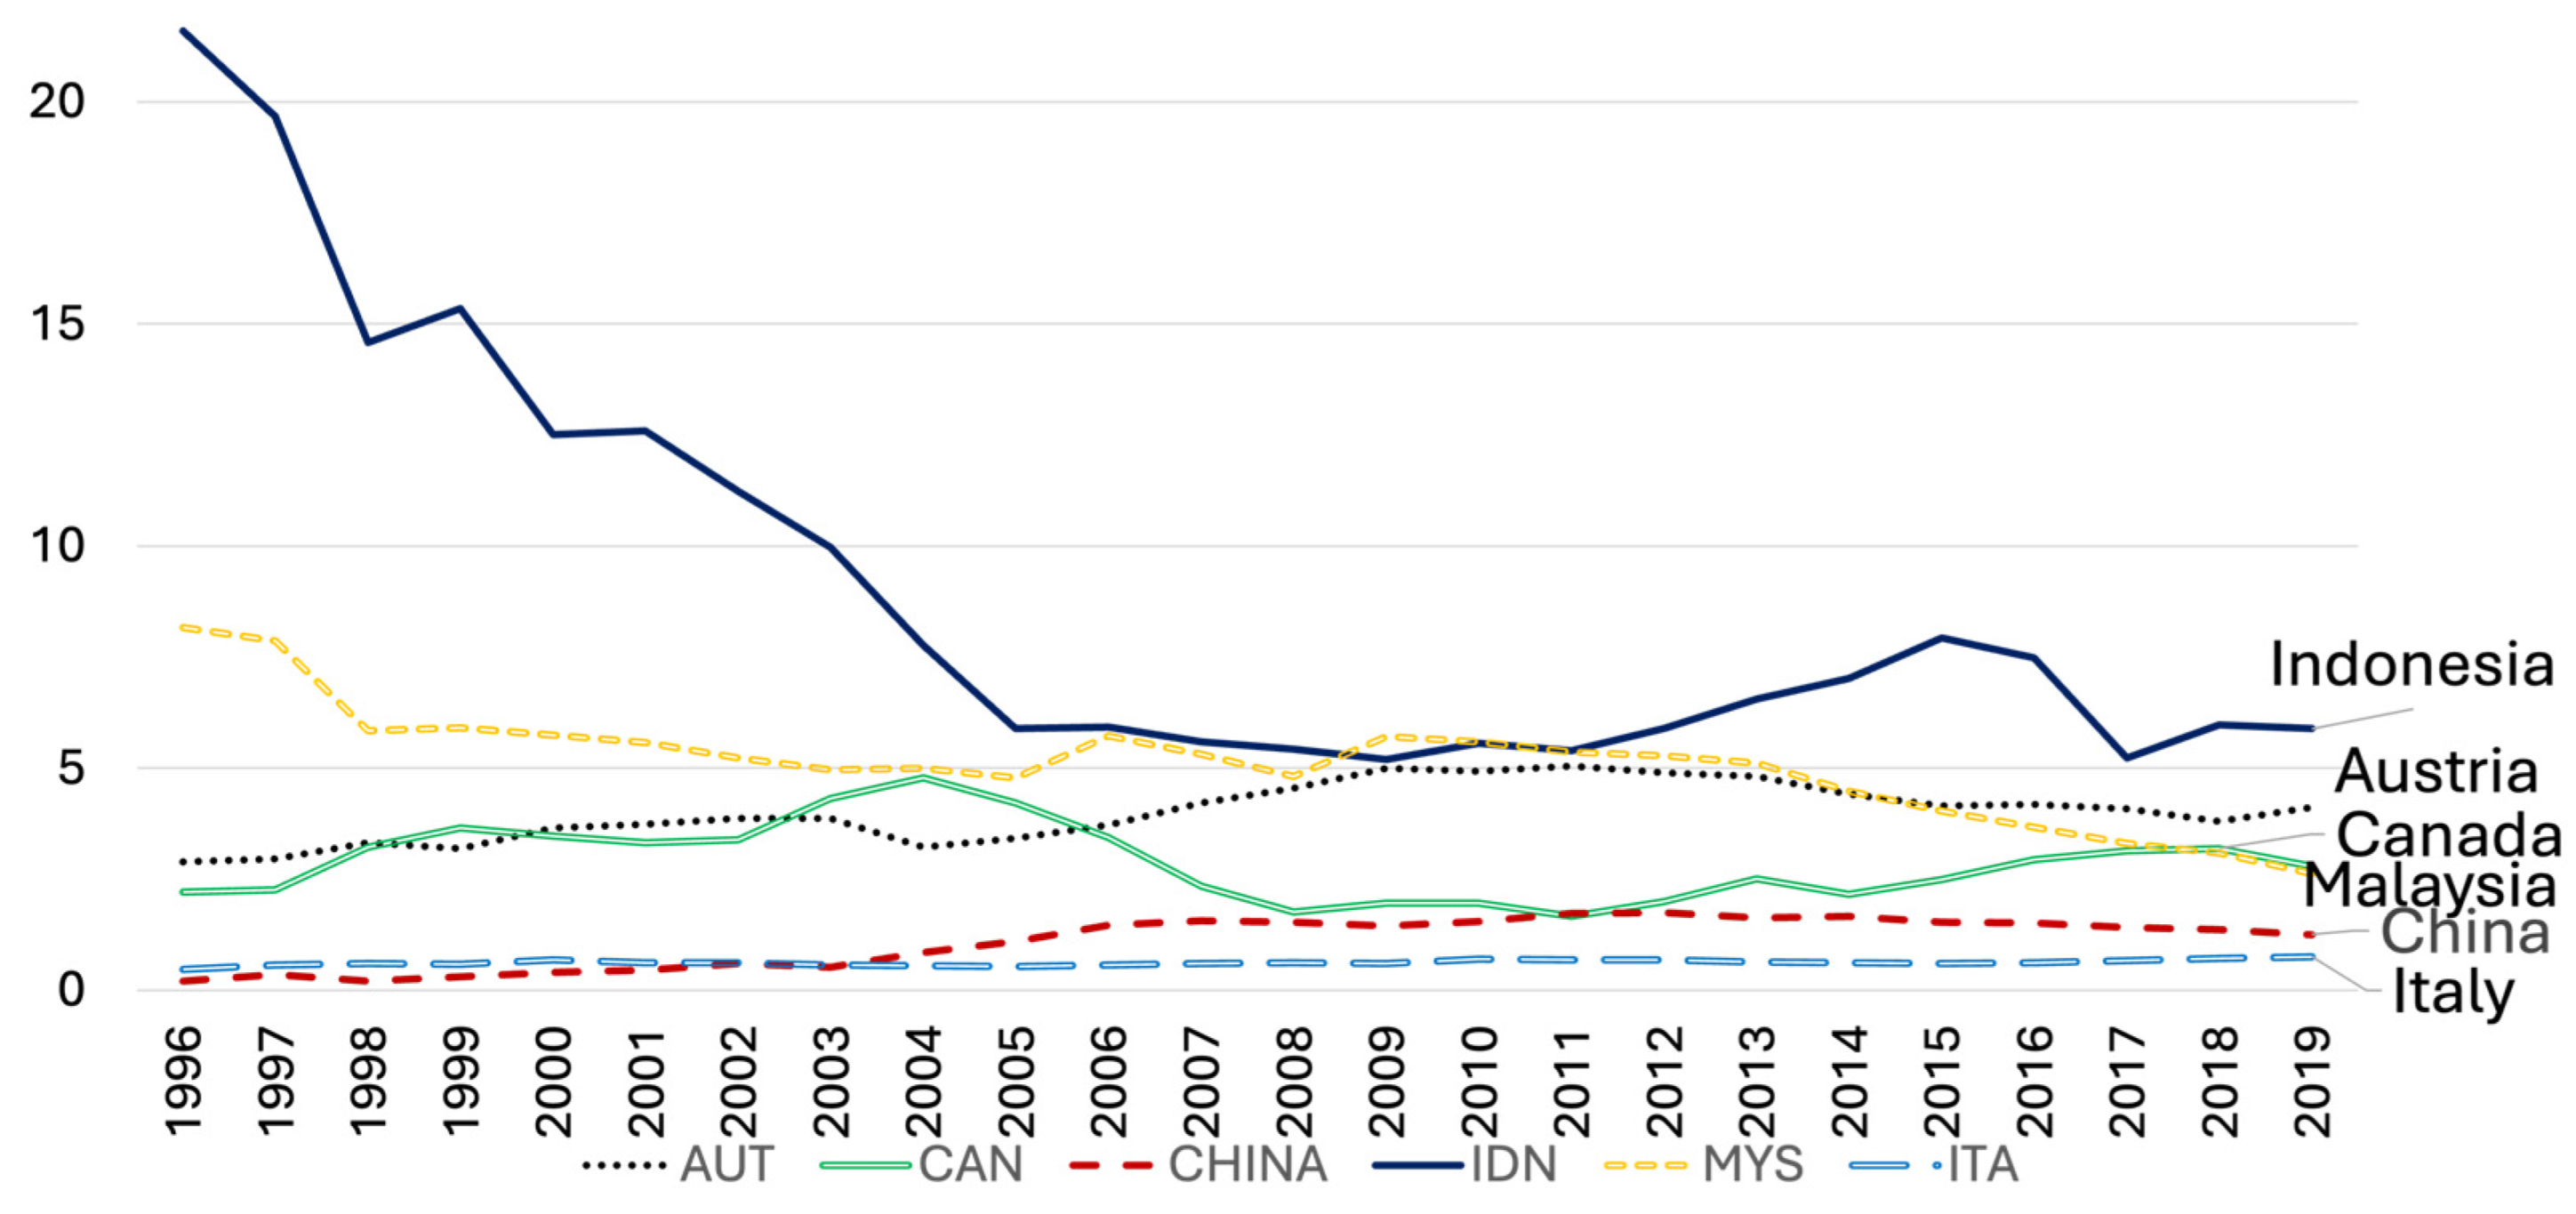
The import/export flow matrix shows what the main markets for the different exporting countries are (Table 6). As for furniture, the USA is among the main markets. Canada exports almost exclusively to the USA, as well as to the United Arab Emirates. For Asia, there are two things to highlight. First, China exports practically all over the world. The USA is its main market, but equally important, taken as a whole, are the other Asian and some Arab countries—Japan first and foremost. In Europe, Germany and Belgium import more from China. Second, Japan is a very important market for Asian countries: it absorbs 42% of the exports of Malaysia and 32% of Indonesia. For Europe, data reveal an important internal trade. Germany is in a true leading position. It exports almost exclusively towards European countries and, at the same time, absorbs most of the exports of others. France, The Netherlands, the UK, and Austria are the main countries that import from Germany, but no less important are Poland and Italy. On the other hand, Germany’s imports come mostly from Austria, Poland, Belgium, France, and even Italy. The German market absorbs 18% of Italian exports, 16% from France, and 8% from the US. China is an important market for Italy, absorbing 3% of its exports. The comparison of the trends of RCA indices of different countries enables us to gain a deeper understanding of the changes that have occurred. Despite the downward trends (Figure 7; Table S2 in the Supplementary Materials), Indonesia and Malaysia maintained extremely strong comparative advantages (5.7 and 3 as average values in 2017–2019, respectively) that explain their stable position in the world market. Austria, Canada, and Poland presented a strong advantage. China started from a position of weak disadvantage but, at the end of the period, revealed a moderate advantage (RCA = 1.3). Russia started from a weak position and reached a value greater then 2. Italy, although showing a slow improvement, presented a weak disadvantage, while Germany had a moderate advantage. Even for the panels, the calculation of the RSCA does not highlight changes in the relative positions of the countries, compared to what has already been highlighted using the Balassa RCA index tout court.
Table 6.
Trade in wood-based panels. Average values 2018–2019 (M of dollars).
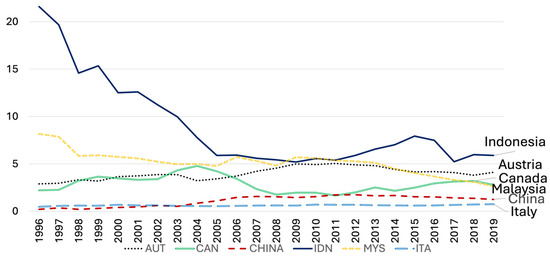
Figure 7.
Trends of RCA for wood-based panels in selected countries. Source: our calculations from COMTRADE data.
The trends of the TC (Table S2 in the Supplementary Materials) confirm the importance of Indonesia, Malaysia, Canada, and Austria as net exporting countries, the rise of China from being an importing country to a net exporter, and the position of Italy as a net importer. The trends of IIT indices help to better characterize the relative competitiveness positions (Table 7). In Europe, Italy and Germany have high IIT flows, and this explains the leading position of Germany, despite the low values of the Balassa RCA index. Already at the beginning of the period, the Grubel–Lloyd index for Germany had a value of 87%, for Italy it was 84%, and for Poland it was 93%. Germany, Poland, and Italy are the countries with higher IIT values at the international level. Regarding traditional Asian exporting countries, they consistently displayed the lowest levels of IIT, although these are increasing throughout the region. These trends, along with the high values of the RCA indices, confirm that IIT is more important for European and Western countries, typically high-income countries. They also confirm what has been underlined by other authors about the competitive nature of Asian countries, based mainly on low production costs, particularly on low labour costs [13]. However, the development dynamics of China and Russia have caused a decrease in their competitive positions. Furthermore, in the meantime, IIT flows have grown throughout Asia, although remaining at much lower levels than in Europe. Malaysia and Indonesia moved from a three-year IIT average of 5.9% and 1.5%, respectively, to averages of 49% and 14.5%.
Table 7.
Grubel–Lloyd indices for wood-based panels.
4. Discussion
Our findings confirm the results also highlighted by other authors about the significant changes in the competitiveness of the main exporting countries in the global market. The main outlet market has been confirmed to be the USA, while Italy, despite losing its market share and worsening its comparative advantages, is still one of the leading global exporters of furniture. For panels, Italy is confirmed as a net importer. Regarding other exporting countries, Canada and Germany continue to have a certain importance in the international market, but trade flows from Asian countries have significantly increased and intensified. China has become the leading exporting country in all product categories considered, and the importance of Vietnam and Malaysia has grown. Equally significant is the progress recorded by Russia and, in Europe, by Poland. These results suggest some considerations. First, the loss of importance of high-income countries compared to the low- and lower-middle-income countries in East and South-East Asia, Eastern Europe, and Latin America can be attributed to two different processes. Production and exports are occurring in countries close to each other and with lower labor costs, such as Poland and Turkey in Europe, and Mexico in relation to the U.S. In addition, there is a generalized transfer of production and exports from Western countries to South-East and East Asian countries due to the abundance of labor and low-cost raw materials [11,13]. At the same time, intra-industrial trade flows are intensifying among high-income countries, demonstrating their achievement of better positions in markets for higher value-added products. Italy, while maintaining an important position, suffers competition from Germany and Poland in Europe, and China, Vietnam, and Malaysia in Asia. As highlighted by Dieter and Englert [15], our results reveal that Germany continues to be a leading player in the global forest-industry sector and an important competitor of Italy in the European context. However, given the values of the RCA Balassa index, its competitiveness is not based on a particular specialization in wood products. This supports the assertion by some authors [30] that Germany’s position comes from policies that boost productivity, particularly labor productivity. Regarding Eastern European countries such as Poland and Asian countries, they benefit from lower production costs and a good endowment of forest resources. This is particularly significant for labor-intensive sectors, such as the wooden furniture and wood panel industries. Han et al. [13] affirmed that China transitioned from a comparative disadvantage to a high comparative advantage in the labor-intensive wooden furniture industry. Similarly, Chao et al. [14] found that Europe and America have fully developed their export potential, while markets with greater potential are mainly in Central and Eastern European countries. In contrast, the markets with pioneering potential are mainly in West Asian countries. Some countries, such as Vietnam, Malaysia, Cambodia, and Kenya belong to the “market with potential to shape”. These countries have rich forest resources and cheap labor on the supply side, and large domestic markets on the demand side. Once their domestic wood-processing production capacity scales up, they will impact China’s export of similar wood–forest products.
In a recent study, Algieri et al. [18] examined the patterns of comparative advantages in manufacturing between 2001 and 2019 for 91 products, including articles of wood and furniture classified as “human capital or skill or low-technology products”. Their findings suggest “the production of these goods occurs in countries with a relatively lower human capital or technology endowment since they have a low-human capital or technology intensity” (cfr. pag. 657). In other words, lower-wage countries have, on average, lower technology or human capital endowments, and have a comparative advantage in goods produced by workers paid with lower wages (cost competitiveness) (cfr. page 629). To avoid losing further market shares, Italy should probably invest in innovating its industrial structure, given the small size of its companies. Furthermore, logistics, transport, and marketing structures need to be intensified, while existing ones need to be modernized and supported by a network of modern services to facilitate small businesses in maintaining their international customers. The modernization of production structures is not separate from a strategic change in the use of raw materials. As recently highlighted by Koebel et al. [5], forest resource endowment is a significant determinant for explaining differences in the net trade of wooden products, including furniture. However, this variable is not sufficient to explain trade patterns of wood (finished) products. Industrial indicators like total factor productivity and average labor costs influence the trade performances of these products. The Italian forestry sector can provide a much greater contribution thanks to the exploitation of national wood production, currently underutilized. As demonstrated in a study conducted by Buongiorno et al. [33], also considering Italy, international trade may be an important part of the world’s forest economy. Nevertheless, there is a poor ability to use abundantly produced raw materials for the socio-economic development of large inland areas, especially located in Southern Italy. Perhaps some agro-forestry policy instruments, such as supply chain contracts, could boost changes. An additional impulse towards the creation of supply chains in which forest owners can have an active role through qualified management of plantations could come from the application of the rules contained in the 2018 law on forests and forestry supply chains. The growing competition in international markets can be overcome through the diffusion of a broad set of innovations, among which are those aimed at promoting the transition of the Italian forestry sector towards bio-based forestry supply chains. From this point of view, it is important to point out that, alongside the most frequent types of innovations, i.e., those for the development of new methods of production, new goods and services, and new sources of supply, the exploitation of new markets and organizational-level innovations are some of the key pathways for reaching the knowledge-based bio-economy. However, to date, and not only in Italy, knowledge and analysis of the factors underlying its development are lacking [34,35]. In any case, a policy framework to support innovation and investment in new technologies and production methods is essential, but it cannot ignore the knowledge of the production structure and the problems of private forest owners [36].
Given that the forestry sector is characterized by small private forest ownerships, wood mobilization is difficult due to the lack of interest of non-industrial forest owners in existing forest-wood chains. The formation of forest owner groups and the development of social networks may be some means for addressing fragmented ownership for the diffusion of knowledge and innovation [37,38]. The growing competition from emerging countries, above all from China, which has become the undisputed leader in the international market, can be countered only through policies that strengthen quality. As shown in the results of Luo et al. [31], the anti-dumping duties adopted by the United States against China in 2015 to limit the imports of wooden furniture have prompted many Chinese firms to improve their product quality, stimulating the evolution of the furniture industry worldwide and consequently benefiting all market participants in the long term. The quality of Italian furniture must be adequately supported by marketing campaigns that could also benefit from public support. As highlighted by Giovannetti et al. [39], there is a significant Chinese competitive effect on Italian exports, but this seems concentrated on traditional low-tech products, while traditional Made in Italy products with higher added value seem to resist this. Therefore, the shift of Italian specialization within sectors rather than between sectors seems to have protected Italian products from fiercer Chinese competition. Italy has moderately high and growing intra-industrial trade flows in the furniture sector, demonstrating competitiveness based also on product differentiation. Businesses must continue to invest in this path. Sustainable forest management certifications, such as those implemented by the Forest Stewardship Council and Program for Environment Forest Certification, could be a viable option for the wooden panels sector. Several studies have shown that consumers are increasingly interested in the sustainable behavior of businesses, from the production of raw materials to the final consumption goods [40,41,42,43].
5. Conclusions
The aim of this study was to evaluate the changes in the competitiveness of Italy in the global market for wood products, focusing particularly on wooden furniture and wood panels, the final and intermediate products of one of the most important forest-wood supply chains, that of wooden furniture. The results of the analysis contribute to the literature on forestry industry trade in several directions. First of all, despite Italy’s historical importance as an exporter of secondary processed-wood products, specific studies on Italy’s competitiveness in the international market are absolutely lacking. Therefore, we used several measures of competitiveness for a cross-country analysis to compare the competitiveness of Italian forest products with that of the main exporting countries on the global market. The comparison of the obtained results reveals significant changes in trends in Italy’s competitiveness in international trade. While Italy remains a key player in wooden furniture, it still presents a considerable weakness with regard to wood panels, although it is showing slow improvement.
Regarding wooden furniture, the results show that Germany is a strong competitor of Italy in the European market, while in extra-European markets Italy maintains a respectable position. Both in the panels and furniture sectors, the country faces increasing competition from countries with lower production costs and better resource endowments. These results allow us to gain a cognitive picture of Italy’s position in the international market and to fill a knowledge gap by providing specific information on the existence of comparative advantages and the importance of intra-industrial trade. This has never been done in other studies.
The findings underscore the need for Italy to innovate in the forestry production system following a holistic approach. The entire production structure, from agro-forestry farms to industrial companies producing higher-added-value products, such as wooden furniture, requires in-house and contextual innovations. Modernization of industrial structure, logistics, and marketing systems, and investments in high-quality production, are essential to maintain and increase the competitive edge.
For the rural development of marginalized areas in Italy, particularly in the south, these results have critical implications. As has been repeated several times, the Italian agro-forestry industry and the production of wood raw materials have been continuously growing. Despite this positive trend, Italy is characterized by a low use of national raw material, so it is a net importer of panels, a very important intermediate input for the wooden furniture and wood-construction supply chains. By leveraging underutilized national wood resources, rural areas can stimulate local economies and create job opportunities. Investing in agro-forestry policies, such as supply chain contracts, can foster the active participation of local forest owners and enhance sustainable forest management. Moreover, supporting small businesses with modern services and infrastructure can help them maintain and expand their international market presence. Ultimately, the strategic modernization of the wood industry, coupled with sustainable resource management and targeted policy support, can drive the socio-economic development of Italy’s marginalized rural areas, fostering growth and resilience in these communities.
While this study focuses on the period from 1996 to 2019, providing an extensive timeframe to analyze macro-trends affecting Italy’s competitiveness in the global wood products market, it has certain limitations. The exclusion of data post-2019 means that the impacts of the COVID-19 pandemic and the Russia–Ukraine war have not been considered. Future research should update the time series once robust data from 2023 onward become available. Moreover, while MS, RCA, RSCA, and TC indices are widely utilized, further research should employ more sophisticated and targeted methodologies to provide a comprehensive assessment of the sector’s competitiveness. As suggested by Algieri et al. [18], the Lafay Index and the Revealed Symmetric Augmented Comparative Advantage Index can control for intra-industry trade and re-export flows generated by the international fragmentation of production processes. These indices could offer a more detailed and accurate analysis of the wood-products sector’s competitiveness. Additionally, specific studies should investigate the factors influencing these changes in competitiveness. Further research could also suggest strategies that properly consider the variables most influencing trade flows in general, and intra-industrial flows in particular, which are increasingly important for generating trade in higher-added-value products between countries with similar levels of development. This would help to better understand the evolving trade dynamics and support the development of effective strategies to enhance Italy’s position in the global wood-products market.
Despite these limitations, the use of multiple descriptive indices, combined with intra-industry trade analysis, offers valuable insights into the complexity of trade relationships within the sector. Additionally, our cross-country comparison and the use of reliable data sources enhance the validity of our findings. Overall, this study contributes to a deeper understanding of Italy’s position in the international wood-products market and lays the groundwork for future research to further explore and address the evolving trade dynamics and challenges.
Supplementary Materials
The following supporting information can be downloaded at: https://www.mdpi.com/article/10.3390/f15081443/s1, Figure S1: Production and net imports of roundwood, sawnwood and firewood (MCM); Figure S2: Production and net import of particles board, fibers board, veneer sheets and plywood (MCM); Figure S3: Production and net import of cellulose pulp, paper and cardboard. (M of tons); Table S1: RCA, RSCA and TC of Italy and selected countries in the wooden furniture sector; Table S2: RCA, RSCA and TC of Italy and selected countries in the wood-based panel sector.
Author Contributions
Conceptualization, T.P., F.T. and M.T.G.; methodology, T.P.; software, F.T.; validation, T.P., F.T. and M.T.G.; formal analysis, T.P. and F.T.; investigation, T.P., M.T.G. and F.C.; resources, T.P. and F.C.; data curation, F.T.; writing—original draft preparation, T.P.; writing—review and editing, T.P. and F.C.; visualization, F.T.; supervision, T.P. and F.C.; project administration, T.P.; funding acquisition, T.P. and F.C. All authors have read and agreed to the published version of the manuscript.
Funding
This research received no external funding added.
Institutional Review Board Statement
Not applicable.
Data Availability Statement
Dataset available on request from the authors.
Conflicts of Interest
The authors declare no conflicts of interest.
References
- Fava, F.; Gardossi, L.; Brigidi, P.; Morone, P.; Carosi, D.A.; Lenzi, A. The Bioeconomy in Italy and the New National Strategy for a More Competitive and Sustainable Country. New Biotechnol. 2021, 61, 124–136. [Google Scholar] [CrossRef] [PubMed]
- Lawrence, A. Do interventions to mobilize wood lead to wood mobilization? A critical review of the links between policy aims and private forest owners’ behaviour. For. Int. J. For. Res. 2018, 91, 401–418. [Google Scholar] [CrossRef]
- Marchetti, M.; Motta, R.; Pettenella, D.; Sallustio, L.; Vacchiano, G. Forests and forest-wood system in Italy: Towards a new strategy to address local and global challenges. FOREST@ 2018, 15, 41–50. [Google Scholar] [CrossRef]
- Pettenella, D. L’Organizzazione Economica delle Imprese di Utilizzazione Boschiva. L’Italia For. E Mont. 2004, 59, 533–546. [Google Scholar]
- Koebel, B.M.; Levet, A.L.; Nguyen-Van, P.; Purohoo, I.; Guinard, L. Productivity, Resource Endowment and Trade Performance of the Wood Product Sector. J. For. Econ. 2016, 22, 24–35. [Google Scholar] [CrossRef]
- COMTRADE. Available online: https://comtrade.un.org/data (accessed on 6 October 2023).
- Březina, D.; Michal, J.; Hlaváčková, P. The impact of natural disturbances on the Central European timber market—An analytical study. Forests 2024, 15, 592. [Google Scholar] [CrossRef]
- Gordeev, R. Comparative advantages of Russian forest products on the global market. For. Policy Econ. 2020, 119, 102286. [Google Scholar] [CrossRef]
- Hashiramoto, O.; Castanois, J.; Johnson, S. Changing Global Picture of Trade in Wood Products. Unasylva 2004, 219, 19–26. [Google Scholar]
- Long, T.; Pan, H.; Dong, C.; Qin, T.; Ma, P. Exploring the Competitive Evolution of Global Wood Forest Product Trade Based on Complex Network Analysis. Phys. A 2019, 525, 1224–1232. [Google Scholar] [CrossRef]
- Liu, L.; Chen, Y.; Yu, J.; Cheng, R. Analysis of the Trade Network of Global Wood Forest Products and Its Evolution from 1995 to 2020. For. Prod. J. 2024, 74, 121–129. [Google Scholar] [CrossRef]
- Rossato, F.G.F.; Susaeta, A.; Adams, D.C.; Hidalgo, I.G.; de Araujo, T.D.; de Queiroz, A. Comparison of Revealed Comparative Advantage Indexes with Application to Trade Tendencies of Cellulose Production from Planted Forests in Brazil, Canada, China, Sweden, Finland and the United States. For. Policy Econ. 2018, 97, 59–66. [Google Scholar] [CrossRef]
- Han, X.; Wen, Y.; Kant, S. The Global Competitiveness of the Chinese Wooden Furniture Industry. For. Policy Econ. 2009, 11, 561–569. [Google Scholar] [CrossRef]
- Chao, Y.; Xi, L.; Weiming, S.; Hongwei, H. Export Potential of China’s Wood Forest Products under the Background of Dual Circulation Development Pattern. J. Beijing For. Univ. (Soc. Sci.) 2022, 21, 1–8. [Google Scholar]
- Dieter, M.; Englert, H. Competitiveness in the Global Forest Industry Sector: An Empirical Study with Special Emphasis on Germany. Eur. J. For. Res. 2007, 126, 401–412. [Google Scholar] [CrossRef]
- Paluš, H.; Parobek, J.; Liker, B. Trade Performance and Competitiveness of the Slovak Wood Processing Industry within the Visegrad Group Countries. Drv. Ind. 2015, 66, 195–203. [Google Scholar] [CrossRef]
- ISTAT. Rapporto sulla Competitività dei Settori Produttivi—Edizione 2023; Roma, Italy. 2023. Available online: https://www.istat.it/comunicato-stampa/competitivita-dei-settori-produttivi-edizione-2023/ (accessed on 6 October 2023).
- Algieri, B.; Aquino, A.; Succurro, M. Trade Specialisation and Changing Patterns of Comparative Advantages in Manufactured Goods. Ital. Econ. J. 2022, 8, 607–667. [Google Scholar] [CrossRef]
- Hillring, B. World Trade in Forest Products and Wood Fuel. Biomass Bioenergy 2006, 30, 815–825. [Google Scholar] [CrossRef]
- Annicchiarico, B.; Quintieri, B. Measurement of Intra-Industry Trade: Where Do We Stand? An Analysis of Italian Trade Data. In Il Commercio con l’Estero e la Collocazione Internazionale dell’Economia Italiana; Banca di Italia: Roma, Italy, 2003. [Google Scholar]
- Borin, A.; Lamieri, M. Misurare la Qualità dei Beni nel Commercio Internazionale. In Eppur Si Muove. Come Cambia l’Export Italiano; Rubbettino: Soveria Mannelli, Italy, 2007. [Google Scholar]
- Fitzgerald, D.; Hallak, J.C. Specialization, Factor Accumulation and Development. J. Int. Econ. 2004, 64, 277–302. [Google Scholar] [CrossRef]
- Balassa, B. Trade Liberalisation and “Revealed” Comparative Advantage. Manch. Sch. 1965, 33, 99–123. [Google Scholar] [CrossRef]
- Dalum, B.; Laursen, K.; Villumsen, G. Structural Change in OECD Export Specialisation Patterns: De-Specialisation and ‘Stickiness’. Int. Rev. Appl. Econ. 1998, 12, 423–443. [Google Scholar] [CrossRef]
- Grubel, H.G.; Lloyd, D.J. Intra-Industry Trade, the Theory and Measurement of International Trade in Differentiated Products; Macmillan: London, UK, 1975. [Google Scholar]
- Gasparini, P.; Di Cosmo, L.; Floris, A.; De Laurentis, D. Italian National Forest Inventory—Methods and Results of the Third Survey: Inventario Nazionale delle Foreste e dei Serbatoi Forestali di Carbonio—Metodi e Risultati della Terza Indagine; Springer Nature: New York, NY, USA, 2022; p. 576. [Google Scholar]
- INFCI_85. Available online: https://www.sian.it/inventarioforestale/ (accessed on 21 November 2023).
- CREA. Annuario dell’Agricoltura Italiana, 2019; CREA: Rome, Italy, 2021. [Google Scholar]
- FAO. Available online: http://www.fao.org/faostat/en/#data/FO (accessed on 3 October 2021).
- Viesti, G. Centri e Periferie: Europa, Italia, Mezzogiorno dal XX al XXI Secolo; Gius. Laterza & Figli S.p.a: Roma, Italy, 2021. [Google Scholar]
- Luo, X.; Sun, C.; Jiang, H.; Zhang, Y.; Meng, Q. International Trade after Intervention: The Case of Bedroom Furniture. For. Policy Econ. 2015, 50, 180–191. [Google Scholar] [CrossRef]
- Fontagné, L.; Freudenberg, M. Intra-Industry Trade: Methodological Issues Reconsidered; Cepii: Paris, France, 1997; Volume 97, No. 1. [Google Scholar]
- Buongiorno, J.; Johnston, C.; Zhu, S. An Assessment of Gains and Losses from International Trade in the Forest Sector. For. Policy Econ. 2017, 80, 209–217. [Google Scholar] [CrossRef]
- Lovrić, N.; Lovrić, M.; Mavsar, R. Factors behind development of innovations in European forest-based bioeconomy. For. Policy Econ. 2020, 111, 102079. [Google Scholar] [CrossRef]
- Weiss, G.; Ludvig, A.; Živojinović, I. Four decades of innovation research in forestry and the forest-based industries–a systematic literature review. For. Policy Econ. 2020, 120, 102288. [Google Scholar] [CrossRef]
- Ladu, L.; Imbert, E.; Quitzow, R.; Morone, P. The role of the policy mix in the transition toward a circular forest bioeconomy. For. Policy Econ. 2020, 110, 101937. [Google Scholar] [CrossRef]
- Stoettner, E.M.; Dhubháin, Á.N. The social networks of Irish private forest owners: An exploratory study. For. Policy Econ. 2019, 99, 68–76. [Google Scholar] [CrossRef]
- Arnould, M.; Morel, L.; Fournier, M. Embedding non-industrial private forest owners in forest policy and bioeconomy issues using a Living Lab concept. For. Policy Econ. 2022, 139, 102716. [Google Scholar] [CrossRef]
- Giovannetti, G.; Sanfilippo, M.; Velucchi, M. The “China Effect” on Italian Exports. Econ. Chang. Restruct. 2011, 44, 89–116. [Google Scholar]
- Panico, T.; Pagnani, T.; Caracciolo, F. Intention to Purchase Sustainable Wood Products: An Empirical Analysis of the Determinants. Int. J. Food Syst. Dyn. 2018, 9, 342–353. [Google Scholar]
- Panico, T.; Caracciolo, F.; Furno, M. Analysing the Consumer Purchasing Behaviour for Certified Wood Products in Italy. For. Policy Econ. 2022, 136, 102670. [Google Scholar] [CrossRef]
- Zanchini, R.; Blanc, S.; Pippinato, L.; Poratelli, F.; Bruzzese, S.; Brun, F. Enhancing Wood Products through ENplus, FSC and PEFC Certifications: Which Attributes Do Consumers Value the Most? For. Policy Econ. 2022, 142, 102782. [Google Scholar] [CrossRef]
- O’Brien, K.A.; Teisl, M.F. Eco-Information and Its Effect on Consumer Values for Environmentally Certified Forest Products. J. For. Econ. 2004, 10, 75–96. [Google Scholar] [CrossRef]


Disclaimer/Publisher’s Note: The statements, opinions and data contained in all publications are solely those of the individual author(s) and contributor(s) and not of MDPI and/or the editor(s). MDPI and/or the editor(s) disclaim responsibility for any injury to people or property resulting from any ideas, methods, instructions or products referred to in the content. |
© 2024 by the authors. Licensee MDPI, Basel, Switzerland. This article is an open access article distributed under the terms and conditions of the Creative Commons Attribution (CC BY) license (https://creativecommons.org/licenses/by/4.0/).