Article

Is It Possible to Predict a Forest Insect Outbreak? Backtesting Using Remote Sensing Data

1
Center of Forest Ecology and Productivity, Russian Academy of Sciences, 117997 Moscow, Russia
2
Institute of Systematics and Ecology of Animals, Siberian Branch of Russian Academy of Sciences, 630091 Novosibirsk, Russia
3
Department of Ecology and Nature Management, Siberian Federal University, 660041 Krasnoyarsk, Russia
4
V.N. Sukachev Institute of Forest, Siberian Branch of Russian Academy of Sciences, 660036 Krasnoyarsk, Russia
5
Institute of Biophysics, Siberian Branch of Russian Academy of Sciences, 660036 Krasnoyarsk, Russia
*
Author to whom correspondence should be addressed.
Forests 2024, 15(8), 1458; https://doi.org/10.3390/f15081458
Submission received: 15 July 2024 / Revised: 8 August 2024 / Accepted: 14 August 2024 / Published: 19 August 2024
(This article belongs to the Special Issue Risk Assessment and Management of Forest Pest Outbreaks)

Abstract

:
In this study, methods are proposed for analyzing the susceptibility of forest stands to attacks by forest insects on the basis of Earth remote sensing data. As an indicator of the state of forest stands, we proposed to use a parameter of the sensitivity of a vegetation index (normalized difference vegetation index; NDVI) during a vegetative period to changes in the radiative temperature of the territory (land surface temperature; LST) determined from satellite data of the Terra/Aqua system. The indicator was calculated as a spectrum of a response function in an integral equation linking changes of NDVI to those of LST. Backtesting was carried out using data from two outbreaks of the Siberian silk moth Dendrolimus sibiricus Tschetv. and outbreaks of the white mottled sawyer Monochamus urussovi Fischer and of the four-eyed fir bark beetle Polygraphus proximus Blandford in taiga forests of Krasnoyarsk Territory in Russia. In addition, the state of fir stands in the year 2023 was examined when damage to the forest stands was not yet noticeable, but Siberian silk moth adults were found in pheromone traps. It was shown that the proposed indicator of susceptibility of forest stands changed significantly 2–3 years before the pest outbreak in outbreak foci of the studied areas. Thus, the proposed indicator can be used to predict outbreaks of insect pests. The proposed approach differs from commonly used remote sensing methods in that, rather than using absolute values of remote indicators (such as, for example, NDVI), it focuses on indicators of the susceptibility of these remote indicators to the characteristics of the natural environment. Since any given point on the planet is characterized by a seasonally varying temperature, it is always possible to determine the sensitivity of a remote sensing indicator to changes in the environment that are not directly related to the absolute value of the indicator. Future studies are expected to examine susceptibility indices as a function of forest stand location and species, and to examine the length of spatial correlation of susceptibility indices, which may provide information on the possible extent of future insect outbreaks.

1. Introduction

One of the main causes of weakening and death of forest stands is insect population outbreaks. Significant economic and ecological losses associated with the drying and death of forests under the influence of insects make it extremely important to assess the sustainability of forest stands under insect attacks and to predict the situation for the near future.
Outbreaks of forest insect pests have been identified in all major forest ecosystems [1,2,3]. Economic damage due to widespread and massive tree mortality is most significant in high latitude forests [4,5,6]. It is estimated that over a 10-year period, 2002–2012, more than 70 million ha of boreal and temperate forests worldwide were attacked by forest insect pests [7]. During the last decade, extreme insect outbreaks [8] have been observed in many forest types across the Northern Hemisphere for both defoliators and bark beetles, which typically cause the greatest damage worldwide [1]. Outbreaks of numerous bark beetle species (mainly Dendroctonus spp., Ips spp., and Scolytus spp.) have affected historically unprecedented spatial scales of forests throughout western North America and Europe [6,9,10].
An additional factor contributing to the development of outbreaks is the effects associated with climate change [11,12,13,14,15,16]. The impact of outbreaks on wood losses is extremely high. For example, it has been estimated that timber losses due to forest insects in an area of 2.4 million ha in eastern Canada totaled between CAD 25 and 35 billion [17]. It can be assumed that predicting outbreaks and increasing forest resilience should be a central goal of forest pest management [18,19,20]. Research on modelling and predicting forest susceptibility and vulnerability, as well as the development of decision support tools for forest protection tasks, is needed to identify plantations at risk from insects [8,21,22].
Nonetheless, ground-based surveys of pests’ abundance and risk assessments of insect population outbreak in forests of Siberia on the basis of current density of pest populations are extremely difficult due to the vast area of Siberian forests (up to 2.5 million km2) and inaccessibility of many forest areas. Visual signs of tree weakening (deteriorated crown condition and damage to trunks)—that can be determined using unmanned aerial vehicles—appear at later stages of the damage, when it is almost impossible to manage the condition of these forest stands and to reduce the abundance of pests.
The only real way to assess the condition of forest stands in large areas (e.g., taiga) is to use remote sensing data from satellites. Currently, such analyses are employed mainly to quantify the damage caused by insects. In this context, one of the main techniques for such an analysis is the measurement of various versions of a vegetation index that is based on a difference in reflection between red and near-infrared radiation [23]. The NDVI (Normalized Difference Vegetation Index) allows researchers to assess the productivity and physiological characteristics of the vegetation component of an ecosystem [24,25] and is a spectral indicator of photosynthesis and of plant metabolic rate [26,27]. When studying the dynamics of vegetation cover indicators, both intra- and inter-annual changes associated with climate variability are considered [28]. Remote sensing data are widely used to map spatial dynamics of full-on insect outbreaks [29,30,31]. The main purpose of such surveys is to assess the damage caused by the outbreak and to calculate the area affected. Such an indicator reliably and quickly shows the degradation of the tree crown during the progression of the outbreak. On the other hand, the weakening of trees and a decrease in the intensity of protective reactions and in trees’ resistance to an insect attack tend to progress for several years before the start of a sharp increase in pest abundance but cannot be detected by means of NDVIs; attempts to use remote sensing data to assess the resistance of forest stands to external factors have not been successful [32,33,34].
Nonetheless, the development of methods for insect resistance evaluation in trees beforehand is necessary because it is important to identify areas of future insect outbreaks at least one or two seasons before the onset of the damage. Such information can improve predictions of future effects and allow the design of effective preventive measures ahead of time in order to reduce losses in forest stands. In this paper, we examine the possible usefulness of an original method for processing remote sensing data to predict zones of insect population outbreaks in Siberian forests.

2. Materials and Methods

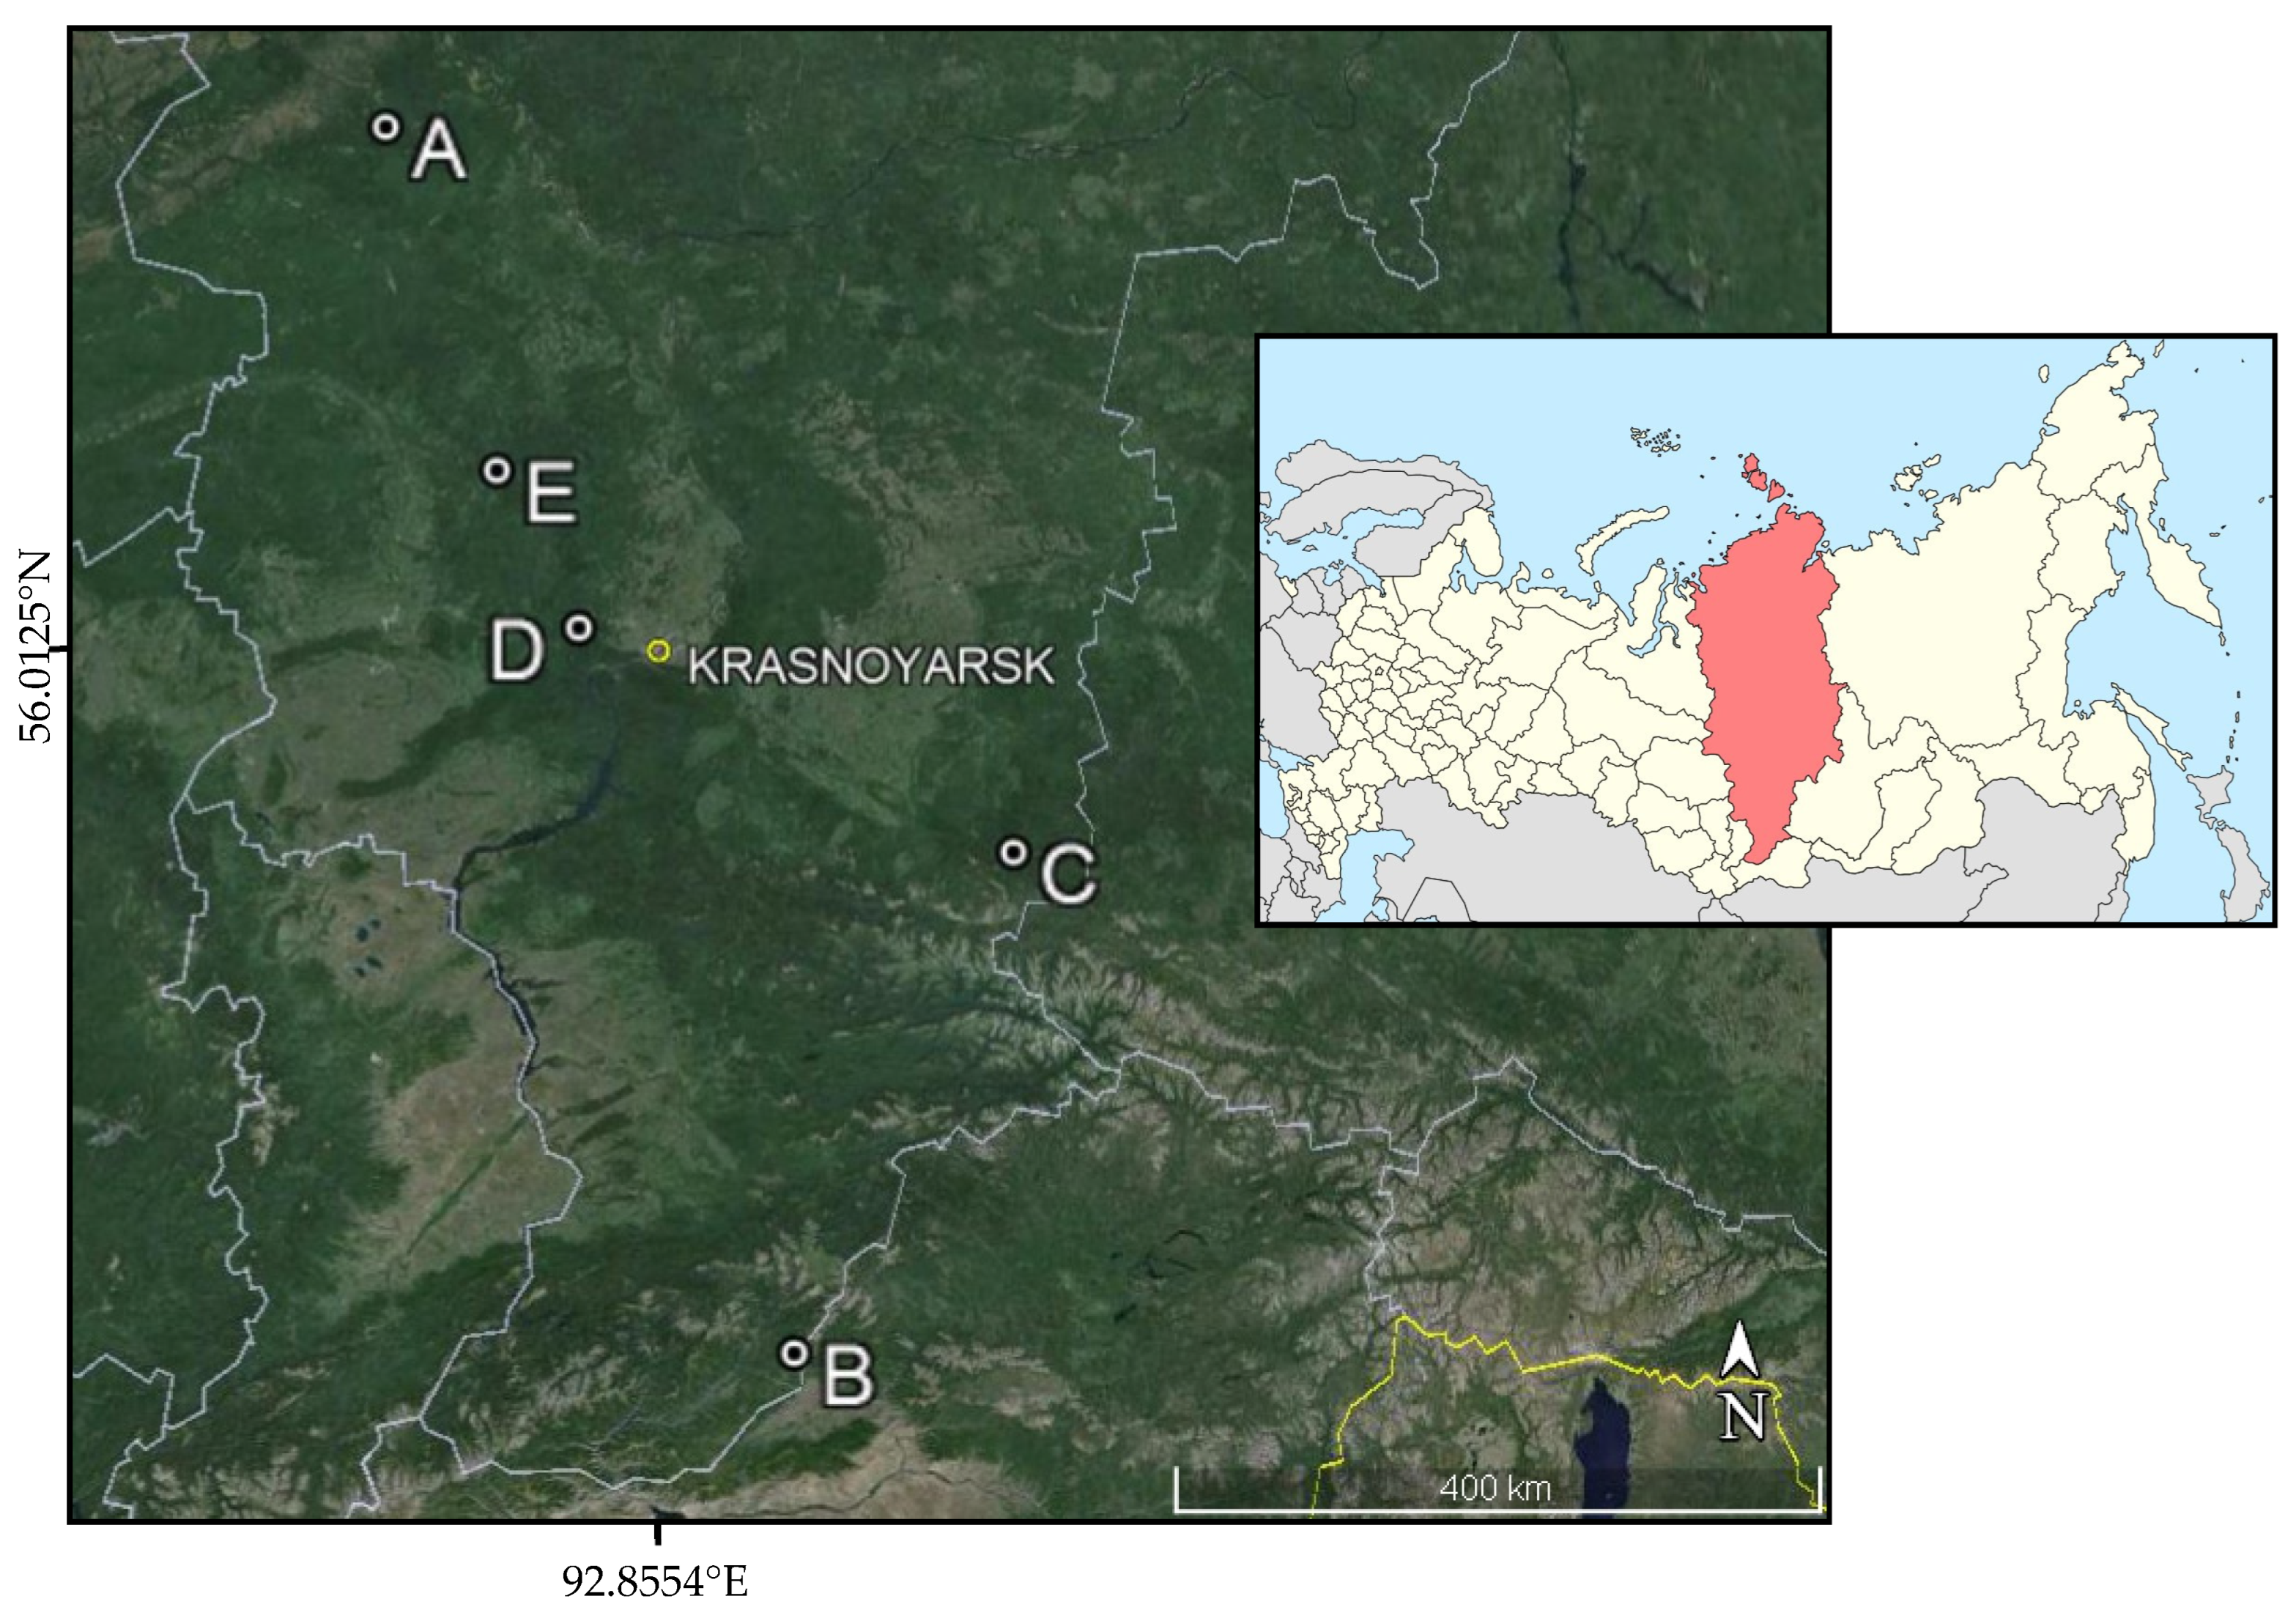
2.1. Field Study Locations and Characterization of the Study Areas

In this retrospective analysis, four foci of past outbreaks of forest insects were investigated, as was one potential outbreak site in Krasnoyarsk Territory in the East Part of Russia (Figure 1).
Outbreaks of the following forest insect species were analyzed: Dendrolimus sibiricus Tschetv., Monochamus urussovi Fisch., and Polygraphus proximus Blandford.
(1)
The Siberian silk moth D. sibiricus is a large butterfly with a wingspan of 60–80 mm in the female and 40–60 mm in the male. Its color varies from light yellowish brown or light gray to almost black. Females lay eggs on needles of coniferous trees, mainly in the lower part of the crown. In one clutch, there are usually several dozen eggs (up to 200), and in total, a female can lay up to 800 eggs; however, most often, the fertility does not exceed 200–300 eggs. The caterpillars feed on needles of almost all coniferous species but prefer fir Abies sibirica Ledeb, spruce Picea obovata Ledeb., and larch Larix sibirica Ldb. [35,36,37].
(2)
The white mottled sawyer M. urussovi is a large beetle with a black body and appendages and with brighter yellowish apices of the elytra. It lives within the geographic range of dark coniferous forests and prefers A. sibirica and P. obovata. It is one of the most formidable pests that cause considerable damage to coniferous forests of Siberia. Its larvae develop under the bark and in the wood of coniferous trees for 2, or less often, 3 years, although under favorable conditions, they can go through the developmental cycle within 1 year. Within their geographic range, these beetles inhabit coniferous, less often mixed, forests dominated by fir A. sibirica and/or spruce P. obovata as well as in the cutting areas and coniferous stands that are damaged by D. sibiricus and Lymantria dispar L. M. urussovi also occurs in mountain coniferous forests, usually at an altitude of up to 2000 m above sea level. There are known outbreaks of M. urussovi covering territories of tens and hundreds of thousands of hectares that have led to massive suppression of fir forests [38,39].
(3)
The four-eyed fir bark beetle (P. proximus Blandford) is a species of bark beetle. It is a dangerous invasive dendrophagous pest of fir A. sibirica. The penetration of P. proximus into taiga ecosystems of Siberia and the formation of P. proximus outbreak foci in them represent the only known case of large-scale insect invasion in this territory today. It damages A. sibirica, and less often, P. obovata and P. sibirica. P. proximus is one of the main causes of the recent large-scale drying out of Siberian fir forests. In zones of outbreak of these beetles, there is a decrease in the productivity of dark coniferous forests [40,41,42].
Our study was fielded in factual pest foci A, B, C and D and in potential foci E (Figure 1).
Focus A: Remote sensing data of taiga fir stands in the D. sibiricus outbreak center in the area of Yenisei and North-Yenisei distr. of Krasnoyarsk Territory (58.72° N, 90.42° E) were analyzed. This outbreak occurred in the years 2015–2017. During the outbreak, the pest damaged and killed ~1 million hectares of the forest. In the outbreak focus, 250 × 250 m plots damaged by Siberian silk moth caterpillars since 2015 and neighbouring undamaged plots were analysed.
Focus B: The year 2013’s outbreak focus of the white mottled sawyer M. urussovi in fir stands of the mountain taiga forests in the south of the Yermakovsky distr. of Krasnoyarsk Territory (52.41° N, 93.58° E) was analyzed. The sample plots were located in damaged forest stands on two adjacent mountain slopes; the nearest slopes with undamaged forest stands served as a control.
Focus C: An outbreak focus of the Siberian silk moth in the southeast Yerbei distr. of Krasnoyarsk Territory was examined (54.85° N, 95.81° E). The main food species for D. sibiricus in this region are fir A. sibirica Ledeb. and Siberian pine P. sibirica Du Tour. A small proportion of trees in these forest stands is represented by Scots pine P. sylvestris L., 1753, and larch L. sibirica Ledeb., 1833. The forest stands also include deciduous species (Betula pendula Roth, 1788, and Populus tremula L., 1753), which are not food species for D. sibiricus.
Focus D: An outbreak focus of the four-eyed fir bark beetle (56.17° N, 92.20° E) was assessed in a fir-pine forest near 13 Fighters’ Memorial Village in the Yemelyanovsky distr. of Krasnoyarsk Territory: forest stands measuring approximately 800 × 800 m in the outbreak focus of P. proximus. Trees in the outbreak zone were not damaged in 2007–2010; the outbreak occurred in 2014, and the forest stand was cut down in 2015.
Focus E: In the year 2023, on the territory of the Birilyussky distr. of Krasnoyarsk Territory (57.00° N, 91.52° E), in pheromone traps, adult individuals of D. sibiricus were found in small numbers. This find raised the question of a pending outbreak of this pest developing in this zone. To estimate the susceptibility of fir stands in this area, remote sensing was performed on 10 selected sample plots measuring 250 × 250 m. Five sample plots in zone E1 were chosen directly at the site where pheromone traps were placed, and five other sample plots in zone E2, at a distance of ~5 km from the pheromone-monitoring site.

2.2. Methods

In this work, an attempt was made to switch from quantitative measurements of plant biomass based on absolute values of NDVI to assessment of a response of the photosynthetic apparatus to changes in environmental conditions. The input and output parameters for such a model can be obtained simultaneously from remote sensing data and can be synchronized by time and location of observation.
Today, there are satellite complexes by means of which it is possible to obtain real-time data on environmental properties in a small area. When such a system is being chosen, the key points to consider are the periodicity (frequency) of acquisition of remote sensing data, sufficient spatial resolution, and availability of the necessary spectral channels of data transmission. In this work, satellite complex Terra/Aqua operating within the framework of the NASA Earth Observing System program was chosen [43]. The presence of two data set which are similar in structure from the Terra and Aqua satellites allows to significantly reduce the level of interference caused by clouds. Raw remote sensing data from the Terra/Aqua satellites are available for free download from the NASA server. On these satellites, the main instrument for collecting the necessary information is a MODIS (moderate-resolution imaging spectroradiometer).
In this paper, as an indicator of the state of forest stands, we proposed to use a parameter of the sensitivity of the vegetation index (NDVI) during a season to changes in the radiative temperature of a territory (land surface temperature; LST).
The following products of the Terra/Aqua system were used for the analysis:
-
Products MOD11A1 and MYD11A1, Land surface temperature LST. This parameter correlates well with meteorological observations of air temperature. The observations of the parameter are daily, and spatial resolution is 1 × 1 km.
-
Initial red and near infrared spectral channels for calculating the NDVI vegetation index contained in products MOD09Q1 and MYD09Q1. These are an 8-day composite (cleaned and sampled data for a period of 8 days) and the spatial resolution is 250 × 250 m.
NDVIs are successfully used for various assessments of the state and changes in vegetation cover because NDVI values are related to photosynthetically active radiation. In this work, NDVI was computed using the standard formula:
N D V I = N I R R E D N I R + R E D
where NIR and RED are normalized values of reflection intensity in the near-infrared and red spectral ranges for a given square on Earth’s surface.
Given that the growth and condition of a tree crown considerably depend on changes in ambient temperature, an analysis of relations between NDVI and LST should allow us to assess the adaptive resource of trees in a forest stand. Seasonal dynamics NDVI(t) and LST(t) featured the presence of a nonmonotonic nonlinear trend (Figure 2 and Figure 3).
Strong fluctuations of NDVI values in coniferous forests during a snowy period (January–March and October–December) are associated with snowfall and with the blowing away of snow by the wind, with consequent possibility of analysis of needles. These fluctuations are not related to changes in the state of the needles, and therefore these segments of the seasonal series of NDVI dynamics (and hence of LST too) were removed from the analysis.
To analyze and work with stationary time series of satellite data, the series of nonmonotonic variables NDVI and LST were transformed into series of first-order differences Δ N D V I ( t ) = N D V I ( t ) N D V I ( t 1 ) and Δ L S T ( t ) = L S T ( t ) L S T ( t 1 ) .
The NDVI variation can be thought of as a function of changes in weather conditions; for a given year, changes in LST values can be regarded as input to the system, and changes in NDVI values as output. Upon relations of ΔNDVI to ΔLST, one can impose a natural condition of causality: ΔNDVI(t) at moment t will depend only on the values of ΔLST(t − τ) at past time points (t − τ). Then, the relations between these parameters can be specified, and an integral equation can be introduced
Δ N D V I ( t ) = 0 t h ( τ ) Δ L S T ( t τ )   d τ
where h(τ) is the kernel of Equation (1) (response function). Function h(τ) characterizes relations between the remote sensing parameters under study and a delay in the response of the output variable to changes in the input variable. Because time series of ΔNDVI(t) and ΔLST(t) are known from remote sensing data, solving the inverse problem of the integral equation gives us a function characterizing a response of a forest stand to external factors. NDVI and LST values can be estimated for any point on the planet using remote sensing data, and this means that by solving Equation (2), one can obtain a response function of seasonal dynamics for any forest stand.
There are various ways of solving integral Equation (2) [44,45,46,47]. As an example to account for the potential delayed response of NDVI response to changes in LST, cross-correlation function Φyx was analyzed here, which links ΔNDVI(t) to ΔLST(t) [48]:
Φ y x = E Δ L S T ( t τ ) Δ N D V I ( τ ) = E 0 t h ( τ ) x ( t τ ) x ( t ) d τ
where E is an expectation operator, y is ΔNDVI, and x is ΔLST.
Because the operations of mathematical expectation E and linear transformation F can be rearranged, we can write
E 0 t h ( τ ) x ( t τ ) x ( t ) d τ = 0 t h ( τ ) E x ( t ) x ( t τ ) d τ = 0 t h ( τ ) Φ x x d τ
where h(τ) is the response function, and Φxx is the autocorrelation function of ΔLST.
Then, from Equations (3) and (4), we obtain
Φ y x = 0 t h ( τ ) Φ x x d τ
Because time series of ΔNDVI and ΔLST during a season are known, cross- and autocorrelation functions are uniquely calculated from their values, and in Equation (5), only integral core function (response function) h(τ) is unknown, which characterizes sensitivity ΔNDVI to change ΔLST.
To find the response function, we perform a Fourier transform FT of the left and right sides of Equation (5):
F T ( Φ y x ) = F T ( 0 t h ( τ ) Φ x x d τ ) = F T ( h ( τ ) F T ( Φ x x ) = H ( f ) F T ( Φ x x )
where H(f) = FT(h(Iτ)).
From Equation (6), one can find spectrum H(f) of the response function:
H ( f ) = F T ( Φ y x ) F T ( Φ x x )
The resulting spectral function H(f) characterizes the speed and intensity of a response of the photosynthetic apparatus’ state in a forest stand to the influence of weather. Typical response function spectrum H(f) is presented in Figure 4.
The value of the kernel H(f) of the integral equation at a certain frequency makes it possible to find the change in NDVI in response to a change in LST. The low-frequency component of the H(f) spectrum at frequencies close to 0 describes the slow response of NDVI to LST changes. The high-frequency component of the H(f) spectrum at frequencies close to f = 0.5 describes the fast response of NDVI to LST effects.
The spectral power of the response function for a current season t is described by the following equation:
S ( t ) = 0 0.5 H ( f , t ) d f
The spectral function H(f) for a single season is shown in Figure 4. In the following analysis, for simplification, relative-power values in a low-frequency component (LF) (0 < f < 0.16 days−1) and in a high-frequency component (HF) (0.35 < f < 0.5 days−1) of response function spectrum H(f) are used:
L F ( t ) = 0 0.16 H ( f , t ) d f S ( t ) ;   H F ( t ) = 0.35 0.50 H ( f , t ) d f S ( t )
Pairs of values (LF, HF) were compared between damaged and control stands.
Our custom-designed software was used to automatically compute a response function spectrum during a season. The software is a stand-alone shell executed in the Windows operating system. Time series of parameters NDVI and LST were entered into the software as input data. Preprocessing of data required correction of possible errors—and correction of meteorological interference (cloudiness and other phenomena) with the observation—by a smoothing method based on neighboring values. The software also removes from the calculation the winter observations that are not related to a growing season. The calculation result is presented as a set of discrete values of response function spectrum H(f) in the frequency range f = 0–0.5 days−1 for each year of observation. Next, from these data, relative values of low- and high-frequency components LF(t) and HF(t) of the response function spectrum were calculated.

2.3. Data Collection

Extraction of desired parameters for selected coordinates from raw remote sensing data is a technically complicated problem of geographic-information systems. For selected products, there is a server software solution called Application for Extracting and Exploring Analysis Ready Samples (AppEEARS, The U.S. Geological Survey, Reston, VA, USA) [49]. As part of a query to the database, an investigator should specify the type of product used (initial or calculated parameter), a set of coordinates of observation sites, and a time period. The result is also generated on the NASA server and can be downloaded as a text file.
Seasonal data on NDVI and LST in the 2009–2019 period were collected from seven damaged sample plots and eight control (undamaged) sample plots for the territory in outbreak focus A damaged by the Siberian silk moth in the year 2015. To increase the accuracy of measurements, six plots were analyzed in each 250 × 250 m area, which corresponds to minimum spatial resolution of the AQUA/MODIS system for the selected spectral channels. In the white mottled sawyer outbreak focus from the year 2013, parameters were measured on 16 sample plots and 16 control plots. In the outbreak focus of the Siberian silk moth in the Irbeysky District, remote sensing parameters were assessed for the 2014–2020 period. In the outbreak focus of the four-eyed fir bark beetle, the analysis began with an assessment of the extent of damage to tree crowns by the insect on the sample plots. For this purpose, total NDVI values (photosynthetic indices) during a season were calculated for the damaged and control sample plots:
S N D V I = 1 t c t 9 t 0 t c N D V I ( t ) d t
where t0 and tc are selected start and end dates of the growing season.

3. Results

When needles were damaged by phyllophages and when the condition of the needles deteriorated after the cambium of tree trunks was damaged by xylophages, NDVI values of forest stands changed from 0.6–0.7 to 0.4–0.5. Figure 5 shows typical NDVI values for damaged and control (undamaged) forest stands.
As illustrated in Figure 5, prior to the outbreak in 2015, there were no discernible differences in NDVI between trees in future outbreak focus areas and trees in control, undamaged stands. It was only after the needles were impacted by the pest that such differences emerged. Therefore, based on SNDVI values derived from Equation (10), it is not appropriate to make an assessment of the risk of insect attacks on forest stands in advance.
Next, we examined the potential usefulness of relative-power values of the response function spectrum within ranges of LF and HF (Equation (9)) for risk assessment ahead of time regarding a pest attack on forest stands.
Figure 6 shows average values of components LF and HF in different years for all stands damaged by Siberian silk moths in outbreak focus A and on control plots.
In Figure 6, it is evident that 4–9 years before the onset of damage (occurring in the year 2015), characteristics of response function spectra in future damaged stands were similar to characteristics of the response function spectrum in control (undamaged) stands. Immediately before the onset of the damage, there were deviations of the parameters of the response function spectrum in forest stands of future outbreak focus A (Siberian silk moth) from those in the control forest stands. After damage to the forest stands by the insect pest in 2015–2016, the parameters of the response function spectrum dropped significantly compared with the control.
Similar calculations were performed for white mottled sawyer outbreak foci and control (undamaged) stands (Figure 7).
The LF and HF parameters presented in Figure 7 for the territory damaged by the white mottled sawyer are qualitatively similar to corresponding data on Siberian silk moth outbreaks: at 3 years before the insect outbreak, indicators of response function spectra in forest stands that would be damaged by pests did not differ from such characteristics in the control stands. Two years before the onset of visible damage to trees, shifts of parameters LF and HF were noticeable; these parameters then remained the same in the year of the onset of visible damage. The next year after the start of the white mottled sawyer outbreak—just as during the Siberian silk moth outbreak—a sharp shift was observed toward higher values of parameter LF and a decrease in parameter HF.
Figure 8 illustrates the LF and HF components of response function spectra in outbreak focus C (Siberian silk moth).
As presented in Figure 8, parameters LF and HF began to shift 4 years before the onset of visible damage. After severe damage to trees in 2019, LF values reached a maximum, and next, in 2020–2021, LF values began to decline and HF values started to go up. This outcome may be explained as follows: remote sensing began to detect characteristics of the second tier of forest stands and of herbaceous plants. Unfortunately, outbreak focus C has zero human-population density, there are no roads in this area, and it was possible to reach this outbreak focus only once by helicopter; therefore, detailed ground-based analyses of post-outbreak processes could not be carried out.
Remote sensing data from outbreak focus D (four-eyed fir bark beetle) are shown in Figure 9.
Thus, using such characteristics as components LF and HF of response function spectra, it is possible to identify areas of future damage 2–3 years before an outbreak.
Is prediction of insect outbreaks feasible before the onset of visible damage to trees? To evaluate the feasibility of such a forecast by means of remote sensing data, in particular, by means of parameters of the response function spectrum, we examined data on fir stands in potential focus E located in the Birilyussky District of Krasnoyarsk Territory.
Forest stands in the Birilyussky District have not been damaged by insects to date; however, due to the discovery of adult Siberian silk moths in pheromone traps, these territories can be considered areas subject to the risk of pest outbreaks. To evaluate the condition of these forest stands, stands were chosen in two zones. Zone E1 included five sample plots near the points where pheromone traps were installed, whereas zone E2 contained five sample plots at a distance of approximately 5 km from zone E1. In the same way as for the above-mentioned outbreaks of the Siberian silk moth in the Yenisei District and of the white mottled sawyer in the Yermakovsky District, we analyzed remote sensing data in zones E1 and E2 of the Birilyussky District from 2014 to 2023. Figure 10 shows the calculated average parameters of response function spectra for forest stands in these zones in 2014–2023.
As one can see in Figure 10, for sample plots in zone E1, there were significant differences in the characteristics of the response function spectra between periods 2014–2019 and 2020–2023. For sample plots in zone E2, such differences were less pronounced. On the other hand, in the years 2014–2019 on the sample plots, there were no significant differences in the characteristics of the response function spectra between zones E1 and E2.

4. Discussion

As one can see in a comparison of Figure 6, Figure 7, Figure 8 and Figure 9, in the years immediately preceding an outbreak and during the period of damage to forest stands by the pests, characteristics (LF and HF) of the spectrum of response functions (describing a response of NDVI to a change in LST) differ from the LF and HF of forest stands in periods long before an outbreak onset. After damage to forest stands, LF values increased, whereas HF values diminished, that is, the response of the characteristics of the photosynthetic apparatus to weather changes became slower compared with the reactions of NDVI long before an outbreak. HF values, on the contrary, declined as trees were damaged by the insects. Immediately before an outbreak, LF and HF values reached intermediate levels between time points “long before an outbreak” and “after damage by a pest.” Therefore, it can be supposed that the shifts of these parameters of the response function spectrum can serve as indicators of changes in the state of forest stands and of their response to external factors. At 3–4 years before an outbreak, LF values of stands were near 0.3, whereas HF values were near 0.6, but at 1–2 years before an outbreak, these parameters shifted to 0.45 and 0.40, respectively.
Similar changes in the parameters of the response function spectrum were observed in fir stands of zone E, which have not yet been damaged by the Siberian silk moth but are already classified as being at risk of an outbreak owing to the detection of this pest’s adult males by pheromone traps. Although in the 2014–2019 period these characteristics of the response function spectra were somewhere near LF ≈ 0.1 and HF ≈ 0.5, in 2020–2023, these parameters shifted to ~0.2 and ~0.4, respectively. Further research will likely help to accurately assess the risk of a Siberian silk moth outbreak in this area.
Parameters LF and HF of response functions in control (undamaged) coniferous forest stands were found to be quite similar to each other. The LF and HF that characterize the risk of an outbreak in different past outbreak foci of various insect pests are also close to each other, both for phyllophages and xylophages. It can be theorized that the proposed indicators are somewhat nonspecific and describe a general response of trees to weather factors. Of course, it would be interesting to compare parameters LF and HF of undamaged forest stands under the conditions when climatic parameters change on some territory.
It should be noted that to evaluate the characteristics of response function spectra in the potential focus of zone E, we needed a day of work on a computer without visiting the forest; consequently, the indicators in question may be used for preliminary estimation of the susceptibility of forest stands to pest attacks.
A significant number of works are devoted to mapping insect damage to stands [50,51,52]. However, such studies do not solve the problem of outbreak prediction, where it is necessary to assess the risks of outbreaks in a situation where insect damage to forests is not yet occurring. For example, the authors performed [53] a multispectral analysis of tree conditions in the center of a bark beetle outbreak. Using satellite and drone data, they were able to classify tree condition reasonably accurately and distinguish between healthy undamaged trees, trees felled during windthrow and suitable for tree beetle infestation, and different classes of dead trees. The difference between our approach and the one proposed in [53] is as follows: trees felled by windthrow serve as a feeding resource for the bark beetle, but the future fallen area is not predicted and the objective is to estimate the distribution of trees before and after windthrow and pest attack. In our case, there are no visible external impacts on the forest (such as windthrow), and the task is to predict the zone of future pest outbreak foci a year or two before insect damage to trees begins. And in our case, the spectral characteristics of trees before an outbreak do not differ from the spectral characteristics of trees in an area where outbreaks have not occurred, and the response of spectral characteristics in response to changes in temperature, rather than multispectral analysis data, was used to identify areas of future outbreaks. While in [53] it was possible to limit ourselves to single satellite and unmanned aerial vehicle images to assess the condition of trees, in our case it was necessary to study the seasonal curves of the selected indicators to estimate the response functions.

5. Conclusions

The present study demonstrates that the sensitivity of the photosynthetic apparatus of a tree to fluctuations in environmental temperature over the course of a season can be described by an integral transform equation and calculated from remote sensing data. This result opens up opportunities for estimating such parameters for any area covered with vegetation on the planet. For forest stands in Siberia, it is shown in this paper that several years before a successful insect attack, the reaction of a forest stand—that will later be attacked by a pest—to alterations in the environment (in this case, in the temperature of the underlying surface, LST) undergoes qualitative changes. Immediately before an outbreak, the proposed calculated indicators differ significantly from such indicators in previous years. With the help of the proposed methodology for assessing susceptibility of forest stands to pest attacks, it is feasible to forecast the occurrence of an insect outbreak in a specific region and to enhance the efficacy of forest protection strategies. As mentioned in the Introduction, such forecasts cannot be obtained by means of absolute values of a forest stand vegetative state (NDVI). While absolute NDVI values do not provide predictions, it is necessary to consider the response of NDVI to changes in surface temperature LST to assess stand health and stability. This approach allows us to assess the susceptibility of ΔNDVI to changes in ΔLST χ = Δ NDVI Δ L S T . The proposed methodology linking NDVI to ground surface temperature is capable of detecting very early stages of insect outbreaks before damage becomes evident, enabling the implementation of early forest protection measures.

Author Contributions

Conceptualization, V.S.; Methodology, V.S. and A.K.; Software, A.K.; Validation, A.K. and O.T.; Formal analysis, A.K., Y.I., and O.T.; Investigation, A.K. and O.T.; Data curation, Y.I. and A.K.; Writing—original draft, V.S.; Writing—review and editing, A.K. All authors have read and agreed to the published version of the manuscript.

Funding

This research was supported by the Russian Science Foundation (grant #23-66-10015).

Data Availability Statement

The data presented in this study are available on request from the corresponding author.

Conflicts of Interest

The authors declare no conflicts of interest.

References

  1. Dyer, L.A.; Carson, W.P.; Leigh, E.G. Insect outbreaks in tropical forests: Patterns, mechanisms, and consequences. In Insect Outbreaks Revisit; Wiley: Hoboken, NJ, USA, 2012; pp. 219–245. [Google Scholar] [CrossRef]
  2. Kneeshaw, D.; Sturtevant, B.R.; Cooke, B.; Work, T.; Pureswaran, D.; De Grandpre, L.; MacLean, D.A. Insect disturbances in forest ecosystems. In Routledge Handbook of Forest Ecology; Routledge: London, UK, 2015; pp. 93–113. [Google Scholar]
  3. Silins, I.; Karklina, A.; Miezite, O.; Jansons, A. Trends in Outbreaks of Defoliating Insects Highlight Growing Threats for Central European Forests, and Implications for Eastern Baltic Region. Forests 2021, 12, 799. [Google Scholar] [CrossRef]
  4. Berner, L.T.; Law, B.E.; Meddens, A.J.H.; Hicke, J.A. Tree mortality from fires, bark beetles, and timber harvest during a hot and dry decade in the western United States (2003–2012). Environ. Res Lett. 2017, 12, 065005. [Google Scholar] [CrossRef]
  5. Liebhold, A.M.; Brockerhoff, E.G.; Kalisz, S.; Nuñez, M.A.; Wardle, D.A.; Wingfield, M.J. Biological invasions in forest ecosystems. Biol. Invasions 2017, 19, 3437–3458. [Google Scholar] [CrossRef]
  6. Mezei, P.; Jakuš, R.; Pennerstorfer, J.; Havašová, M.; Škvarenina, J.; Ferenčík, J.; Slivinský, J.; Bičárová, S.; Bilcik, D.; Blazenec, M.; et al. Storms, temperature maxima and the Eurasian spruce bark beetle Ips typographus—An infernal trio in Norway spruce forests of the Central European High Tatra Mountains. Agric. For. Meteorol. 2017, 242, 85–95. [Google Scholar] [CrossRef]
  7. van Lierop, P.; Lindquist, E.; Sathyapala, S.; Franceschini, G. Global forest area disturbance from fire, insect pests, diseases and severe weather events. For. Ecol. Manag. 2015, 352, 78–88. [Google Scholar] [CrossRef]
  8. Bentz, B.; Bonello, P.; Delb, H.; Fettig, C.; Poland, T.; Pureswaran, D.; Seybold, S. Advances in understanding and managing insect pests of forest trees. In Achieving Sustainable Management of Boreal and Temperate Forests; Stanturf, J., Ed.; Burleigh Dodds Science Publishing Ltd.: Cambridge, UK, 2019; pp. 515–585. [Google Scholar]
  9. Raffa, K.F.; Aukema, B.H.; Bentz, B.J.; Carroll, A.L.; Hicke, J.A.; Turner, M.G.; Romme, W.H. Cross-scale drivers of natural disturbances prone to anthropogenic amplification: The dynamics of bark beetle eruptions. BioScience 2008, 58, 501–517. [Google Scholar] [CrossRef]
  10. Bentz, B.J.; Régnière, J.; Fettig, C.J.; Hansen, E.M.; Hayes, J.L.; Hicke, J.A.; Kelsey, R.G.; Negron, J. Climate change and bark beetles of the western United States and Canada: Direct and indirect effects. BioScience 2010, 60, 602–613. [Google Scholar] [CrossRef]
  11. Pureswaran, D.S.; Roques, A.; Battisti, A. Forest insects and climate change. Curr. For. Rep. 2018, 4, 35–50. [Google Scholar] [CrossRef]
  12. Candau, J.N.; Fleming, R.A. Forecasting the response of spruce budworm defoliation to climate change in Ontario. Can. J. For. Res. 2011, 41, 1948–1960. [Google Scholar] [CrossRef]
  13. Godefroid, M.; Meurisse, N.; Groenen, F.; Kerdelhué, C.; Rossi, J.P. Current and future distribution of the invasive oak processionary moth. Biol. Invasions 2020, 22, 523–534. [Google Scholar] [CrossRef]
  14. Björkman, C.; Bylund, H.; Nilsson, U.; Nordlander, G.; Schroeder, M. Forest management to mitigate insect damage in a changing climate: Possibilities and uncertainties. In Climate Change and Insect Pests; Björkman, C., Niemelä, P., Eds.; CABI: Wallingford, CT, USA, 2015; pp. 248–266. [Google Scholar]
  15. Deutsch, C.A.; Tewksbury, J.J.; Tigchelaar, M.; Battisti, D.S.; Merrill, S.C.; Huey, R.B.; Naylor, R.L. Increase in crop losses to insect pests in a warming climate. Science 2018, 361, 916–919. [Google Scholar] [CrossRef]
  16. Ren, P.; Neron, V.; Rossi, S.; Liang, E.; Bouchard, M.; Deslauriers, A. Warming counteracts defoliation-induced mismatch by increasing herbivore-plant phenological synchrony. Glob. Chang. Biol. 2020, 26, 2072–2080. [Google Scholar] [CrossRef]
  17. Liu, E.Y.; Lantz, V.A.; MacLean, D.A.; Hennigar, C. Economics of early intervention to suppress a potential spruce budworm outbreak on crown land in New Brunswick, Canada. Forests 2019, 10, 481. [Google Scholar] [CrossRef]
  18. Jactel, H.; Brockerhoff, E.; Duelli, P. A test of the biodiversity-stability theory: Meta-analysis of tree species diversity effects on insect pest infestations, and re-examination of responsible factors. In Forest Diversity and Function: Temperate and Boreal Systems; Scherer-Lorenzen, M., Korner, C., Schulze, E.D., Eds.; Springer: Berlin, Germany, 2005; pp. 235–262. [Google Scholar]
  19. Jactel, H.; Brockerhoff, E.G. Tree diversity reduces herbivory by forest insects. Ecol. Lett. 2007, 10, 835–848. [Google Scholar] [CrossRef] [PubMed]
  20. Klapwijk, M.J.; Bylund, H.; Schroeder, M.; Björkman, C. Forest management and natural biocontrol of insect pests. Forestry 2016, 89, 253–262. [Google Scholar] [CrossRef]
  21. MacLean, D.A.; Erdle, T.A.; MacKinnon, W.E.; Porter, K.B.; Beaton, K.P.; Cormier, G.; Morehouse, S.; Budd, M. The spruce budworm decision support system: Forest protection planning to sustain long-term wood supply. Can. J. For. Res. 2001, 31, 1742–1757. [Google Scholar] [CrossRef]
  22. Dymond, C.C.; Wulder, M.A.; Shore, T.L.; Nelson, T.; Boots, B.; Riel, B.G. Evaluation of risk assessment of mountain pine beetle infestations. West. J. Appl. For. 2006, 21, 5–13. [Google Scholar] [CrossRef]
  23. Tucker, C.J.; Sellers, P.J. Satellite remote sensing of primary production. Int. J. Remote Sens. 1986, 7, 1395–1416. [Google Scholar] [CrossRef]
  24. Liu, Y.; Hill, M.J.; Zhang, X.; Wang, Z.; Richardson, A.D.; Hufkens, K.; Filippa, G.; Baldocchi, D.D.; Ma, S.; Verfaillie, J.; et al. Using data from Landsat, MODIS, VIIRS and Pheno Cams to monitor the phenology of California oak/grass savanna and open grassland across spatial scales. Agric. For. Meteorol. 2017, 237–238, 311–325. [Google Scholar] [CrossRef]
  25. Rechid, D.; Raddatz, T.J.; Jacob, D. Parameterization of snow-free land surfacealbedo as a function of vegetation phenology based on MODIS data and appliedin climate modelling. Theor. Appl. Climatol. 2009, 95, 245–255. [Google Scholar] [CrossRef]
  26. Bayarjargal, Y.; Karnieli, A.; Bayasgalan, M.; Khudulmur, S.; Gandush, C.; Tucker, C.J. A comparative study of NOAA-AVHRR derived drought indices using change vector analysis. Int. J. Remote Sens. 2006, 105, 9–22. [Google Scholar] [CrossRef]
  27. Cunha, M.; Richter, C. A time-frequency analysis on the impact of climate variability with focus on semi-natural montane grassland meadows. IEEE Trans. Geosci. Remote Sens. 2014, 52, 6156–6164. [Google Scholar] [CrossRef]
  28. Jacquin, A.; Sheeren, D.; Lacombe, J.P. Vegetation cover degradation assessment in Madagascar savanna based on trend analysis of MODIS NDVI time series. Int. J. Appl. Earth Obs. Geoinf. 2010, 12, S3–S10. [Google Scholar] [CrossRef]
  29. Liang, L.; Chen, Y.; Hawbaker, T.; Zhu, Z.; Gong, P. Mapping mountain pine beetle mortality through growth trend analysis of time-series landsat data. Remote Sens. 2014, 6, 5696–5716. [Google Scholar] [CrossRef]
  30. Senf, C.; Seidl, R.; Hostert, P. Remote sensing of forest insect disturbances: Current state and future directions. Int. J. Appl. Earth Obs. Geoinf. 2017, 60, 49–60. [Google Scholar] [CrossRef]
  31. Verbesselt, J.; Zeileis, A.; Herold, M. Near real-time disturbance detection using satellite image time series. Remote Sens. Environ. 2012, 123, 98–108. [Google Scholar] [CrossRef]
  32. Spruce, J.P.; Sader, S.; Ryan, R.E.; Smoot, J.; Kuper, P.; Ross, K.; Prados, D.; Russell, J.; Gasser, G.; McKellip, R. Assessment of MODIS NDVI time series data products for detecting forest defoliation by gypsy moth outbreaks. Remote Sens. Environ. 2011, 115, 427–437. [Google Scholar] [CrossRef]
  33. Thayn, J.B. Using a remotely sensed optimized Disturbance Index to detect insect defoliation in the Apostle Islands, Wisconsin, USA. Remote Sens. Environ. 2013, 136, 210–217. [Google Scholar] [CrossRef]
  34. Olsson, P.O.; Lindstrom, J.; Eldundh, L. Near real-time monitoring of insect induced defoliation in subalpine birch forests with MODIS derived NDVI. Remote Sens. Environ. 2016, 181, 42–53. [Google Scholar] [CrossRef]
  35. Rozhkov, A.S. Siberian Silk Moth; Nauka: Moscow, Russia, 1963; 175p. (In Russian) [Google Scholar]
  36. Kondakov, Y.P. Patterns of the Siberian silkmoth outbreaks. In Ecology of Populations of Forest Animals of Siberia; Nauka Publ.: Novosibirsk, Russia, 1974; pp. 206–265. (In Russian) [Google Scholar]
  37. Isaev, A.S.; Khlebopros, R.G.; Kiselev, V.V.; Kondakov, Y.P.; Nedorezov, L.V.; Soukhovolsky, V.G. Forest Insects Population Dynamics; Publishing House of the Eurasian Entomological Journal: Novosibirsk, Russia, 2009; 115p. [Google Scholar]
  38. Isaev, A.S.; Girs, G.I. Interaction between Tree and Xylophagous Insects; Nauka Publ.: Novosibirsk, Russia, 1975; 344p. (In Russian) [Google Scholar]
  39. Isaev, A.S.; Rozhkov, A.S.; Kiselev, V.V. Black Fir Longhorned Beetle Monochamus Urussovi (Fisch.); Nauka Publ.: Novosibirsk, Russia, 1988; 271p, ISBN 5-02-029406-3. (In Russian) [Google Scholar]
  40. Kerchev, I.A. Ecology of the Ussuri polygraph Polygraphus proximus Blandf. (Coleoptera: Curculionidae, Scolytinae) in the West Siberian region of invasion. Russ. J. Biol. Invasions 2014, 2, 80–94. (In Russian) [Google Scholar]
  41. Krivets, S.A.; Bisirova, E.M.; Kerchev, I.A.; Pats, E.N.; Chernova, N.A. Population characteristics and influence of the Ussuri polygraph on the state of fir forests of North-Eastern Altai. Proc. News St. Petersburg For. Acad. 2014, 207, 37–48. (In Russian) [Google Scholar]
  42. Krivets, S.A.; Kerchev, I.A.; Bisirova, E.M.; Debkov, N.M. Modern distribution and forecast of expansion of the invasive range of the Ussuri Polygraphus proximus Blandford, 1894 in the Tomsk region (Western Siberia). Eurasian Entomol. J. 2018, 17, 53–60. (In Russian) [Google Scholar] [CrossRef]
  43. Public Database of MODIS Satellite Systems. Available online: http://modis.gsfc.nasa.gov (accessed on 10 May 2024).
  44. Cochran, J.A. The Analysis of Linear Integral Equations; McGraw-Hill Book Co.: New York, NY, USA, 1972; 370p. [Google Scholar]
  45. Jerry, A.J. Introduction to Integral Equations with Applications; Marcel Dekker: New York, NY, USA; Basel, Switzerland, 1985; 254p. [Google Scholar]
  46. Hackbusch, W. Integral Equations: Theory and Numerical Treatment; Birkhäuser Verlag: Boston, MA, USA, 1995; 362p. [Google Scholar]
  47. Polyanin, A.D.; Manzhirov, A.V. Handbook of Integral Equations; Chapman and Hall/CRC: Boca Raton, FL, USA, 2008; 1081p. [Google Scholar]
  48. Wei, W.W.S. Time Series Analysis; Addison Wesley: Boston, MA, USA, 2008; 614p. [Google Scholar]
  49. Application for Extracting and Exploring Analysis Ready Samples (AppEEARS). Available online: https://lpdaacsvc.cr.usgs.gov/appeears/ (accessed on 9 May 2024).
  50. Meddens, A.J.H.; Hicke, J.A.; Vierling, L.A.; Hudak, A.T. Evaluating methods to detect bark beetle-caused tree mortality using single-date and multi-date Landsat imagery. Remote Sens. Environ. 2013, 132, 49–58. [Google Scholar] [CrossRef]
  51. Bright, B.C.; Hudak, A.T.; Meddens, A.J.H.; Egan, J.M.; Jorgensen, C.L. Mapping Multiple Insect Outbreaks across Large Regions Annually Using Landsat Time Series Data. Remote Sens. 2020, 12, 1655. [Google Scholar] [CrossRef]
  52. Ganz, S.; Adler, P.; Kändler, G. Forest cover mapping based on a combination of aerial images and Sentinel-2 satellite data compared to National Forest Inventory data. Forests 2020, 11, 1322. [Google Scholar] [CrossRef]
  53. Abdollahnejad, A.; Panagiotidis, D.; Surový, P.; Modlinger, R. Investigating the Correlation between Multisource Remote Sensing Data for Predicting Potential Spread of Ips typographus L. Spots in Healthy Trees. Remote Sens. 2021, 13, 4953. [Google Scholar] [CrossRef]
Figure 1. Outbreak foci in Krasnoyarsk Territory (a white line, filled in red on a small map) in Russia. A: An outbreak focus of the Siberian silk moth Dendrolimus sibiricus Tschetv. in the years 2015–2018. B: An outbreak focus of the white mottled sawyer Monochamus urussovi Fisch. C: An outbreak focus of D. sibiricus in 2019–2020. D: An outbreak focus of Polygraphus proximus Blandford. E: The zone where adults of D. sibiricus were found in 2023 and a potential outbreak focus of this pest.
Forests 15 01458 g001
Figure 2. A typical time series of seasonal dynamics of NDVI in taiga coniferous forests.
Forests 15 01458 g002
Figure 3. A typical time series of seasonal dynamics of LST in taiga coniferous forests.
Forests 15 01458 g003
Figure 4. Typical shapes of spectrum H(f) of the function of the response of NDVI to a change in LST for a fir stand in taiga forests of Siberia. 1: Control, 2: the year of the Siberian silk moth outbreak in the Yeniseisk Dist.
Forests 15 01458 g004
Figure 5. Dynamics of average seasonal values of NDVI in control forest stands (1) and in foci of outbreaks of Siberian silk moths in the Yenisei District (2). Arrow: the year the outbreak began.
Forests 15 01458 g005
Figure 6. Parameters LF and HF of plots damaged by the Siberian silk moth in outbreak focus A and on control plots in different years. 1: At 5 years before the start of visible damage to tree crowns by the pest; 2: 1–2 years before the damage; 3: in the year of the beginning of visible damage to the crowns; 4: within 4 years after the outbreak began; 5: control undamaged stands 1 year before the outbreak.
Forests 15 01458 g006
Figure 7. Parameters LF and HF of response function spectra for white mottled sawyer outbreak focus B and for intact stands. 1: Control forest stands for all years before and after the outbreak began; 2: forest stands in the outbreak focus in 2009–2010 (i.e., 3–4 years before the start of the outbreak); 3: forest stands in the outbreak zone 1–2 years before the outbreak and in the year of change in the tree crown color when trees were damaged by the pest (in the year 2013); 4: forest stands in the outbreak focus in 2014.
Forests 15 01458 g007
Figure 8. Parameters LF and HF for the 2008–2020 period of coniferous forest stands in outbreak focus C of the Siberian silk moth. 1: Future outbreak foci C in 2010–2014; 2: future outbreak foci C in 2015–2018; 3: outbreak focus C at the beginning of visible damage in 2019, 4: outbreak focus C in the years 2020–2021, 5: control (undamaged) forest stands in 2008–2020.
Forests 15 01458 g008
Figure 9. Parameters LF and HF for the years 2006–2019 of fir stands in outbreak focus D of the four-eyed fir bark beetle. 1: Control (undamaged) forest stands in 2006–2019; 2: future outbreak foci assessed in 2006–2010; 3: the foci in 2011–2014, i.e., before the onset of visible damage; 4: areas of foci in the years 2015–2019, i.e., after the trees were cut down.
Forests 15 01458 g009
Figure 10. Average components LF and HF for sample plots in zones E1 and E2. 1: Zone E1 in the years 2014–2019; 2: zone E1 in 2020–2023; 3: zone E2 in 2014–2019; E2: zone E2 in 2020–2023.
Forests 15 01458 g010
Disclaimer/Publisher’s Note: The statements, opinions and data contained in all publications are solely those of the individual author(s) and contributor(s) and not of MDPI and/or the editor(s). MDPI and/or the editor(s) disclaim responsibility for any injury to people or property resulting from any ideas, methods, instructions or products referred to in the content.

