Article

Effects of Soil Physical Properties on Soil Infiltration in Forest Ecosystems of Southeast China

1
School of Forestry, Nanjing Forestry University, Nanjing 210037, China
2
Co-Innovation Center for Sustainable Forestry in Southern China, Nanjing Forestry University, Nanjing 210037, China
3
Jiangsu Provincial Key Laboratory of Soil Erosion and Ecological Restoration, Nanjing Forestry University, Nanjing 210037, China
*
Author to whom correspondence should be addressed.
Forests 2024, 15(8), 1470; https://doi.org/10.3390/f15081470
Submission received: 18 July 2024 / Revised: 17 August 2024 / Accepted: 20 August 2024 / Published: 21 August 2024
(This article belongs to the Section Forest Hydrology)

Abstract

:
Soil infiltration properties (SIPs) are important components of forest hydrological responses; however, few studies have investigated the mechanisms through which soil physical properties affect SIPs. In this study, two SIPs, the initial infiltration rate (IIR) and saturated hydraulic conductivity (Ks), were quantified at five soil depths (0–10, 10–20, 20–30, 30–40, and 40–50 cm) in three forest stands (pine (Pinus taeda), oak (Quercus acutissima), and bamboo (Phyllostachys edulis) forests). We constructed a structural equation model (SEM) to analyze the main physical properties affecting the SIPs and their influence pathways, and the results show that the IIR and Ks values for the whole soil profile decreased as follows: pine forest > oak forest > bamboo forest. Soil total porosity (STP), soil field capacity (SFC), capillary water holding capacity (CMC), saturated water capacity (SWC), and initial soil water content (ISWC) were positively correlated with the SIPs, while soil bulk density (SBD) was negatively correlated with the SIPs. The SEM indicated that the main positive driver of soil infiltration was STP, while the sand content and SBD reduced soil infiltration. Soil texture indirectly affected SBD by mediating STP, and SBD indirectly affected the SIPs through SWC. These results provide data that support the simulation of subsurface hydrological responses in forests and have significant implications for forest management.

Graphical Abstract

1. Introduction

Forest ecosystems play an important role in soil and water conservation, climate regulation, and biodiversity protection [1]. Furthermore, soil water is an important carrier of material and energy in forest ecosystems that influences vegetation and soil productivity, thereby affecting the dynamics of forest hydrology [2]. Soil hydrological responses can comprehensively reflect the interaction between forest ecosystems and water, and soil infiltration is an irreplaceable aspect of this response, resulting in changes in soil erosion control, runoff generation, water flow dynamics, nutrient cycles, and groundwater renewal [3]. Therefore, studying the spatial heterogeneity of soil infiltration in different forest stands contributes to a better understanding of sustainable forest development [4].
The water that flows into the soil through surface runoff is used for water evaporation and absorption by vegetation roots, while the rest is stored in the soil or flows into groundwater in the form of underground runoff, thus reflecting the water conservation function of forests [5]. In addition, a forest can impede droplet splashing, runoff dispersion, and the suspension of soil by increasing surface roughness [6], which in turn increases soil infiltration. Forest root systems penetrate deep into the soil and can change the soil’s physical properties by creating root channels or binding particles, which further improves soil porosity and promotes water infiltration [7]. Therefore, the effects of root systems on soil infiltration properties (SIPs) are largely the result of mediating soil physical properties [8,9].
SIPs can affect soil hydrology by determining the redistribution of water during rainfall, generating surface runoff, managing the groundwater level, and altering nutrient content [10]. Therefore, SIPs have a significant influence on the ecological and nurturing functions of soil [11]. In addition, soil infiltration is one of the indicators for evaluating the ability to regulate the soil water dynamic balance and forest water conservation because soil surface erosion can decrease with improvements in SIPs [12]. Therefore, the study of forest SIPs is of great significance for revealing the mechanisms of soil hydrological responses. Previous studies have shown that SIPs can be changed by altering soil physical properties, vegetation types, rainfall intensity, land use, and surface slope [13]. The soil layer is the first medium through which water can be transported into deeper soil layers via soil profiles, resulting in obvious changes in SIPs [8]. Numerous studies have shown that soil porosity, bulk density, initial water content, and texture are closely related to soil infiltration [14,15]. In other work, it has been shown that soil water flow channels are significantly affected by the presence of macropores created by earthworm activities, root system spreading, and soil organic materials [8,16]. More effective channels can enhance the connectivity of water flow, which can further improve SIPs; for example, Zhu et al. showed that soil infiltration is positively correlated with soil total porosity [14]. However, a contrasting perspective was provided by Ju et al. on the impacts of soil porosity structure on infiltration properties in the red soil region of Southern China, suggesting that the soil infiltration rate has little relationship with the soil porosity structure [17]. Furthermore, the effects of soil bulk density on SIPs are also controversial. According to Jurin’s law [18], an increase in SBD reduces the saturated hydraulic conductivity and porosity (soil water saturation capacity). At the same time, the smaller the pore size, the greater the pressure head, which increases the water holding capacity. However, Rasse et al. showed there is a positive correlation between soil porosity and soil water content [19], while Basset et al. showed that there is a negative correlation between soil bulk density and SIPs [20]. Therefore, it is difficult to neglect the fact that SIPs are comprehensively affected by the joint impacts of those soil properties instead of any single property [21]. Moreover, the joint impacts and their influencing mechanisms, which drive changes in SIPs, are still inconclusive.
The joint impacts of soil physical properties and SIPs cannot be clearly indicated through simple statistical analysis, and statistical models have been employed in previous research using a comparatively small number of explanatory soil properties to illustrate the mechanisms of SIPs in empirical understanding, owing to the highly nonlinear relationship between them [8]. It is possible that a structural equation model (SEM) could be effective in simulating the interactions between the aforementioned variables and delivering the output results. An SEM is characterized by its utility in partitioning the effects that one variable may have on another, and then by clarifying the possible influence pathways of major factors, the strengths of multiple effects can be estimated [22]. In addition, an SEM can be utilized to obtain direct and indirect effects between variables, which are further used to construct theoretical concepts, test the reliability of their measurements, and develop and test hypotheses. An SEM can minimize the differences between the observed and predicted covariances [23]. SEMs have been widely used in research related to SIPs; for example, Zhu et al. [24] used an SEM to study the effects of land use management on SIPs and found that the indirect effects of root systems and soil texture played the most important role. In contrast to Zhu et al. [24], this study focuses on the effects of soil physical properties on SIPs in forest ecosystems. In addition, Zhang et al. [8] used an SEM to analyze the direct and indirect effects of soil physical properties on the formation of preferential flow paths. Therefore, it is appropriate for an SEM to be used to analyze the influence pathways by which soil physical properties affect SIPs.
In this research, the study area is at the junction of subtropical and warm temperate zones. Therefore, we selected three typical subtropical forest stands (pine (Pinus taeda), oak (Quercus acutissima), and bamboo (Phyllostachys edulis) forests), which are widely grown and representative of natural secondary forests formed under the protection of local enclosures [9]. Furthermore, we analyzed the relationship between variations in the characteristics of SIPs and soil depth in different forest stands. In addition, we explored the pathways that influence the soil physical properties on soil infiltration properties. Based on the above-mentioned research, we provide practical guidance that may contribute to forest management and the improvement of forest hydrological effects.

2. Materials and Methods
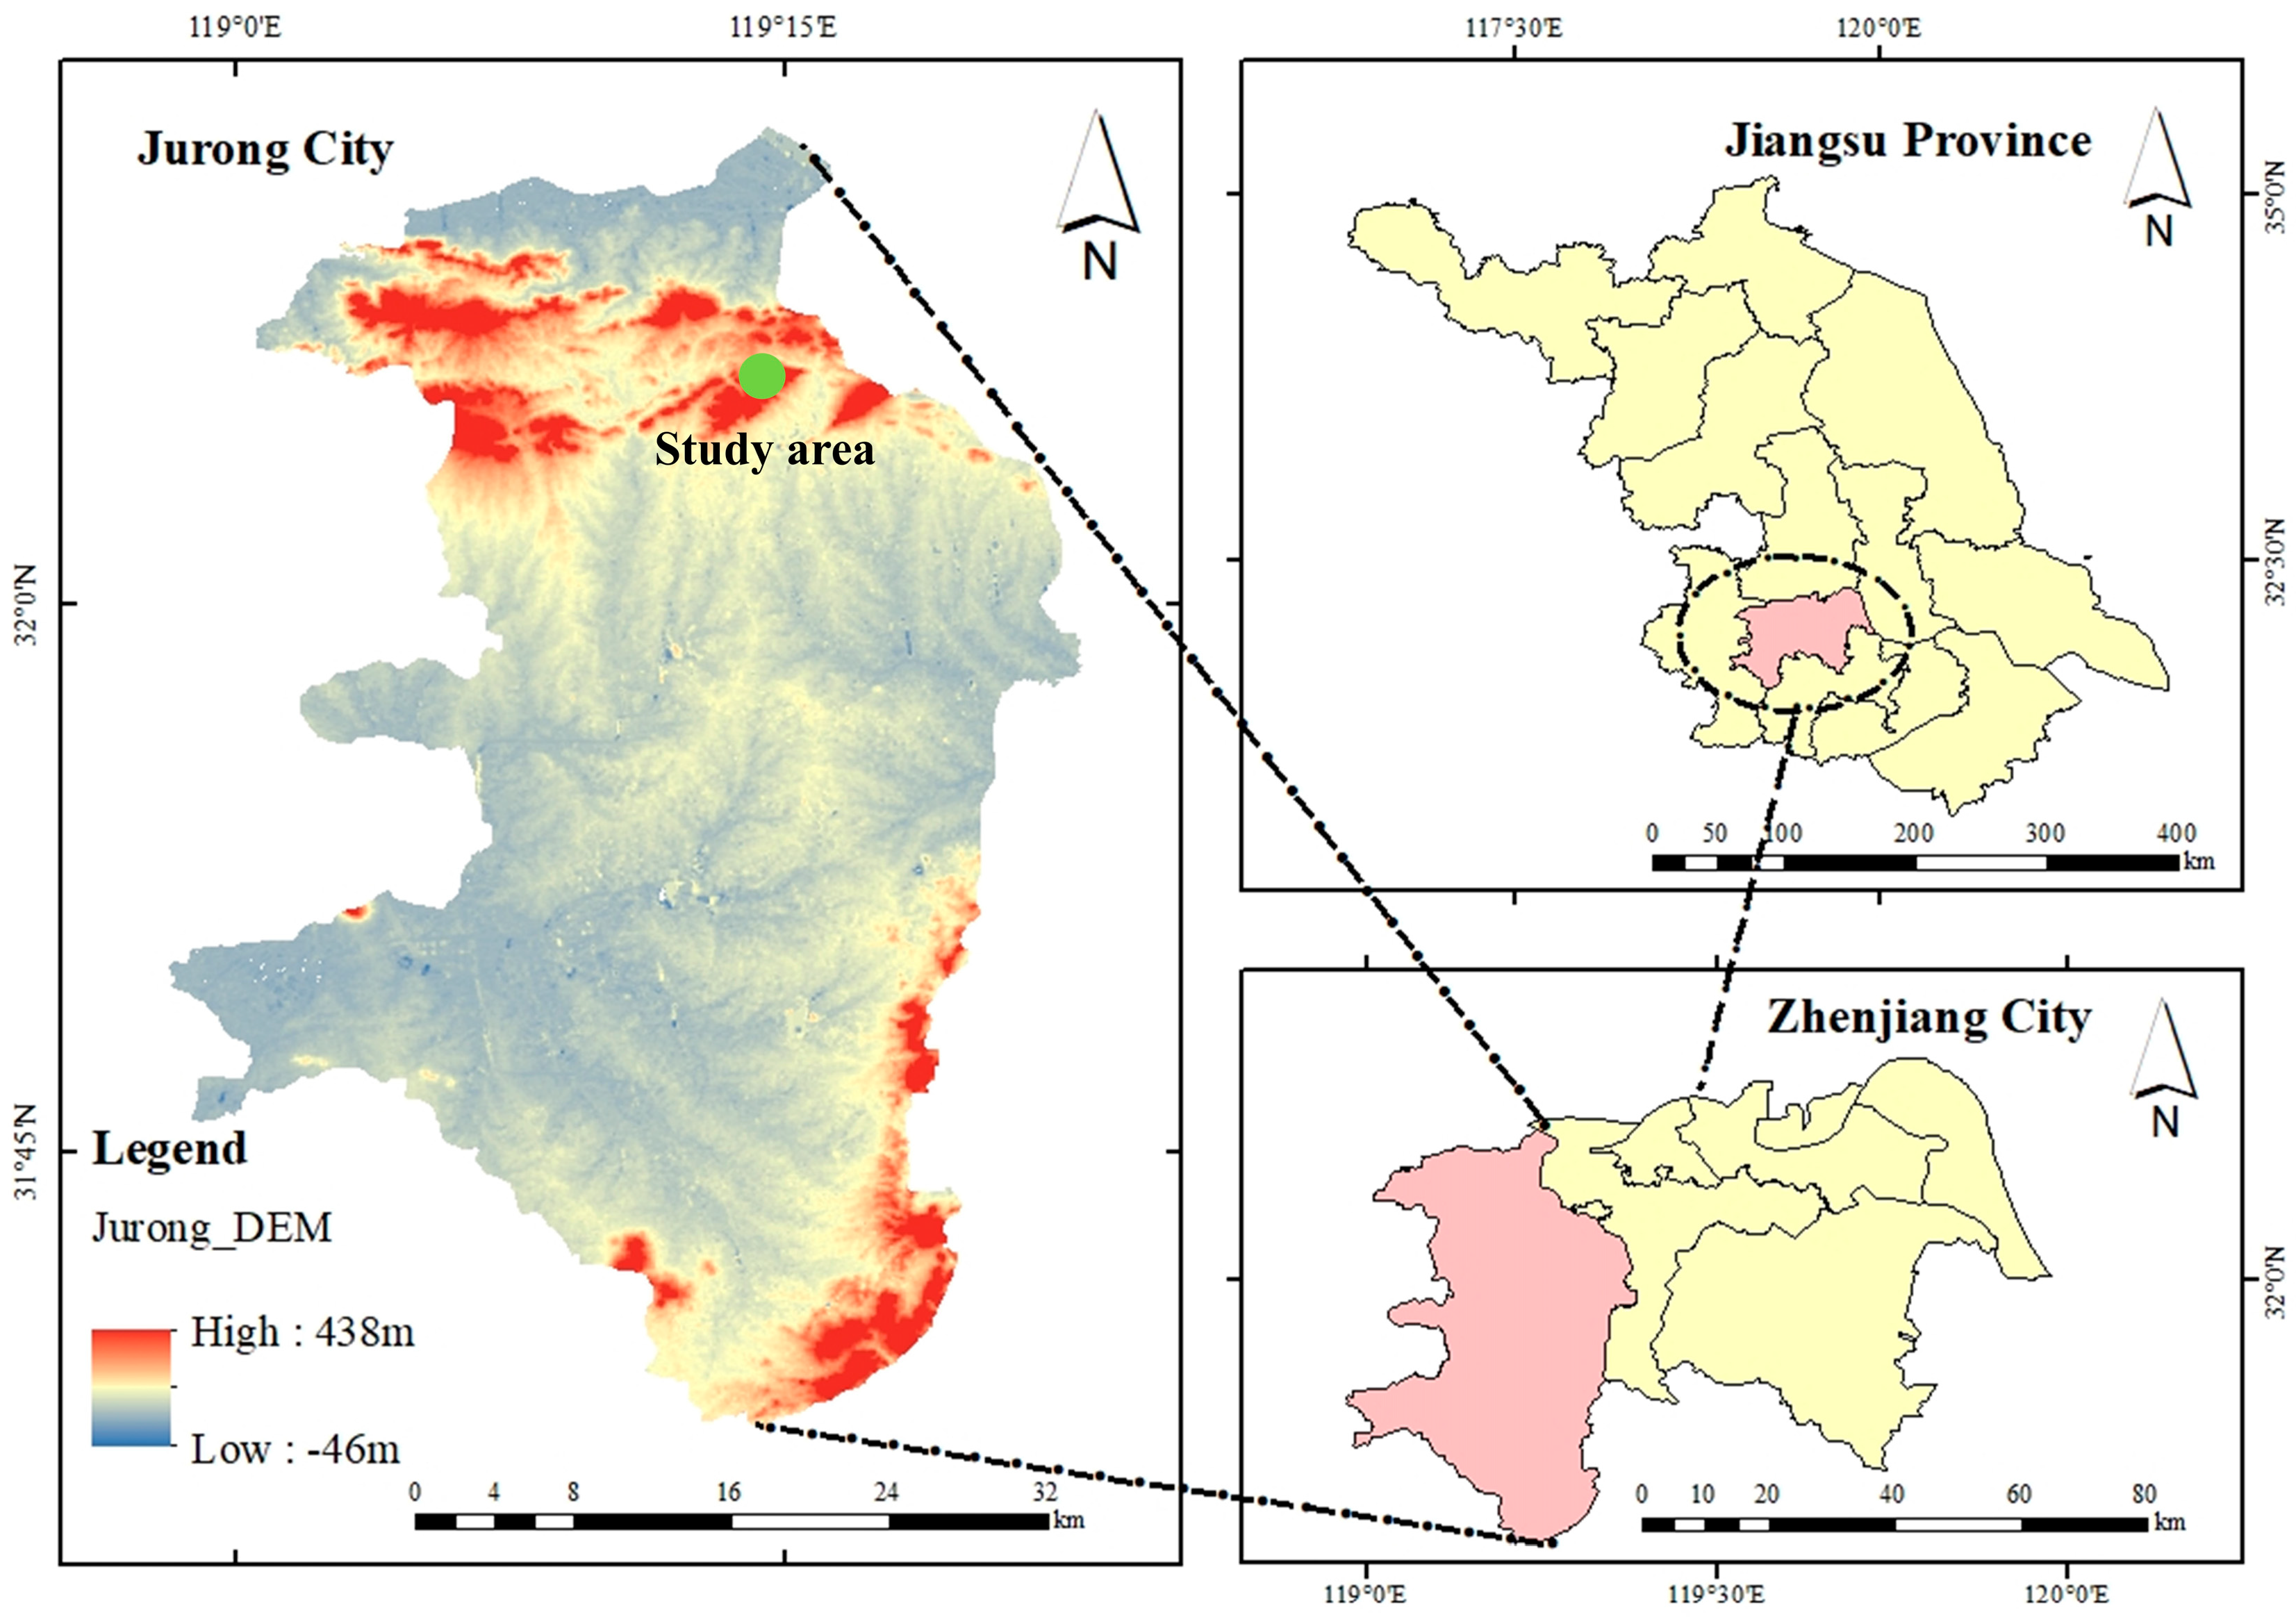
2.1. The Study Area

The research site is located in Xiashu Forest Farm (32°12′ N, 119°14′ E), which is in the eastern part of Jurong Town, Zhenjiang City, Jiangsu Province (Figure 1). The forest farm covers 389.10 hm2 and belongs to the northern subtropical monsoon climate. The average temperature in recent years is 15.2 °C [25]. Soil water is more likely to enter deep soil in summer and early autumn because of the seasonal dynamics of soil water flow. However, the water repellency of soil is enhanced by freezing and thawing conditions, making it difficult for water to enter deep soil in winter [8].
We conducted the experiments in October 2021, which was early autumn in this area. In October, the highest average temperature is 22 °C, the lowest average temperature is 14 °C, and the total precipitation is 45.7 mm. According to the Harmonized World Soil Database (HWSD) and World Reference Base for Soil Resources (WRB), the main soil type in this area is Haplic Luvisol, characterized by yellow–brown soil [25]. The soil is classified as silty loam [9] and the vegetation of the forest farm is a typical subtropical deciduous broad-leaved mixed forest. There are large areas of planted forest in the Xiashu Forest Farm, and forest managers often spray insecticides for pest control. Therefore, it is important to study the impact of soil physical properties at this location on water permeability.

2.2. Soil Sample Collection

Three typical subtropical stands (oak forest, pine forest, and bamboo forest) were selected in the study area, and three experimental plots (20 × 20 m) were established in each stand. A five-point sampling method was used for each plot. We then selected the digging locations at the designated sampling points and obtained the soil profiles. The samples in the soil layers were obtained according to the profile level. We used ring knives (diameter, 7 cm; height, 10 cm) to obtain soil samples with an intact structure at soil depths of 0–10 cm, 10–20 cm, 20–30 cm, 30–40 cm, and 40–50 cm because soil-forming parent material was present at soil depths >50 cm and thus difficult to sample. Another collection of soil samples was used to measure the content of soil organic carbon.

2.3. Soil Physical Properties Measurement

There is a strong relationship between the soil physical properties and the height of the ring knife [26], and the results of the soil cores obtained from the 10 cm ring cutter were acceptable [27]. The soil bulk density (SBD), soil total porosity (STP), soil capillary porosity (SCP), and soil non-capillary porosity (SNCP) were measured using the cutting ring method, and the initial soil water content (ISWC, %), saturated water capacity (SWC, g kg−1), capillary water holding capacity (CWC, g kg−1), and soil field capacity (SFC, g kg−1) were determined using the drying method [28].
We removed and weighed the ring knife (Wcr, g) containing the soil cores (accurate to 0.01 g) and recorded the results (W1, g). The sample was placed in a flat-bottomed pan covered with dry sand and left to stand for 12 h. At this stage, all non-capillary pores and capillary pores in the soil were filled with water and immediately weighed, and their weight was recorded (W2, g). We then placed a ring knife containing wet soil (having fully absorbed water) on dry sand and left it to stand for 2 h. By this time, the water in the non-capillary pores of the soil in the ring knife had flowed out, but the capillary pores of the soil in the ring knife were still filled with water. The sample weight was measured and recorded (W3, g). Next, the sample was placed in a flat-bottomed pan covered with dry sand and left to stand for 24 h. At this stage, the soil water in the ring knife was the remaining capillary water. The sample was immediately weighed and the weight was recorded (W4, g). Finally, we placed the ring knife containing wet soil in an oven at 105 °C for 48 h to obtain the weight of the ring knife with dry soil (W5, g).
Initial   soil   water   content   ( % ) = W 1 W 5   W 1 W c r × 100
Soil   bulk   density   ( g   cm 3 ) = W 5 W c r V
Saturated   water   capacity   ( g   kg 1 ) = W 2 W 5 W 5 W c r × 1000
Capillary   water   holding   capacity   ( g   kg 1 ) = W 3 W 5 W 5 W c r × 1000
Soil   field   capacity   ( g   kg 1 ) = W 4 W 5 W 5 W c r × 1000
Total   soil   porosity   ( % ) = W 2 W 5 W c r V × 100
Soil   capillary   porosity   ( % ) = W 3 W 5 W c r     V × 100
Soil non-capillary porosity (%) = STP − SCP
According to the US classification standards, the soil particles were categorized as clay (0.002–0.02 mm), silt (0.02–0.05 mm), and sand (0.05–0.2 mm) [29].
We determined the SOC via dichromate oxidation colorimetry. After a series of pre-treatment and calibration curve plotting, the sample was carefully added to a 100 mL glass-stoppered ablation tube to avoid staining the walls. Amounts of 0.1 g of mercuric sulfate and 5.00 mL of potassium dichromate were added, and the sample was shaken well. Next, 7.5 mL of sulfuric acid was slowly added, and the sample was shaken gently. The thermostatic heater was turned on and set to 135 °C for digestion, cooling, and volume setting. We allowed the sample solution to stand for 1 h, placed about 80 mL of the supernatant into a centrifuge tube at 2000 r/min, performed centrifugal separation for 10 min, and then let it stand until clarification. Finally, we collected the supernatant and measured its absorbance.
M 1   ( g )   =   W d m 100 × m
ω oc   ( % )   =   A A 0 a b × M 1 × 1000 × 1000
where
  • M1: mass of dry matter in the sample, g;
  • m: amount of sample taken from the specimen, g;
  • Wdm: dry matter content of the soil, %;
  • ωoc: content of organic carbon in the soil sample, %;
  • A: absorbance of the sample abatement solution;
  • A0: absorbance of the blank test;
  • a: intercept of the calibration curve;
  • b: probability of the calibration curve.

2.4. Soil Infiltration Rate Measurement

2.4.1. Initial Infiltration Rate

The experiment started when the first drop of the undisturbed soil sample was dropped. We measured the initial infiltration volume (V1) and recorded the interval of first receiving the effluent (T1). In this study, the initial infiltration rate was considered as the initial infiltration rate.
Initial   Infiltration   Rate = V 1 S × T 1 ,   ( mm / min )

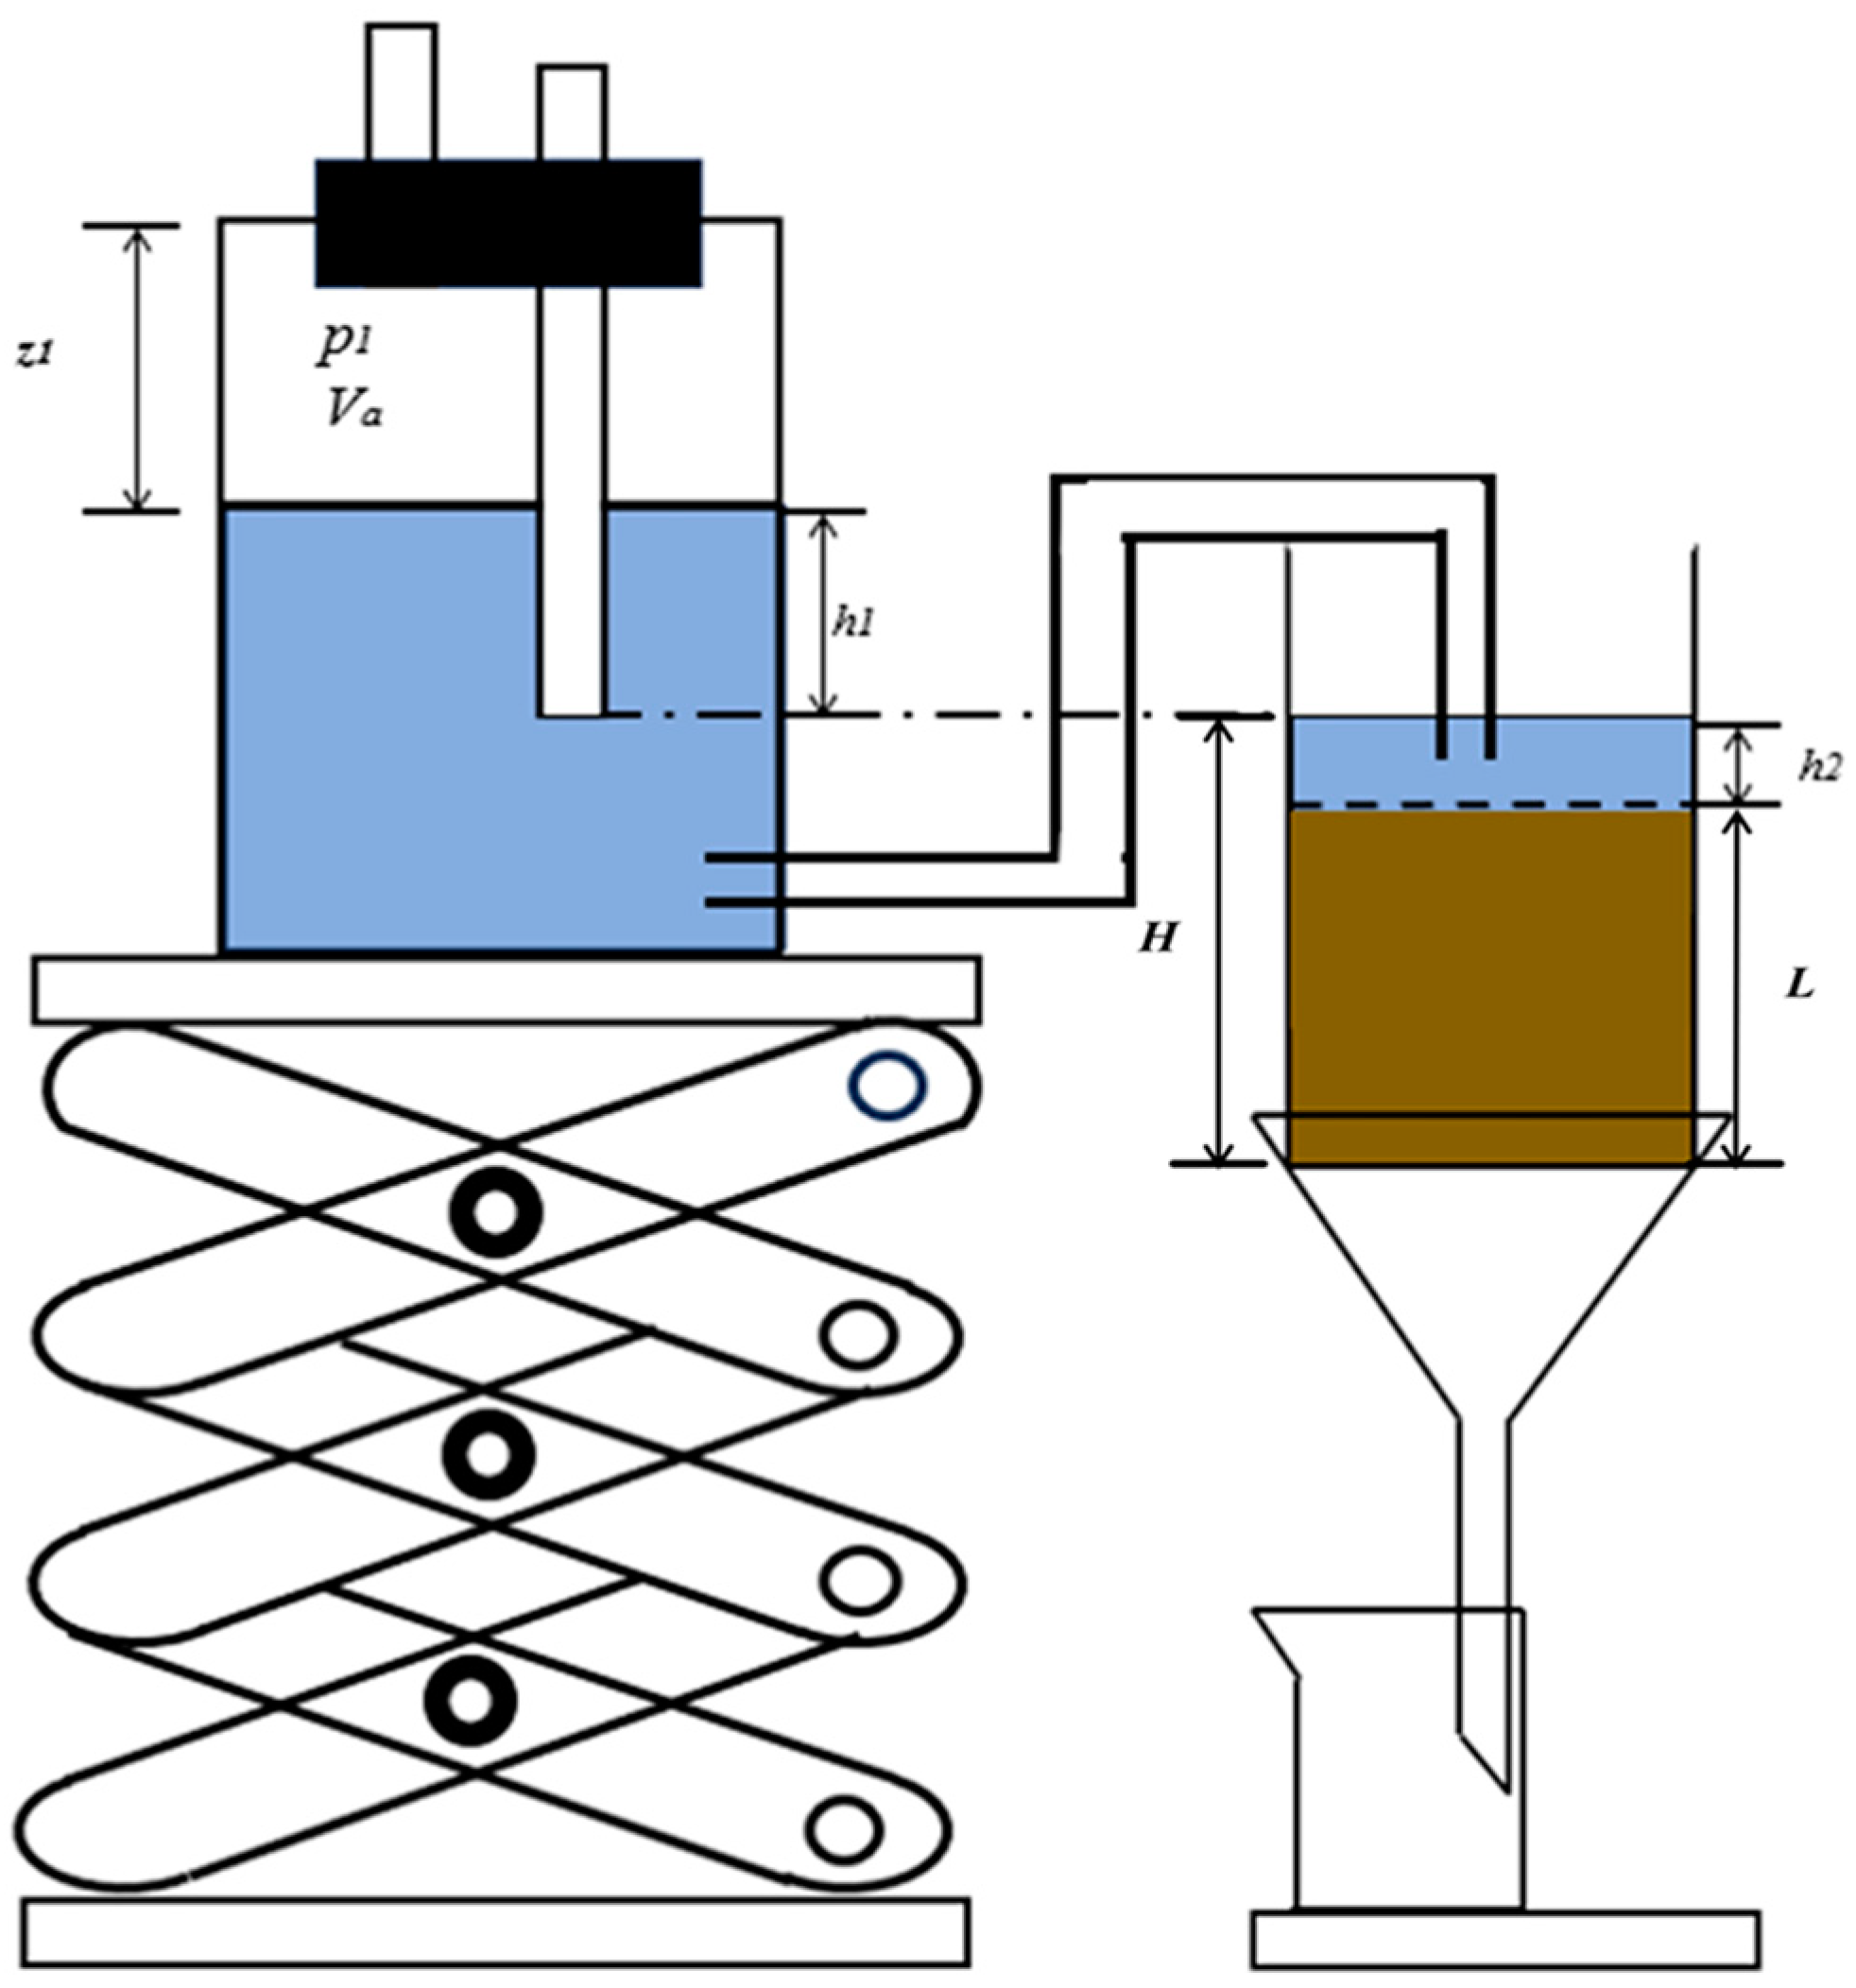
2.4.2. Saturated Hydraulic Conductivity at 10 °C

The water flow velocity through the unit soil cross-sectional area perpendicular to the water flow direction was obtained according to Darcy’s law under a unit water pressure gradient [30,31]. We measured the thickness of the saturated soil layer (L, cm), cross-sectional area of the ring cutter (S, cm2), amount of water (Q, cm3), thickness of the water layer (H, cm), and time (T, s) (Figure 2). The formula used was as follows:
K s = Q × L / ( S × T × H ) ,   ( cm / min )
The measured saturated hydraulic conductivity was uniformly converted into 10 °C saturated hydraulic conductivity according to the Rulin formula to facilitate comparison.
K 10 = K s 0.7 + 0.03 t ,   ( cm / min )

2.5. Data Analysis

In this study, the data for the soil physical properties and infiltration index were analyzed using the IBM SPSS Statistics version 27.0. Charts were drawn using the Origin software version 2017. The data for the soil physical and chemical properties and soil infiltration index were detected and analyzed via one-way analysis of variance (ANOVA), and the relationship between the soil physical properties and soil infiltration index was studied via a significance test and correlation analysis. There was no significant difference when p > 0.05; however, there was a significant difference when p < 0.05. The redundancy analysis (RDA) of the soil physical properties and soil infiltration index were carried out using Origin 2017, and the structural equation model (SEM) was constructed using the IBM SPSS Amos 26 Graphics platform to determine the soil physical properties that dominated the soil water infiltration process. The following indices were used to evaluate the model accuracy: Chi-square, RMSEA, Normed Fit Index (NFI), Comparative Fit Index (CFI), Goodness of Fit Index (GFI), and Incremental Fit Index (IFI) [32]. Chi-square values can be used to assess the overall model fit by obtaining the size of the difference between the assessment sample and the fitted covariance matrix [33]. The RMSEA is the degree of fit of the model to the overall covariance matrix when the parameter estimates are unknown but optimized [34]. The NFI assesses the model by comparing the χ2 value of the model to the χ2 of the null model, which is the worst case, in which all measured variables are uncorrelated [35]. The CFI is a modified form of the NFI based on what is still applicable when sample sizes are small, and the GFI is an alternative to the chi-square test and calculates the proportion of variance that is accounted for by the estimated population covariance [36]. In addition, if the values of the IFI, NNFI, GFI, and CFI indices are >0.9, and the value of the RMSEA is <0.05, the model fit will be good [37].

3. Results

3.1. Comparison of Soil Physical Properties of Different Stands

Table S1 shows the soil particle properties under three stands in the study area. The soil in the three stands was silty loam. The content of sand particles was as follows: bamboo forest (18.70 ± 6.09) > oak forest (14.11 ± 8.31) > pine forest (12.05 ± 4.47). The content of clay particles in the entire soil layer was the largest in the bamboo forest (1.76 ± 0.90), followed by the oak forest (1.16 ± 0.51) and pine forest (1.09 ± 0.65) (Table S1). The content of silt particles was as follows: pine forest (86.85 ± 4.28%) > oak forest (84.73 ± 8.04%) > bamboo forest (79.54 ± 6.16%), among which there was a significant difference between the pine and bamboo forests (p < 0.05), while there was no significant difference between the bamboo and oak forests (p > 0.05) (Table S1). The results show that the SBD of the three stands increased with the soil depth. The SBD in the entire soil profile was the largest in the oak forest (1.33 ± 0.04 g cm−3), followed by the pine forest (1.29 ± 0.09 g cm−3) and bamboo forest (1.26 ± 0.09 g cm−3) (Table S1). SBD was not significantly affected by forest type (p > 0.05). The STP, SCP, and SNCP values of the three forests decreased with increasing soil depth. The bamboo forest had the largest STP and SNCP across the entire soil profile, while the oak forest had the smallest STP, SCP, and SNCP (Table S1).
The ISWC decreased with increasing soil depth in the pine and oak forests, while it increased in the bamboo forest. The CMC, SWC, SFC, and SOC showed a decreasing trend with increasing soil depth in all three forests. The CMC, SWC, and SFC in the entire soil profile decreased in the following order: pine forest > bamboo forest > oak forest (Table S1). The CMC in the oak forest showed significant differences between the bamboo and pine forests (p < 0.05), while there were no significant differences between bamboo and pine forests (p > 0.05). The SWC in the entire soil profile was the largest in the bamboo forest (398.49 ± 72.21 g kg−1) and the smallest (319.29 ± 12.97 g kg−1) in the oak forest (Table S1).

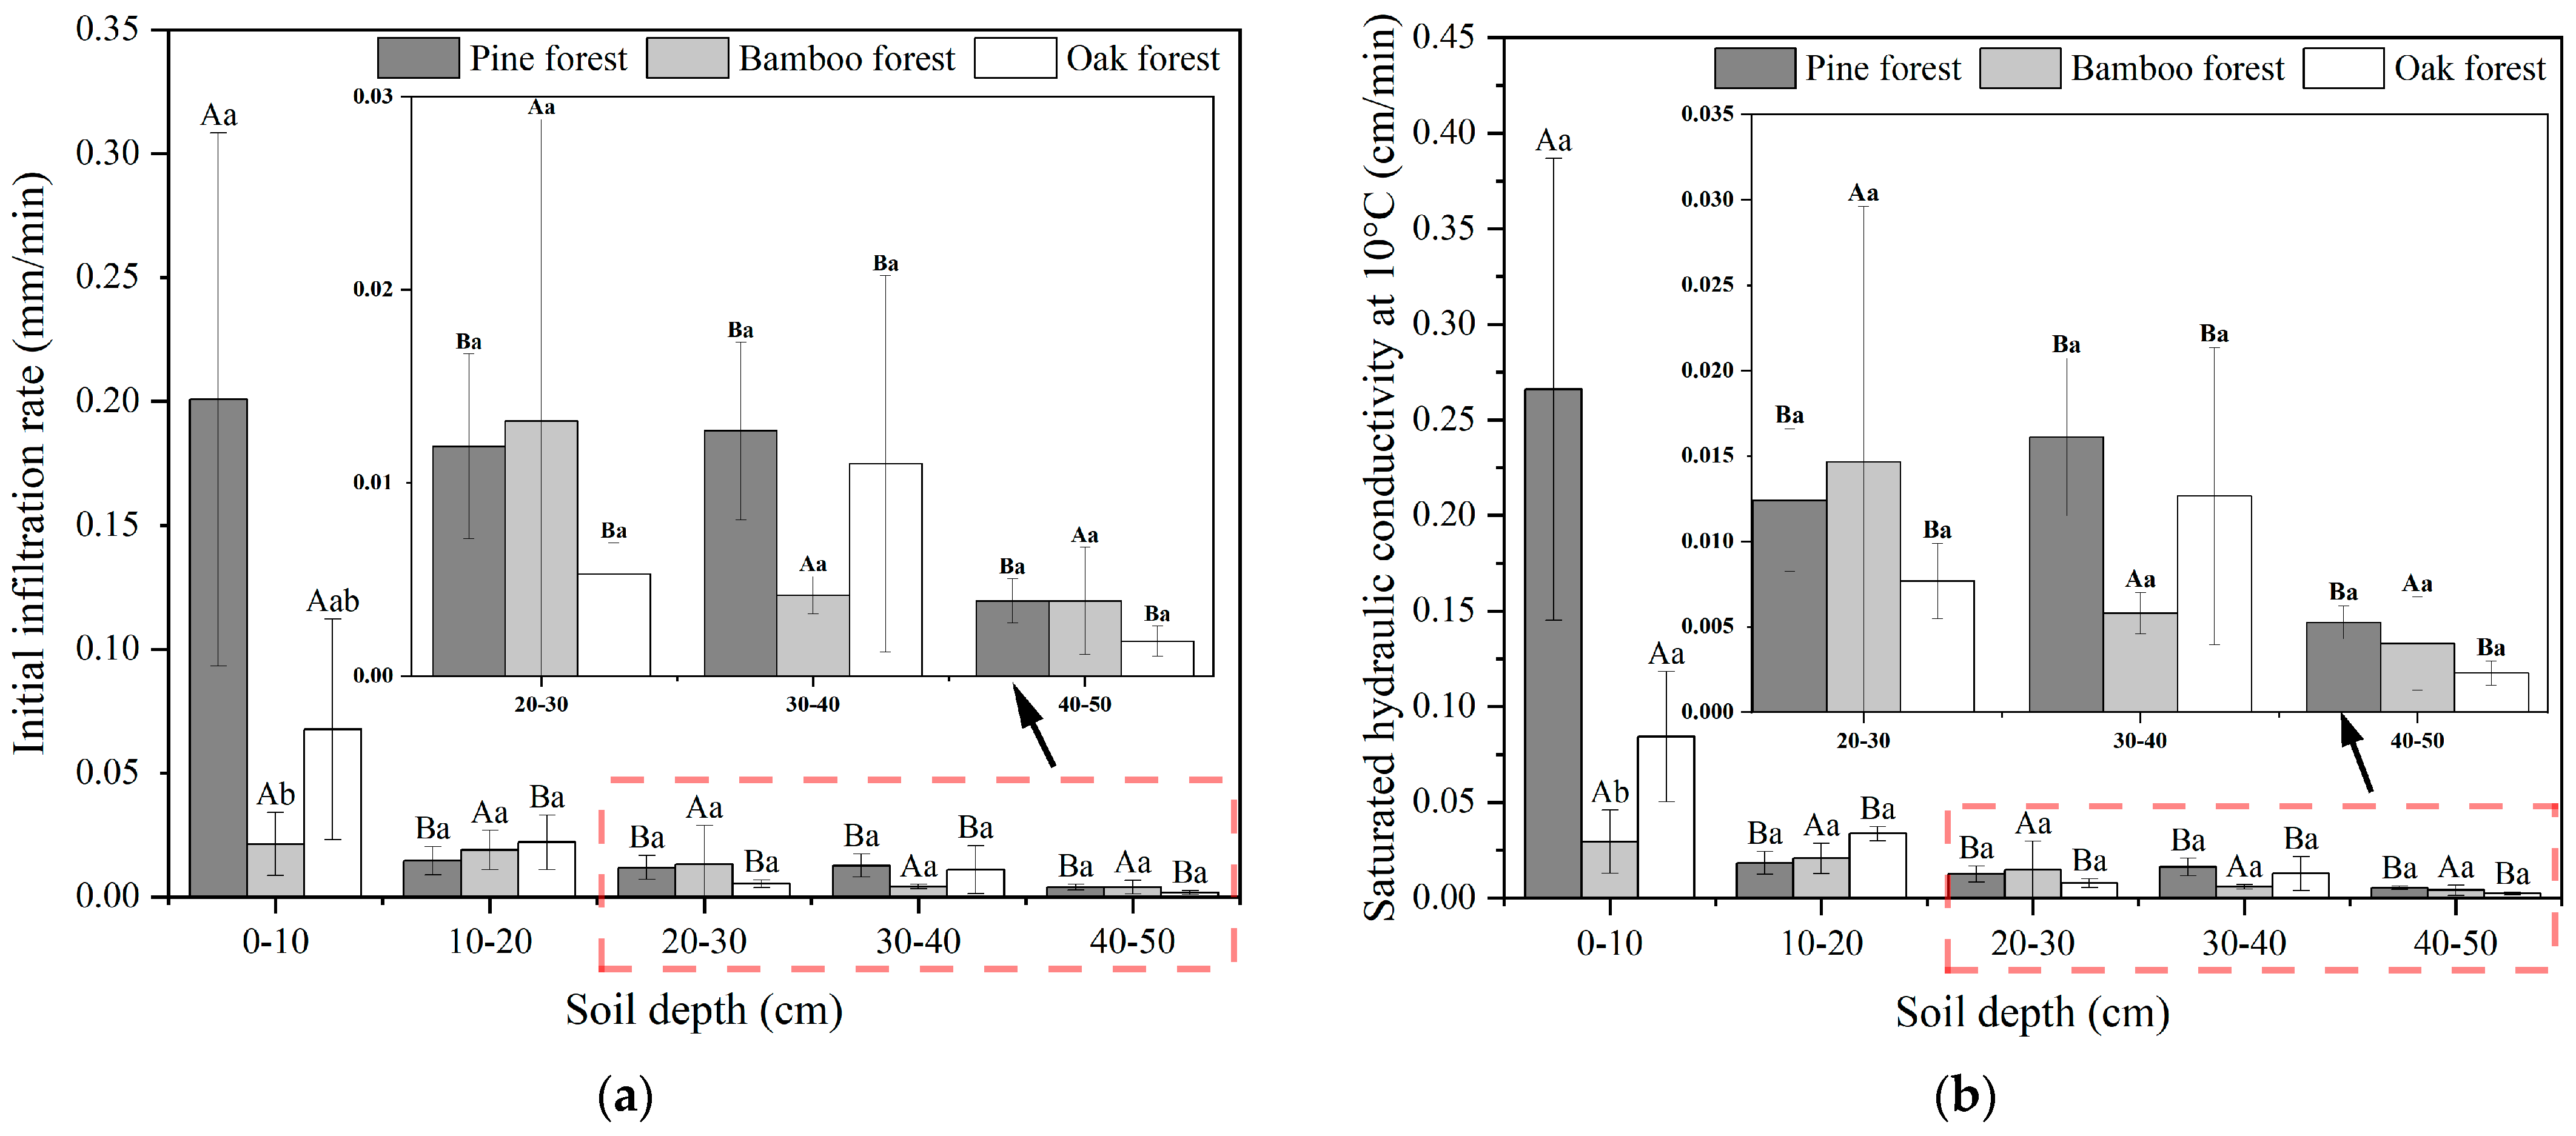
3.2. Variation Characteristics of Soil Infiltration Properties

The IIR and Ks values in the entire soil profile of the pine forest were higher than those of the oak and bamboo forests (Table S2). The pine forest had the largest soil infiltration properties (IIR and Ks) in the soil surface (0–10 cm) and was significantly larger than the bamboo forest (p < 0.05), while there was no significant difference between the three forests at the soil depth of 30–50 cm (p > 0.05). The IIR and Ks values at the soil surface (0–10 cm) in the pine and oak forests were significantly different from those in the other soil layers (p < 0.05). In the bamboo forest, there were no significant differences in the IIR and Ks values in the different soil layers (p > 0.05) (Figure 3).

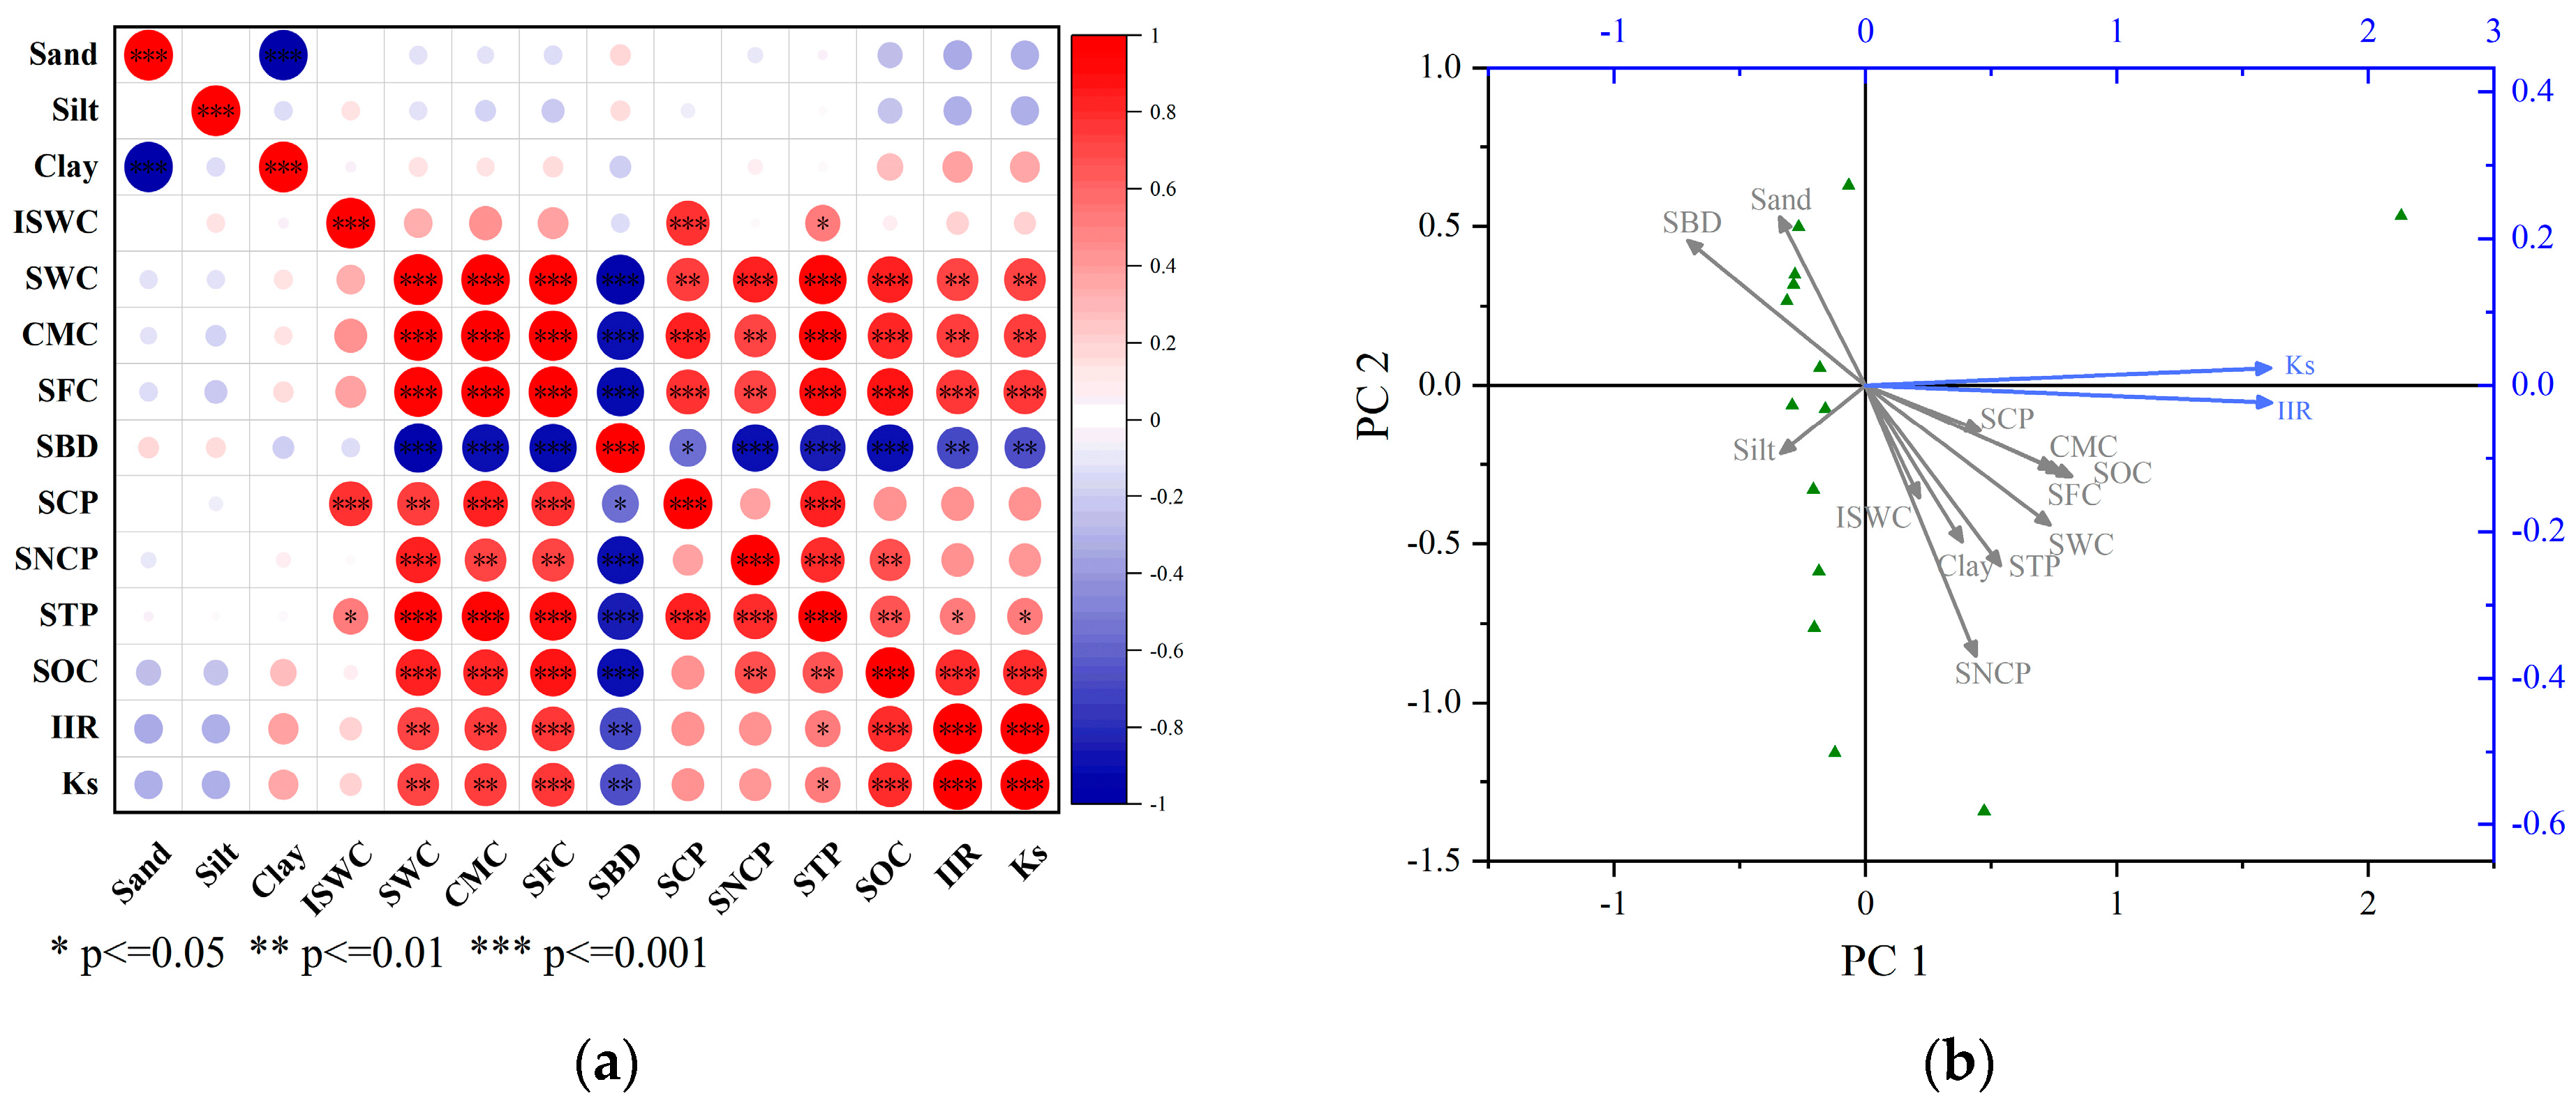
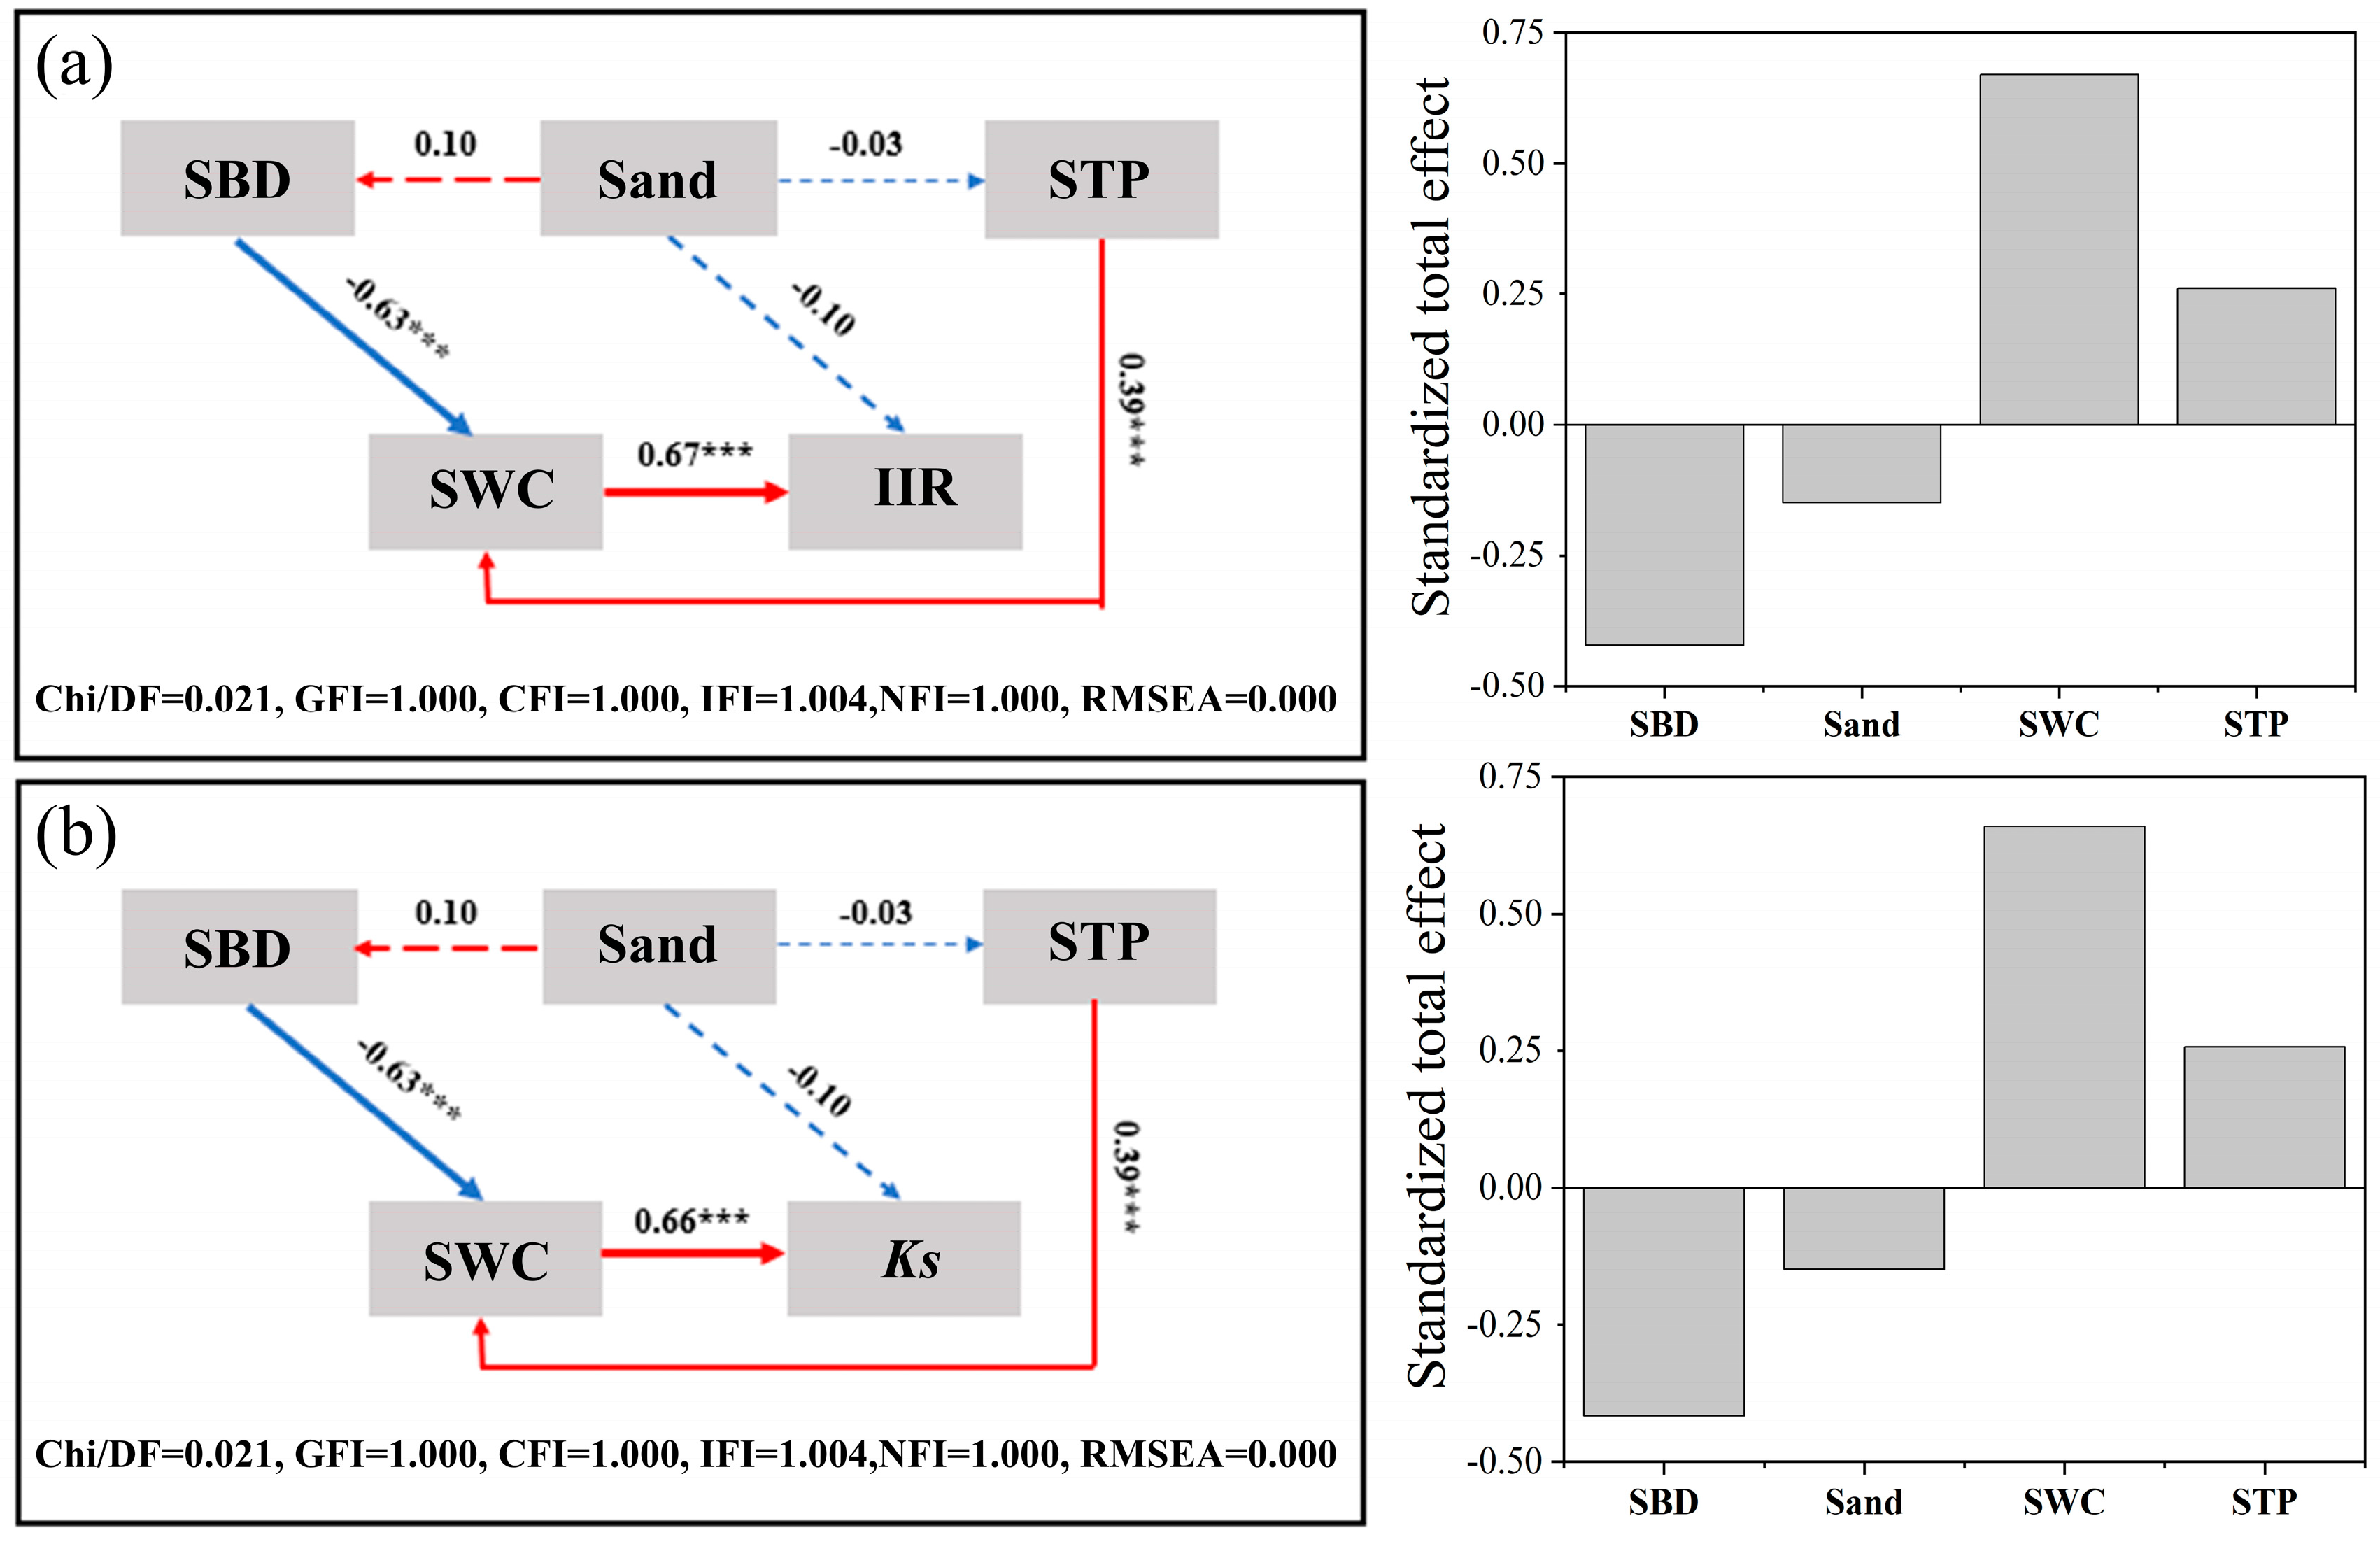
3.3. Effects of Soil Physical Properties on Soil Infiltration Ability

A redundancy analysis (RDA) was used to indicate the relative importance of soil physical properties in explaining the variability of soil infiltration properties (IIR and Ks). According to the RDA, the first component (PC1) amounted to 57.63% of the overall variability in the components and was mainly influenced by the CMC, SWC, SFC, SBD, and STP; the clay and sand content and ISWC dominated the second component (PC2) and amounted to 18.70% of the overall variability in the components; and the ISWC majorly impacted the third component (PC3) (Figure 4). Therefore, through the RDA, we confirmed that the main physical properties of soil infiltration are the content of sand, the CMC, and the ISWC. On the basis of the RDA, the interpretation of soil infiltration properties was mainly influenced by the SWC (0.73), CMC (0.75), SFC (0.78), SBD (−0.708), SOC (0.82), and STP (0.54). A Pearson correlation analysis showed that the correlation between soil water infiltration properties and soil physical properties (SWC, CMC, SFC, and STP) were significantly positive (p < 0.05), while the correlation was significantly negative between them and SBD (p < 0.05) (Figure 4). Although the Pearson correlation analysis and the RDA revealed that each physical property contributed to the soil infiltration properties, they could not quantify the degree to which each factor impacted infiltration. Therefore, we implemented a structural equation model (SEM) to analyze the direct and indirect effects of the different factors on infiltration. Based on the results of Pearson’s correlation and RDA, we chose SWC and SBD, which dominate PC1, and sand, which dominates PC2, to establish the SEM. In addition, the STP, as a factor reflecting the connectivity of soil pores, was also involved in the SEM. According to the results of the SEM, the path coefficient between IIR and SWC was 0.670, and that between SWC and Ks was 0.660, respectively (Figure 5), indicating standardized direct and positive effects. The path coefficients represented the strength of the linkages between the two attributes, indicating a significantly positive correlation between the SWC and soil infiltration properties (p < 0.05). Therefore, we confirmed that the main positive driving factor was the SWC. In addition, the path coefficient between the STP and SWC was 0.390, indicating positive and indirect effects (0.250) between the STP and infiltration properties. The SEM analysis showed that the largest negative driver of the standardized total effect on the IIR was the SBD (TE = −0.422), followed by sand (TE = −0.150). Therefore, the positive drivers were the STP and SWC, and the negative drivers were the SBD and sand content. In addition, Ks had the same driver profile as IIR (Figure 5).

4. Discussion

There are many studies focusing on existing empirical infiltration models, like the Green–Ampt and Philip infiltration models [38,39,40], aiming to simplify the expression of soil infiltration; indeed, Ks is a key parameter in the Green–Ampt and Philip infiltration models. Therefore, it is essential to focus on the changes in SIPs in different forest ecosystems and explore (via SEM) the possible pathways influencing the main soil physical properties affecting SIPs.

4.1. Most Controlling Factors of SIPs

A previous study has shown that soil physical properties are closely related to soil infiltration properties [41]. In this study, the results show that the SBD is positively correlated with the sand content (Figure 4); this is because coarse-textured soils are more prone to a high bulk density [20]. However, we found that the SBD showed negative correlations with soil porosity properties and clay content (Figure 4), which is consistent with Orzech et al. [42]. An increase in the soil’s effective porosity creates favorable conditions for water infiltration [43]; however, a decrease in the soil’s total porosity leads to an increase in the SBD, which makes the soil more compact and finally reduces the porosity connectivity [44]. Thus, the SBD has an important negative influence on the soil water holding capacity and hydrological responses, which finally reduces the saturated hydraulic conductivity of the soil [45]. In this study, the clay content was positively correlated with soil organic matter (Figure 4); this is because the stabilizing and cementing properties of clay can physically protect the SOC, promote the development of permanent soil porosities, and increase their physical stability [20]. Many studies have shown that an increase in the SOC favors the formation of soil aggregates and a better soil structure [46], thus promoting soil infiltration capacity. For example, Zhu et al. showed that an increase in the SOC promoted an increase in the soil porosity and the improvement of soil aggregates and finally promoted the water conservation capacity of soil [47], which is consistent with our results. Thus, soil with a higher clay and SOC content may have better infiltration properties [20].
The SCP and SNCP were significantly positively correlated with SWC, CMC, and SFC (p < 0.05) (Figure 4). This is because the SCP can reflect the effective water storage capacity of the soil, and the size of the soil porosity has a direct impact on the soil water holding capacity and soil infiltration [48]. The SCP is positively correlated with the storage capacity of soil water. When the SCP is at a higher level, the proportion of water available for plant root growth is greater. The SNCP can help the precipitation infiltrate into the soil matrix more readily, which will affect the forest hydrological responses and soil infiltration [49]. The water in capillary pores can be retained for long periods and can be immediately provided to plant roots for absorption and evaporation [50].
In this study, although the three stands had different SWC and SFC values due to differences in stand characteristics [51], the results showed that the SWC and SFC both had highly and consistently positive effects on the soil water infiltration properties (Figure 4). In addition, via the SEM results, we found that the SWC had the highest positive effects (TE = 0.64) on SIPs (Figure 5), which was also indicated by Jiang et al. (2019) [52]. A high SWC and SFC indicate that the soil has more pore space to retain and pass water, which is supported by the significant positive relationship identified in this study between the soil water holding capacity (i.e., SWC, CMC, and SFC) and soil porosity properties (i.e., STP, SCP, and SNCP) (Figure 4).
Under conditions of better soil porosity connectivity, the SWC and SFC represent the capacity of the soil to contain water for infiltration, which corresponds to better performance. These results indicate that forest managers can promote soil infiltration properties by increasing soil porosity via, for example, reduced frequency of tillage and less tillage. This study demonstrates that the sand content had a negative effect on the soil infiltration properties, which is consistent with the results of Basset et al. [20], i.e., that coarser-textured soils were more likely to produce higher packing densities compared to finer-textured soils and are thus usually denser. However, some researchers have also suggested that a higher sand content leads to higher porosity connectivity, which in turn promotes soil water infiltration [53]. In this study on the positive effect of clay content on SIPs at a normal temperature (12~22 °C), the results showed that the content of clay (1.09%–1.76%) in the three stands does not pose a barrier to infiltration and that the soil clay content was positively correlated with the SIPs (Figure 4). This is because the stabilizing and cementing properties of clay can physically protect the SOC, promote the development of permanent soil porosities, and increase their physical stability [20]. Thus, soils with higher SOC content may have better infiltration properties [20].

4.2. Implication

Natural secondary forests in this study area in Jiangsu Province are located in a transition region between warm temperate and subtropical zones with more favorable climatic conditions for bamboo to survive, and this area is currently experiencing the effects of bamboo invasion [54,55]. Bamboo has a well-developed whip in the soil, showing a network that allows it to access more soil and water resources [56] and facilitates the rapid adaptation of bamboo forests to different habitats via reproduction and invasion. Moreover, bamboo forests had the poorest water infiltration properties of the three forest stands chosen for this research; therefore, local managers need to be alert to the adverse effects of bamboo invasion on soil physical properties [57], which, in turn, threatens the growth of other stands, thus reducing the risk of soil erosion. Forest managers can increase soil porosity by increasing the variety of vegetation types and improving the stand structure to form more root-dominated pore structures that form fine soil particles, thus further improving soil water infiltration properties [58]. In addition, forest managers can cut off the spreading path of bamboo whips by digging trenches to isolate them and filling the trenches with water to stop the invasion of bamboo. Therefore, bamboo could be restricted with physical barriers so as to limit invasion [59].

5. Conclusions

Soil infiltration properties in different forests are essential for forest hydrological effects in subtropical forest ecosystems. In this study, oak, pine, and bamboo forests were selected to investigate the characteristics of soil physical properties and infiltration properties. In addition, the pathways by which the soil physical properties affect the soil infiltration properties were explored. The results indicate that the bamboo forest had the worst soil water infiltration properties, while the pine forest showed the opposite result. The soil physical properties that mainly drive soil water infiltration are saturated water capacity and soil total porosity, and those that mainly reduce infiltration are sand content and soil bulk density. Soil bulk density and sand content can indirectly influence soil infiltration properties through soil total porosity and saturated water capacity.

Supplementary Materials

The following supporting information can be downloaded at: https://www.mdpi.com/article/10.3390/f15081470/s1, Table S1: Soil physical properties in different soil layers. Table S2: Soil infiltration properties in different stands.

Author Contributions

D.W.: Conceptualization, Methodology, Software, Data analysis, Visualization, Writing—original draft and editing. J.C.: Methodology, Data analysis, Project administration. Z.T.: Methodology, Software, Visualization, Writing—review, and editing. Y.Z.: Conceptualization, Project administration, Conceptualization, Writing—review, and editing. All authors have read and agreed to the published version of the manuscript.

Funding

This research was supported by the National College Students Innovation and Entrepreneurship Training Program (202310298003Z), the National Natural Science Foundation of China (41907007), and the Natural Science Foundation of Jiangsu Province (BK20190747).

Data Availability Statement

Data are contained within the article.

Conflicts of Interest

The authors declare no conflicts of interest.

References

  1. Tiemann, A.; Ring, I. Towards ecosystem service assessment: Developing biophysical indicators for forest ecosystem services. Ecol. Indic. 2022, 137, 108704. [Google Scholar] [CrossRef]
  2. Wu, G.-L.; Cui, Z.; Huang, Z. Contribution of root decay process on soil infiltration capacity and soil water replenishment of planted forestland in semi-arid regions. Geoderma 2021, 404, 115289. [Google Scholar] [CrossRef]
  3. Yin, X.; Zhao, L.; Fang, Q.; Zi, R.; Fang, F.; Fan, C.; Ding, G. Effects of biochar on runoff generation, soil and nutrient loss at the surface and underground on the soil-mantled karst slopes. Sci. Total Environ. 2023, 889, 164081. [Google Scholar] [CrossRef] [PubMed]
  4. Yin, C.; Zhao, W.; Pereira, P. Soil conservation service underpins sustainable development goals. Glob. Ecol. Conserv. 2022, 33, e01974. [Google Scholar] [CrossRef]
  5. Bashir, S.; Javed, A.; Bibi, I.; Ahmad, N. Soil and Water Conservation; Pakistan, University of Agriculture: Faisalabad, Pakistan, 2017; pp. 263–286. [Google Scholar]
  6. Wang, Q.; Li, F.; Zhao, X.; Zhao, W.; Zhang, D.; Zhou, X.; Sample, D.J.; Wang, X.; Liu, Q.; Li, X.; et al. Runoff and nutrient losses in alfalfa (Medicago sativa L) production with tied-ridge-furrow rainwater harvesting on sloping land. Int. Soil Water Conserv. Res. 2022, 10, 308–323. [Google Scholar]
  7. Lu, J.; Zhang, Q.; Werner, A.D.; Li, Y.; Jiang, S.; Tan, Z. Root-induced changes of soil hydraulic properties—A review. J. Hydrol. 2020, 589, 125203. [Google Scholar] [CrossRef]
  8. Zhang, Y.; Tang, Z.; Zhang, J.; Zhang, Z.; Zhang, M. Visualizing preferential flow paths using dye tracer and species diversity theory methods to explore their correlation to soil properties with random forest algorithm. J. Hydrol. 2024, 638, 131570. [Google Scholar] [CrossRef]
  9. Tang, Z.; Zhang, W.; Chen, J.; Wang, L.; Zhang, Y. Contributions of soil organic carbon-induced root- and soil properties complexity to water flow in eastern China. Sci. Total Environ. 2024, 945, 174125. [Google Scholar] [CrossRef] [PubMed]
  10. Ma, Y.; Liu, Y.; Tian, L.; Yang, Y.; Long, Y.; Lei, M.; Zhang, Z.; Li, Q.; Zhu, H.; Li, Z. Effects of rainfall pattern and soil surface roughness on surface–subsurface hydrological response and particle size distribution of red soil slope. CATENA 2023, 232, 107422. [Google Scholar] [CrossRef]
  11. Dharmawan, I.W.S.; Pratiwi; Siregar, C.A.; Narendra, B.H.; Undaharta, N.K.E.; Sitepu, B.S.; Sukmana, A.; Wiratmoko, M.D.E.; Abywijaya, I.K.; Sari, N. Implementation of Soil and Water Conservation in Indonesia and Its Impacts on Biodiversity, Hydrology, Soil Erosion and Microclimate. Appl. Sci. 2023, 13, 7648. [Google Scholar] [CrossRef]
  12. Abiye, W. Soil and water conservation nexus agricultural productivity in ethiopia. Adv. Agric. 2022, 2022, 8611733. [Google Scholar] [CrossRef]
  13. He, Z.; Jia, G.; Liu, Z.; Zhang, Z.; Yu, X.; Xiao, P. Field studies on the influence of rainfall intensity, vegetation cover and slope length on soil moisture infiltration on typical watersheds of the Loess Plateau, China. Hydrol. Process. 2020, 34, 4904–4919. [Google Scholar] [CrossRef]
  14. Zhu, P.; Zhang, G.; Yang, Y.; Wang, C.; Chen, S.; Wan, Y. Infiltration properties affected by slope position on cropped hillslopes. Geoderma 2023, 432, 116379. [Google Scholar]
  15. Hui, X.; Zhao, H.; Zhang, H.; Wang, W.; Wang, J.; Yan, H. Specific power or droplet shear stress: Which is the primary cause of soil erosion under low-pressure sprinklers? Agric. Water Manag. 2023, 286, 108376. [Google Scholar] [CrossRef]
  16. Filipović, V.; Defterdarović, J.; Šimůnek, J.; Filipović, L.; Ondrašek, G.; Romić, D.; Bogunović, I.; Mustać, I.; Ćurić, J.; Kodešová, R. Estimation of vineyard soil structure and preferential flow using dye tracer, X-ray tomography, and numerical simulations. Geoderma 2020, 380, 114699. [Google Scholar]
  17. Ju, X.; Gao, L.; She, D.; Jia, Y.; Pang, Z.; Wang, Y. Impacts of the soil pore structure on infiltration characteristics at the profile scale in the red soil region. Soil Tillage Res. 2024, 236, 105922. [Google Scholar] [CrossRef]
  18. Liu, S.; Li, S.; Liu, J. Jurin’s law revisited: Exact meniscus shape and column height. Eur. Phys. J. E 2018, 41, 46. [Google Scholar] [CrossRef]
  19. Rasse, D.P.; Smucker, A.J.M.; Santos, D. Alfalfa root and shoot mulching effects on soil hydraulic properties and aggregation. Soil Sci. Soc. Am. J. 2000, 64, 725–731. [Google Scholar] [CrossRef]
  20. Basset, C.; Abou Najm, M.; Ghezzehei, T.; Hao, X.; Daccache, A. How does soil structure affect water infiltration? A meta-data systematic review. Soil Tillage Res. 2023, 226, 105577. [Google Scholar]
  21. Fu, T.; Gao, H.; Liang, H.; Liu, J. Controlling factors of soil saturated hydraulic conductivity in Taihang Mountain Region, northern China. Geoderma Reg. 2021, 26, e00417. [Google Scholar] [CrossRef]
  22. Delgado-Baquerizo, M.; Reich, P.B.; Trivedi, C.; Eldridge, D.J.; Abades, S.; Alfaro, F.D.; Bastida, F.; Berhe, A.A.; Cutler, N.A.; Gallardo, A.; et al. Multiple elements of soil biodiversity drive ecosystem functions across biomes. Nat. Ecol. Evol. 2020, 4, 210–220. [Google Scholar] [CrossRef] [PubMed]
  23. Malaeb, Z.A.; Summers, J.K.; Pugesek, B.H. Using structural equation modeling to investigate relationships among ecological variables. Environ. Ecol. Stat. 2000, 7, 93–111. [Google Scholar] [CrossRef]
  24. Zhu, P.; Zhang, G.; Wang, C.; Chen, S.; Wan, Y. Variation in soil infiltration properties under different land use/cover in the black soil region of Northeast China. Int. Soil Water Conserv. Res. 2024, 12, 379–387. [Google Scholar] [CrossRef]
  25. Tang, Y.; Liu, X.; Lian, J.; Cheng, X.; Wang, G.G.; Zhang, J. Soil Depth Can Modify the Contribution of Root System Architecture to the Root Decomposition Rate. Forests 2023, 14, 1092. [Google Scholar] [CrossRef]
  26. Smagin, A.V.; Khakimova, G.M.; Khineeva, D.A.; Sadovnikova, N.B. Gravity factor of the formation of the field and capillary water capacities in soils and artificial layered soil-like bodies. Eurasian Soil Sci. 2008, 41, 1189–1197. [Google Scholar] [CrossRef]
  27. Zhang, W.; Wang, L.; Tang, Z.; Zhang, Y. Effects of the root system architecture of Pinus taeda and Phyllostachys edulis on the index of hydrological connectivity in subtropical forest ecosystems. Forests 2022, 13, 2008. [Google Scholar] [CrossRef]
  28. Li, D.; Zhang, S. The influences of sand content and particle size on the desiccation cracks of compacted expansive soil. Adv. Mater. Sci. Eng. 2021, 2021, 7752352. [Google Scholar] [CrossRef]
  29. Tian, P.; Gong, Y.; Hao, F.; Chen, L.; Yang, Y.; Guo, W.; Wu, H.; Zhang, W. Comparing erosion and rill development processes by simulated upslope inflow in two red soils from subtropical China. CATENA 2022, 213, 106139. [Google Scholar] [CrossRef]
  30. Germann, P.F. Viscosity—The weak link between Darcy’s law and Richards’ capillary flow. Hydrol. Process. 2018, 32, 1166–1172. [Google Scholar]
  31. Shi, S.; Zhao, F.; Ren, X.; Meng, Z.; Dang, X.; Wu, X. Soil infiltration properties are affected by typical plant communities in a semi-arid desert grassland in China. Water 2022, 14, 3301. [Google Scholar] [CrossRef]
  32. Farahani, H.; Jahansoozi, M. Analysis of rural households’ resilience to drought in Iran, case study: Bajestan County. Int. J. Disaster Risk Reduct. 2022, 82, 103331. [Google Scholar]
  33. Hu, L.T.; Bentler, P.M. Cutoff criteria for fit indexes in covariance structure analysis: Conventional criteria versus new alternatives. Struct. Eq. Model. 1999, 6, 1–55. [Google Scholar]
  34. Byrne, B.M. Structural Equation Modeling with Lisrel, Prelis, and Simplis: Basic Concepts, Applications, and Programming; Psychology Press: New York, NY, USA, 1998. [Google Scholar] [CrossRef]
  35. Hooper, D.; Mullen, J.; Hooper, D.; Coughlan, J.; Mullen, M.R. Structural equation modeling: Guidelines for determining model fit. Electron. J. Bus. Res. Methods 2008, 6, 53–60. [Google Scholar]
  36. Tabachnick, B.G.; Fidell, L.S.; Ullman, J.B. Using Multivariate Statistics; Pearson: Boston, MA, USA, 2013; Volume 6, pp. 497–516. [Google Scholar]
  37. Chen, L.; Young, M.H. Green-Ampt infiltration model for sloping surfaces. Water Resour. Res. 2006, 42, W07420. [Google Scholar] [CrossRef]
  38. Liu, Z.-Z.; Yan, Z.-X.; Qiu, Z.-H.; Wang, X.-G.; Li, J.-W. Stability analysis of an unsaturated soil slope considering rainfall infiltration based on the Green-Ampt model. J. Mt. Sci. 2020, 17, 2577–2590. [Google Scholar] [CrossRef]
  39. de Almeida, W.S.; Panachuki, E.; de Oliveira, P.T.S.; da Silva Menezes, R.; Sobrinho, T.A.; de Carvalho, D.F. Effect of soil tillage and vegetal cover on soil water infiltration. Soil Tillage Res. 2018, 175, 130–138. [Google Scholar]
  40. Jain, V.; Raj, T. Evaluating the variables affecting flexibility in fms by exploratory and confirmatory factor analysis. Glob. J. Flex. Syst. Manag. 2013, 14, 181–193. [Google Scholar] [CrossRef]
  41. Ma, D.; He, Z.; Wang, L.; Zhao, W.; Chen, L.; Lin, P.; Zhao, P.; Wang, W.; Gao, Y.; Li, J. Soil water and salt migration in oasis farmland during crop growing season. J. Soil Sediment. 2023, 23, 355–367. [Google Scholar]
  42. Orzech, K.; Wanic, M.; Załuski, D. The effects of soil compaction and different tillage systems on the bulk density and moisture content of soil and the yields of winter oilseed rape and cereals. J. Agric. Sci. 2021, 11, 666. [Google Scholar] [CrossRef]
  43. Cui, Z.; Huang, Z.; Liu, Y.; López-Vicente, M.; Wu, G.-L. Natural compensation mechanism of soil water infiltration through decayed roots in semi-arid vegetation species. Sci. Total Environ. 2022, 819, 151985. [Google Scholar] [CrossRef]
  44. Hasituya; Liu, J.; Liu, T. The Characteristics of Rainfall-Runoff Generation and Its Influencing Factors in a Desert Steppe, China. Sustainability 2023, 15, 15531. [Google Scholar] [CrossRef]
  45. Zhao, W.; Cui, Z.; Fan, Y.; Cao, Q. Predicting spatial variability of soil bulk density in gravelmulched fields. J. Hydrol. Eng. 2018, 23, 04018022. [Google Scholar]
  46. Nciizah, A.D.; Wakindiki, I.I. Physical indicators of soil erosion, aggregate stability and erodibility. Arch. Agron. Soil Sci. 2015, 61, 827–842. [Google Scholar] [CrossRef]
  47. Zhu, F.; Lin, X.; Guan, S.; Dou, S. Deep incorporation of corn straw benefits soil organic carbon and microbial community composition in a black soil of Northeast China. Soil Use Manag. 2022, 38, 1266–1279. [Google Scholar] [CrossRef]
  48. Steponavičienė, V.; Bogužas, V.; Sinkevičienė, A.; Skinulienė, L.; Vaisvalavičius, R.; Sinkevičius, A. Soil water capacity, pore size distribution, and CO2 emission in different soil tillage systems and straw retention. Plant J. 2022, 11, 614. [Google Scholar]
  49. Porzig, E.; Seavy, N.; Owens, B.; Gardali, T. Field evaluation of a simple infiltration test and its relationship with bulk density and soil organic carbon in California rangelands. J. Soil Water Conserv. 2018, 73, 200–206. [Google Scholar] [CrossRef]
  50. Gavrilescu, M. Water, soil, and plants interactions in a threatened environment. Water 2021, 13, 2746. [Google Scholar] [CrossRef]
  51. Suseela, V.; Tharayil, N. Decoupling the direct and indirect effects of climate on plant litter decomposition: Accounting for stress-induced modifications in plant chemistry. Glob. Chang. Biol. 2018, 24, 1428–1451. [Google Scholar] [CrossRef]
  52. Jiang, X.J.; Chen, C.; Zhu, X.; Zakari, S.; Singh, A.K.; Zhang, W.; Zeng, H.; Yuan, Z.-Q.; He, C.; Yu, S.; et al. Use of dye infiltration experiments and HYDRUS-3D to interpret preferential flow in soil in a rubber-based agroforestry systems in Xishuangbanna, China. CATENA 2019, 178, 120–131. [Google Scholar] [CrossRef]
  53. Liu, Y.; Zhang, Y.; Xie, L.; Zhao, S.; Dai, L.; Zhang, Z. Effect of soil characteristics on preferential flow of Phragmites australis community in Yellow River delta. Ecol. Indic. 2021, 125, 107486. [Google Scholar] [CrossRef]
  54. Chen, J.; Zhu, Z.; Hu, H.; Luo, Z.; Yang, X.; Jia, X.; Fang, P.; Mansour, L. Soil quality assessment of oak forests invaded by moso bamboo (Phyllostachys edulis) in the northern subtropics. Glob. Ecol. Conserv. 2024, 51, e02945. [Google Scholar] [CrossRef]
  55. Zhou, M.; Hu, H.; Wang, J.; Wang, X.; Tian, Z.; Deng, W.; Wu, C.; Zhu, L.; Lu, Q.; Feng, Y. Effects of nitric acid rain stress on soil nitrogen fractions and fungal communities in a northern subtropical forest, China. Sci. Total Environ. 2023, 856, 158904. [Google Scholar] [CrossRef] [PubMed]
  56. Xiao, L.; Li, C.; Cai, Y.; Zhou, T.; Zhou, M.; Gao, X.; Zhou, Y. Interactions between soil properties and the rhizome-root distribution in a 12-year Moso bamboo reforested region: Combining ground-penetrating radar and soil coring in the field. Sci. Total Environ. 2021, 800, 149467. [Google Scholar] [PubMed]
  57. Xiao, H.; Liu, J.; Li, F. Both alpha and beta diversity of nematode declines in response to moso bamboo expansion in south China. Appl. Soil Ecol. 2023, 183, 104761. [Google Scholar] [CrossRef]
  58. Wu, W.; Chen, G.; Meng, T.; Li, C.; Feng, H.; Si, B.; Siddique, K.H. Effect of different vegetation restoration on soil properties in the semi-arid Loess Plateau of China. CATENA 2023, 220, 106630. [Google Scholar] [CrossRef]
  59. Xu, Q.-F.; Liang, C.-F.; Chen, J.-H.; Li, Y.-C.; Qin, H.; Fuhrmann, J.J. Rapid bamboo invasion (expansion) and its effects on biodiversity and soil processes. Chin. J. Plant Ecol. 2015, 39, 110–124. [Google Scholar] [CrossRef]
Figure 1. Location of the study area.
Forests 15 01470 g001
Figure 2. Schematic diagram of the measurement principle of the device.
Forests 15 01470 g002
Figure 3. Changes in initial infiltration rate and saturated hydraulic conductivity at 10 °C as a function of soil depth in three stands (pine (Pinus taeda), oak (Quercus acutissima), and bamboo (Phyllostachys edulis)): (a) Initial infiltration rate; (b) Ks (Saturated hydraulic conductivity at 10 °C). Capital letters A and B indicate significant differences in infiltration at different soil depths in the same stand; lowercase letters a and b denote significant differences in infiltration at the same soil depth across stands.
Forests 15 01470 g003
Figure 4. Correlations between soil physical properties and initial infiltration rate, and saturated hydraulic conductivity at 10 °C in three stands (a), and redundancy analysis of soil physical properties and water infiltration properties (b), IIR: Initial infiltration rate; Ks: Saturated hydraulic conductivity at 10 °C.
Forests 15 01470 g004
Figure 5. Causal relationships between dominant factors of soil physical properties and soil moisture infiltration properties in three stands were based on structural equation modeling (SEM) and standardized direct and total effects. (*** indicates significance at p < 0.001. SBD, soil bulk density; STP, total capillary porosity; SWC, saturated water capacity. (a) IIR, initial infiltration rate; (b) Ks, saturated hydraulic conductivity at 10 °C in the three stands. The value next to each arrow represents the normalized path coefficient. Unidirectional arrows indicate the direct effect of a unidirectional causal relationship. The width of the arrow indicates the strength of the causal relationship.
Forests 15 01470 g005
Disclaimer/Publisher’s Note: The statements, opinions and data contained in all publications are solely those of the individual author(s) and contributor(s) and not of MDPI and/or the editor(s). MDPI and/or the editor(s) disclaim responsibility for any injury to people or property resulting from any ideas, methods, instructions or products referred to in the content.

