Abstract
The rapid increase in reactive nitrogen (N) released into the environment by human activities has notably altered the structure and composition of forest soil microbial communities (SMCs), profoundly impacting the N cycle in terrestrial ecosystems. However, the response of soil microorganisms to nitrogen addition in different seasons is not clear. This study delved into how SMCs in a subtropical region of central Yunnan, China, specifically in an evergreen broad-leaved forest (EBLF), respond to N deposition during both the dry and wet seasons. Through high-throughput sequencing, we assessed the composition and structure of SMCs under varying N addition treatments across seasons, examining their interplay with soil chemical properties, enzyme activities, and community responses. The findings revealed significant outcomes following four years of N addition in the subtropical EBLF: (1) Significant changes were observed due to the interaction between N addition and seasonal changes. Soil pH significantly decreased, indicating increased soil acidification, particularly in the dry season. Increased moisture in the wet season mitigated soil acidification. (2) In the dry season, N addition led to a decrease in microbial richness and diversity. In the wet season, N addition increased microbial richness and diversity, alleviating the downward trend observed in the dry season. (3) N addition significantly impacted the composition of soil bacterial and fungal communities. Dominant fungal genera in the wet season were particularly sensitive to N addition. (4) Seasonal changes and N addition altered soil microbial community structures. Soil chemical properties and enzyme activities significantly influenced the microbial community structure. However, due to differences in soil moisture, the key environmental factors that regulate microbial communities have changed significantly during the dry and wet seasons. This study serves as a foundation for understanding how N deposition impacts SMCs in EBLF ecosystems in subtropical regions, offering valuable insights for the scientific management of forest ecological resources amidst global change trends.
1. Introduction
The rapid advancement of urbanization and industrial activities has substantially increased atmospheric nitrogen (N) deposition globally. Subtropical forest soils, in particular, are approaching N saturation [1]. China, facing some of the highest N deposition rates globally, ranks as the third-largest contributor after Europe and North America [2]. By 2050, China is expected to account for approximately 24% of global N deposition [3]. This excessive N deposition poses numerous challenges to forest soils, including soil acidification, nitrate leaching, and biodiversity loss [4,5]. Such increases in N deposition are significantly affecting the composition and functionality of soil microbial communities (SMCs) [6,7].
Soil microorganisms, accounting for approximately 95% of total soil biomass [8], are integral to soil nutrient cycling and material transformation processes. Even minor alterations in microbial communities can lead to extensive biochemical cycling changes [9]. Soil enzymes are critical for providing precise and timely information regarding subtle environmental changes in the soil [10,11], serving as dependable indicators for detecting microbial community shifts due to various environmental factors [12]. Recent research has increasingly focused on the significance of N deposition on the composition and structure of SMCs. For example, Wu et al. [13] revealed that a decade of N addition led to reduced soil bacterial diversity and changed microbial composition in a subtropical fir forest. Similarly, Cui et al. [14] found that after one year of N addition in a subtropical Pinus taiwanensis forest, soil bacterial diversity and community composition were more impacted than fungal communities. Research by Wang et al. [15] in subtropical forests showed that N addition reduced the abundance of soil bacteria and fungi, significantly influencing the composition of these communities, with fungi demonstrating higher sensitivity to N deposition than bacteria. Zhou et al. [16] observed that N addition markedly decreased the richness and Shannon index of SMCs while increasing β-diversity, resulting in changes to the microbial community structure. Yang et al. [17] documented that increased moisture strengthened the positive effects of N deposition on soil fungi and shifted its influence on bacteria from negative to positive. These studies underscore the significant implications of N addition on forest SMCs, emphasizing the variability across different forest ecosystems. Understanding how microbial communities respond to N deposition in subtropical regions, particularly under varying soil moisture conditions, is essential for sustainable forest management. This knowledge also aids in accurately predicting the state of forest ecosystems under future global environmental change scenarios.
High throughput sequencing (HTS) technology enables simultaneous reading and quantification of species in a test sample by sequencing millions of points through microarray sequencing [18]. This technology allows for the direct extraction of total DNA from environmental samples for library construction and sequencing, providing a realistic representation of microbial community structure and composition in situ [19]. Yunnan Central Alpine, located in the Yunnan-Guizhou Plateau, the Tibetan Plateau, and the Hengduan Mountains, features a distinctive subtropical monsoon climate with semi-moist evergreen broad-leaved forests (EBLFs) that are rich in species. Here, HTS was performed to examine the composition and structure of SMCs under varying N addition treatments during the dry and wet seasons. By employing HTS, we investigated the responses of soil chemical properties, enzyme activities, and microbial community composition and structure to different N-addition treatments, along with their interrelationships. Based on prior research, our hypotheses were as follows: (1) N addition would result in soil acidification, changes in soil nutrient levels and enzyme activities, and adversely affect soil microbial community diversity. (2) N availability would be the primary regulatory factor influencing SMCs. (3) Increased soil moisture could mitigate the adverse effects of N deposition on SMCs. The objective of our study was to provide a theoretical foundation for understanding the mechanisms and principles by which N deposition affects SMCs in subtropical forest ecosystems. Additionally, we aim to offer valuable perspectives on the professional management of forest ecological resources amidst the backdrop of global environmental change.
2. Materials and Methods
2.1. Study Area
The study area is situated within the Yuxi National Positional Observatory for Forest Ecosystems in Yunnan Province, China (23°46′18″—23°54′34″ N, 101°16′06″—101°16′12″ E) (Figure 1). The elevation of the area ranges from 1260.0 to 2614.4 m. It experiences a subtropical climate with a distinct division between dry (November to April) and wet seasons (May to October). The average annual temperature is 15 °C, with an average annual rainfall of 1050 mm. The soil composition consists mainly of argi-udic ferrosols and hapli-udic argosols (soil taxonomy data from the United States Department of Agriculture). This region is an important primitive forest area dominated by semi-humid EBLFs, featuring a rich diversity of forest vegetation types with a coverage rate exceeding 86%. The vegetation shows a clear vertical distribution with changing elevation. The main forest types include subtropical EBLFs, subtropical mid-mountain mixed coniferous and broad-leaved forests, coniferous forests, and alpine dwarf forests. The dominant species in the EBLFs are Castanopsis carlesii (Hemsl.) Hayata, Lithocarpus mairei (Schottky) Rehder, and Betula utilis D. Don, with Castanopsis carlesii (Hemsl.) Hayata accounting for about 60% of the total tree species in the base area of EBLFs.
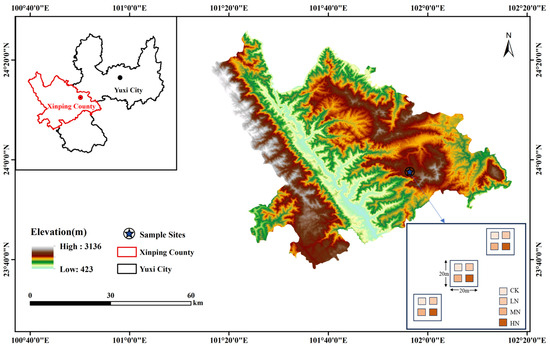
Figure 1.
Overview map of the research area.
2.2. Experimental Design
Here, three 20 m × 20 m plots of EBLFs were chosen (Table 1), with each plot spaced more than 3 m apart. Within each plot, four 3 m × 3 m subplots were randomly established, ensuring a minimum distance of 10 m between them. This setup included three replicates for each of the four N addition treatments, yielding twelve plots for the N addition experiment. The N addition treatments were designed on the basis of the annual wet N deposition levels [2.64–9.5 g·N·m−2·a−1] and annual dry N deposition levels [0.6–5.46 g·N·m−2·a−1] in southwestern China, considering an annual increase in N deposition [0.05 g·N·m−2·a−1] [20,21]. The treatments included Control (CK) [0 g·N·m−2·a−1], Low Nitrogen (LN) [10 g·N·m−2·a−1], Medium Nitrogen (MN) [20 g·N·m−2·a−1], and High Nitrogen (HN) [25 g·N·m−2·a−1]. The N source used was urea (CO(NH2)2). Starting from early January 2019, the annual N additions were divided into twelve equal portions and applied at the beginning of each month. For each treatment, the required amount of urea was dissolved in 1000 mL of water and applied utilizing a backpack sprayer specific to each small sample area. The CK group received an equal amount of water without N. Notably, N was not added during January–June 2020, June 2021, and January–February 2022 due to the COVID-19 outbreak.

Table 1.
Basic characteristics of the plot.
2.3. Sample Collection and Processing
In mid-March 2023 (dry season) and mid-July 2023 (rainy season), soil samples were gathered after four years of continuous N addition utilizing the five-point sampling method. Soil augers were employed to collect the samples, ensuring the removal of tree roots, stones, and other impurities. Subsequently, the soil from three replicates of each N treatment was carefully combined, mixed thoroughly, and securely transported back to the laboratory in sterile sealed bags. Upon arrival at the laboratory, the collected soil samples underwent specific processing steps. A portion of each mixed soil sample was sieved and preserved at −80 °C for subsequent DNA extraction and HTS. Another portion of the sample was preserved at 4 °C for analyzing nitrate N and ammonium N levels. The remaining portion of the sample was air-dried to facilitate the checking of soil enzyme activities and other chemical properties.
2.4. Measurement of Indicators
Soil chemical properties were assessed utilizing methods described by Bao [22]. In short, soil organic carbon (SOC) content was checked employing the potassium dichromate–external heating sulfuric acid oxidation method. Soil total phosphorus (TP), available phosphorus (AP), and total potassium (TK) were studied utilizing inductively coupled plasma optical emission spectroscopy (ICP-OES). Soil total nitrogen (TN) content was assessed utilizing the semi-micro Kjeldahl method. Soil pH was measured with a pH meter (msoil: Vwater = 1:5). Soil ammonium nitrogen (NH4+-N) was quantified through the indophenol blue colorimetric method, while soil nitrate–nitrogen (NO3−-N) employed ultraviolet spectrophotometry.
Soil enzyme activities were assessed utilizing enzyme-linked immunosorbent assay (ELISA) kits (Beijing Box Biotechnology Co., Ltd., Beijing, China). The absorbance of soil urease (UE), acid phosphatase (ACP), sucrase (SC), and catalase (CAT) was measured at specific wavelengths using an enzyme marker. Enzyme activities were calculated employing standard curves and reported as units per gram of soil (U/g), representing the amount of enzyme needed to generate 1 μg of NH3-N, 1 nmol of phenol, 1 mg of reducing sugar, and to catalyze the degradation of 1 nmol of H2O2 per gram of soil per day.
Soil microorganisms were extracted from the total DNA utilizing the E.Z.N.A.™ Mag-Bind Soil DNA Kit by Omega Bio-Tek, Norcross, GA, USA. The genomic DNA was quantified utilizing the Qubit® 4.0 DNA Detection Kit (Thermo Fisher Scientific, Shanghai, China) to check the appropriate DNA quantity for PCR reactions. For soil bacteria, PCR amplification of the variable region V3-V4 was implemented utilizing primers 341F (CCTACGGGGNGGCWGCAG) and 805R (GACTACHVGGGGTATCTAATCC). For soil fungi, the ITS regions were amplified utilizing primers ITS1F (CTTGGTCATTTAGAGAGGAAGTAA) and ITS2R (GCTGCGTTCTTCATCGATGC). Two rounds of PCR amplification were conducted for both bacteria and fungi. For the first round, we set: Bacterial Fusion Sequencing: 16S V3-V4 primer; Fungal Fusion: ITS1-ITS2 primer; Reaction System: 30 μL (15 μL 2× Hieff® Robust PCR Master Mix, 1 μL Bar-PCR primer F, 1 μL Primer R, 10–20 ng PCR products, and 9–12 μL H2O); PCR reaction conditions: 94 °C pre-denaturation for 3 min, (94 °C denaturation for 30 s, 45 °C annealing for 20 s, 65 °C extension for 30 s) for 5 cycles, (94 °C denaturation for 20 s, 55 °C annealing for 20 s, 72 °C extension for 30 s) for 20 cycles, the last extension at 72 °C for 5 min, and holding at 10 °C. In the second round, Illumina bridge PCR-compatible primers were applied, and the reaction system was 30 μL (15 μL 2×Hieff® Robust PCR Master Mix, 1 μL primer F, 1 μL Index-PCR Primer R, 20~30 ng PCR products, and 9~12 μL H2O). PCR reaction conditions: pre-denaturation at 95 °C for 3 min, 5 cycles of denaturation at (94 °C for 20 s, annealing at 55 °C for 20 s and extension at 72 °C for 30 s), and, finally, extension at 72 °C for 5 min and preservation at 10 °C. Following PCR amplification, the PCR products underwent analysis utilizing 2% agarose gel electrophoresis to check library size. Subsequently, the library concentration was quantified with the help of Qubit 3.0 fluorescence quantification. Equal amounts of all samples were then combined in a 1:1 ratio. Upon meeting quality control standards, HTS was performed on the Illumina MiSeq platform (Shanghai Sangon Biotechnology Engineering Co., Ltd., Shanghai, China). The sequences were preprocessed by trimming adapter sequences and removing low-quality reads using the FastQC (version 0.12.0) and Trimmomatic (version 0.39) tools. The SILVA database (version 132) was used for the identification of bacterial community composition, while the UNITE database (version 8.0) was used for the identification of fungal community composition.
The abbreviations and their full names used in this article are shown in Table 2.
Table 2.
List of abbreviations.
2.5. Data Analysis
Soil chemical properties and enzyme activity data were processed employing Microsoft Excel 2016. One-way analysis of variance (ANOVA) and multiple comparisons utilizing the least significant difference (LSD) method were performed utilizing SPSS 26.0. Following quality control filtering, sequencing data underwent OUT clustering on non-repetitive sequences (excluding single sequences) utilizing Usearch 11.0.667 software, with chimeras removed during clustering. Sequences with over 97% similarity were grouped into the same OTU.
Microbial α-diversity, which reflects the distribution characteristics of species composition and the number of individuals within a community, was assessed using the Chao1 index and the Shannon index to represent microbial community richness and diversity, respectively [23].
Chao index: The Chao1 algorithm estimates the number of OTUs in a sample, and it is frequently utilized in ecology to infer overall species richness. A higher Chao1 value indicates greater species richness. The Chao1 formula is as follows:
where SChao1 signifies the estimated number of OTUs; Sobs represents the actual number of observed OTUs; ni denotes the number of OTUs containing one sequence; and n2 signifies the number of OTUs containing two sequences.
Shannon index: This index measures the diversity of the microbial community by considering both the abundance and evenness of species. A higher Shannon value indicates greater community diversity. The formula is as follows:
where Sobs represents the number of OTUs actually observed; ni denotes the number of sequences contained in the 1st OTU; and N signifies the number of all individuals, in this case, the total number of sequences.
Histograms of soil chemical properties, enzyme activities, soil microbial α-diversity, and relative abundance of microorganisms were created using Origin 2021. Microbial community β-diversity was visualized and statistically analyzed employing the vegan package in R (version 4.3.3). Principal coordinates analysis (PCoA) was employed to observe differences between individuals or groups, with closer sample distances indicating more similar species composition structures. Correlation analysis between environmental factors and soil microorganisms, as well as variation partitioning analysis (VPA), were performed in R (version 4.3.3). Redundancy analysis (RDA) was conducted using the Lianchuan Bioinformatics platform (version 3.6), with bioinformatic analyses performed by employing OmicStudio tools (https://www.omicstudio.cn/tool, accessed on 25 April 2024) to identify the main environmental factors controlling microbial community structure. Data presented in the graphs are detailed as mean ± standard error.
3. Results
3.1. Soil Chemical Properties under N Deposition
The ANOVA results revealed significant impacts of different N addition treatments on soil chemical properties, with notable variations observed between the studied seasons (p < 0.05, Figure 2). In the dry season, soil pH exhibited a decreasing trend (CK > LN > MN > HN), while NO3−-N, NH4+-N, TN, TK, and TP content showed significant elevations (CK < LN < MN < HN) with higher N addition rates. SOC content was higher (21.45%) under HN treatment, and AP content did not exhibit significant differences relative to CK. Conversely, in the wet season, SOC content showed a notable increase (17.30%) under MN treatment, and TN content did not show significant differences among the treatments. The pH was lower (4.90%–6.67%) under MN and HN treatments, while NO3−-N, NH4+-N, AP, TK, and TP content displayed significant elevations with ascending levels of N addition (CK < LN < MN < HN).
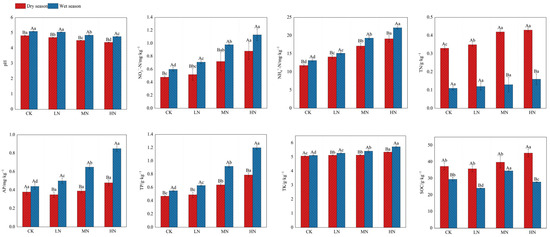
Figure 2.
Soil chemical properties under different nitrogen addition treatments in dry and wet seasons. Different capital letters indicate significant differences between the same nitrogen treatments in different seasons, and different lowercase letters indicate significant differences between different nitrogen treatments in the same season (p < 0.05). The meanings of the abbreviations in the figure are shown in Table 2.
3.2. Soil Enzyme Activities under N Deposition
ANOVA revealed significant seasonal differences in soil enzyme activities (p < 0.05, Figure 3). Catalase (CAT) activity and urease (UE) activity both followed the same pattern, being significantly lower in the wet season than in the dry season (wet < dry), with no differences among the N treatments. In contrast, sucrase (SC) activity was higher in the wet season than in the dry season (wet > dry). During the dry season, SC activity was highest under MN treatment (MN > LN > CK > HN). However, in the wet season, SC activity decreased with increasing N addition (CK > LN > MN > HN). Acid phosphatase (ACP) activity was lower in the wet season relative to the dry season under both MN and HN treatments. ACP activity was highest under the MN treatment during the dry season and lowest under the MN treatment during the wet season.
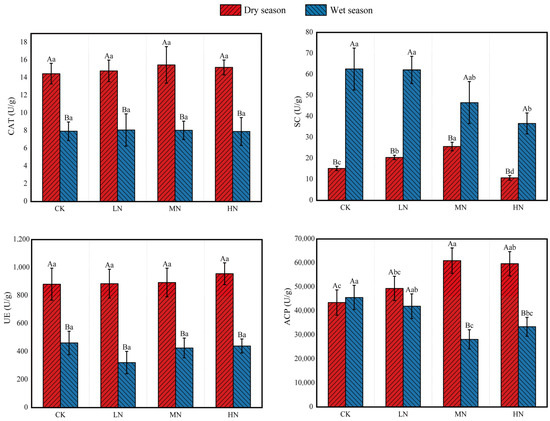
Figure 3.
Soil enzyme activities under different nitrogen addition treatments in dry and wet seasons. Different capital letters above the bars indicate significant differences between the same treatment in different seasons, and different lowercase letters indicate significant differences between different treatments in the same season (p < 0.05). The meanings of the abbreviations in the figure are shown in Table 2.
3.3. Soil Microbial Community Structure under N Deposition
3.3.1. Soil Microbial α-Diversity
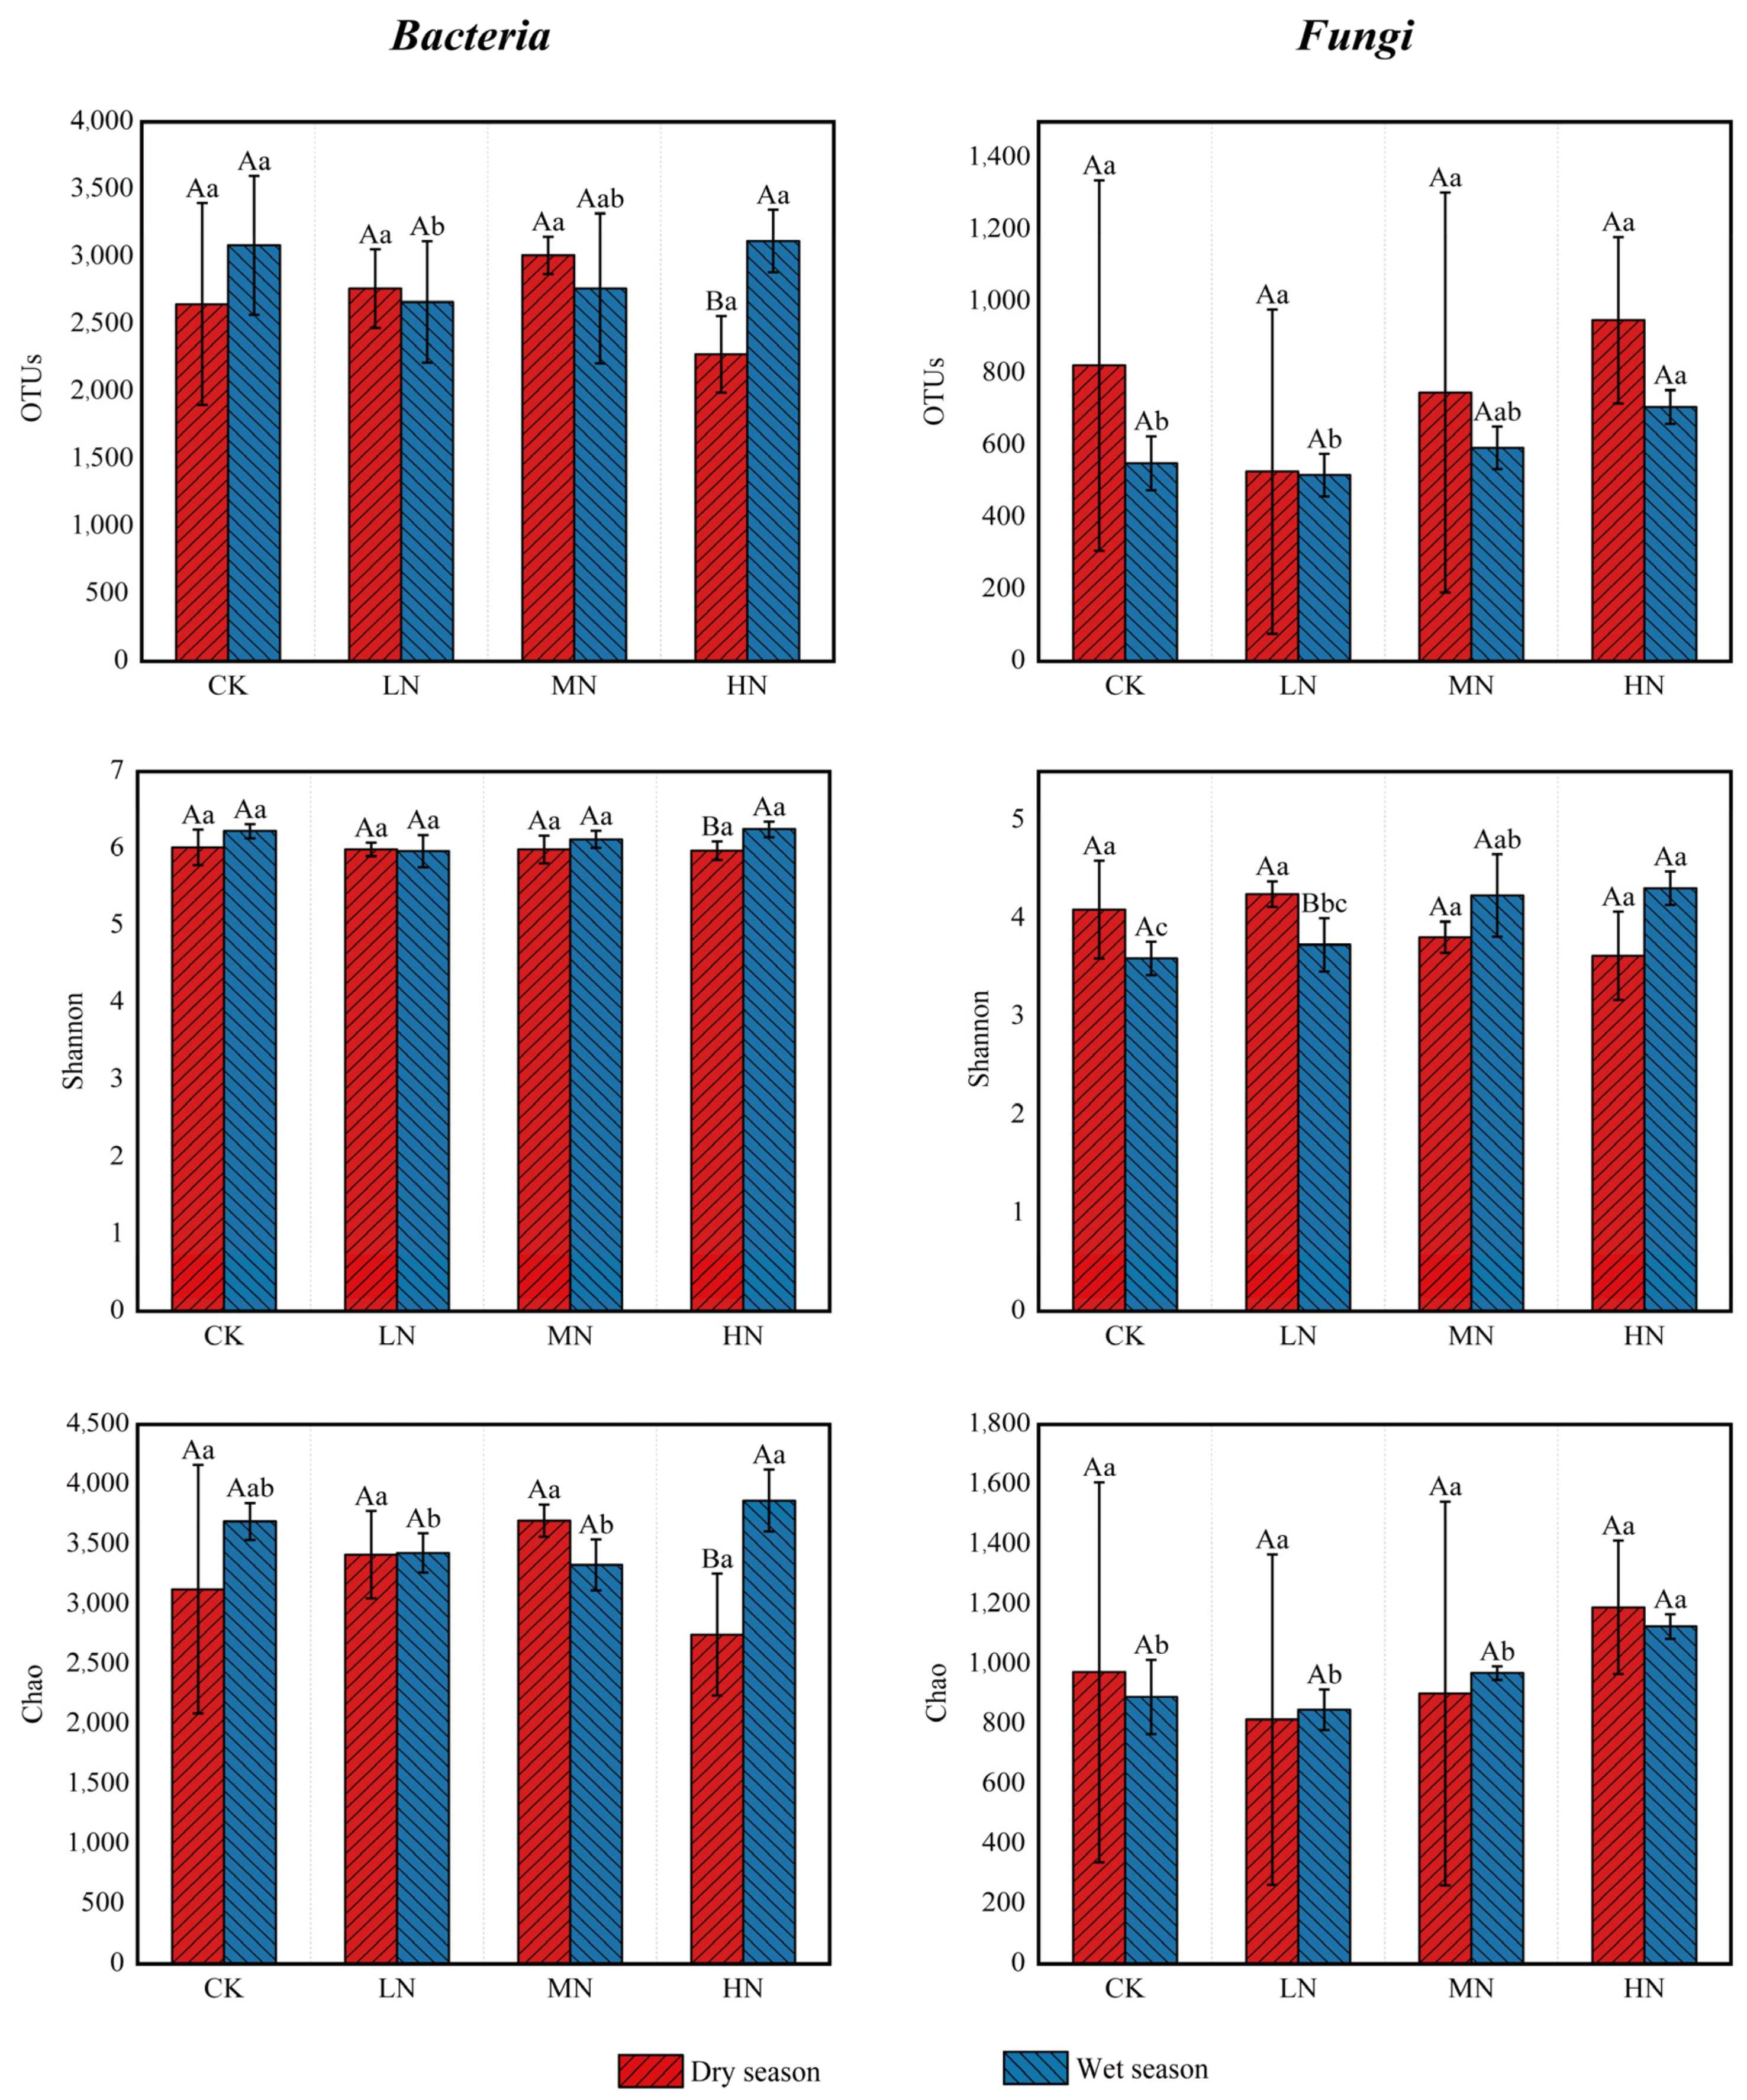
Soil microbial diversity and richness were evaluated using the α-diversity indices (Figure 4). The analysis results indicated that under HN treatment, the number of bacterial OTUs, Shannon’s index, and Chao’s index were higher in the wet season than in the dry season. Conversely, the Shannon’s index for fungi was higher in the dry season relative to the wet season under LN treatment. For other treatments, the number of bacterial and fungal OTUs, Shannon’s index, and Chao’s index did not differ significantly between seasons. In the dry season, the number of bacterial and fungal OTUs, Shannon’s index, and Chao’s index varied among the N treatments but were not significantly different compared to the CK. However, in the wet season, relative to CK, the number of bacterial OTUs was notably lower under the LN and MN treatments. Conversely, the number of fungal OTUs and the Chao index were distinctly higher under the HN treatment, and the Shannon index was obviously higher under MN and HN treatments. These results highlight the significant impact of N deposition in the rainy season on both microbial diversity and abundance (p < 0.05).
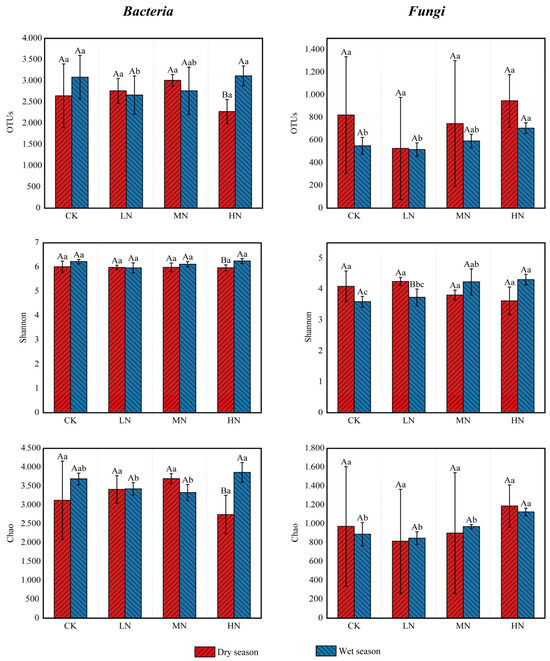
Figure 4.
Microbial α-diversity under different nitrogen addition treatments in dry and wet seasons. Different capital letters above the bars indicate significant differences between the same treatment in different seasons, and different lowercase letters indicate significant differences between different treatments in the same season (p < 0.05).
Different capital letters indicate significant differences among different seasons for the same nitrogen treatment, and different lowercase letters indicate significant differences among different nitrogen treatments in the same season (p < 0.05). The greater the value of Chao1, the greater the community species richness; the greater the value of Shannon, the greater the community diversity. The meanings of the abbreviations in the figure are shown in Table 2.
3.3.2. Soil Microbial β-Diversity
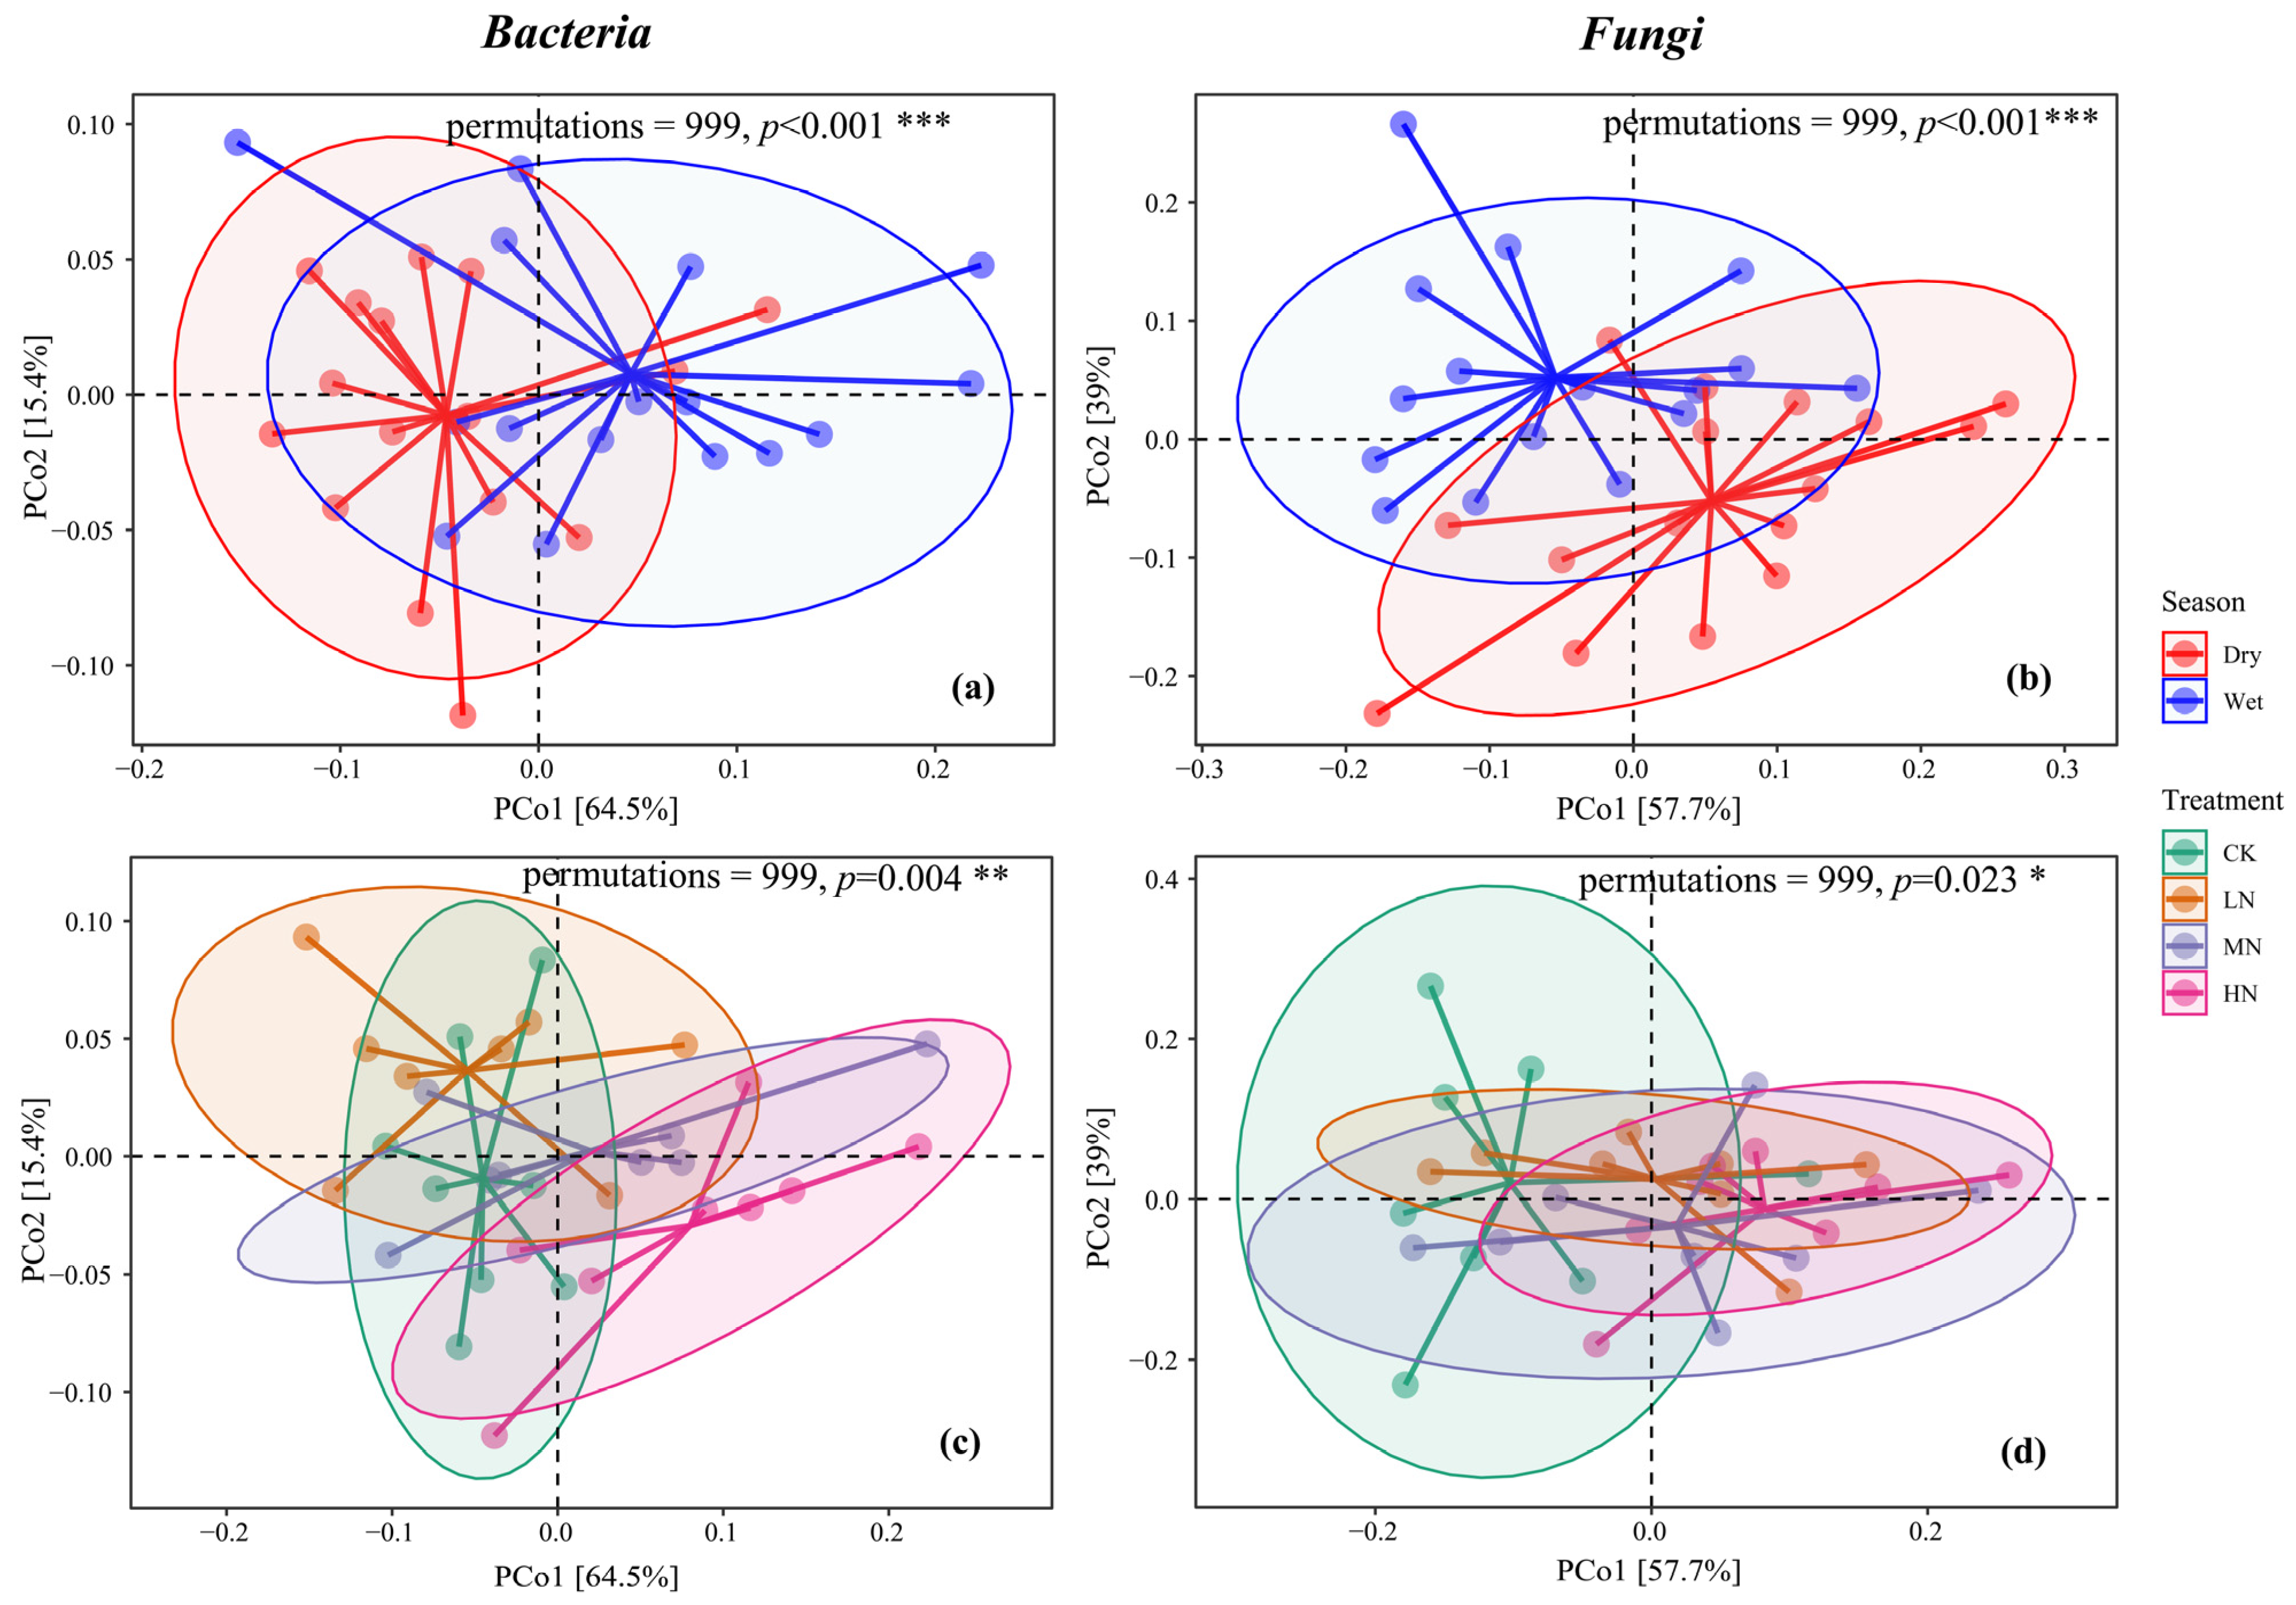
Using the Bray–Curtis distance, the PCoA results for the bacterial community highlighted that the first two dimensions accounted for 64.5% and 15.4% of the variance, respectively, totaling 79.9%. For the fungal community, the first two dimensions explained 57.5% and 39% of the variance, respectively, totaling 96.5%. Significant disparities were evident in the composition of bacterial and fungal communities between seasons (p < 0.001) and among the varied N addition treatments (p < 0.05). Both N addition and seasonal dynamics were pivotal in reshaping the structure of SMCs, with seasonal changes exerting a more pronounced effect relative to N addition (Figure 5).
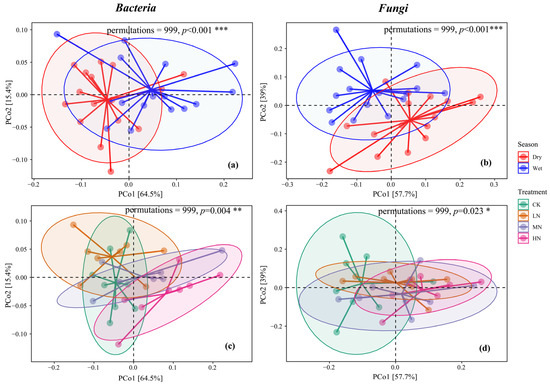
Figure 5.
Principal coordinate analysis of bacteria in dry and wet seasons (a), p < 0.001 ***; principal coordinate analysis of fungi in dry and wet seasons (b), p < 0.001 ***; principal coordinate analysis of bacteria in different nitrogen treatments (c), p = 0.004 **; Principal coordinate analysis of fungi under different nitrogen treatments (d), p = 0.023 *. The horizontal and vertical axes of PCoA represent the two selected principal coordinate axes, and the percentage represents the interpretability value of the principal coordinate axis on the difference in sample composition; the scales of the horizontal and vertical axes are relative distances and have no practical meaning; points of different colors for samples representing different groups, the closer the two sample points are, the more similar the species composition of the two samples is.
3.4. Soil Microbial Community Composition
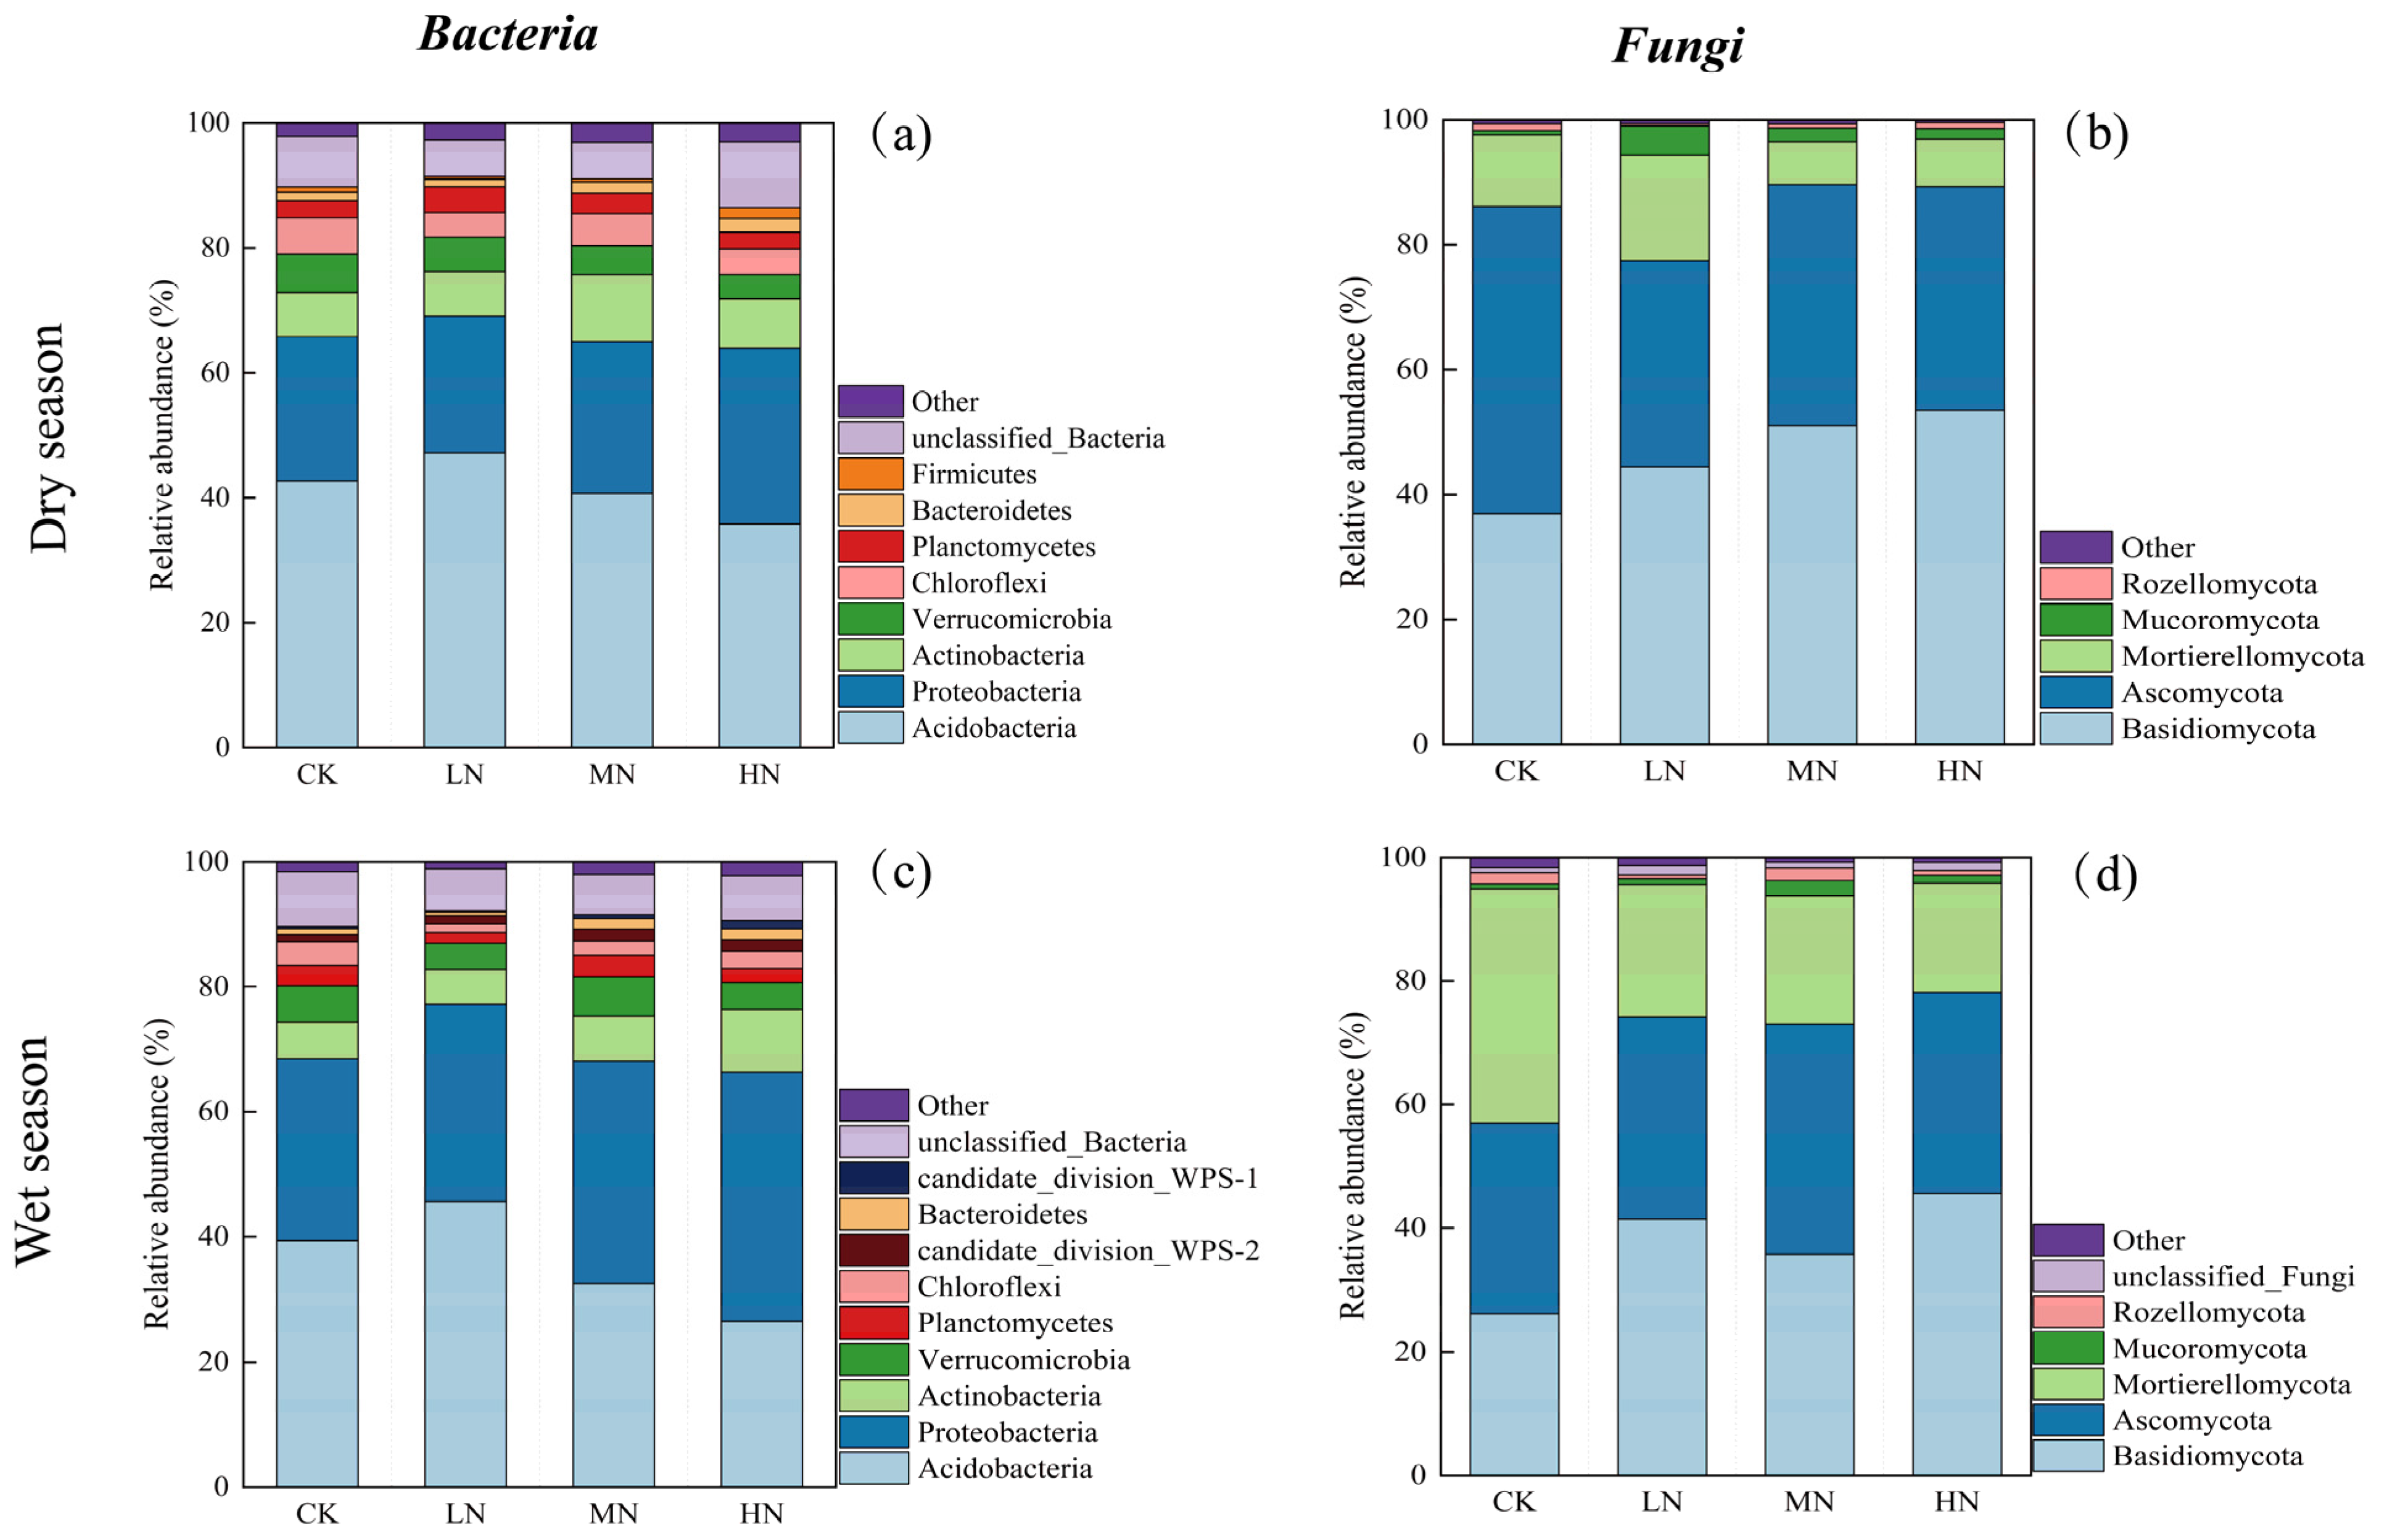
Figure 6 reveals variations in microbial community composition attributed to N addition at the phylum level. In the dry season soil samples, 25 phyla of bacteria and 16 phyla of fungi were identified, while in the wet season soil samples, 30 bacterial phyla and 15 fungal phyla were identified. The histogram depicts the top 9 bacterial phyla (a) and top 5 fungal phyla (b) with the highest relative abundance in the dry season, the top 10 bacterial phyla (c) and top 6 fungal phyla (d) are shown for the wet season, and the rest are categorized as other.
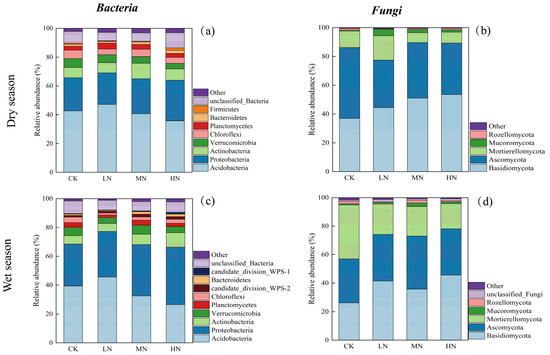
Figure 6.
Relative abundance of bacterial phyla in the dry season (a); relative abundance of fungal phyla in the dry season (b); relative abundance of bacterial phyla in the wet season (c); relative abundance of fungal phyla in the wet season (d).
The dominant bacterial phyla observed in both seasons were Acidobacteria, Proteobacteria, and Actinobacteria, with Acidobacteria exhibiting the highest relative abundance, followed by Proteobacteria and Actinobacteria. N addition resulted in a reduction in the relative abundance of Acidobacteria and an increase in Proteobacteria and Actinobacteria. Notably, Acidobacteria showed higher abundance in the dry season relative to the wet season, whereas Proteobacteria exhibited lower abundance in the wet season.
Similarly, the prominent fungal phyla in both seasons were Basidiomycota, Ascomycota, and Mortierellomycota, with Basidiomycota being the most abundant, followed by Ascomycota and Mortierellomycota. N addition treatments resulted in an elevated abundance of Basidiomycota and a decreased abundance of Ascomycota and Mortierellomycota in both seasons. Basidiomycota exhibited higher relative abundance in the dry season than the wet season, whereas Mortierellomycota showed a lower abundance in the wet season.
Additionally, Figure 7 focused on the genus level also demonstrates variations in response to N addition. In the dry season soil samples, 387 genera of bacteria and 628 genera of fungi were identified, while 488 bacterial genera and 572 fungal genera were observed in the wet season samples. Genera with relative abundance exceeding 1% were presented in the graph, while the remaining genera were grouped under “other”.
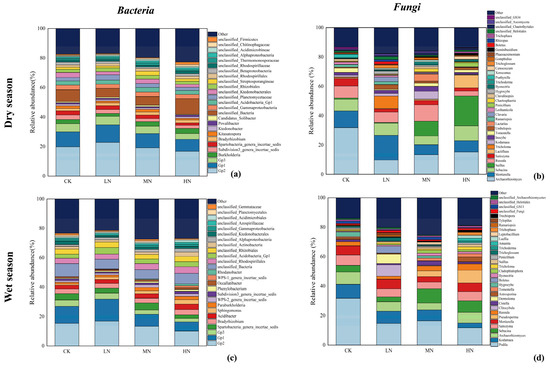
Figure 7.
Relative abundance of the bacterial genus in the dry season (a); relative abundance of the fungal genus in the dry season (b); relative abundance of the bacterial genus in the wet season (c); relative abundance of the fungal genus in the wet season (d). Only bacterial genera with a relative abundance >1% are shown in the figure, and the rest are classified as other.
The top three bacterial genera, Gp2, Gp1, and Gp3, belonging to the Acidobacteria phylum, were consistently dominant in both seasons. In the dry season, these top three genera collectively accounted for 28.80%–40.50% of the total abundance, whereas in the wet season, they represented 18.80%–36.00% of the total abundance. Most identified bacterial genera did not exhibit significant differences in relative abundance across various N addition treatments and seasons.
In the dry season, the top three fungal genera by relative abundance were Archaeorhizomyces, Mortierella, and Sebacina, collectively representing 26.13% to 51.17% of the total abundance. Conversely, in the wet season, the top three fungal genera were Podila, Kodamaea, and Archaeorhizomyces, accounting for 22.26% to 49.55% of the total abundance. The dominant fungal genera shifted between the two studied seasons. Notably, the relative abundance of the primary genus Archaeorhizomyces in the dry season and the major genus Podila in the wet season exhibited significant variations among different N treatments, with N addition leading to reduced relative abundance of these two genera.
3.5. Correlation between Microbial Community Structure and Soil Environmental Factors
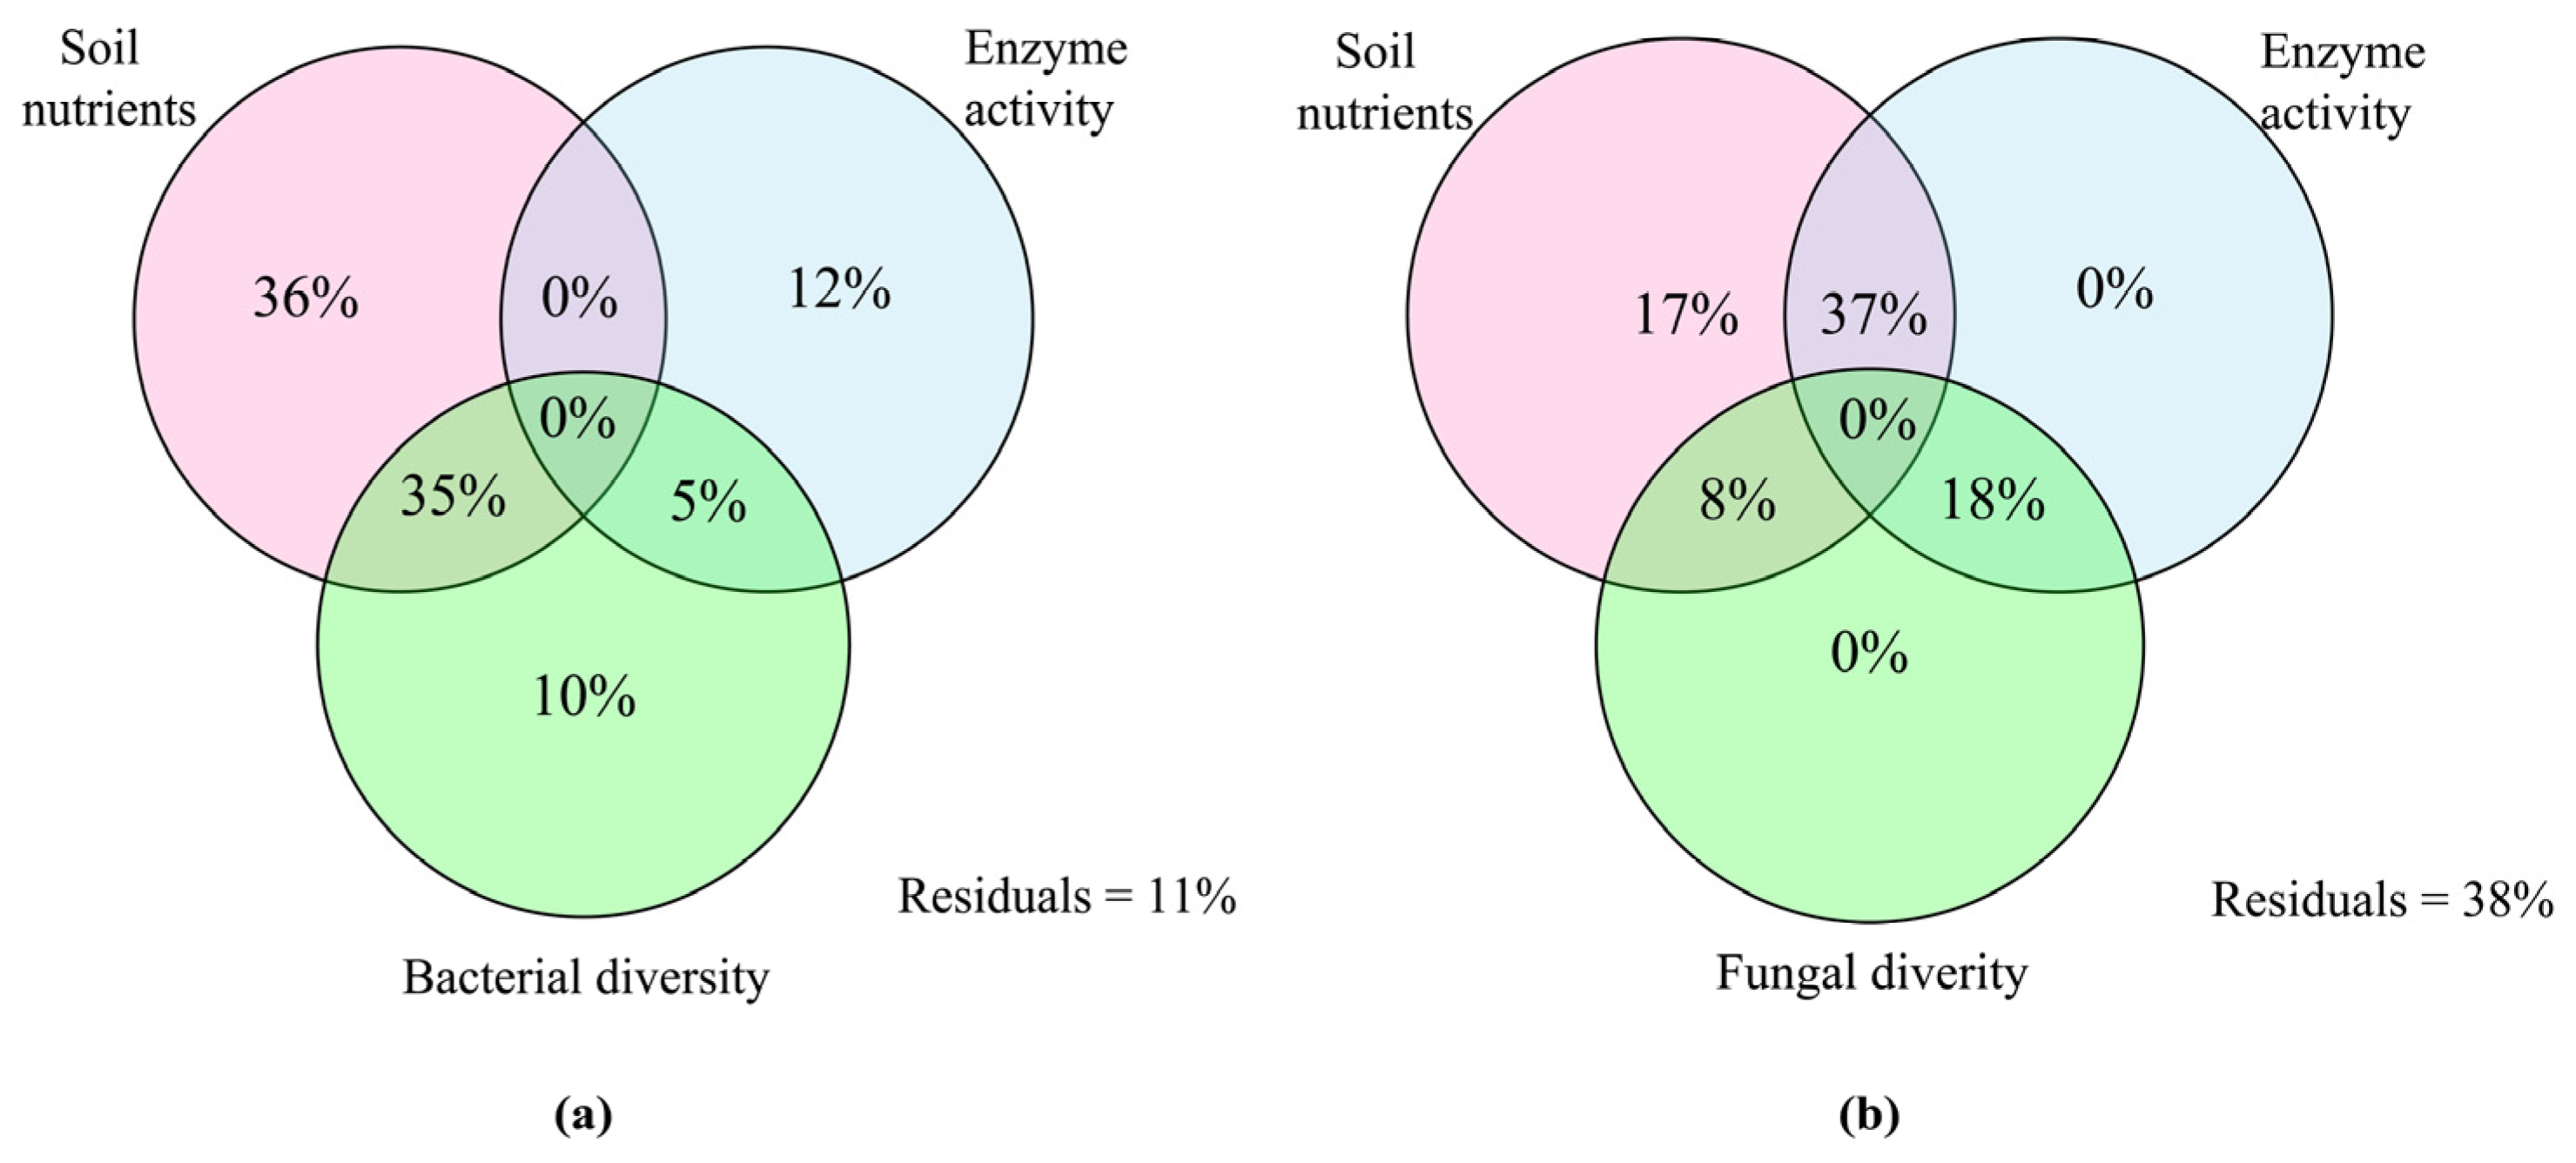
The VPA analysis was employed to assess how different environmental factors impacted the variation in microbial community structure, as depicted in Figure 8. The analysis revealed that variations in soil nutrients, soil enzyme activities, and bacterial diversity collectively explained 98% of the variability in bacterial communities. Notably, soil nutrients emerged as the most influential factor, explaining 36% of the bacterial diversity variance (Figure 8a). Similarly, changes in soil nutrients, soil enzyme activity, and fungal diversity explained 80% of the variation in fungal communities. Among these factors, the combined influence of soil nutrients and enzyme activity possessed critical potentials on the variation in fungal communities (Figure 8b).
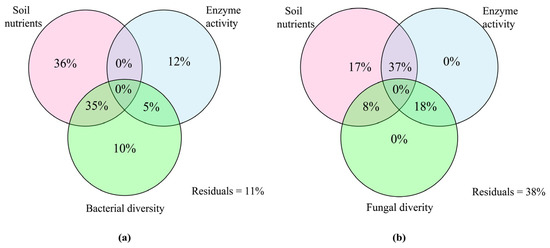
Figure 8.
Variance partitioning analysis (VPA) shows the explanation of soil nutrients, enzyme activity, and microbial diversity on the variance of bacterial (a) and fungal (b) communities.
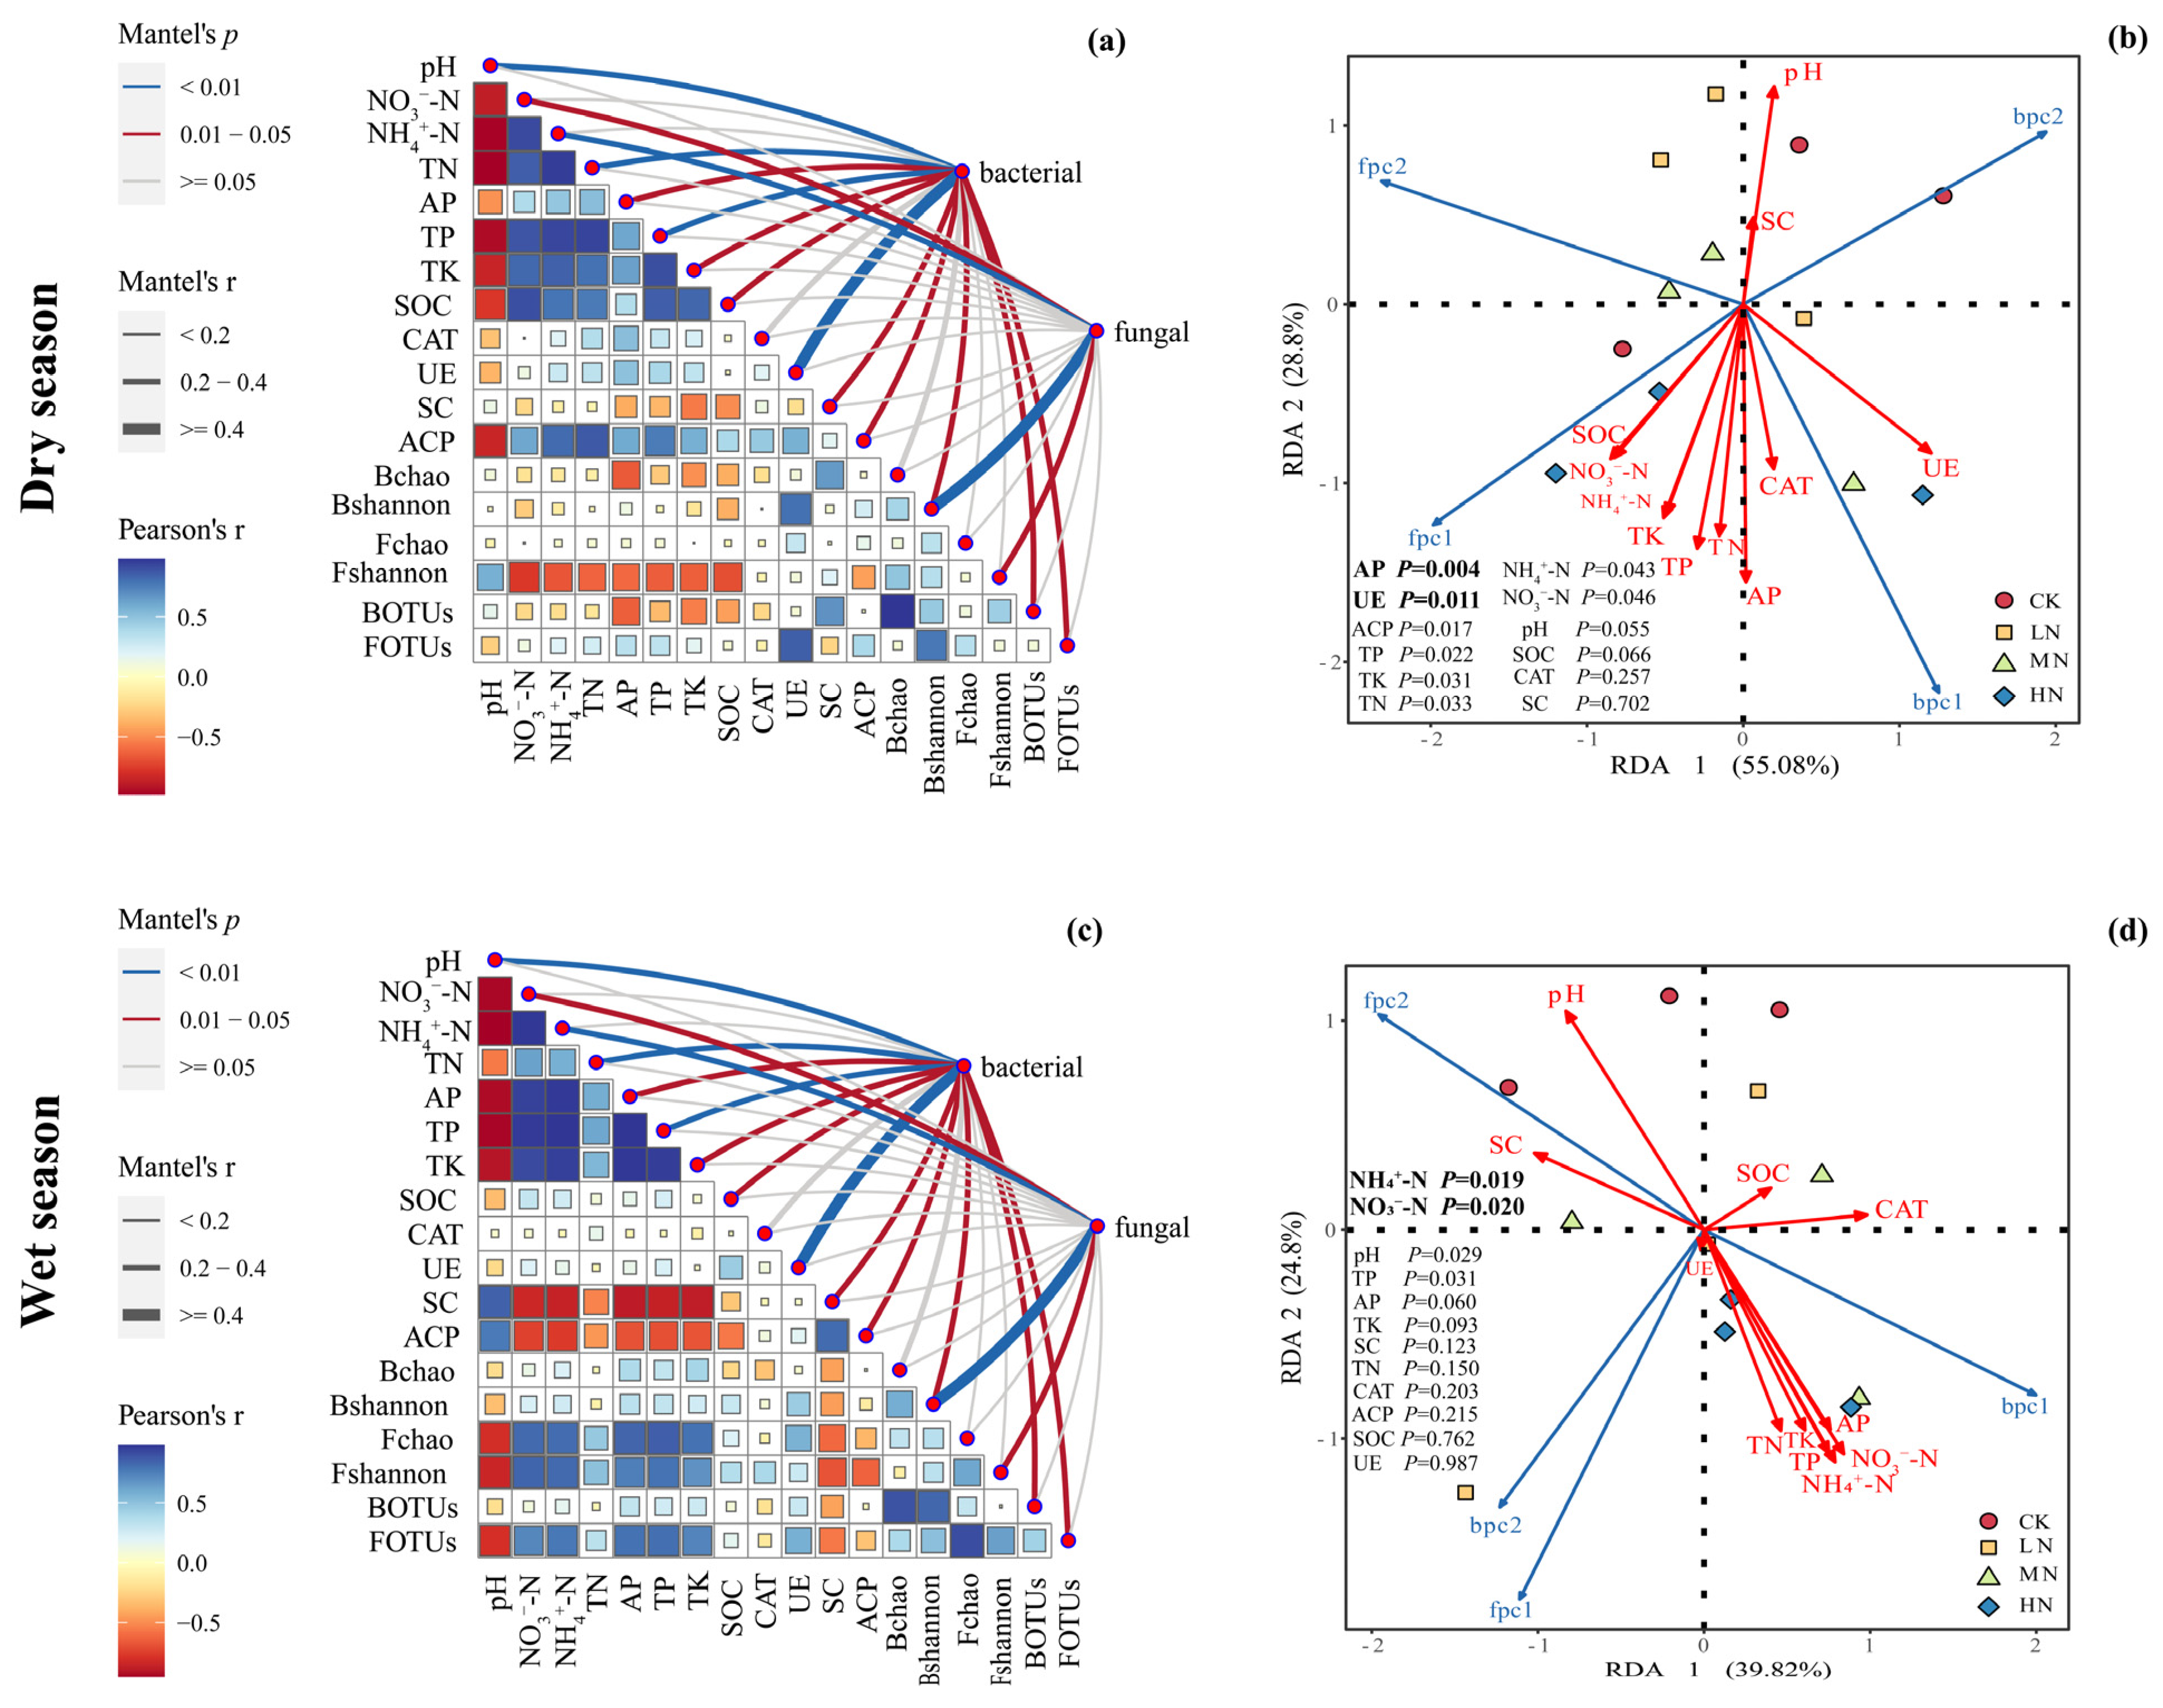
The Mantel test was utilized to investigate the linkage between microbial community structure and soil environmental factors, while RDA was employed to identify the primary controlling factors influencing microbial community structure, as illustrated in Figure 9. In the dry season, the first two RDA axes elucidated 55.08% and 28.8% of the microbial community variation, accounting for a total of 83.88%. Key soil chemical properties and enzyme activities, including pH, NO3−-N, NH4+-N, TN, AP, TP, TK, SOC, UE, SC, and ACP, exhibited a significant association with microbial communities. Among these factors, AP and UE were identified as pivotal in regulating microbial communities, with UE activity showing a significant positive correlation with bacterial community structure and NH4+-N content showing a positive correlation with fungal community structure (Figure 9a,b).
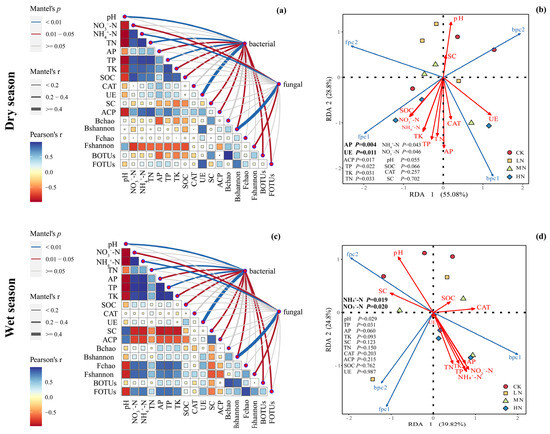
Figure 9.
The Mantel test was used to explore the relationship between the microbial community structure and soil environmental factors in the dry and wet seasons (a,c), and RDA analysis was used to determine the main environmental factors controlling the microbial community structure in the dry and wet seasons (b,d). The Pearson correlation coefficient between different chemical properties, enzyme activities, and microbial community traits is shown in the right triangle diagram, and the correlation results of the Mantel test are shown in the right line diagram. The meanings of the abbreviations in the figure are shown in Table 2.
In the wet season, the first two RDA axes explained 39.82% and 24.8% of the microbial community variation, totaling 64.62%. Similar to the dry season, various soil chemical properties and enzyme activities (the same as the abovementioned) significantly influenced microbial communities. Notably, NO3−-N and NH4+-N were highlighted as critical environmental factors governing microbial community structure. Furthermore, the bacterial community was positively correlated with UE activity, while the fungal community exhibited positive correlations with the bacterial Shannon index and NH4+-N (Figure 9c,d).
4. Discussion
4.1. Effects of N Deposition on Soil Chemical Properties and Enzyme Activities
In this study, the impact of N addition on soil chemical properties and enzyme activities was examined. The results revealed a significant increase in soil NH4+-N, NO3−-N, TN, TP, TK, and SOC contents during the dry season with the augmentation of N addition. Similar elevations were detected during the wet season. Additionally, the soil pH exhibited a significant decrease in both the dry and wet seasons, consistent with previous research findings [24]. The decline in soil pH and subsequent acidification can be attributed to the elevated NH4+-N and NO3−-N levels post-N addition. High concentrations of these substances, surpassing the requirements of plants and soil enzymes, result in increased H+ concentration in the soil solution due to nitrification by soil microorganisms converting NH4+-N to NO3−-N, subsequently causing soil acidification [25]. Notably, in this study, soil pH was higher in the wet season relative to the dry season, indicating lesser soil acidification during the wet season. This phenomenon can be attributed to increased soil moisture, which slows down acidification as H+ consumption through hydrolysis occurs. These findings align with hypothesis (1). Yang et al. [17] found, in their experiment of spraying nitrogen on forest canopies, that despite partial interception of our low N addition by the forest canopy, continuous spraying still resulted in soil acidification, demonstrating its cumulative effect. In addition, the “nitrogen loading regulation” theory suggests that in situations where external N supply is abundant, plants may reduce nitrogen uptake to avoid waste. The considerable rise in NO3−-N, NH4+-N, and TN content in the dry season suggested that N application effectively enhanced the available N sources in the soil. This improvement contributes to enhanced soil structure and microbial activity and facilitates N cycling and utilization. Wang et al. [15] highlighted the significance of N deposition on soil bacterial and fungal community composition, with N availability emerging as the most influential soil property. N addition was shown to effectively increase the total soil N content and its available forms. In the context of this study, it was observed that soil NO3−-N and NH4+-N content notably increased during the wet season, while the difference in soil TN content revealed no significance. This observation could be attributed to several factors. Firstly, the substantial increase in soil TP and TK content post N addition, coupled with ample rainfall and optimal temperature conditions during the wet season, facilitated the essential nutrients needed for plant and soil organism growth and development, ultimately balancing soil N input and consumption. Secondly, the prolonged duration of N addition may influence soil N hydrolase activity, leading to an increment in N content with increasing N concentration, thereby maintaining soil TN content without significant discrepancies. The elevation in TK and TP content following N application can be linked to improved soil structure and enhanced microbial activity induced by N treatment, consequently affecting the release and cycling of potassium and phosphorus in the soil [26,27,28,29]. The AP content during the dry season did not exhibit significant differences among treatments; however, a notable increase in AP content was observed in the wet season, which was attributed to the intricate interaction between N and P. The application of N may impact the efficiency of phosphorus utilization in the soil [30]. Furthermore, differences in soil moisture and temperature between the dry and wet seasons played a notable role. The enhanced soil moisture and higher temperatures during the wet season likely facilitated the processes of phosphorus release and transformation, consequently resulting in a substantial increase in AP content.
Our findings highlighted the impact of seasonality on soil enzyme activities, revealing complex interactions influenced by the level of N addition, as illustrated in Figure 2. CAT and UE activities displayed a seasonal variation pattern, with significantly higher activities noted in the dry season relative to the wet season, showing no linkage with N addition. CAT is crucial in soil, in that it modulates hydrogen peroxide metabolism and aids in the degradation of excessive hydrogen peroxide accumulation, thereby mitigating its toxic effects on plants [31]. The abundant moisture content in the wet season dilutes hydrogen peroxide in the soil, reducing its toxic impact and subsequently leading to decreased CAT production and activity compared to the dry season. On the other hand, UE, an enzyme associated with nitrogen acquisition in plants and microorganisms, is critical in the soil carbon cycle and the transformation of nitrogenous organic matter. The lower soil TN and SOC contents in the wet season relative to the dry season influenced UE activities, which appeared to be higher during the dry season. Notably, N addition did not exert a significant impact on the activities of these two enzymes, possibly due to their insensitivity to direct N response or the presence of other nutrient-limiting factors affecting their activities [32]. The variability in SC activity across seasons, showing significant differences among N treatments, underscores the intricate dynamics of the soil microbial community under varying environmental conditions. SC is very important for the soil carbon cycle, which catalyzes the hydrolysis of sucrose into glucose or fructose, providing energy for soil microorganisms. Soil pH has been identified as a vital factor influencing SC activity [33]. The increased moisture in the wet season alleviated soil acidification trends and enhanced hydrolysis, resulting in significantly higher SC activity during this season. Under HN treatment in both dry and wet seasons, SC activity displayed a notable reduction. This decline may be attributed to elevated N concentrations hampering root activity, leading to decreased soil pH, increased nitrification, and reduced effective carbon in the soil, ultimately suppressing SC activity. The sensitivity of soil enzyme activity to environmental conditions is further exemplified by the observed variations in ACP activity across seasons and N treatments. ACP is vital in facilitating the conversion of soil organic phosphorus. The augmentation of ACP activity under MN treatments in the dry season suggests that MN addition enhances the functional expression of microorganisms associated with phosphorus cycling [27]. Contrarily, in the wet season, ACP activity decreased with HN concentrations, possibly due to phosphorus nutrient loss from the soil through rainwater infiltration, thereby reducing enzyme substrate concentration and impacting its activity. Additionally, increased ACP activity may indicate heightened microbial physiological stress caused by an imbalance in the nitrogen-to-phosphorus ratio [34].
4.2. Effects of N Deposition on the Structure and Composition of Soil Microbial Communities
The structure and composition of SMCs are vital for biogeochemical processes and ecosystem functioning, affecting both abundance and diversity [35]. Previous research highlights soil pH as a significant factor affecting bacterial and fungal abundance in subtropical and tropical forest soils [36]. Microbial abundance tends to decline with decreasing pH levels due to potential aluminum toxicity, which is capable of hindering microbial growth [37]. Figure 2 documented higher pH in the wet season versus the dry season (Figure 2), posing less toxicity to soil microorganisms relative to the dry season. Consequently, higher microbial abundance and diversity were noted in the wet season, aligning with hypothesis (1) in this study. Previous studies have consistently shown a decline in bacterial and fungal abundance and diversity with increasing N addition [15,38,39]. Aligning with these findings, our study revealed that N addition during the dry season led to reduced soil bacterial and fungal abundance and diversity. Conversely, microbial abundance and diversity increased during the wet season (Figure 4), further supporting existing literature. The contrasting patterns observed between the wet and dry seasons can be attributed to the characteristics of the subtropical monsoon climate. The wet season, which features high temperatures and significant precipitation, accelerates decomposition processes, leading to higher nutrient availability and effectiveness. In contrast, the milder and less humid conditions of the dry season result in decreased microbial abundance and diversity. In our study, the well-watered conditions during the wet season, coupled with N additions that significantly increased soil nutrients (Figure 2), helped alleviate nutrient limitations in the soil. As a result, the negative impact of N addition on soil microorganisms was less pronounced in the wet season. Liu et al. [6] also emphasized that fluctuations in soil microbial diversity throughout different seasons could be partly linked to shifts in environmental conditions. In conclusion, we documented a combined effect of N addition on soil microbial diversity and richness. While N addition negatively influenced SMCs in the dry season, it mitigated this negative effect in the wet season. Therefore, hypothesis (3) of the present study found support in these findings.
In this study, N addition had a notable impact on the composition and structure of microbial communities. The relative abundance of the dominant bacterial phylum Acidobacteria decreased in both the dry and wet seasons with increased levels of nitrogen addition, while the phyla Ascomycetes and Actinobacteria showed an increase (Figure 6). These results are consistent with previous findings in subtropical and tropical acidic forest soils [36,38], suggesting that nutrient-rich taxa like Actinobacteria and Ascomycetes thrive with HN availability, whereas nutrient-poor taxa such as Acidobacteria decline with increased N application [38,40]. Regarding the impact of N addition on fungal community composition, we observed a decrease in the relative abundance of the dominant fungal phylum Ascomycetes in both the dry and wet seasons, with a corresponding increase in the Actinobacteria phylum with N concentration escalation (Figure 6). This could be attributed to the adaptability of Ascomycetes to infertile soils, thriving in nutrient-deprived conditions [41,42]. As soil nutrient levels increased post-N addition in our study, the dominance of the Ascomycetes phylum decreased, whereas the Actinobacteria phylum increased. Prior research in temperate forest soils has also reported a similar trend, with N deposition boosting the relative abundance of soil ascomycetes while reducing that of ascomycetes [43,44]. The discrepancy between our findings and the aforementioned findings can be attributed to significant variations in climatic and soil nutrient conditions in the study area. Distinctions between subtropical forests and temperate/boreal forests extend beyond climate; subtropical forests are typically more phosphorus-limited and less nitrogen-limited, with acidic soils and low alkali cation concentrations [45]. Further N additions in subtropical forests may escalate the risk of N saturation and increase phosphorus limitation, potentially reducing soil microbial biomass and biodiversity. In terms of dominant genera, the study revealed that the primary bacterial genera (Gp2, Gp1, and Gp3) in both dry and wet seasons belonged to the Acidobacteria phylum. N addition led to a reduction in the relative abundance of these dominant bacterial genera, aligning with the typical response of Acidobacteria to N addition. This trend coincides with the prevailing dominance of Acidobacteria in the study area. In contrast, significant shifts were observed in the dominant fungal genera, with Archaeorhizomyces dominating in the dry season and Podila in the wet season. Notably, N addition reduced the relative abundance of these dominant fungal genera, indicating varying responses of bacterial and fungal genera to seasonal changes and N treatments. Fungal genera appeared more sensitive to N addition and seasonal variations than bacterial genera.
4.3. Correlation of Soil Microbial Communities with Environmental Factors
N deposition can exert direct or indirect influences on SMCs by modifying various soil properties and enzyme activities [15,46]. Numerous environmental factors have been identified as key contributors to changes in soil microbial community composition, encompassing soil moisture, pH, SOC, TN, inorganic N content, climate change, and above-ground vegetation [47,48,49,50]. This study underscores the pivotal roles of soil nutrients, enzyme activities, and microbial diversity in shaping microbial community variation. Variance partitioning analyses highlighted the significant impact of soil nutrients on bacterial diversity variation and the interlinked relationship between soil nutrients, enzyme activities, and fungal diversity variation, findings supported by other studies [51], emphasizing the intricate interplay among soil physicochemical properties, enzyme activities, and microbial communities. Through the Mantel test and redundancy analysis, this study identified AP content and UE enzyme activity as the most crucial environmental factors regulating microbial communities in the dry season. Changes in UE activity can influence N efficiency and soil N supply capacity, subsequently impacting N uptake, plant growth, and ultimately, the structure and function of SMCs. N addition can alter microbial biomass and modify the processes of microbial phosphorus uptake, fixation, and transformation [28]. A decrease in pH may inhibit microbial growth, consequently reducing phosphorus uptake [52]. Moreover, increased SOC input following N addition enhances the availability of carbon and N sources for microorganisms, stimulating microbial growth and accelerating the uptake and turnover of phosphorus [53]. This highlights that the impact of N addition on soil phosphorus is not a simple linear relationship, but rather a complex pathway of influence. In the wet season, the most influential environmental factors regulating the microbial community were NO3−-N and NH4+-N, aligning with hypothesis (2). These N forms are crucial for plant growth, modulating the structure and function of SMCs. A notable increase in NO3−-N and NH4+-N can stimulate the growth of microorganisms involved in the N cycle (including Ascomycetes, Actinomycetes, and Basidiomycota), which is pivotal in N biogeochemical cycling. Additionally, soil microorganisms are vital in the uptake, transformation, and cycling of NO3−-N and NH4+-N, participating in key reactions that regulate N transformations and supply, influencing the effective utilization of soil N and ensuring the balance of biogeochemical cycles. Owing to the inherent variations in the structure and function of SMCs, their adaptability to diverse environments and nutrient requirements differ. The ample moisture in the wet season significantly boosts soil AP content, alleviating phosphorus limitation in the soil. Consequently, the key environmental factors regulating microbial communities show distinct patterns between the dry and wet seasons.
5. Conclusions
The findings of this study demonstrated that a 4-year N addition treatment induced notable alterations in soil chemical properties and enzyme activities, leading to soil acidification in subtropical EBLFs. However, increased water content during the wet season mitigated this acidification trend. The impact of N addition on microbial community structure and composition was found to be seasonal, with a reduction in soil microbial abundance and diversity witnessed in the dry season. Conversely, N addition during the wet season lessened these negative effects. The above research results are consistent with hypothesis (1) and hypothesis (3). The response of SMCs to N addition varied significantly between the two studied seasons, with fungal genera being particularly sensitive to N addition during the wet season. Soil chemical properties and enzyme activities were crucial in shaping the structure of microbial communities. Hypothesis (3), that nitrogen availability is the main environmental factor affecting microbial community structure, was supported in the dry season, while the key environmental factors affecting these communities differed significantly between the dry and wet seasons due to differences in moisture conditions. This research provides valuable insights into the management of subtropical forests and enhances our understanding of how global environmental changes might impact below-ground microbial communities in these ecosystems.
Author Contributions
Investigation, methodology, formal analysis, visualization, writing—original draft, writing—reviewing and editing, W.C.; conceptualization, visualization, methodology, data curation, writing—original draft, Z.H.; investigation, methodology, data curation, D.Z.; investigation, validation, software, L.C.; resources, supervision, project administration K.W.; project administration, supervision, funding acquisition, writing—review and editing, Y.S. All authors have read and agreed to the published version of the manuscript.
Funding
This work was supported by the Yunnan Fundamental Research Projects (202401AT070262), the Agricultural Joint Special Project of Yunnan Province (202301BD070001-059), the First-Class Discipline Construction Project of Yunnan Province ([2022] No. 73), the Natural Ecology Monitoring Network Project Operation Project of Yuxi Forest Ecological Station in Yunnan Province (2024-YN-13), and the Long-term Scientific Research Base of Yuxi Forest Ecosystem National in Yunnan Province (2020132550).
Data Availability Statement
The data are available upon request from the corresponding author.
Acknowledgments
The authors thank the following people for their help with this research: Jinmei Xing, Chenggong Song, Xiao-dong Li, and Qian Wang provided field assistance. Xiaohua Zhang provided assistance with creating the figures.
Conflicts of Interest
The authors declare no conflicts of interest.
References
- Chen, J.; Luo, T.; Zhou, Z.; Xu, H.; Jiang, Z.Y. Research advances in nitrogen deposition effects on microbial processes involved in soil nitrogen cycling in tropical and subtropical forests. Acta Ecol. Sin. 2020, 40, 8528–8538. [Google Scholar]
- Liu, X.; Zhang, Y.; Han, W.; Tang, A.; Shen, J. Enhanced nitrogen deposition over China. Nature 2013, 494, 459–462. [Google Scholar]
- Cui, S.; Shi, Y.; Groffman, P.M.; Schlesinger, W.H.; Zhu, Y.-G. Centennial-scale analysis of the creation and fate of reactive nitrogen in China (1910–2010). Proc. Natl. Acad. Sci USA. 2013, 110, 2052–2057. [Google Scholar] [PubMed]
- Xie, D.-N.; Yang, D.-X.; Duan, L. Response of Forest Ecosystems to Decreasing Atmospheric Nitrogen Deposition. Huan Jing Ke Xue = Huanjing Kexue 2023, 44, 2681–2693. [Google Scholar] [PubMed]
- Zhang, P.; Lü, X.-T.; Li, M.-H.; Wu, T.; Jin, G. N limitation increases along a temperate forest succession: Evidences from leaf stoichiometry and nutrient resorption. J. Plant Ecol. 2022, 15, 1021–1035. [Google Scholar]
- Liu, S.; Wang, H.; Deng, Y.; Tian, P.; Wang, Q. Forest conversion induces seasonal variation in microbial β-diversity. Environ. Microbiol. 2018, 20, 111–123. [Google Scholar]
- Yu, G.; Jia, Y.; He, N.; Zhu, J.; Chen, Z.; Wang, Q.; Piao, S.; Liu, X.; He, H.; Guo, X. Stabilization of atmospheric nitrogen deposition in China over the past decade. Nat. Geosci. 2019, 12, 424–429. [Google Scholar]
- Van Leeuwen, J.; Djukic, I.; Bloem, J.; Lehtinen, T.; Hemerik, L.; De Ruiter, P.; Lair, G. Effects of land use on soil microbial biomass, activity and community structure at different soil depths in the Danube floodplain. Eur. J. Soil Biol. 2017, 79, 14–20. [Google Scholar]
- Meena, M.; Yadav, G.; Sonigra, P.; Nagda, A.; Mehta, T.; Swapnil, P.; Harish; Marwal, A.; Kumar, S. Multifarious responses of forest soil microbial community toward climate change. Microb. Ecol. 2023, 86, 49–74. [Google Scholar] [PubMed]
- Li, Y.; Nie, C.; Liu, Y.; Du, W.; He, P. Soil microbial community composition closely associates with specific enzyme activities and soil carbon chemistry in a long-term nitrogen fertilized grassland. Sci. Total Environ. 2019, 654, 264–274. [Google Scholar]
- Erdel, E.; Şimşek, U.; Kesimci, T.G. Effects of fungi on soil organic carbon and soil enzyme activity under agricultural and pasture land of Eastern Türkiye. Sustainability 2023, 15, 1765. [Google Scholar] [CrossRef]
- Rao, M.A.; Scelza, R.; Acevedo, F.; Diez, M.; Gianfreda, L. Enzymes as useful tools for environmental purposes. Chemosphere 2014, 107, 145–162. [Google Scholar] [PubMed]
- Wu, J.; Liu, W.; Zhang, W.; Shao, Y.; Duan, H.; Chen, B.; Wei, X.; Fan, H. Long-term nitrogen addition changes soil microbial community and litter decomposition rate in a subtropical forest. Appl. Soil Ecol. 2019, 142, 43–51. [Google Scholar]
- Cui, J.; Yuan, X.; Zhang, Q.; Zhou, J.; Lin, K.; Xu, J.; Zeng, Y.; Wu, Y.; Cheng, L.; Zeng, Q. Nutrient availability is a dominant predictor of soil bacterial and fungal community composition after nitrogen addition in subtropical acidic forests. PLoS ONE 2021, 16, e0246263. [Google Scholar]
- Wang, J.; Shi, X.; Zheng, C.; Suter, H.; Huang, Z. Different responses of soil bacterial and fungal communities to nitrogen deposition in a subtropical forest. Sci. Total Environ. 2021, 755, 142449. [Google Scholar] [PubMed]
- Zhou, Z.; Wang, C.; Luo, Y. Meta-analysis of the impacts of global change factors on soil microbial diversity and functionality. Nat. Commun. 2020, 11, 3072. [Google Scholar]
- Yang, A.; Song, B.; Zhang, W.; Zhang, T.; Li, X.; Wang, H.; Zhu, D.; Zhao, J.; Fu, S. Chronic enhanced nitrogen deposition and elevated precipitation jointly benefit soil microbial community in a temperate forest. Soil Biol. Biochem. 2024, 193, 109397. [Google Scholar]
- Zhang, Y.; Wang, P.; Long, Z.; Ding, L.; Zhang, W.; Tang, H.; Liu, J. Research progress of soil microorganism application based on high-throughput sequencing technology. In IOP Conference Series: Earth and Environmental Science; IOP Publishing: Bristol, UK, 2021; Volume 692, p. 042059. [Google Scholar]
- Niu, S.; Long, Y.; Li, H.; Da, W.; Hu, S.; Li, W.; Zhu, X.; Kong, W. Microbial diversity in saline alkali soil from Hexi Corridor analyzed by Illumina MiSeq high-throughput sequencing system. Microbiol. China 2017, 44, 2067–2078. [Google Scholar]
- Leng, Q.; Cui, J.; Zhou, F.; Du, K.; Zhang, L.; Fu, C.; Liu, Y.; Wang, H.; Shi, G.; Gao, M. Wet-only deposition of atmospheric inorganic nitrogen and associated isotopic characteristics in a typical mountain area, southwestern China. Sci. Total Environ. 2018, 616, 55–63. [Google Scholar]
- Hou, Z.; Zhang, X.; Chen, W.; Liang, Z.; Wang, K.; Zhang, Y.; Song, Y. Differential Responses of Bacterial and Fungal Community Structure in Soil to Nitrogen Deposition in Two Planted Forests in Southwest China in Relation to pH. Forests 2024, 15, 1112. [Google Scholar] [CrossRef]
- Bao, S.D. Soil and Agricultural Chemistry Analysis; China Agricultural Press: Beijing, China, 2000. [Google Scholar]
- Gui-Sen, Y.; Zhi-Shan, Z.; Yang, Z.; Ya-Fei, S.; Rui, H.U. Litter decomposition and its effects on soil microbial community in Shapotou area, China. Chin. J. Appl. Ecol. 2022, 33, 1810–1818. [Google Scholar]
- Gui-Yao, L.; Li-Li, C.; Zhi-You, Y. Effects of nitrogen addition on the structure of rhizosphere microbial community in Pinus tabuliformis plantations on Loess Plateau, China. Chin. J. Appl. Ecol. 2019, 30, 117–126. [Google Scholar]
- Guan-Tao, C.; Yong, P.; Jun, Z.; Shun, L.I.; Li-Hua, T. Effects of short-term nitrogen addition on fine root biomass, lifespan and morphology of Castanopsis platyacantha in a subtropical secondary evergreen broad-leaved forest. Chin. J. Plant Ecol. 2017, 41, 1041–1050. [Google Scholar]
- Britton, A.J.; Helliwell, R.C.; Fisher, J.M.; Gibbs, S. Interactive effects of nitrogen deposition and fire on plant and soil chemistry in an alpine heathland. Environ. Pollut. 2008, 156, 409–416. [Google Scholar]
- Nair, A.; Sarma, S. The impact of carbon and nitrogen catabolite repression in microorganisms. Microbiol. Res. 2021, 251, 126831. [Google Scholar] [CrossRef]
- Zhang, X.; Zhao, Q.; Sun, Q.-Y.; Mao, B.; Zeng, D.-H. Understory vegetation interacts with nitrogen addition to affect soil phosphorus transformations in a nutrient-poor Pinus sylvestris var. mongolica plantation. For. Ecol. Manag. 2022, 507, 120026. [Google Scholar]
- Zhou, H.; Zhang, D.; Jiang, Z.; Sun, P.; Xiao, H.; Yuxin, W.; Chen, J. Changes in the soil microbial communities of alpine steppe at Qinghai-Tibetan Plateau under different degradation levels. Sci. Total Environ. 2019, 651, 2281–2291. [Google Scholar] [PubMed]
- Xia, Z.; Yang, J.; Sang, C.; Wang, X.; Sun, L.; Jiang, P.; Wang, C.; Bai, E. Phosphorus reduces negative effects of nitrogen addition on soil microbial communities and functions. Microorganisms 2020, 8, 1828. [Google Scholar] [CrossRef]
- Kuscu, I.K.; Cetin, M.; Yigit, N.; Savaci, G.; Sevik, H. Relationship between Enzyme Activity (Urease-Catalase) and Nutrient Element in Soil Use. Pol. J. Environ. Stud. 2018, 27, 2107–2112. [Google Scholar]
- Freeman, C.; Nevison, G.B.; Hughes, S.; Reynolds, B.; Hudson, J. Enzymic involvement in the biogeochemical responses of a Welsh peatland to a rainfall enhancement manipulation. Biol. Fertil. Soils 1998, 27, 173–178. [Google Scholar]
- He, Y.; Xing, Y.; Yan, G.; Liu, G.; Liu, T.; Wang, Q. Long-Term Nitrogen Addition Could Modify Degradation of Soil Organic Matter through Changes in Soil Enzymatic Activity in a Natural Secondary Forest. Forests 2023, 14, 2049. [Google Scholar] [CrossRef]
- Zhang, C.; Liu, G.; Xue, S.; Wang, G. Soil bacterial community dynamics reflect changes in plant community and soil properties during the secondary succession of abandoned farmland in the Loess Plateau. Soil Biol. Biochem. 2016, 97, 40–49. [Google Scholar]
- Allison, S.D.; Hanson, C.A.; Treseder, K.K. Nitrogen fertilization reduces diversity and alters community structure of active fungi in boreal ecosystems. Soil Biol. Biochem. 2007, 39, 1878–1887. [Google Scholar]
- Wang, C.; Lu, X.; Mori, T.; Mao, Q.; Zhou, K.; Zhou, G.; Nie, Y.; Mo, J. Responses of soil microbial community to continuous experimental nitrogen additions for 13 years in a nitrogen-rich tropical forest. Soil Biol. Biochem. 2018, 121, 103–112. [Google Scholar]
- Drabek, O.; Boruvka, L.; Mladkova, L.; Kocarek, M. Possible method of aluminium speciation in forest soils. J. Inorg. Biochem. 2003, 97, 8–15. [Google Scholar] [PubMed]
- Nie, Y.; Wang, M.; Zhang, W.; Ni, Z.; Hashidoko, Y.; Shen, W. Ammonium nitrogen content is a dominant predictor of bacterial community composition in an acidic forest soil with exogenous nitrogen enrichment. Sci. Total Environ. 2018, 624, 407–415. [Google Scholar] [PubMed]
- Demoling, F.; Nilsson, L.O.; Bååth, E. Bacterial and fungal response to nitrogen fertilization in three coniferous forest soils. Soil Biol. Biochem. 2008, 40, 370–379. [Google Scholar]
- Fierer, N.; Leff, J.W.; Adams, B.J.; Nielsen, U.N.; Bates, S.T.; Lauber, C.L.; Owens, S.; Gilbert, J.A.; Wall, D.H.; Caporaso, J.G. Cross-biome metagenomic analyses of soil microbial communities and their functional attributes. Proc. Natl. Acad. Sci. USA 2012, 109, 21390–21395. [Google Scholar]
- Gleeson, D.B.; Kennedy, N.M.; Clipson, N.; Melville, K.; Gadd, G.M.; McDermott, F.P. Characterization of bacterial community structure on a weathered pegmatitic granite. Microb. Ecol. 2006, 51, 526–534. [Google Scholar] [PubMed]
- Jumpponen, A. Soil fungal community assembly in a primary successional glacier forefront ecosystem as inferred from rDNA sequence analyses. New Phytol. 2003, 158, 569–578. [Google Scholar]
- Morrison, E.W.; Frey, S.D.; Sadowsky, J.J.; van Diepen, L.T.; Thomas, W.K.; Pringle, A. Chronic nitrogen additions fundamentally restructure the soil fungal community in a temperate forest. Fungal Ecol. 2016, 23, 48–57. [Google Scholar]
- Weber, C.F.; Vilgalys, R.; Kuske, C.R. Changes in fungal community composition in response to elevated atmospheric CO2 and nitrogen fertilization varies with soil horizon. Front. Microbiol. 2013, 4, 78. [Google Scholar]
- Hall, S.J.; Matson, P.A. Nutrient status of tropical rain forests influences soil N dynamics after N additions. Ecol. Monogr. 2003, 73, 107–129. [Google Scholar]
- Shi, X.; Hu, H.-W.; Wang, J.; He, J.-Z.; Zheng, C.; Wan, X.; Huang, Z. Niche separation of comammox Nitrospira and canonical ammonia oxidizers in an acidic subtropical forest soil under long-term nitrogen deposition. Soil Biol. Biochem. 2018, 126, 114–122. [Google Scholar]
- Högberg, M.N.; Högberg, P.; Myrold, D.D. Is microbial community composition in boreal forest soils determined by pH, C-to-N ratio, the trees, or all three? Oecologia 2007, 150, 590–601. [Google Scholar]
- Yang, Y.; Wu, L.; Lin, Q.; Yuan, M.; Xu, D.; Yu, H.; Hu, Y.; Duan, J.; Li, X.; He, Z. Responses of the functional structure of soil microbial community to livestock grazing in the T ibetan alpine grassland. Glob. Chang. Biol. 2013, 19, 637–648. [Google Scholar]
- Yao, M.; Rui, J.; Li, J.; Dai, Y.; Bai, Y.; Heděnec, P.; Wang, J.; Zhang, S.; Pei, K.; Liu, C. Rate-specific responses of prokaryotic diversity and structure to nitrogen deposition in the Leymus chinensis steppe. Soil Biol. Biochem. 2014, 79, 81–90. [Google Scholar]
- Lladó, S.; López-Mondéjar, R.; Baldrian, P. Forest soil bacteria: Diversity, involvement in ecosystem processes, and response to global change. Microbiol. Mol. Biol. Rev. 2017, 81, e00063-16. [Google Scholar] [PubMed]
- He, D.; Guo, Z.; Shen, W.; Ren, L.; Sun, D.; Yao, Q.; Zhu, H. Fungal communities are more sensitive to the simulated environmental changes than bacterial communities in a subtropical forest: The single and interactive effects of nitrogen addition and precipitation seasonality change. Microb. Ecol. 2023, 86, 521–535. [Google Scholar] [PubMed]
- Richards, S.; Marshall, R.; Lag-Brotons, A.J.; Semple, K.T.; Stutter, M. Phosphorus solubility changes following additions of bioenergy wastes to an agricultural soil: Implications for crop availability and environmental mobility. Geoderma 2021, 401, 115150. [Google Scholar]
- Liu, M.; Liu, J.; Chen, X.; Jiang, C.; Wu, M.; Li, Z. Shifts in bacterial and fungal diversity in a paddy soil faced with phosphorus surplus. Biol. Fertil. Soils 2018, 54, 259–267. [Google Scholar]


Disclaimer/Publisher’s Note: The statements, opinions and data contained in all publications are solely those of the individual author(s) and contributor(s) and not of MDPI and/or the editor(s). MDPI and/or the editor(s) disclaim responsibility for any injury to people or property resulting from any ideas, methods, instructions or products referred to in the content. |
© 2024 by the authors. Licensee MDPI, Basel, Switzerland. This article is an open access article distributed under the terms and conditions of the Creative Commons Attribution (CC BY) license (https://creativecommons.org/licenses/by/4.0/).