Article

Spatial Pattern of Drought-Induced Mortality Risk and Influencing Factors for Robinia pseudoacacia L. Plantations on the Chinese Loess Plateau

by
Zhong-Dian Zhang
1,2,3,4,
Tong-Hui Liu
1,2,5,
Ming-Bin Huang
6,
Xiao-Ying Yan
6,
Ming-Hua Liu
1,2,
Jun-Hui Yan
1,2,5,
Fei-Yan Chen
1,2,
Wei Yan
1,2,5 and
Ji-Qiang Niu
1,2,*
1
School of Geographic Sciences, Xinyang Normal University, Xinyang 464000, China
2
Henan Key Laboratory for Synergistic Prevention of Water and Soil Environmental Pollution, Xinyang Normal University, Xinyang 464000, China
3
Henan Dabieshan National Field Observation and Research Station of Forest Ecosystem, Zhengzhou 450046, China
4
Xinyang Academy of Ecological Research, Xinyang 464000, China
5
North-South Transitional Zone Typical Vegetation Phenology Observation and Research Station of Henan Province, Xinyang 464000, China
6
State Key Laboratory of Soil Erosion and Dryland Farming on the Loess Plateau, College of Soil and Water Conservation Science and Engineering, Northwest A&F University, Xianyang 712100, China
*
Author to whom correspondence should be addressed.
Forests 2024, 15(8), 1477; https://doi.org/10.3390/f15081477
Submission received: 1 August 2024 / Revised: 17 August 2024 / Accepted: 21 August 2024 / Published: 22 August 2024
(This article belongs to the Section Forest Hydrology)

Abstract

:
During the large-scale vegetation restoration on the Loess Plateau, the introduction of exotic species with high water consumption, such as Robinia pseudoacacia L., led to widespread soil desiccation, and resulted in severe drought stress and increasing risk of forest degradation and mortality. Accurate assessment of drought-induced mortality risk in plantation forests is essential for evaluating and enhancing the sustainability of ecological restoration, yet quantitative research at the regional scale on the Loess Plateau is lacking. With a focus on Robinia pseudoacacia L. plantations, we utilized a coupled model of the Biome BioGeochemical Cycles model and plant supply–demand hydraulic model (BBGC-SPERRY model) to simulate the dynamics of the annual average percentage loss of whole-plant hydraulic conductance (APLK) at 124 meteorological stations over an extended period (1961–2020) to examine changes in plant hydraulic safety in Robinia pseudoacacia L. plantations. Based on the probability distribution of APLK at each site, the drought-induced mortality risk probability (DMRP) in Robinia pseudoacacia L. was determined. The results indicate the BBGC-SPERRY model could effectively simulate the spatiotemporal variations in transpiration and evapotranspiration in Robinia pseudoacacia L. stands on the Loess Plateau. The mean APLK and DMRP exhibited increasing trends from southeast to northwest along a precipitation gradient, with their spatial patterns on the Loess Plateau mainly driven by mean annual precipitation and also significantly influenced by other climatic and soil factors. The low-risk (DMRP < 2%), moderate-risk (2% ≤ DMRP ≤ 5%), and high-risk (DMRP > 5%) zones for drought-induced mortality in Robinia pseudoacacia L. accounted for 60.0%, 30.7%, and 9.3% of the study area, respectively. These quantitative findings can provide an important basis for rational forestation and sustainable vegetation management on the Loess Plateau.

1. Introduction

Forests play a key role in global water, carbon, and nitrogen cycles, and offer a wide array of ecosystem services such as soil and water conservation, air purification, maintenance of biodiversity, etc. [1,2,3]. Due to global climate change, widespread and intense alteration of regional precipitation patterns are causing more frequent and severe soil droughts, which are often accompanied by atmospheric drought induced by high air temperature and vapor pressure deficit (VPD), thus posing a substantial threat of drought-induced tree mortality in many forest biomes around the world [4,5,6]. Accurate assessment of the drought-induced mortality risk for trees is the basis of disaster preparedness and mitigation efforts, and is of vital significance for sustaining the ecological benefits of forest ecosystems.
The drought-induced mortality of trees is a complex eco-physiological process that occurs across different temporal scales [7,8]. Previous studies suggested that merely relying on environmental indicators such as meteorological parameters and soil moisture often proves inadequate for reliable assessment [7,9,10,11]. More accurate quantification of drought-induced mortality risk of trees requires the utilization of process-based eco-hydrological models that explicitly describe the physiological mechanisms involved [12,13]. Accordingly, mechanisms driving tree mortality under drought primarily include hydraulic failure, carbon starvation, and pest and pathogen infestation [14,15]. According to the hydraulic failure hypothesis, xylem embolism progressively occurs due to soil and atmospheric drought, which endangers plant hydraulic safety by impeding long-distance water transport in trees and further leads to dehydration and death of tissues [16]. In terms of carbon starvation, the simultaneous reduction in stomatal aperture and stomatal closure under drought stress diminishes carbon assimilation by photosynthesis, which usually couples with hindered carbohydrate transport in the phloem and increasing carbohydrate consumption to repair drought-damaged tissues, resulting in exacerbated carbon imbalance in plants and ultimately leading to tree mortality [17,18]. Additionally, drought diminishes the resistance of trees to pests and pathogens and also alters the population dynamics of insects and pathogens, including growth rates, mortality rates, and geographical distributions. Consequently, trees become more susceptible to pest and pathogen attacks, which also contributes to increasing mortality [19]. Among these mechanisms, plant hydraulic safety strongly influences stomatal regulation behavior during drought and further impacts carbon dynamics, thereby occupying a central role in determining drought-induced tree mortality [7,20]. Plant hydraulic safety can be better quantitatively simulated through current models than other mechanisms, making it one of the optimal approaches for predicting drought-induced tree mortality [14,16,21].
The Loess Plateau is one of the regions in the world with the most severe soil erosion. To mitigate soil erosion and enhance environmental quality, a series of vegetation restoration strategies have been implemented since the 1950s, including the “Three-North Shelterbelt Development Program”, the “Soil and Water Conservation Program”, the “Grain-for-Green Program”, etc. Robinia pseudoacacia L. is often employed as a pioneer species for vegetation restoration on the Loess Plateau due to its rapid growth and tolerance of poor soil fertility [22,23], and accounts for more than 80% of planted deciduous broadleaf forests in this area [24,25]. However, soil moisture rapidly decreased in most areas due to the high water consumption of the Robinia pseudoacacia L. plantations [26]. The consequent soil desiccation led to the formation of dry deep soil layers, which diminishes the capability of the soil reservoir to supply water to trees; this leaves trees entirely reliant on precipitation for their water use [27,28]. Due to the strong spatial and temporal variability of precipitation on the Loess Plateau, Robinia pseudoacacia L. plantations are susceptible to frequent and severe drought stress [29], and numerous field investigations reported their widespread degradation and mortality [22,30,31,32]. However, quantitative assessment of drought-induced mortality risk at the regional scale for Robinia pseudoacacia L. plantations on the Loess Plateau is still lacking. The sustainability of Robinia pseudoacacia L. plantations and the effectiveness of soil and water conservation efforts face serious uncertainties.
Zhang, et al. [33] incorporated the plant supply–demand hydraulic model proposed by Sperry, et al. [34] into the Biome BioGeochemical Cycles model (abbreviated as the BBGC-SPERRY model). The BBGC-SPERRY model enables the coupled simulation of plant hydraulic traits with water, carbon, and nitrogen cycles in ecosystems using basic stand information and meteorological data, providing an effective tool for assessing tree drought-induced mortality risk based on plant hydraulic safety [35]. Using the BBGC-SPERRY model, the objectives of this study were to (1) simulate the long-term dynamics of plant hydraulic traits in the Robinia pseudoacacia L. plantations on the Loess Plateau; (2) quantitatively assess the spatial pattern of drought-induced mortality risk in the Robinia pseudoacacia L. plantations based on plant hydraulic safety; and (3) analyze the influencing factors of plant hydraulic safety and drought-induced mortality risk in the Robinia pseudoacacia L. plantations. Building on previous field investigations and analyses using climate factors on the Loess Plateau, this study provided a physiological-based quantitative evaluation of drought-induced mortality risk for Robinia pseudoacacia L. plantations at the regional scale. These quantitative findings contribute to the deepening of our understanding of the ecogeographical patterns of drought-induced tree mortality risk, and offer an important basis for rational forestation and sustainable vegetation management in this area.

2. Materials and Methods

2.1. Study Area

The Loess Plateau (100.90° E~114.55° E, 33.72° N~41.27° N) is situated in the middle and upper reaches of the Yellow River, covering an area of 64 × 104 km2 (Figure 1). The climate transitions from semi-humid (mean annual precipitation of 250 to 500 mm) to semi-arid conditions (mean annual precipitation of 500 to 800 mm) [36,37], with mean annual precipitation (MAP) decreasing from 700 to 200 mm and mean annual temperature (MAT) decreasing from 14.3 to 3.6 °C from southeast to northwest. The annual potential evaporation ranges from 865 to 1274 mm. The region is characterized by loess soil that is 30 to 200 m thick [38], with soil textures also following a spatial gradient of decreasing clay content and increasing sand content from the southeast to the northwest [39].
According to the hydrogeomorphic types, climatic conditions, soil characteristics, and vegetation construction scheme of the “Three-North Shelterbelt Development Program” (http://www.forestry.gov.cn/c/sbj/gcgk.jhtml, accessed on 13 May 2023), Robinia pseudoacacia L. was widely planted in the loess hilly-gully region located in the southeast of the Loess Plateau. Therefore, this loess hilly-gully region was set as the simulation area for analyzing the drought-induced mortality risk of Robinia pseudoacacia L. plantations (Figure 1). The study area covers 33 × 104 km2, and includes diverse landforms including hills, gullies, ridges, and basins, as well as large flat areas with little or no erosion. The predominant soil types in the study area include silt–clay, silt–clay–loam, silt-loam, loam, sand–loam, and loam–sand. The methodology and data sources of the study are shown in Figure 2.

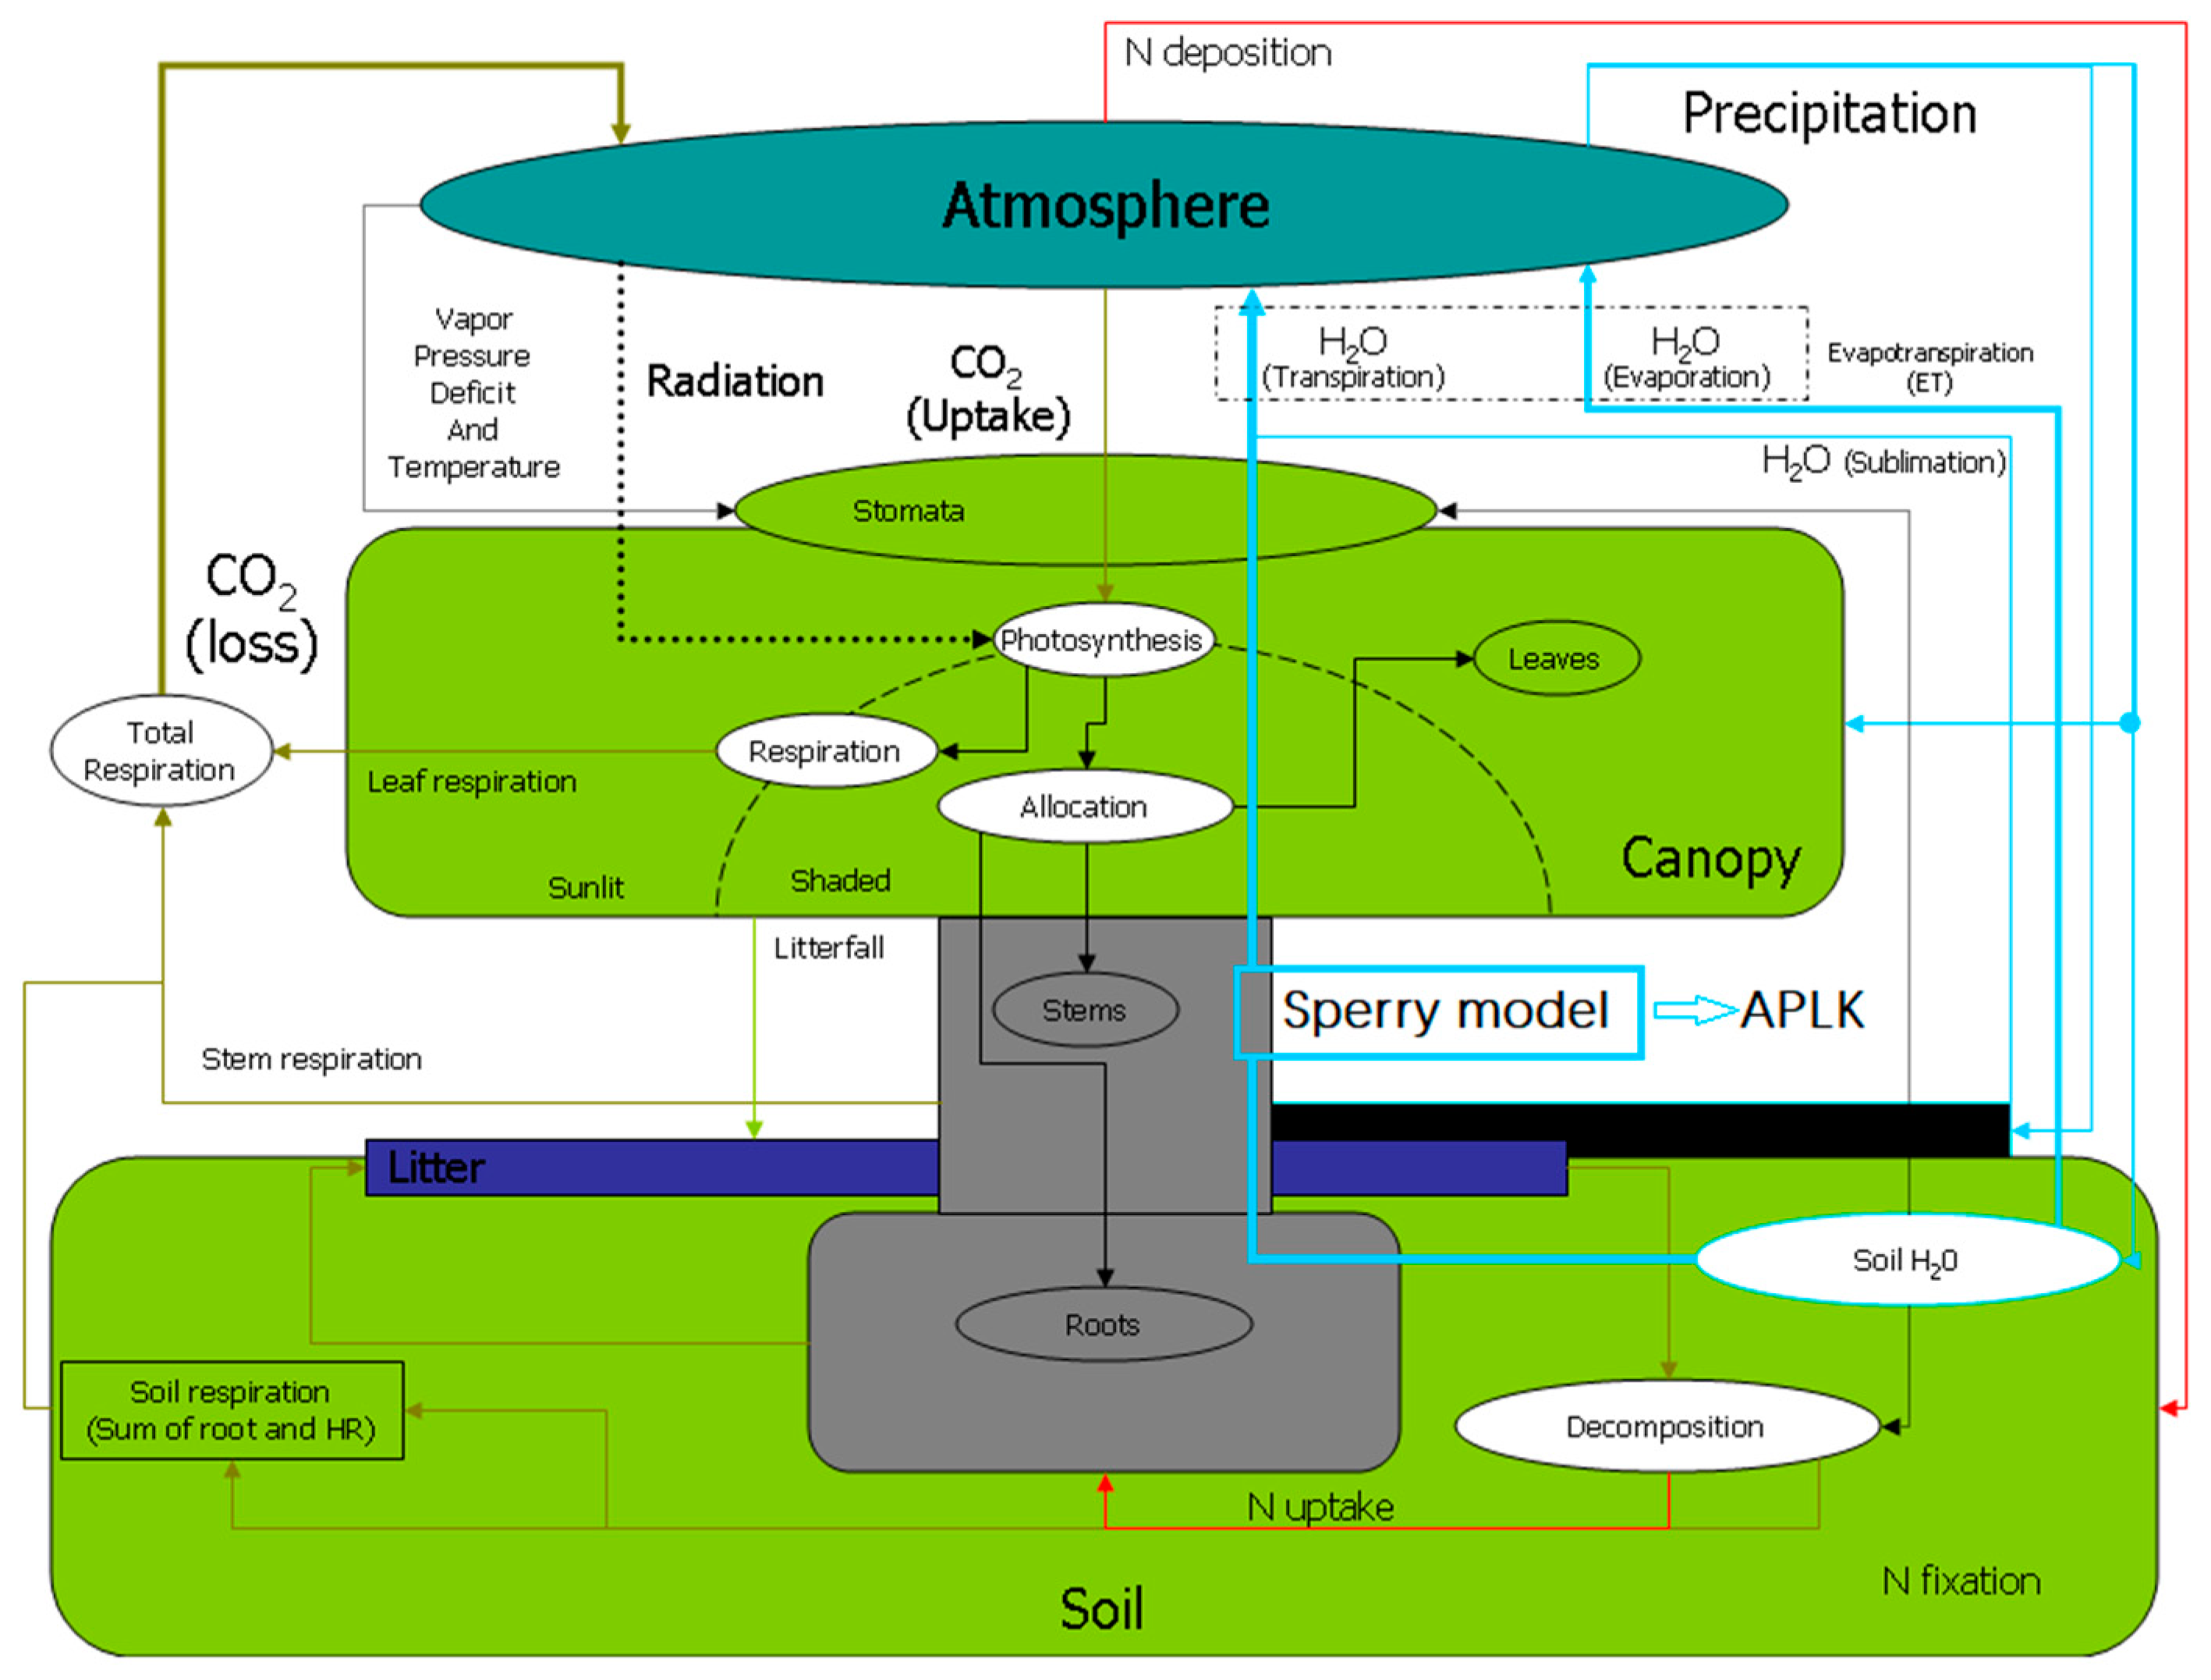
2.2. BBGC-SPERRY Model Description

In the BBGC-SPERRY model, the Biome BioGeochemical Cycles model (Biome-BGC model) was coupled with the plant supply–demand hydraulic model (Sperry model) to simultaneously simulate the dynamics in plant hydraulic traits and water, carbon (C), and nitrogen (N) cycles at daily timesteps (Figure 3). Eco-physiological parameters and values used in this BBGC-SPERRY model are summarized in Table 1. The values of all parameters were derived from either published data for each species in the study area or recommended data for the deciduous broadleaf forest provided by White, et al. [40].
Complete details of the BBGC-SPERRY model were reported in previous studies [33,34,41,42]. Here, we provide a brief summary of the main algorithms. C is added to the system by photosynthesis, and lost by autotrophic respiration, heterotrophic respiration, fire, harvest disturbance events, etc. Photosynthesis is simulated based on the enzymatic kinetics of Rubisco in relation to temperature, CO2 availability, and the rate of Rubisco regeneration as described in the Farquhar photosynthesis model [43]. For autotrophic respiration, maintenance respiration is modelled by a Q10 function using temperature and N content. Heterotrophic respiration is assumed to be a constant proportion of all new tissue growth. Soil mineral N is added to the system by mineralization from the slowest soil organic matter pool, N deposition from the atmosphere, and N fixation, and lost from the system through leaching and volatilization. Water is input to the system through precipitation as either rain or snow, and rainfall is intercepted by the canopy using a prescribed interception coefficient based on the leaf area index. Water is lost by processes including canopy evaporation of intercepted water, transpiration, and soil evaporation, in which canopy and soil evaporation are calculated based on Penman–Monteith functions with different types of conductance [44], while transpiration and associated water transport processes in the soil–plant–atmosphere continuum (SPAC) are simulated by the Sperry model (Figure 3).
Table 1. Major parameters of the BBGC-SPERRY model for Robinia pseudoacacia L. used in this study.
ParameterValue
(a) Biome-BGC model
Transfer growth period fraction of growing season (%)0.2
Litterfall fraction of growing season (%)0.2
Annual leaf and fine root turnover fraction (yr−1)1.00
Annual live wood turnover fraction (yr−1)0.7
Allocation new fine root C:new leaf C1.0
Allocation new stem C:new leaf C2.20
Allocation new live wood C:new total wood C0.209 [40]
Allocation new root C:new stem C0.22
Allocation current growth proportion (%)0.5
C:N of leaves18.8 [45]
C:N of leaf litter32.2 [46]
C:N of fine roots26.7 [45]
C:N of live wood50
C:N of dead wood550
Leaf litter labile proportion0.35
Leaf litter cellulose proportion0.40
Leaf litter lignin proportion0.26 [45]
Fine root labile proportion0.34
Fine root cellulose proportion0.44
Fine root lignin proportion0.22
Dead wood cellulose proportion0.68
Dead wood lignin proportion0.32
Canopy water interception coefficient (LAI−1 d−1)0.045
Canopy light extinction coefficient0.54
All-sided to projected leaf area ratio2.0
Specific leaf area (m2 kg−1 C)27.9 [45]
Ratio of shaded SLA:sunlit SLA1.3
Fraction of leaf N in Rubisco0.14
Cuticular conductance (m s−1)0.00006
Boundary layer conductance (m s−1)0.01
(b) Sperry model
Weibull function b and c for root, stem, leaf b = 2.6, c = 4.1 [33]
Maximum whole-plant hydraulic conductance per leaf area (mmol s−1 m−2 MPa−1)4.2
Maximum diffusive conductance (mol s−1 m−2)0.1
Average % resistance in rhizosphere (%)20.5
Root depth coefficient0.99 [47]
Number of root and soil layers5
Note: C = carbon; N = nitrogen; LAI = leaf area index; and SLA = specific leaf area.
The Sperry model divides the SPAC system into leaf, stem, root, and rhizosphere components in series, and adopts a supply function and a demand function to solve the water flux, whole-plant hydraulic conductance (kplant), and distribution of water potential and hydraulic conductance in the SPAC system [34]. The supply function (Eleaf)) describes the relationship between transpiration rate (E) and leaf water potential (Ψleaf) at a given soil water potential (Ψsoil) profile. For each component, the vulnerability curve (k(Ψ)i) quantifies the decline of hydraulic conductance with decreasing water potential (Ψ). The steady-state flow rate through each component (Ei) is then calculated by the integral transform of k(Ψ)i from the downstream (Ψdown) to the upstream (Ψup):
E i = Ψ down Ψ up k ( Ψ ) i d Ψ
The demand function assumes that stomata regulate the water potential drop from soil to leaf (ΔΨ) based on the fractional drop in soil–plant hydraulic conductance from its maximum:
Δ Ψ = Δ Ψ [ ( d E / d Ψ leaf ) / ( d E / d Ψ max ) ]
where ΔΨ′ is the unregulated water potential drop derived from the supply function with unregulated transpiration rate: E′ = VPD × Gmax, where Gmax is the maximum diffusive conductance. This regulated ΔΨ yields the regulated values for E based on the supply function. G is calculated as E/VPD, and further coupled to the photosynthesis routine. The root and rhizosphere components are partitioned into five layers with equal roots based on the root distribution function. The five-layer root surface water potential and the root crown water potential at the downstream junction can be solved using the multidimensional Newton–Rhaphson method. Root water uptake rate at each layer is then calculated using Equation (1), and further coupled to the water sub-model modified by Huang, et al. [48] for simulating soil water movement based on the Richards equation.

2.3. Model Evaluation

We evaluated the performance of the BBGC-SPERRY model with data of annual actual evapotranspiration during the growing season (ETa) and daily stem sap flux density collected from previous studies. At an annual scale, ETa was determined based on the water balance method:
ETa = PR + ΔSWS
where ΔSWS is the change in soil water storage from the start to the end of the growing season (mm); and P and R are precipitation and runoff during the growing season, respectively. Data for daily stem sap flux density at the Yan’an site in 2008 were obtained from Wang [49]. Due to the lack of information on the stand sapwood area, sap flux density cannot be converted to stand-level transpiration. However, variations in sap flux density could largely represent the dynamic of transpiration, and the comparison between daily sap flux density with simulated daily transpiration could still reflect model performance [45].

2.4. Assessment of Drought-Induced Mortality Risk

To assess the spatial pattern of drought-induced mortality risk of Robinia pseudoacacia L. plantations, we simulated the long-term dynamics of plant hydraulic traits at 124 meteorological stations in the study area. Daily meteorological data including temperature (°C), relative humidity (%), and precipitation (mm) for 1961–2020 were obtained from the China Meteorological Administration (Figure 1). Solar radiation, daylight average partial pressure of water vapor, and day length were calculated using the Mountain Climate Simulator (MT-CLIM) program (https://www.umt.edu/numerical-terradynamic-simulation-group/project/mt-clim.php, accessed on 3 March 2024) [41]. Soil data at each site, including clay, silt, and sand content, as well as bulk density, were obtained from the SoilGrid250m dataset (https://www.soilgrids.org/, accessed on 3 March 2024). Soil water retention curves were estimated using the Arya-Paris model [50], and then fitted with the van Genuchten model using the RETC program [51]. Soil water content at field capacity was determined at a soil water potential of −0.033 MPa. Saturated soil hydraulic conductivity was estimated using a pedo-transfer function developed by a machine learning method for the study region [52].
The initial conditions were obtained with the “Spin-up” method at each site. Daily percentage loss of whole-plant hydraulic conductance (PLK, %) was calculated by:
PLK = ( 1 k plant k max ) × 100 %
where kmax is the maximum whole-plant hydraulic conductance in the absence of any cavitation (Table 1). Annual average PLK (APLK, %) was then determined to represent the inter-annual variation in plant hydraulic safety. According to previous studies, we set full hydraulic recovery at the start of the growing season due to the generation of root and/or stem pressure and the new growth of plant tissues in the spring [7,53,54]. During the growing season, we imposed the condition that xylem embolism could not be refilled in Robinia pseudoacacia L. as suggested by previous studies [55].
Previous field and simulation studies indicated trees would face a high mortality threat when the APLK was higher than 60%, with this value recommended as the plant hydraulic threshold for predicting drought-induced mortality of trees and widely used in previous studies [53,56,57]. We also adopted this threshold for assessing drought-induced mortality risk for Robinia pseudoacacia L. After the preliminarily tests, we chose beta function to fit the probability distribution of APLK at each site. The probability of an APLK ≥ 60% was then determined with the fitted probability distribution function and defined as drought-induced mortality risk probability (DMRP) for Robinia pseudoacacia L. plantations at each site (Figure 4).

2.5. Statistical Analyses

We calculated the minimum, maximum, and mean values of APLK during the simulation period to characterize the plant hydraulic safety of Robinia pseudoacacia L. at each site. Spatial distribution maps of the minimum, maximum, and mean APLK and DMRP were generated through Kriging interpolation using ArcGIS 10.6 (www.esri.com, accessed on 3 March 2024) to examine the spatial pattern of each indicator. The spatial relationships between these indicators with climatic, soil, and topographic factors were determined by Pearson correlation and stepwise regression analysis.
The predicative accuracy of the BBGC-SPERRY model was evaluated using the coefficient of determination (R2) between simulated and observed values, as well as statistical indicators including mean absolute error (MAE), root mean square error (RMSE), relative root mean square error (rRMSE), and Nash–Sutcliffe efficiency (NSE) [58]. R2 was determined by linear analysis, and other indicators were calculated as follows:
MAE = 1 n i = 1 n | O i P i |
RMSE = 1 n i = 1 n ( O i P i ) 2
rRMSE = 1 n i = 1 n ( O i P i ) 2 1 n i = 1 n O i × 100 %
NSE = 1 i = 1 n ( O i P i ) 2 i = 1 n ( O i O i ¯ ) 2
where Oi and Pi are the observed and simulated values for the ith observation, respectively; O ¯ i is the average of the observed data; and n is the number of observations. Lower values of MAE, RMSE, and rRMSE indicate higher predicative accuracy. The NSE represents ‘goodness of fit’, with values closer to 1.0 indicating a more accurate model.

3. Results

3.1. Model Evaluation and Uncertainty Analysis

The BBGC-SPERRY model could effectively simulate the spatiotemporal dynamics of transpiration and evapotranspiration for Robinia pseudoacacia L. stands on the Loess Plateau. We collected 57 ETa data points from 11 sites within the study area, and the observed years spanned from 1982 to 2020. The simulated ETa was consistent with observed ETa with an R2 value of 0.67 (p < 0.01). The BBGC-SPERRY model was also evaluated in terms of MAE, RMSE, rRMSE, and NSE with respective values of 51.8 mm, 59.6 mm, 12.8%, and 0.62, indicating it exhibited good performance for simulating spatiotemporal variations in ETa of Robinia pseudoacacia L. stands on the Loess Plateau (Figure 5). At the Yan’an site, a total of 85 data were collected spanning from Day 119 to Day 292 due to the power failure in the field. The data covered the entire growing season and could also be used for evaluating model performance. The simulated stand transpiration dynamics were in good agreement with variations in monitored daily sap flux density during the 2008 growing season (Figure S1), with an R2 value of 0.70 (p < 0.01). Stand evapotranspiration and transpiration are the primary processes driving water transport in the SPAC system, as well as representative indicators reflecting responses of vegetation to drought [59]. Therefore, the BBGC-SPERRY model is capable of simulating water transport processes through the SPAC system for Robinia pseudoacacia L. stands.
The sources of simulation uncertainty mainly include model structure, parameters, initial and boundary conditions, etc. [60,61]. Previous studies conducted detailed sensitivity analyses of the parameters in both the Biome-BGC model [62] and the Sperry model [34]. In this study, we selected Yan’an (MAP = 534.5 mm) as a representative site and chose a normal water year (annual precipitation of 510.7 mm in 1984) to estimate the sensitivity of APLK in the BBGC-SPERRY model to a total of 35 parameters, including meteorological, soil, and eco-physiological parameters of Biome-BGC model and Sperry model parameters (Table S1). Readers can refer to Li, et al. [63] and Li, et al. [64] for details on specific steps. The results indicate that APLK is highly sensitive to all meteorological parameters, soil hydraulic parameters except saturated hydraulic conductivity, Sperry model parameters except for average % resistance in rhizosphere, and 7 Biome-BGC model parameters such as specific leaf area, allocation to current growth proportion, etc. In this study, meteorological data were from continuous observations at each simulation site and subjected to standard quality control tests. Soil–water retention curves were estimated using the Arya–Paris model to determine soil hydraulic parameters, which was demonstrated to have high simulation accuracy [65] and was widely applied in eco-hydrological simulations [66,67]. Eco-physiological parameters of Biome-BGC model and Sperry model were determined based on published data in the study area or recommended values for the deciduous broadleaf forest. Previous field survey and controlled experiments indicated that the variability in plant eco-physiological parameters are relatively limited for mature Robinia pseudoacacia L. forests on the Loess Plateau and unlikely to substantially affect the simulation reliability [31,68]. All of these efforts should efficiently contribute to reliable simulations.

3.2. Spatial Pattern of Plant Hydraulic Safety

Plant hydraulic safety in Robinia pseudoacacia L. exhibited strong spatial variability in the study area, as reflected by the spatial variation in APLK (Figure 6). The mean APLK ranged from 0.3% to 29.3% with a coefficient of variation of 55.6% and showed an increasing trend from southeast to northwest. The maximum APLK exhibited a similar spatial pattern to the mean APLK, and ranged from 1.1% to 80.2% with a coefficient of variation of 36.7%. The minimum APLK ranged from 0.1% to 1.9% with a coefficient of variation of 35.6% and exhibited relatively lower values in the west and middle than in the south and north of the study area.
The correlation analysis indicated the spatial distribution of APLK was significantly influenced by climatic, soil, and topographic factors (Figure 7). The minimum, maximum, and mean APLK showed significant negative correlations with MAP, clay content, and silt content and significant positive correlations with sand content. Notably, MAT was negatively correlated with the minimum APLK but positively correlated with the maximum and mean APLK. Due to the negative correlation between MAT and elevation (r = −0.89, p < 0.001), elevation showed a negative correlation with minimum APLK but a positive correlation with maximum and mean APLK. Among the environmental factors, MAP exhibited the highest correlation coefficients with minimum, maximum, and mean APLK, making it an important factor influencing the spatial variability of plant hydraulic safety in Robinia pseudoacacia L.
Stepwise regression analysis further revealed the driving factors of the spatial pattern of APLK (Table 2). MAP and sand content were the main driving factors for mean APLK, explaining 77% of the spatial variation. In addition to MAP and sand content, the driving factors for minimum APLK also included elevation; 50% of the spatial variation in minimum APLK could be explained by these factors. The spatial variation in maximum APLK was driven by MAP, MAT, and clay content, with 66% of the spatial variability explained by these factors.

3.3. Spatial Pattern of Drought-Induced Mortality Risk

The probability distribution of APLK at each site could be well fitted using the beta function, with an average R2 value of 0.94 and average NSE value of 0.93. Based on the probability distribution curve of APLK at each site, the probability corresponding to APLK ≥ 60% could be calculated to determine the DMRP. From the southeast to northwest of the Loess Plateau, the DMRP increased from 0% to 9.2%, with an average value of 1.8% (Figure 8). The spatial distribution of DMRP was positively correlated with elevation and sand content and negatively correlated with MAP, MAT, clay content, and silt content (Figure 7). Stepwise regression analysis indicated the driving factors of DMRP included MAP, MAT, and sand content, which explained 68% of the spatial variability (Table 2).
Based on the intervals DMRP < 2%, 2% ≤ DMRP ≤ 5%, and DMRP > 5%, we classified low-, moderate-, and high-risk zones in the study area, with corresponding recurrence periods of drought-induced mortality for Robinia pseudoacacia L. of >50 years, 20–50 years, and <20 years, respectively. The low-risk zone covered 60.0% of the study area, primarily in the south. A gradual transition to moderate-risk zones then occurred moving towards the north and west and covering 30.7% of the study area. The high-risk zone covered 9.3% of the study area and was located in the northern and western corners.

4. Discussion

Based on the intrinsic specific depictions of physical processes and eco-physiological mechanisms, process-based models can comprehensively quantify the effects of environmental factors on vegetation growth and health at large spatiotemporal scales [69], providing a useful basis for evaluating and enhancing the sustainability of plantation forests [48,70,71]. The BBGC-SPERRY model enables the coupled simulation of plant hydraulic dynamics with water, carbon, and nitrogen cycling processes in an ecosystem, making it an effective tool for investigating climate–soil–vegetation interactions [33,35]. With data for field-observed daily sap flux density and ETa collected from 11 sites, we verified the reliability of the BBGC-SPERRY model in simulating eco-hydrological processes in Robinia pseudoacacia L. stands at the regional scale of the Loess Plateau (Figure S1 and Figure 5). The BBGC-SPERRY model simulates SPAC water transport based on plant hydraulics, which provides a more mechanistic approach and helps to enhance predictive accuracy compared to traditional scaffolds of empirical response functions [33,34,57]. In the original Biome-BGC model, the Penman–Monteith equation with simulated canopy conductance was coupled with a root water uptake model to describe the responses of plant water use to soil and atmospheric drought [72,73]. The impact of soil drought on canopy conductance and root water uptake was modeled using prescribed empirical stress functions, which lack information about the mechanisms and are difficult to parameterize [34,74]. Recent advances in plant hydraulics significantly deepened our understanding of plant–water relationships [75]. The Sperry model establishes direct hydraulic relationships between water transport in the SPAC with soil and atmospheric drought based on stomatal regulation of plant water supply–demand relationships [34,56]. The model enables the calculation of a series of unmeasurable plant hydraulic traits and the simulation of physiological processes, such as the repair of xylem embolism, hydraulic redistribution at the root–soil interface, etc., which contributes to an improved mechanistic understanding of plant responses to soil and atmospheric droughts [29].
In recent years, with the advancement of plant hydraulic theory, models for predicting drought-induced tree mortality based on hydraulic traits developed rapidly. Although the BBGC-SPERRY model employed in this study effectively describes key plant hydraulic processes and biogeochemical processes at the stand scale, it may still have potential limitations compared with other models. Firstly, plant hydraulic modules were integrated into a range of distributed hydrological models (e.g., ParFlow-TREES [57]) and land surface models (e.g., Noah-MP [12], CoLM [76]) in recent years. Compared with the BBGC-SPERRY model, these models incorporate a broader array of ecohydrological processes, enabling more detailed simulations from watershed to global scales. Secondly, researchers developed predictive methods based on a series of optimality theories related to plant adaptation to water availability [77,78]. These methods predict plant hydraulic, stomatal, and photosynthetic traits across various temporal and spatial scales, which might offer a better approach to account for the spatiotemporal variability of plant parameters. Additionally, vegetation management such as thinning, pruning, and slope engineering measures is also a crucial aspect for sustainable ecological restoration. Recent substantial improvements to the Biome-BGC model (such as the BBGCMuSo [72]) focused on describing a wider range of management practices, which urgently need to be integrated into the BBGC-SPERRY model to enhance analysis of the roles of different management measures in enhancing the sustainability of plantation forests. In future research, comprehensive analysis combining models with different structures and complexities will help better predict the spatiotemporal patterns of drought-induced tree mortality risk under changing climate. There are increasing studies revealing the intrinsic correlations between plant hydraulic traits and other physiological processes, such as biomass repartition [79], root distribution [80], defoliation and damage of living tissues [81], etc., supporting that plant hydraulics are at the heart of plant, crops, and ecosystem functions in the face of climate change [75]. Future research could integrate plant hydraulic traits with a broader range of physiological processes to enhance the simulation accuracy of plants’ response to drought stress.
On the basis of validating the reliability of the BBGC-SPERRY model, we simulated the temporal variation in APLK at each site over a 60-year period and analyzed the dynamics of plant hydraulic safety in Robinia pseudoacacia L. under long-term climatic fluctuations. According to the mechanism of hydraulic failure, prolonged high APLK can lead to a severe reduction in stomatal conductance, photosynthetic rates, and productivity, further affecting cell expansion, membrane permeability, and xylem transport and thereby increasing sensitivity to photothermal stress, diseases, and pests [7,75]. The use of APLK can reflect the long-term plant hydraulic safety status [53,56,57], serving as a crucial indicator for predicting drought-induced tree mortality. Based on the literature analysis by Sperry and Love [56] and Adams, et al. [82], a high threat of drought-induced mortality occurs when the APLK exceeds 60% for a wide variety of tree species. This study also adopted this value as the threshold for predicting the occurrence of drought-induced mortality in Robinia pseudoacacia L. Similar to the use of storm frequency for designing flood control facilities, we calculated the probability of APLK exceeding 60% based on the probability distribution curve of APLK to determine the DMRP of Robinia pseudoacacia L. at each site (Figure 4). The probabilistic analysis provides a holistic understanding of the plant hydraulic safety of Robinia pseudoacacia L., and offers a framework for economic decision making for forestation [83,84]. Additionally, the predicted spatial pattern of drought-induced mortality risk in Robinia pseudoacacia L. in this study is supported by previous field investigations. For example, the main distribution area of “small old trees” on the Loess Plateau identified in field surveys by Hou, et al. [85] is in close agreement with the moderate- and high-risk zones predicted in this study. According to field investigations conducted by Wang and Li [86] and Liu [31] at the Chunhua, Yichuan, Yijun, Fuxian, and Ansai sites, the growth of Robinia pseudoacacia L. gradually weakened with decreasing precipitation but did not lead to mortality; these sites are located in low-risk zones as defined in this study. However, extensive canopy dieback and mortality in Robinia pseudoacacia L. plantations were observed at the Wuqi site, which is located in the moderate-risk zone as defined in this study. At the Huanxian site, also located in the moderate-risk zone, large-scale drought-induced mortality events of Robinia pseudoacacia L. plantations occurred in recent years (personal communication). These field-based findings supported the reliable identification of risk zones in this study.
The spatial variations in plant hydraulic safety and drought-induced mortality risk in Robinia pseudoacacia L. on the Loess Plateau were strongly influenced by climatic, soil, and topographic factors (Figure 7; Table 2). Correlation analysis indicated MAP was one of the most important factors driving the spatial distribution of APLK and DMRP. The Loess Plateau is a typical water-limited region. The depth to groundwater generally ranges from 30 to 100 m, and precipitation is usually the sole water source for most vegetation [27,87]. The spatial distribution of MAP becomes one of the most crucial factors determining vegetation growth and distribution. MAT also exhibited significant correlations with APLK and DMRP, although the correlation coefficients were lower than those with MAP. Specifically, the minimum APLK showed a positive correlation with MAT, which was largely attributed to increases in atmospheric evaporative demand with rising temperature that generally led to higher APLK during wet years. Conversely, the spatial distribution of mean APLK, maximum APLK, and DMRP were predominantly governed by their negative correlations with MAP. Spatially, MAP was negatively correlated with MAT, and could result in the positive correlation of mean APLK, max APLK, and DMRP with MAT. Correlation and regression analyses suggested the spatial distribution of APLK and DMRP were also influenced by soil properties. As clay content decreases and texture tends coarser, soil water holding capacity diminishes and water potential and hydraulic conductivity drop more rapidly with decreasing soil moisture, which in turn makes plant hydraulic structures more susceptible to hydraulic failure and increases mortality risk under drought [39,88,89].
The spatial pattern of drought-induced mortality risk in Robinia pseudoacacia L. evaluated in this study can indicate practical implications for future vegetation construction and sustainable land management. In low-risk zones, forestation with Robinia pseudoacacia L. should be based on the local soil–water carrying capacity for vegetation and the balanced relationship between ecological and socio-economic water use to ensure the sustainability of ecological restoration [27,90,91]. In moderate-risk zones, Robinia pseudoacacia L. plantations should be planted with caution, and enhanced monitoring and management of tree health in existing Robinia pseudoacacia L. plantations is essential to prevent the occurrence of severe drought-induced tree mortality events. Recent field observations and model simulations suggested that the utilization of deep soil water by plants plays a crucial role in ensuring water transport safety and reducing the risk of drought-induced mortality [92,93,94], highlighting the importance of deep soil water management. Implementing slope engineering measures such as infiltration holes [95], fish scale pits [96], and rainwater collection and infiltration systems [97], etc., was reported to efficiently promote deep soil water recharge, thereby reducing the sensitivity of plant hydraulic safety to inter-annual precipitation fluctuations [98]. In high-risk zones, the establishment of Robinia pseudoacacia L. plantations should be avoided, and forestation with other tree species with lower water consumption and stronger drought resistance should be considered a priority for vegetation restoration. For existing Robinia pseudoacacia L. plantations, vegetation type conversion could be considered, and management measures such as pruning and thinning should be duly undertaken to reduce stand water consumption and mitigate the risk of plant hydraulic failure [61,99,100].
This study also faced some methodological limitations that need to be considered in future research. This study conducted long-term continuous simulations using historical meteorological data, which was regarded as an important method for forest management risk assessment [39,83]. However, the results also carry potential spatial and temporal uncertainties. Spatially, the simulation results from 124 meteorological stations were upscaled to the regional level using the Kriging interpolation method, which is computationally efficient but may have limitations in spatial resolution and accuracy. High-resolution simulations using gridded meteorological data are needed to address these limitations. Temporally, under future climate change scenarios, rising temperatures and altered precipitation patterns could increase the drought-induced mortality risk for Robinia pseudoacacia L. plantations on the Loess Plateau [35], which could potentially cause the expansion of the area of medium- and high-risk zones. Model simulations using future climate data under different scenarios will help address these uncertainties. Similar to other eco-hydrological models, the BBGC-SPERRY model obtained steady-state conditions through “Spin-up” as the initial conditions for simulation [42], and did not consider the effects of temporal factors such as developmental stages, stand age, and vegetation succession on drought-induced mortality risk. The BBGC-SPERRY model simulates stand-scale eco-physiological processes, and thus was not able to capture the effects of different densities on drought-induced mortality risk as well as density regulation through self-thinning within stands. According to previous studies, it is suggested that Robinia pseudoacacia L. stands on the Loess Plateau with an age older than 20 years approximately to the “steady-state” condition required by the model [26,101]. The stands used for model evaluation in this study also fall within this stage, and the stand densities ranged from 1000 to 2300 trees ha−1. Therefore, it can be cautiously inferred that, the risk assessment results of this study apply to Robinia pseudoacacia L. stands with ages older than 20 years and densities within 1000–2300 trees ha−1. Currently, most Robinia pseudoacacia L. stands on the Loess Plateau fit this description [102], ensuring the practical applicability of the study’s findings. It can be qualitatively inferred that stands with younger ages or lower densities are likely to have lower drought-induced mortality risk due to better water conditions and vice versa. Future efforts should incorporate population dynamics simulations into the model to enable a more comprehensive assessment of drought-induced mortality risk for stands with varying ages and densities. In addition, root depth coefficient is an important parameter relating to root distribution in the soil profile, and we set it as a universal value (0.99) in this study. Based on our previous field investigations, the root depth coefficient of mature Robinia pseudoacacia L. stands ranged between 0.987 and 0.990 along the precipitation gradient of the Loess Plateau, with no significant differences between sampling sites (p > 0.05) [47]. We selected a value of 0.99 in this study, with a maximum root distribution depth of 5.3 m, to simulate an adequate soil depth profile. According to our sensitivity analysis, when root depth coefficient changed from 0.983 to 0.992 [47], APLK varied from 10.8% to 10.4%, indicating a relatively limited impact. Therefore, this should not substantially affect the reliability of the results. We recommend developing more accurate dynamic root distribution algorithms to reduce uncertainty in further studies.

5. Conclusions

This study utilized the BBGC-SPERRY model to simulate the long-term dynamics of APLK in Robinia pseudoacacia L. and quantitatively assess the spatial pattern of drought-induced mortality risk on the Loess Plateau based on plant hydraulic safety. The BBGC-SPERRY model could accurately simulate the spatiotemporal variation in transpiration and evapotranspiration in Robinia pseudoacacia L. stands on the Loess Plateau. Spatial patterns of plant hydraulic safety and drought-induced mortality risk in Robinia pseudoacacia L. were mainly driven by the precipitation gradient from southeast to northwest, with other climatic, soil, and topographic factors also playing important roles. This study conducted a preliminary assessment of drought-induced mortality risk for Robinia pseudoacacia L. on the Loess Plateau based on the probability distribution of APLK at each site, with low-, moderate-, and high-risk zones accounting for 60.0%, 30.7%, and 9.3% of the study area, respectively. These findings could serve as a basis for the rational forestation and sustainable management of Robinia pseudoacacia L. plantations on the Loess Plateau, and the risk assessment methods of this study can also provide reference for other regions with similar climatic conditions. We recommend that vegetation restoration planning should incorporate the use of multiple models with different structures and complexities to assess drought-induced mortality risks for various species under both historical and future climate conditions. This comprehensive evaluation will contribute to selecting appropriate species that are adaptable to local climate, soil, and topographical conditions for ensuring the sustainability of vegetation restoration efforts. Future efforts should focus on further improvements of the model structure to consider more spatial and temporal factors, thereby facilitating a more accurate assessment of drought-induced mortality risk for plantation forests.

Supplementary Materials

The following supporting information can be downloaded at: https://www.mdpi.com/article/10.3390/f15081477/s1, Figure S1: Comparison between observed daily sap flux density (Jday) and simulated daily transpiration (Tday) in Robinia pseudoacacia L. stand at the Yan’an site.; Table S1: Sensitivity of annual average percentage loss of whole-plant hydraulic conductance to soil, meteorological, and eco-physiological parameters of Biome-BGC model and Sperry model for Robinia pseudoacacia L.

Author Contributions

Conceptualization, Z.-D.Z. and J.-Q.N.; methodology, Z.-D.Z. and T.-H.L.; software, Z.-D.Z., M.-B.H. and X.-Y.Y.; writing—original draft preparation, Z.-D.Z. and T.-H.L.; writing—review and editing, M.-H.L., J.-H.Y., F.-Y.C. and W.Y.; visualization, T.-H.L. and W.Y.; supervision, J.-Q.N.; funding acquisition, Z.-D.Z., J.-H.Y., F.-Y.C., W.Y. and J.-Q.N. All authors have read and agreed to the published version of the manuscript.

Funding

This research was financially supported by the National Natural Science Foundation of China (No. 42107335), the Xinyang Academy of Ecological Research Open Foundation (No. 2023XYQN12), the Program for Innovative Research Team (in Science and Technology) in University of Henan Province (No. 22IRTSTHN010), the Natural Science Foundation of Henan (No. 232300421250, 222300420522), the Training Plan of Young Backbone Teachers in Henan Colleges and Universities (No. 2020GGJS158), the Postgraduate Education Reform and Quality Improvement Project of Henan Province (No. HNYJS2020JD14), and the Nanhu Scholars Program for Young Scholars of XYNU.

Data Availability Statement

Data will be made available on request.

Acknowledgments

We would like to express our deepest gratitude to all the members who participated in this research. We extend our sincere thanks to National Ecosystem Science Data Center, National Science & Technology Infrastructure of China for providing the soil hydraulic dataset.

Conflicts of Interest

The authors declare no conflicts of interest.

References

  1. Heinrich, V.H.A.; Vancutsem, C.; Dalagnol, R.; Rosan, T.M.; Fawcett, D.; Silva-Junior, C.H.L.; Cassol, H.L.G.; Achard, F.; Jucker, T.; Silva, C.A.; et al. The carbon sink of secondary and degraded humid tropical forests. Nature 2023, 615, 436–442. [Google Scholar] [CrossRef]
  2. Piao, S.L.; Wang, X.H.; Park, T.; Chen, C.; Lian, X.; He, Y.; Bjerke, J.W.; Chen, A.; Ciais, P.; Mmervik, H.T.; et al. Characteristics, drivers and feedbacks of global greening. Nat. Rev. Earth Environ. 2020, 1, 14–27. [Google Scholar] [CrossRef]
  3. Peng, J.; Hu, T.; Qiu, S.J.; Hu, Y.N.; Dong, J.Q.; Lin, Y.F. Balancing the effects of forest conservation and restoration on south China Karst greening. Earth’s Future 2023, 11, e2023EF003487. [Google Scholar] [CrossRef]
  4. Anderegg, W.R.L.; Konings, A.G.; Trugman, A.T.; Yu, K.; Bowling, D.R.; Gabbitas, R.; Karp, D.S.; Pacala, S.; Sperry, J.S.; Sulman, B.N.; et al. Hydraulic diversity of forests regulates ecosystem resilience during drought. Nature 2018, 561, 538–541. [Google Scholar] [CrossRef] [PubMed]
  5. Tavares, J.V.; Oliveira, R.S.; Mencuccini, M.; Signori-Müller, C.; Pereira, L.; Diniz, F.C.; Gilpin, M.; Zevallos, M.M.J.; Yupayccana, C.S.; Acosta, M.; et al. Basin-wide variation in tree hydraulic safety margins predicts the carbon balance of Amazon forests. Nature 2023, 617, 111–117. [Google Scholar] [CrossRef]
  6. Bauman, D.; Fortunel, C.; Delhaye, G.; Malhi, Y.; Cernusak, L.A.; Bentley, L.P.; Rifai, S.W.; Aguirre-Gutiérrez, J.; Menor, I.O.; Phillips, O.L.; et al. Tropical tree mortality has increased with rising atmospheric water stress. Nature 2022, 608, 528–533. [Google Scholar] [CrossRef] [PubMed]
  7. Choat, B.; Brodribb, T.J.; Brodersen, C.R.; Duursma, R.A.; Lopez, R.; Medlyn, B.E. Triggers of tree mortality under drought. Nature 2018, 558, 531–539. [Google Scholar] [CrossRef]
  8. Gao, Y.Q.; Chen, Z.T.; Chen, J.X.; Yang, L.; Li, J.Y.; He, Q.; Qiu, Q.; Su, Y. A bibliometric analysis of the mechanisms underlying drought-induced tree mortality. Forests 2024, 15, 1037. [Google Scholar] [CrossRef]
  9. Zhao, A.Z.; Liu, X.F.; Zhu, X.F.; Pan, Y.Z.; Li, Y.Z. Spatiotemporal patterns of droughts based on SWAT model for the Weihe River Basin. Prog. Geogr. 2015, 34, 1156–1166. [Google Scholar]
  10. Wang, L.N.; Zhu, Q.K.; Yan, D.H.; Meng, L.I. The assessment on drought risk of Pinus tabuliformis plantations in the Loess Plateau. South-North Water Transf. Water Sci. Technol. 2017, 15, 179–195. [Google Scholar]
  11. Tai, X.N.; Mackay, D.S.; Anderegg, W.R.L.; Sperry, J.S.; Brooks, P.D. Plant hydraulics improves and topography mediates prediction of aspen mortality in southwestern USA. New Phytol. 2017, 213, 113–127. [Google Scholar] [CrossRef]
  12. Li, L.C.; Yang, Z.L.; Matheny, A.M.; Zheng, H.; Swenson, S.C.; Lawrence, D.M.; Barlage, M.; Yan, B.Y.; McDowell, N.G.; Leung, L.R. Representation of plant hydraulics in the Noah-MP land surface model: Model development and multiscale evaluation. J. Adv. Model. Earth Syst. 2021, 13, e2020MS002214. [Google Scholar] [CrossRef]
  13. Kennedy, D.; Swenson, S.; Oleson, K.W.; Lawrence, D.M.; Fisher, R.; da Costa, A.C.L.; Gentine, P. Implementing plant hydraulics in the community land model, version 5. J. Adv. Model. Earth Syst. 2019, 11, 485–513. [Google Scholar] [CrossRef]
  14. McDowell, N.; Allen, C.D.; Anderson-Teixeira, K.; Brando, P.; Brienen, R.; Chambers, J.; Christoffersen, B.; Davies, S.; Doughty, C.; Duque, A.; et al. Drivers and mechanisms of tree mortality in moist tropical forests. New Phytol. 2018, 219, 851–869. [Google Scholar] [CrossRef]
  15. Trugman, A.T. Integrating plant physiology and community ecology across scales through trait-based models to predict drought mortality. New Phytol. 2022, 234, 21–27. [Google Scholar] [CrossRef] [PubMed]
  16. Simeone, C.; Maneta, M.P.; Holden, Z.A.; Sapes, G.; Sala, A.; Dobrowski, S.Z. Coupled ecohydrology and plant hydraulics modeling predicts ponderosa pine seedling mortality and lower treeline in the US Northern Rocky Mountains. New Phytol. 2019, 221, 1814–1830. [Google Scholar] [CrossRef]
  17. O’Grady, A.P.; Mitchell, P.J.M.; Pinkard, E.A.; Tissue, D.T. Thirsty roots and hungry leaves: Unravelling the roles of carbon and water dynamics in tree mortality. New Phytol. 2013, 200, 294–297. [Google Scholar] [CrossRef]
  18. Doughty, C.E.; Metcalfe, D.B.; Girardin, C.A.J.; Amézquita, F.F.; Cabrera, D.G.; Huasco, W.H.; Silva-Espejo, J.E.; Araujo-Murakami, A.; da Costa, M.C.; Rocha, W.; et al. Drought impact on forest carbon dynamics and fluxes in Amazonia. Nature 2015, 519, 78–82. [Google Scholar] [CrossRef]
  19. Anderegg, W.R.L.; Hicke, J.A.; Fisher, R.A.; Allen, C.D.; Aukema, J.; Bentz, B.; Hood, S.; Lichstein, J.W.; Macalady, A.K.; McDowell, N.; et al. Tree mortality from drought, insects, and their interactions in a changing climate. New Phytol. 2015, 208, 674–683. [Google Scholar] [CrossRef]
  20. Delzon, S.; Cochard, H. Recent advances in tree hydraulics highlight the ecological significance of the hydraulic safety margin. New Phytol. 2014, 203, 355–358. [Google Scholar] [CrossRef]
  21. Brodribb, T.; Brodersen, C.R.; Carriqui, M.; Tonet, V.; Dominguez, C.R.; McAdam, S. Linking xylem network failure with leaf tissue death. New Phytol. 2021, 232, 68–79. [Google Scholar] [CrossRef]
  22. Yan, X.Y.; Zhang, Z.D.; Zhao, X.F.; Huang, M.B.; Wu, X.F.; Guo, T.Q. Differentiated responses of plant water use regulation to drought in Robinia pseudoacacia plantations on the Chinese Loess Plateau. Agric. Water Manag. 2024, 291, 108659108659. [Google Scholar] [CrossRef]
  23. Hu, Y.W.; Zhao, J.C.; Li, Y.; Tang, P.; Yang, Z.; Zhang, J.J.; Sun, R.X. Biomass and carbon stock capacity of Robinia pseudoacacia plantations at different densities on the Loess Plateau. Forests 2024, 15, 1242. [Google Scholar] [CrossRef]
  24. Ma, C.K.; Luo, Y.; Shao, M.A. Comparative modeling of the effect of thinning on canopy interception loss in a semiarid black locust (Robinia pseudoacacia) plantation in Northwest China. J. Hydrol. 2020, 590, 125234. [Google Scholar] [CrossRef]
  25. Xu, M.X.; Liu, G.B. The characteristics and evolution of soil nutrient in artifcial black locust (Robinia pseudoacacia) forest-land in the hilly Loess Plateau. Plant Nutr. Fertil. Sci. 2004, 10, 40–46. [Google Scholar]
  26. Jia, X.X.; Shao, M.A.; Zhu, Y.J.; Luo, Y. Soil moisture decline due to afforestation across the Loess Plateau, China. J. Hydrol. 2017, 546, 113–122. [Google Scholar] [CrossRef]
  27. Shao, M.A.; Wang, Y.Q.; Xia, Y.Q.; Jia, X.X. Soil drought and water carrying capacity for vegetation in the critical zone of the Loess Plateau: A review. Vadose Zone J. 2018, 17, 170077. [Google Scholar] [CrossRef]
  28. Xiang, W.; Si, B.C.; Li, H.J.; Li, M.; Song, J.X.; Tian, Y.L. Impacts of Deep-Rooted Apple Tree on Soil Water Balance in the Semi-Arid Loess Plateau, China. Forests 2024, 15, 930. [Google Scholar] [CrossRef]
  29. Zhang, Z.D.; Huang, M.B. Effect of root-zone vertical soil moisture heterogeneity on water transport safety in soil-plant-atmosphere continuum in Robinia pseudoacacia. Agric. Water Manag. 2021, 246, 106702. [Google Scholar] [CrossRef]
  30. Wei, J.S.; Li, Z.S.; Feng, X.Y.; Zhang, Y.; Chen, W.L.; Xing, W.U.; Jiao, L.; Wang, X.C. Ecological and physiological mechanisms of growth decline of Robinia pseudoacacia plantations in the Loess Plateau of China: A review. Chin. J. Appl. Ecol. 2018, 29, 2433–2444. [Google Scholar]
  31. Liu, J.H. Study on Growth Traits of Robinia pseudoacacia Plantation and Its Naturalization Process on Loess Plateau. Ph.D. Thesis, Graduate University of Chinese Academy of Sciences, Beijing, China, 2008. [Google Scholar]
  32. Jia, H.S.; Guan, C.F.; Zhang, J.S.; He, C.X.; Yin, C.J.; Meng, P. Drought effects on tree growth, water use efficiency, vulnerability and canopy health of Quercus variabilis-Robinia pseudoacacia mixed plantation. Front. Plant Sci. 2022, 13, 1018405. [Google Scholar] [CrossRef]
  33. Zhang, Z.D.; Huang, M.B.; Yang, Y.N.; Zhao, X.F. Evaluating drought-induced mortality risk for Robinia pseudoacacia plantations along the precipitation gradient on the Chinese Loess Plateau. Agric. For. Meteorol. 2020, 284, 107897. [Google Scholar] [CrossRef]
  34. Sperry, J.S.; Wang, Y.J.; Wolfe, B.T.; Mackay, D.S.; Anderegg, W.R.L.; McDowell, N.G.; Pockman, W.T. Pragmatic hydraulic theory predicts stomatal responses to climatic water deficits. New Phytol. 2016, 212, 577–589. [Google Scholar] [CrossRef]
  35. Yan, X.Y.; Zhang, Z.D.; Huang, M.B.; Zhao, X.F.; Yang, F.; Wu, X.F. The impact of climate change on growth and drought-induced mortality risk of Robinia pseudoacacia plantations along a precipitation gradient on the Chinese Loess Plateau. Agric. For. Meteorol. 2022, 325, 109160. [Google Scholar] [CrossRef]
  36. Yang, W.Z.; Ma, Y.X.; Han, S.F.; Yang, X.M. Water ecological regionalization of afforestation in Loess Plateau. J. Soil. Water Conserv. 1994, 8, 1–9. [Google Scholar]
  37. Wang, Y.Q.; Hu, W.; Sun, H.; Zhao, Y.; Zhang, P.P.; Li, Z.M.; Zhou, Z.X.; Tong, Y.P.; Liu, S.Z.; Zhou, J.X.; et al. Soil moisture decline in China’s monsoon loess critical zone: More a result of land-use conversion than climate change. Proc. Natl. Acad. Sci. USA 2024, 121, e2322127121. [Google Scholar] [CrossRef]
  38. Zhu, Y.J.; Jia, X.X.; Shao, M.A. Loess thickness variations across the Loess Plateau of China. Surv. Geophys. 2018, 39, 715–727. [Google Scholar] [CrossRef]
  39. Jia, X.X.; Shao, M.A.; Yu, D.X.; Zhang, Y.; Binley, A. Spatial variations in soil-water carrying capacity of three typical revegetation species on the Loess Plateau, China. Agric. Ecosyst. Environ. 2019, 273, 25–35. [Google Scholar] [CrossRef]
  40. White, M.A.; Thornton, P.E.; Running, S.W.; Nemani, R.R. Parameterization and sensitivity analysis of the Biome–BGC terrestrial ecosystem model: Net primary production controls. Earth Interact. 2000, 4, 1–85. [Google Scholar] [CrossRef]
  41. Thornton, P.E.; Law, B.E.; Gholz, H.L.; Clark, K.L.; Falge, E.; Ellsworth, D.S.; Goldstein, A.H.; Monson, R.K.; Hollinger, D.; Falk, M.; et al. Modeling and measuring the effects of disturbance history and climate on carbon and water budgets in evergreen needleleaf forests. Agric. For. Meteorol. 2002, 113, 185–222. [Google Scholar] [CrossRef]
  42. Thornton, P.E.; Rosenbloom, N.A. Ecosystem model spin-up: Estimating steady state conditions in a coupled terrestrial carbon and nitrogen cycle model. Ecol. Model. 2005, 189, 25–48. [Google Scholar] [CrossRef]
  43. Farquhar, G.D.; von Caemmerer, S.; Berry, J.A. A biochemical model of photosynthetic CO2 assimilation in leaves of C3 species. Planta 1980, 149, 78–90. [Google Scholar] [CrossRef]
  44. Monteith, J.L. Evaporation and environment. Symp. Soc. Exp. Biol. 1965, 19, 205–234. [Google Scholar]
  45. Ma, R.T.; An, S.S.; Huang, Y.M. C, N and P stoichiometry characteristics of different-aged Robinia pseudoacacia plantations on the Loess Plateau, China. Chin. J. Appl. Ecol. 2017, 28, 2787–2793. [Google Scholar] [CrossRef]
  46. Aber, J.D.; Melillo, J.M. Nitrogen immobilization in decaying hardwood leaf litter as a function of initial nitrogen and lignin content. Can. J. Bot. 1982, 60, 2263–2269. [Google Scholar] [CrossRef]
  47. Zhang, Z.D.; Huang, M.B.; Zhang, Y.K. Vertical distribution of fine-root area in relation to stand age and environmental factors in black locust (Robinia pseudoacacia) forests of the Chinese Loess Plateau. Can. J. For. Res. 2018, 48, 1148–1158. [Google Scholar] [CrossRef]
  48. Huang, M.B.; Zettl, J.D.; Barbour, S.L.; Elshorbagy, A.; Si, B.C. The impact of soil moisture availability on forest growth indices for variably layered coarse-textured soils. Ecohydrology 2013, 6, 214–227. [Google Scholar] [CrossRef]
  49. Wang, Y.L. Characteristics of Photosynthesis and Water Use of Dominant Tree Species in Two Typical Forests and Related Factors in the Semiarid Region of Loess Plateau, China. Ph.D. Thesis, Graduate University of Chinese Academy of Sciences, Beijing, China, 2010. [Google Scholar]
  50. Arya, L.M.; Leij, F.J.; van Genuchten, M.T.; Shouse, P.J. Scaling parameter to predict the soil water characteristic from particle-size distribution data. Soil Sci. Soc. Am. J. 1999, 63, 510–519. [Google Scholar] [CrossRef]
  51. van Genuchten, M.T. A closed-form equation for predicting the hydraulic conductivity of unsaturated soils. Soil Sci. Soc. Am. J. 1980, 44, 892–898. [Google Scholar] [CrossRef]
  52. Niu, L.T.; Jia, X.X.; Li, X.D.; Zhao, C.L.; Ren, L.D.; Hu, W.; Zhu, P.; Li, D.F.; Zhang, B.Q.; Shao, M.A. Developing novel ensemble models for predicting soil hydraulic properties in China’s arid region. J. Hydrol. 2024, 636, 131354. [Google Scholar] [CrossRef]
  53. McDowell, N.G.; Fisher, R.A.; Xu, C.G.; Domec, J.C.; Hölttä, T.; Mackay, D.S.; Sperry, J.S.; Boutz, A.; Dickman, L.; Gehres, N.; et al. Evaluating theories of drought-induced vegetation mortality using a multimodel–experiment framework. New Phytol. 2013, 200, 304–321. [Google Scholar] [CrossRef]
  54. Sperry, J.S.; Donnelly, J.R.; Tyree, M.T. A method for measuring hydraulic conductivity and embolism in xylem. Plant Cell Environ. 1988, 11, 35–40. [Google Scholar] [CrossRef]
  55. Wang, R.Q.; Zhang, L.L.; Zhang, S.X.; Cai, J.; Tyree, M.T. Water relations of Robinia pseudoacacia L.: Do vessels cavitate and refill diurnally or are R-shaped curves invalid in Robinia? Plant Cell Environ. 2014, 37, 2667–2678. [Google Scholar] [CrossRef]
  56. Sperry, J.S.; Love, D.M. What plant hydraulics can tell us about responses to climate-change droughts. New Phytol. 2015, 207, 14–27. [Google Scholar] [CrossRef]
  57. Tai, X.N.; Mackay, D.S.; Sperry, J.S.; Brooks, P.; Anderegg, W.R.L.; Flanagan, L.B.; Rood, S.B.; Hopkinson, C. Distributed plant hydraulic and hydrological modeling to understand the susceptibility of riparian woodland trees to drought-induced mortality. Water Resour. Res. 2018, 54, 4901–4915. [Google Scholar] [CrossRef]
  58. Nash, J.E.; Sutcliffe, J.V. River flow forecasting through conceptual models part I—A discussion of principles. J. Hydrol. 1970, 10, 282–290. [Google Scholar] [CrossRef]
  59. Poyatos, R.; Granda, V.; Molowny-Horas, R.; Mencuccini, M.; Steppe, K.; Martínez-Vilalta, J. SAPFLUXNET: Towards a global database of sap flow measurements. Tree Physiol. 2016, 36, 1449–1455. [Google Scholar] [CrossRef]
  60. Beven, K. On doing better hydrological science. Hydrol. Process. 2008, 22, 3549–3553. [Google Scholar] [CrossRef]
  61. Bai, X.; Jia, X.X.; Jia, Y.H.; Shao, M.A.; Hu, W. Modeling long-term soil water dynamics in response to land-use change in a semi-arid area. J. Hydrol. 2020, 585, 124824. [Google Scholar] [CrossRef]
  62. Zhang, Z.D.; Jia, X.X.; Zhu, P.; Huang, M.B.; Ren, L.D.; Shao, M.A. Estimating the optimal vegetation coverage for the dominant tree and shrub species over China’s northwest drylands. Sci. China Earth Sci. 2024, 67, 1500–1517. [Google Scholar] [CrossRef]
  63. Li, Y.; Shao, M.A.; Wang, W.Y.; Wang, Q.J. Sensitive analyses of parameters in unsaturated soil hydraulic conductivity model. Adv. Water Sci. 2003, 14, 593–597. [Google Scholar]
  64. Li, J.K.; Zhao, R.S.; Li, Y.J.; Chen, L. Modeling the effects of parameter optimization on three bioretention tanks using the HYDRUS-1D model. J. Environ. Manag. 2018, 217, 38–46. [Google Scholar] [CrossRef] [PubMed]
  65. Huang, M.B.; Fredlund, D.G.; Fredlund, M.D. Comparison of Measured and PTF Predictions of SWCCs for Loess Soils in China. Geotech. Geol. Eng. 2010, 28, 105–117. [Google Scholar] [CrossRef]
  66. da Silva, A.C.; Armindo, R.A.; dos Santos Brito, A.; Schaap, M.G. SPLINTEX: A physically-based pedotransfer function for modeling soil hydraulic functions. Soil Tillage Res. 2017, 174, 261–272. [Google Scholar] [CrossRef]
  67. Zhang, Y.; Huang, M.B.; Lian, J.J. Spatial distributions of optimal plant coverage for the dominant tree and shrub species along a precipitation gradient on the central Loess Plateau. Agric. For. Meteorol. 2015, 206, 69–84. [Google Scholar] [CrossRef]
  68. Zhang, Z.D.; Huang, M.B.; Zhao, X.F.; Wu, L.H. Adjustments of leaf traits and whole plant leaf area for balancing water supply and demand in Robinia pseudoacacia under different precipitation conditions on the Loess Plateau. Agric. For. Meteorol. 2019, 279, 107733. [Google Scholar] [CrossRef]
  69. Zhu, Z.C.; Piao, S.L.; Myneni, R.B.; Huang, M.T.; Zeng, Z.Z.; Canadell, J.G.; Ciais, P.; Sitch, S.; Friedlingstein, P.; Arneth, A.; et al. Greening of the Earth and its drivers. Nat. Clim. Chang. 2016, 6, 791–795. [Google Scholar] [CrossRef]
  70. Zhang, Y.; Li, W.; Li, S.D.; Xie, B.N.; Shi, F.Z.; Zhao, J.X. Spatial distribution of optimal plant cover and its influencing factors for Populus simonii carr. on the Bashang Plateau, China. Land 2022, 11, 890. [Google Scholar] [CrossRef]
  71. Feki, M.; Ravazzani, G.; Pellicone, G.; Caloiero, T. Impact of forest management on wood production under climate change in the Bonis catchment. Forests 2024, 15, 539. [Google Scholar] [CrossRef]
  72. Hidy, D.; Barcza, Z.; Hollós, R.; Dobor, L.; Acs, T.; Zacháry, D.; Filep, T.; Pásztor, L.; Incze, D.; Dencso, M.; et al. Soil-related developments of the Biome-BGCMuSo v6.2 terrestrial ecosystem model. Geosci. Model. Dev. 2022, 15, 2157–2181. [Google Scholar] [CrossRef]
  73. Bond-Lamberty, B.E.N.; Peckham, S.D.; Gower, S.T.; Ewers, B.E. Effects of fire on regional evapotranspiration in the central Canadian boreal forest. Glob. Chang. Biol. 2009, 15, 1242–1254. [Google Scholar] [CrossRef]
  74. Gharsallah, O.; Facchi, A.; Gandolfi, C. Comparison of six evapotranspiration models for a surface irrigated maize agro-ecosystem in Northern Italy. Agric. Water Manag. 2013, 130, 119–130. [Google Scholar] [CrossRef]
  75. Torres-Ruiz, J.M.; Cochard, H.; Delzon, S.; Boivin, T.; Burlett, R.; Cailleret, M.; Corso, D.; Delmas, C.E.L.; De Caceres, M.; Diaz-Espejo, A.; et al. Plant hydraulics at the heart of plant, crops and ecosystem functions in the face of climate change. New Phytol. 2024, 241, 984–999. [Google Scholar] [CrossRef] [PubMed]
  76. Li, H.M.; Lu, X.J.; Wei, Z.W.; Zhu, S.G.; Wei, N.; Zhang, S.P.; Yuan, H.; Shang Guan, W.; Liu, S.F.; Zhang, S.L.; et al. New Representation of Plant Hydraulics Improves the Estimates of Transpiration in Land Surface Model. Forests 2021, 12, 722. [Google Scholar] [CrossRef]
  77. Joshi, J.; Stocker, B.D.; Hofhansl, F.; Zhou, S.; Dieckmann, U.; Prentice, I.C. Towards a unified theory of plant photosynthesis and hydraulics. Nat. Plants 2022, 8, 1304–1316. [Google Scholar] [CrossRef] [PubMed]
  78. Sperry, J.S.; Venturas, M.D.; Todd, H.N.; Trugman, A.T.; Anderegg, W.R.L.; Wang, Y.; Tai, X. The impact of rising CO2 and acclimation on the response of US forests to global warming. Proc. Natl. Acad. Sci. USA 2019, 116, 25734–25744. [Google Scholar] [CrossRef]
  79. Potkay, A.; Trugman, A.T.; Wang, Y.; Venturas, M.D.; Anderegg, W.R.L.; Mattos, C.R.C.; Fan, Y. Coupled whole-tree optimality and xylem hydraulics explain dynamic biomass partitioning. New Phytol. 2021, 230, 2226–2245. [Google Scholar] [CrossRef]
  80. Mackay, D.S.; Savoy, P.R.; Grossiord, C.; Tai, X.; Pleban, J.R.; Wang, D.R.; McDowell, N.G.; Adams, H.D.; Sperry, J.S. Conifers depend on established roots during drought: Results from a coupled model of carbon allocation and hydraulics. New Phytol. 2020, 225, 679–692. [Google Scholar] [CrossRef] [PubMed]
  81. Klein, T.; Torres-Ruiz, J.M.; Albers, J.J. Conifer desiccation in the 2021 NW heatwave confirms the role of hydraulic damage. Tree Physiol. 2022, 42, 722–726. [Google Scholar] [CrossRef]
  82. Adams, H.D.; Zeppel, M.J.B.; Anderegg, W.R.L.; Hartmann, H.; Landhausser, S.M.; Tissue, D.T.; Huxman, T.E.; Hudson, P.J.; Franz, T.E.; Allen, C.D.; et al. A multi-species synthesis of physiological mechanisms in drought-induced tree mortality. Nat. Ecol. Evol. 2017, 1, 1285–1291. [Google Scholar] [CrossRef]
  83. Elshorbagy, A.; Barbour, S.L. Probabilistic approach for design and hydrologic performance assessment of reconstructed watersheds. J. Geotech. Geoenviron. Eng. 2007, 133, 1110–1118. [Google Scholar] [CrossRef]
  84. Alam, M.S.; Barbour, S.L.; Elshorbagy, A.; Huang, M.B. The impact of climate change on the water balance of oil sands reclamation covers and natural soil profiles. J. Hydrometeorol. 2018, 19, 1731–1752. [Google Scholar] [CrossRef]
  85. Hou, Q.C.; Huang, X.; Han, S.F. Study on the forming of “small olded-tree” and the transforming way in the Loess Plateau. J. Soil Water Conserv. 1991, 5, 64–72. [Google Scholar]
  86. Wang, L.; Li, Y.Y. Study on relationship between growth of artificial Robinia pseudoacacia plantation and soil desiccation in the Loess Plateau of northern Shannxi Province. Sci. Silvae Sin. 2004, 40, 84–91. [Google Scholar]
  87. Chen, H.S.; Shao, M.G.; Li, Y.Y. Soil desiccation in the Loess Plateau of China. Geoderma 2008, 143, 91–100. [Google Scholar] [CrossRef]
  88. Sperry, J.S.; Adler, F.R.; Campbell, G.S.; Comstock, J.P. Limitation of plant water use by rhizosphere and xylem conductance: Results from a model. Plant Cell Environ. 1998, 21, 347–359. [Google Scholar] [CrossRef]
  89. Wu, Y.Z.; Huang, M.B.; Warrington, D.N. Black locust transpiration responses to soil water availability as affected by meteorological factors and soil texture. Pedosphere 2015, 25, 57–71. [Google Scholar] [CrossRef]
  90. Feng, X.M.; Fu, B.J.; Piao, S.L.; Wang, S.; Ciais, P.; Zeng, Z.Z.; Lü, Y.H.; Zeng, Y.; Li, Y.; Jiang, X.H.; et al. Revegetation in China’s Loess Plateau is approaching sustainable water resource limits. Nat. Clim. Chang. 2016, 6, 1019–1022. [Google Scholar] [CrossRef]
  91. Zhang, Y.X.; Zhao, T.N.; Shi, C.Q.; Ma, Q. Simulation of vegetation cover based on the theory of ecohydrological optimality in the Yongding River watershed, china. Forests 2021, 12, 1377. [Google Scholar] [CrossRef]
  92. Wang, S.F.; Yang, M.; Gao, X.D.; Li, B.; Cai, Y.H.; Li, C.J.; He, H.L.; Zhao, X.N. Ecohydrological response to deep soil desiccation in a semiarid apple orchard. Agric. For. Meteorol. 2024, 354, 110089. [Google Scholar] [CrossRef]
  93. Love, D.M.; Venturas, M.D.; Sperry, J.S.; Brooks, P.D.; Pettit, J.L.; Wang, Y.; Anderegg, W.R.L.; Tai, X.; Mackay, D.S. Dependence of aspen stands on a subsurface water subsidy: Implications for climate change impacts. Water Resour. Res. 2019, 55, 1833–1848. [Google Scholar] [CrossRef]
  94. Walthert, L.; Ganthaler, A.; Mayr, S.; Saurer, M.; Waldner, P.; Walser, M.; Zweifel, R.; von Arx, G. From the comfort zone to crown dieback: Sequence of physiological stress thresholds in mature European beech trees across progressive drought. Sci. Total Environ. 2021, 753, 141792. [Google Scholar] [CrossRef]
  95. Zhang, X.Y.; Wang, K.; Duan, C.H.; Li, G.L.; Zhen, Q.; Zheng, J.Y. Evaporation effect of infiltration hole and its comparison with mulching. Agric. Water Manag. 2023, 275, 108049. [Google Scholar] [CrossRef]
  96. Wang, K.; Zhang, X.Y.; Li, G.L.; Ma, J.B.; Zhang, S.Q.; Zheng, J.Y. Effect of using an infiltration hole and mulching in fish-scale pits on soil water, nitrogen, and organic matter contents: Evidence from a 4-year field experiment. Land Degrad. Dev. 2021, 32, 4203–4211. [Google Scholar] [CrossRef]
  97. Song, X.L.; Wu, P.; Gao, X.D.; Yao, J.; Zou, Y.F.; Zhao, X.N.; Siddique, K.H.M.; Hu, W. Rainwater collection and infiltration (RWCI) systems promote deep soil water and organic carbon restoration in water-limited sloping orchards. Agric. Water Manag. 2020, 242, 106400. [Google Scholar] [CrossRef]
  98. Ma, C.K.; Yang, W.Y.; Zhou, B.B.; Wang, Q.J.; Shao, M.A. In situ rainwater harvesting system slows forest decline through increasing soil water content, fine-root traits, and plant hydraulic conductivity. Forests 2024, 15, 571. [Google Scholar] [CrossRef]
  99. Ma, L.H.; Wang, X.; Gao, Z.Y.; Wang, Y.K.; Nie, Z.Y.; Liu, X.L. Canopy pruning as a strategy for saving water in a dry land jujube plantation in a loess hilly region of China. Agric. Water Manag. 2019, 216, 436–443. [Google Scholar] [CrossRef]
  100. Wang, G.H.; Chen, Z.X.; Shen, Y.Y.; Yang, X.L. Thinning promoted the rejuvenation and highly efficient use of soil water for degraded Caragana korshinskii plantation in semiarid loessal regions. Land Degrad. Dev. 2023, 34, 992–1003. [Google Scholar] [CrossRef]
  101. Zhang, L.X.; Li, Y.J.; Hu, X.C.; Sun, S.J.; Zhang, J.S.; Cai, J.F.; Meng, P. Productivity and intrinsic water use efficiency of Robinia pseudoacacia plantations based on Biome-BGC model. For. Res. 2023, 23, 1–10. [Google Scholar]
  102. Li, P.; Li, H.J.; Si, B.C. Estimating deep soil water depletion and availability under planted forest on the Loess Plateau, China. Sci. Total Environ. 2024, 929, 172228. [Google Scholar] [CrossRef]
Figure 1. Map depicting the location of the study area on the Loess Plateau and the distributions of mean annual precipitation (MAP, 1961–2020), 124 modeling sites, and 11 model evaluation sites in the region. ETa, annual actual evapotranspiration during the growing season.
Forests 15 01477 g001
Figure 2. Flowchart depicting the methodology and data sources of the study. Firstly, the performance of the BBGC-SPERRY model was evaluated with data of annual actual evapotranspiration during the growing season (ETa) and daily stem sap flux density collected from previous studies. Then, we simulated the long-term dynamics of plant hydraulic traits with 60-year meteorological data and soil hydraulic parameters at 124 sites by the BBGC-SPERRY model. Finally, based on temporal changes of plant hydraulic traits at each site and plant hydraulic threshold, we evaluated the spatial pattern of drought-induced mortality risk for Robinia pseudoacacia L. plantations using a probabilistic approach.
Forests 15 01477 g002
Figure 3. Flow chart of the BBGC-SPERRY model. The soil–plant–atmosphere continuum water transport is simulated with a plant supply–demand hydraulic model (Sperry model) for the coupled simulation of plant hydraulic traits with water, carbon, and nitrogen cycles in the Biome BioGeochemical Cycles (Biome-BGC) model. APLK, annual average percentage loss of whole-plant hydraulic conductance. HR, heterotrophic respiration.
Forests 15 01477 g003
Figure 4. Schematic diagram of the determination of drought-induced mortality risk probability (shaded area) based on the fitted probability distribution of annual average percentage loss of whole-plant hydraulic conductance (APLK).
Forests 15 01477 g004
Figure 5. Comparison of simulated versus observed annual actual evapotranspiration during the growing season (ETa) in Robinia pseudoacacia L. stands.
Forests 15 01477 g005
Figure 6. Spatial distribution of minimum (a), maximum (b), and mean (c) annual average percentage loss of whole-plant hydraulic conductance (APLK) for Robinia pseudoacacia L. in the study area.
Forests 15 01477 g006
Figure 7. Correlations between environmental factors, minimum, maximum, and mean annual average percentage loss of whole-plant hydraulic conductance (APLK), and drought-induced mortality risk probability (DMRP) for Robinia pseudoacacia L. MAP, mean annual precipitation; and MAT, mean annual temperature. Color gradient and size of the symbols indicate the correlation coefficient among different indicators. * means p < 0.05; ** means p < 0.01; and *** means p < 0.001.
Forests 15 01477 g007
Figure 8. Spatial distribution of drought-induced mortality risk probability (DMRP) of Robinia pseudoacacia L. in the study area.
Forests 15 01477 g008
Table 2. Stepwise regression for the main variables driving the spatial distribution of minimum, maximum, and mean annual average percentage loss of whole-plant hydraulic conductance (APLK) and drought-induced mortality risk probability (DMRP) for Robinia pseudoacacia L.
VariableRegression EquationR2p
Minimum APLK0.885 − 0.494ELV − 0.543MAP + 0.151SA0.500.0001
Maximum APLK1.314 − 0.648MAP − 0.177MAT − 0.399CC0.660.0001
Mean APLK0.696 − 0.794MAP + 0.209SA0.770.0001
DMRP0.687 − 0.687MAP − 0.300MAT + 0.243SA0.680.0001
Note: all variables were scaled by a min–max normalization method. MAP, mean annual precipitation; MAT, mean annual temperature; CC, clay content; SA, sand content; and ELV, elevation.
Disclaimer/Publisher’s Note: The statements, opinions and data contained in all publications are solely those of the individual author(s) and contributor(s) and not of MDPI and/or the editor(s). MDPI and/or the editor(s) disclaim responsibility for any injury to people or property resulting from any ideas, methods, instructions or products referred to in the content.

