Abstract
Cities play a critical role in anthropogenic CO2 emissions, which exacerbate climate change and impact urban populations. Urban green infrastructure, such as urban trees, provides essential ecosystem services, including reducing atmospheric CO2 levels. However, there is a significant knowledge gap regarding the impact of urban trees on climate change in semiarid, polluted cities like Tehran, the capital and largest metropolis of the Middle East. This study assesses the carbon sequestration and storage potential of Tehran’s urban infrastructure using the i-Tree Eco model. A randomized cluster sampling method was employed, collecting data on species composition, diameter at breast height (DBH), and total tree height. The results indicate that Tehran’s urban trees sequester approximately 60,102 tons of carbon per year, equivalent to 220,393 tons of CO2. The net carbon storage in urban trees is about 254,579 tons, equivalent to 933,455 tons of CO2. Parks and urban green spaces demonstrate the highest rate of carbon sequestration per hectare, followed by urban services land use. Prioritizing the planting of species with high sequestration rates like Cupressus arizonica (Arizona cypress) and Cupressus sempervirens L. var. horizontalis (Mediterranean cypress) could enhance carbon sequestration efforts in Tehran. These data provide valuable insights into the carbon sequestration potential and environmental impact of different land use types, and may aid in the development of effective environmental policies and land management strategies in semiarid urban areas and other cities in similar settings.
Keywords:
carbon offsetting; i-Tree Eco model; land use; Tehran; Iran; urban forests; urban green spaces; urban planning 1. Introduction
Climate change is a global concern and is one of the foremost challenges confronting humanity in the 21st century due to its remarkable ecological and socio-economic impacts [1,2]. The primary driver of climate change is the emission of greenhouse gases, mainly CO2 [2]. Since the Industrial Revolution, atmospheric CO2 levels have surged from 260 to 392 ppm [3]. Urban activities contribute approximately 77% of energy-related CO2 emissions, making cities important locations for observing the impacts of global climate change on human populations [4]. Urbanization is rapidly increasing, with about two-thirds of the world’s population predicted to reside in cities by 2050 [5]. Urbanization leads to reduced biodiversity [6] and exacerbates issues such as pollution [7], urban heat islands [8], and flood risks [9], resulting in significant environmental, social, and economic consequences. Moreover, global temperatures have risen, making 2023 the warmest year on record [10]. Therefore, it is essential to not only mitigate the total amount of carbon emissions but also to enhance carbon sinks within urban areas by expanding and improving urban green spaces to lower atmospheric greenhouse gas concentrations [11].
Green spaces serve as significant terrestrial carbon pools through carbon sequestration and storage, benefiting the natural environment and helping to mitigate climate change [2]. In cities, where urbanization has led to increased air pollution, the role of urban green spaces in offsetting CO2 emissions and combating climate change becomes even more pronounced [12,13,14]. Numerous studies have highlighted the essential role of urban trees in carbon sequestration and storage; trees cover 27% of urban areas worldwide [15,16]. Carbon sequestration, the process of capturing and storing carbon in vegetation and soils, is essential for mitigating climate change by reducing the atmospheric concentration of greenhouse gases. Furthermore, carbon storage is another significant way trees influence climate change. As trees mature, they absorb and store increasing amounts of carbon within their tissues [17]. Urban green spaces are vital in balancing the global carbon cycle by facilitating carbon storage, reducing energy consumption, and lowering carbon emissions. While accurately estimating these ecosystem services is essential for effective urban management, it presents significant challenges. To address these challenges, the i-Tree Eco model was developed to evaluate the urban forest structure and to quantify the ecosystem services it provides [18]. The model is widely recognized for its effectiveness in estimating the ecosystem services provided by urban forests [17].
In 2020, global CO2 emissions reached 33,566,428 kilotons. In Iran, CO2 emissions were approximately 616,561 kilotons that year, rising to 710,831 kilotons in 2021 and 686,420 kilotons in 2022, representing a staggering threefold increase since 1971 [19]. Iran is the primary emitter of CO2 in the Middle East and the seventh largest emitter globally [20]. Tehran, the capital and largest city of Iran, is the most air-polluted and densely populated city in western Asia [21], and significantly contributes to the country’s overall CO2 emissions [22]. Numerous studies highlight that accelerated population growth, industrial development, urban development, and rising fuel consumption are key factors negatively impacting air quality in Tehran [23]. Additionally, the city’s topography and climate play significant roles in air pollution [24,25]. Tehran is encircled by the high Alborz Mountain range, which traps air pollutants. Temperature inversion during the colder months further exacerbates this issue by preventing the dispersion of pollutants [25].
Despite the critical role of urban green spaces in providing ecosystem services like carbon sequestration and storage, their impact on offsetting carbon emissions in Tehran has not been thoroughly investigated. Understanding the dynamics of carbon sequestration in Tehran’s urban green spaces is essential for optimizing their contribution to climate change mitigation and enhancing the city’s urban ecosystem resilience. To fill this research gap, this study aims to thoroughly investigate and quantify the carbon sequestration capacity of various types of trees and land uses in Tehran’s urban green spaces using the i-Tree Eco model. The ultimate goal is to highlight the importance of tree-based carbon sequestration initiatives as a strategy for mitigating climate change in Tehran.
2. Materials and Methods
2.1. Study Area
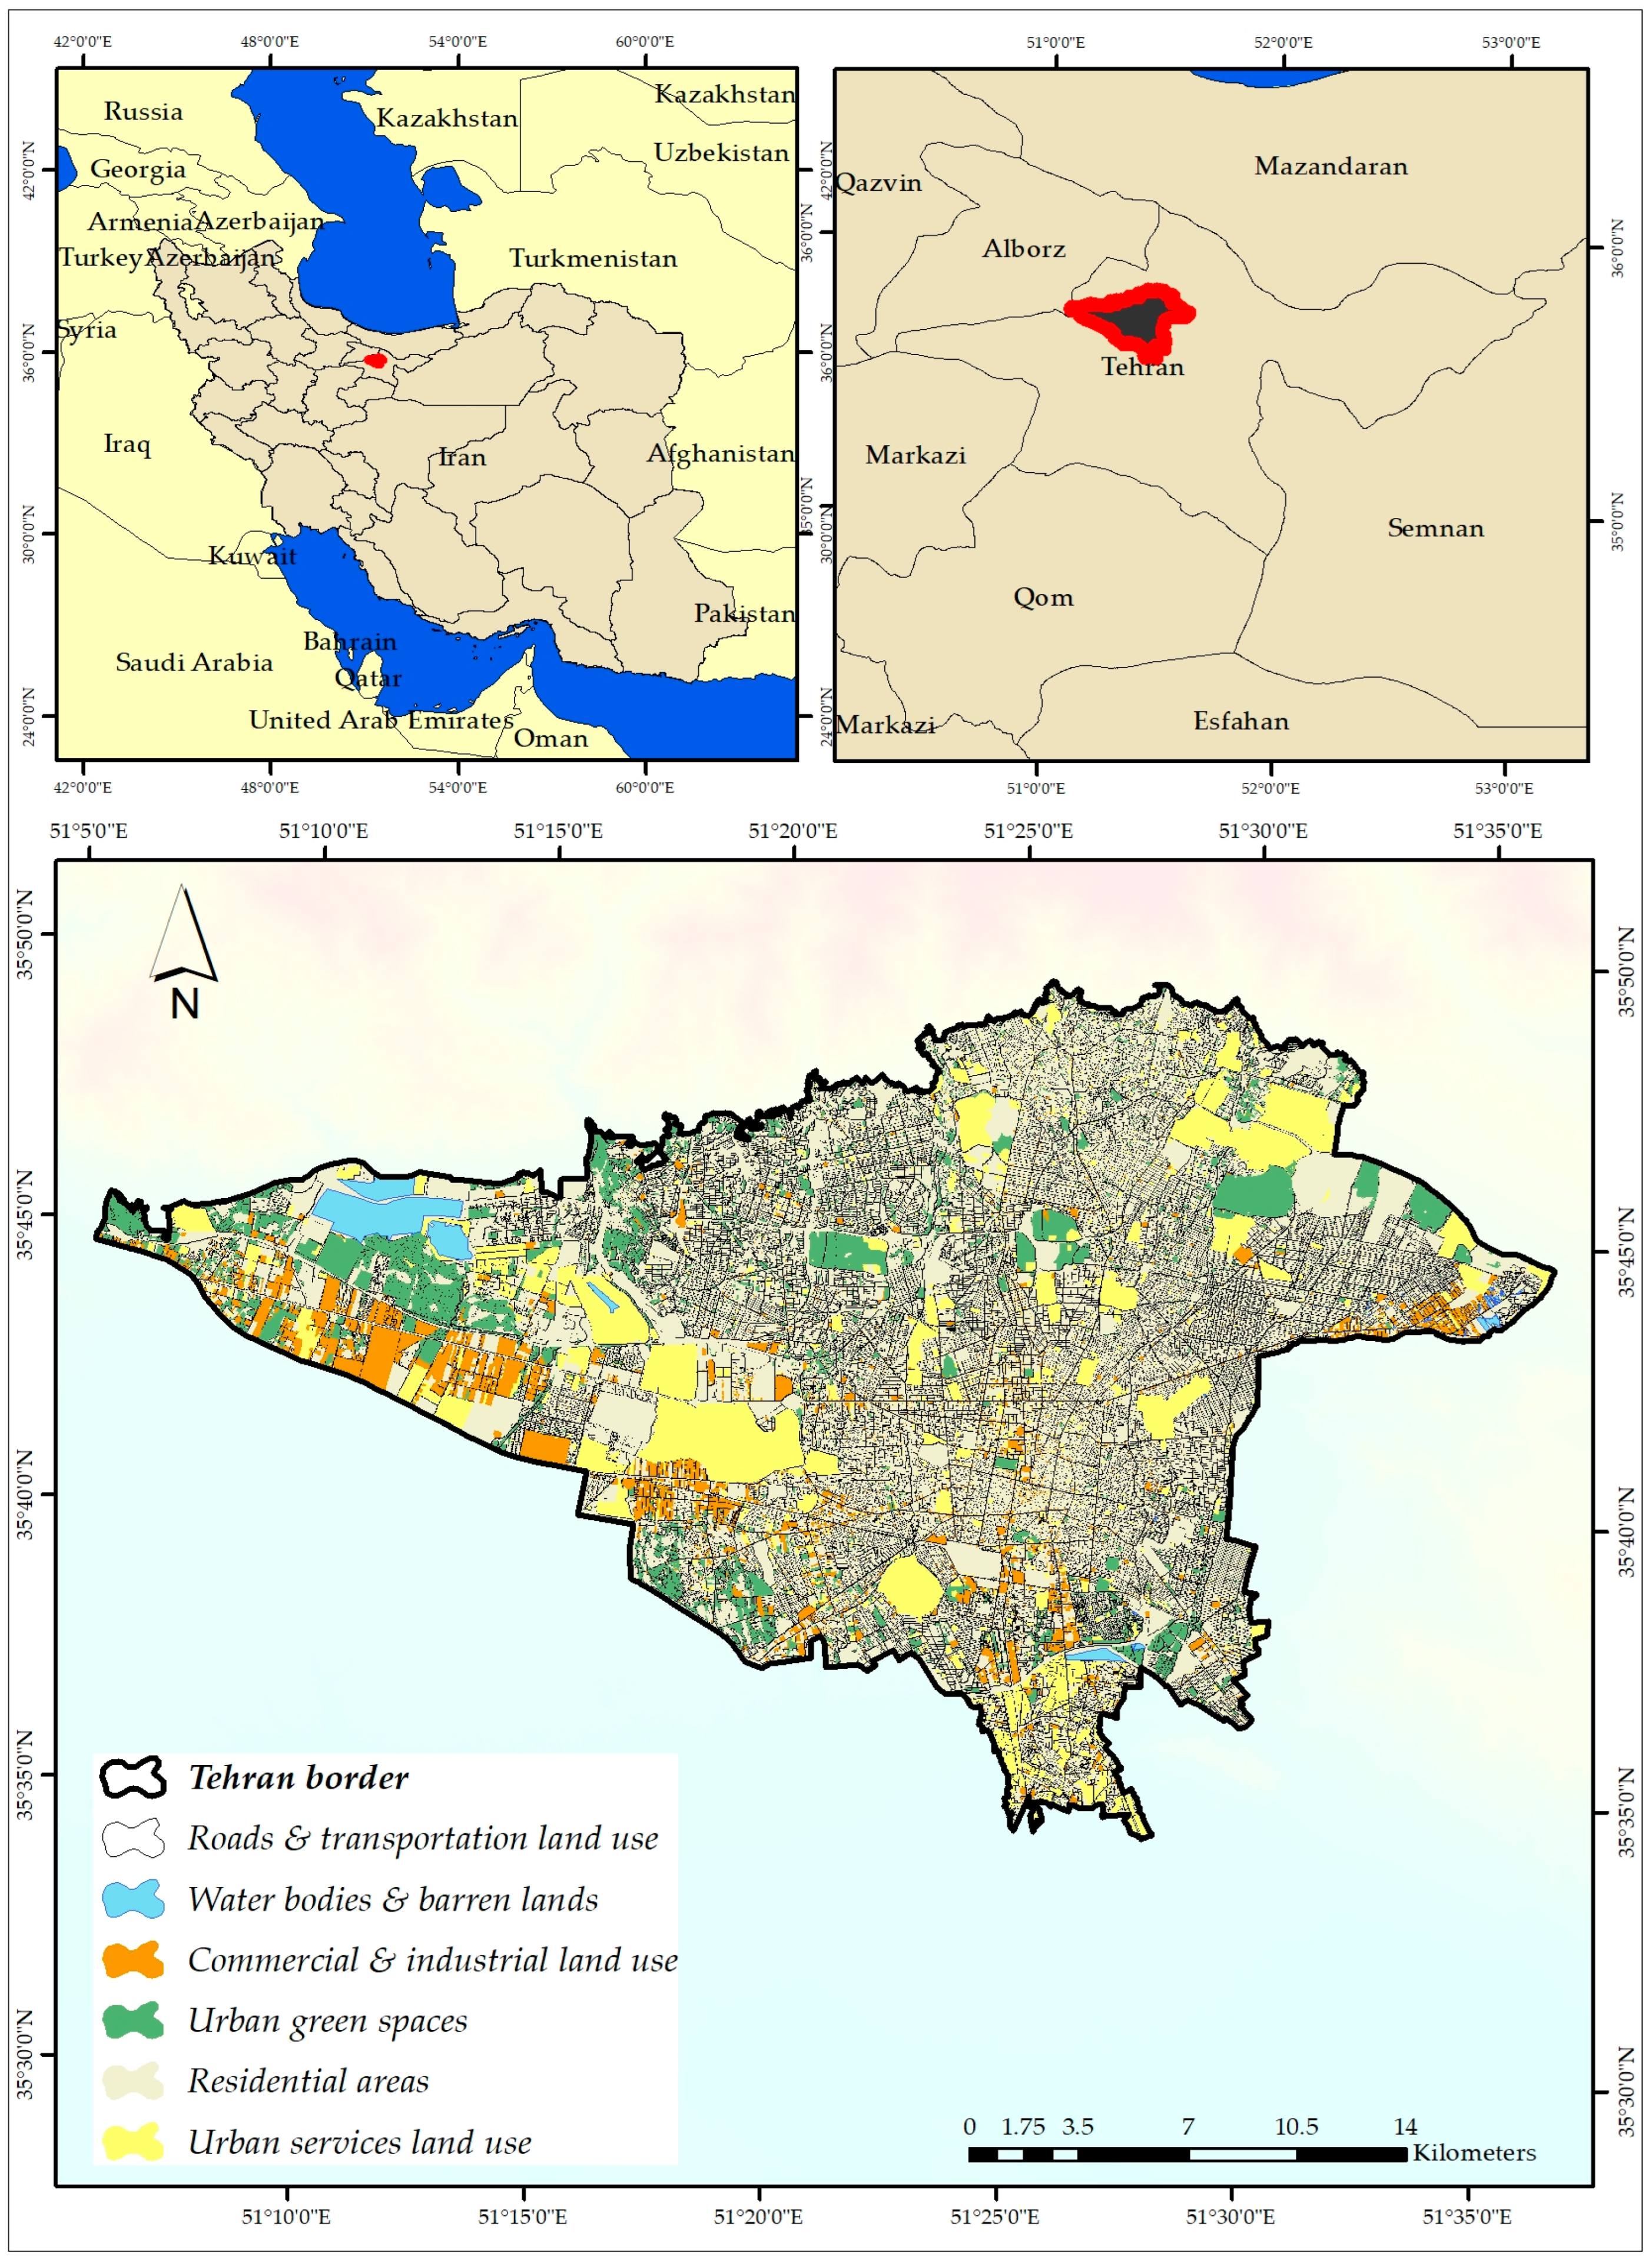
The present study was conducted within the boundaries of Tehran, the capital of Iran, located at 35°31′ to 35°37′ N, 51°38′ to 51°48′ E (Figure 1). Tehran spans approximately 59,000 hectares and is home to 13 million people (source: www.census.gov/quickfacts (accessed on 22 January 2023)). The city experiences significant temperature and precipitation variations, with average annual temperatures ranging from 15 to 18 °C and annual precipitation from 150 to 420 mm, from south to the north, respectively [26]. The altitude of the city ranges from 900 to 1800 m a.s.l.
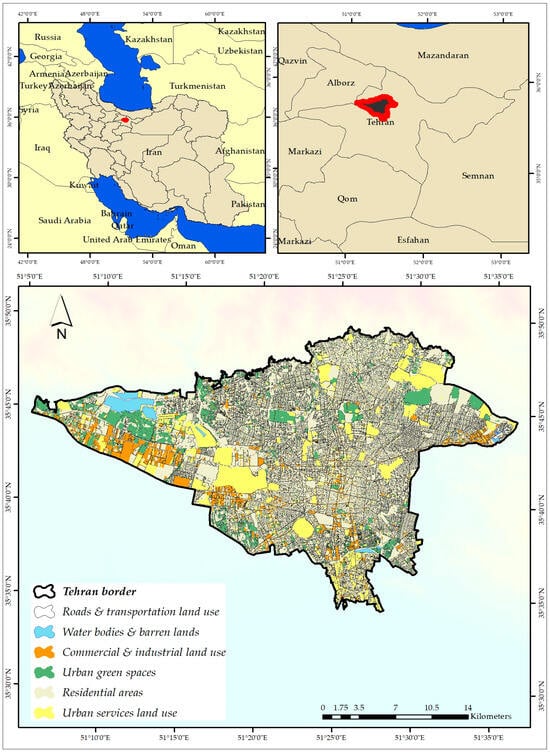
Figure 1.
Location of study area (Tehran) and land use classes (source: land use map of Tehran (scale; 1:25,000) obtained from Tehran municipality).
2.2. Research Methods
2.2.1. i-Tree Eco Model
In this study, the i-Tree Eco model was employed to evaluate carbon sequestration and storage by urban trees in Tehran. Originally developed by the United States Department of Agriculture Forest Service for use in the USA, the model can be adapted for use in other countries by adhering to specific guidelines and protocols [27]. Running the i-Tree Eco model for areas outside of the United States involves five steps: (1) developing a model for the study area, (2) planning for project implementation, (3) collecting data, (4) running the model, and (5) retrieving the report. In this research, the i-Tree Eco model was customized for implementation in Tehran by following the relevant guidelines outlined in the i-Tree Eco User’s Manual [28].
2.2.2. Model Development for the Study Area
To develop the i-Tree Eco model for study areas outside of the United States, the following information is required:
- (1)
- Location information: This includes details such as the climate zone; latitude and longitude of the study area; elevation (meters above sea level); the number of leaf-on and leaf-off days of trees; and average daily temperature, rainfall, and snowfall levels, among other climate-related parameters.
- (2)
- Precipitation data: Hourly rainfall and snowfall data for the year 2018, captured from the Mehrabad Synoptic Station, were used. Additionally, other required climate data were automatically retrieved by the model from the National Climatic Data Center.
- (3)
- Air pollution data: Hourly data on the concentrations of major air pollutants (NO2, SO2, O3, PM10, PM2.5, and CO) were obtained from the Tehran Air Quality Control Company for the year 2018.
All of these data were recorded in the i-Tree Database. Subsequently, the i-Tree support team evaluated and validated the data before integrating them into the new version of the model [28].
2.2.3. Determining the Number of Plots
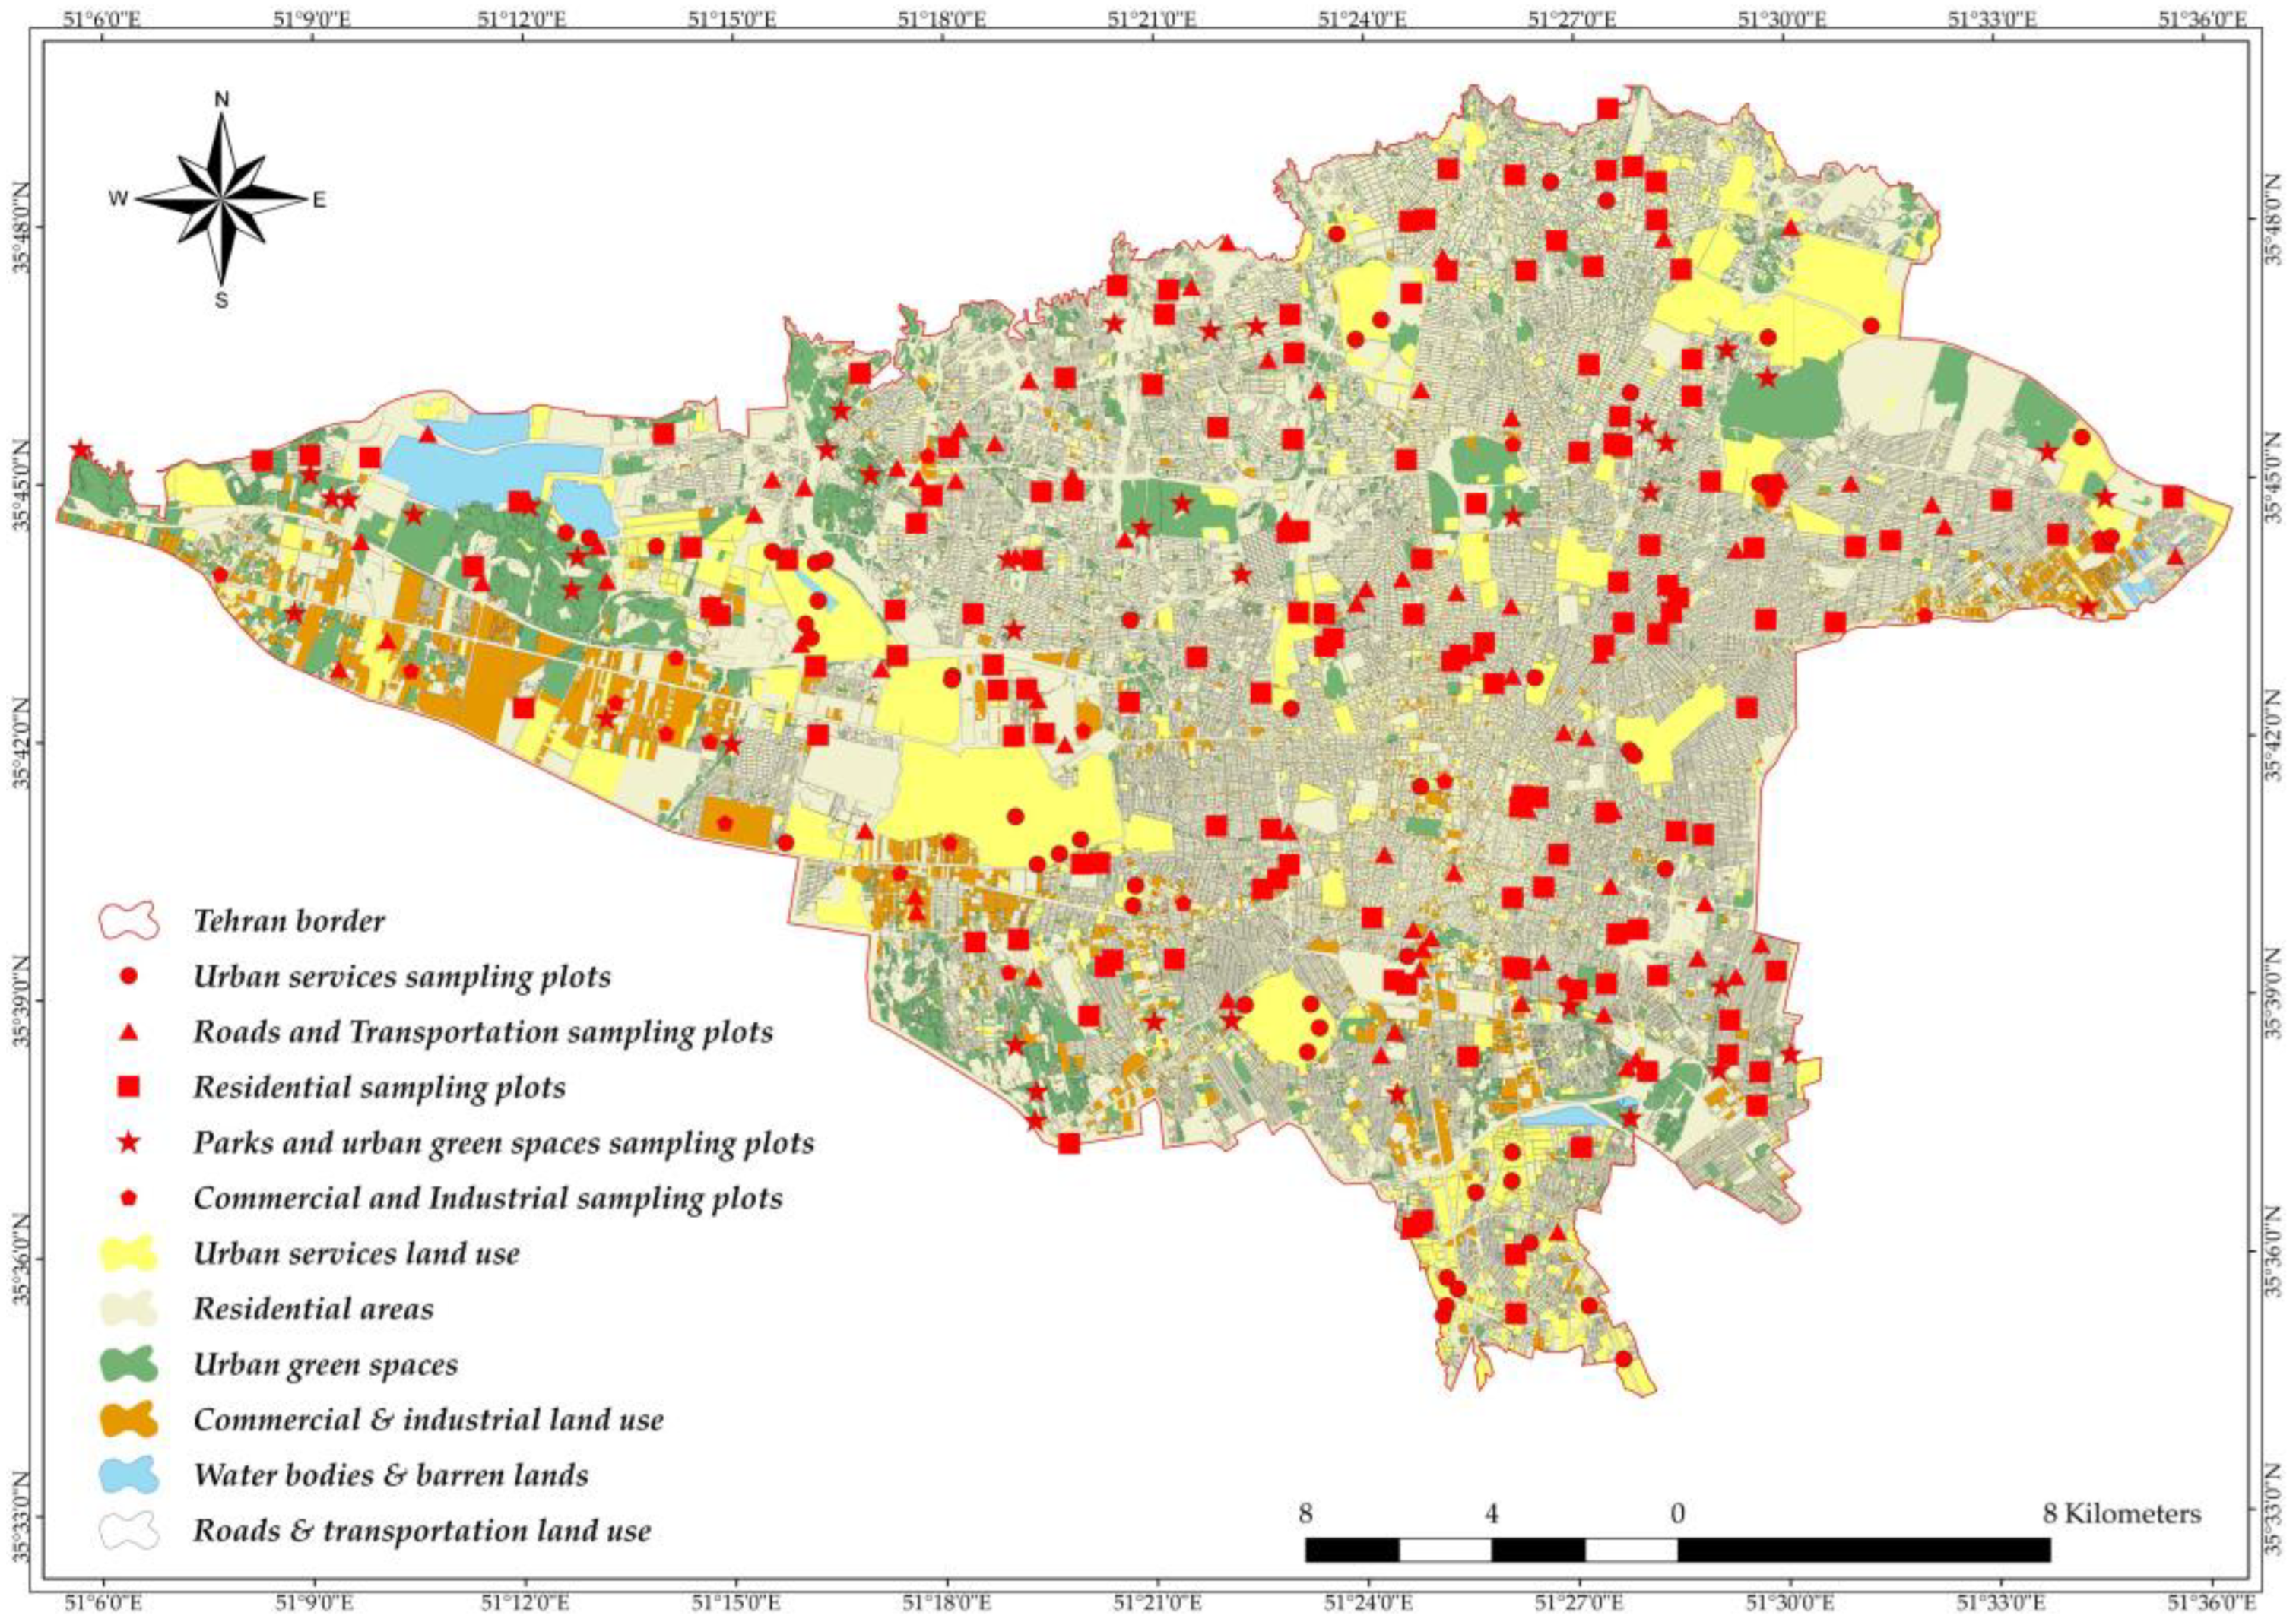
As a general guideline, using 200 plots in stratified random sampling (with a minimum of 20 plots per stratum) typically results in a standard error of about 10% when estimating parameters for an entire city [27,28]. While increasing the number of plots can reduce the standard error, it also raises the cost and time required for sampling [28]. To balance time constraints, resource limitations, and survey costs, 300 plots were identified for this study, based on recommendations from the i-Tree Eco User’s Manual [28] and previous studies [29,30,31]. An additional 5%–10% of plots were included to account for any that may be inaccessible, if necessary [28]. For the spatial distribution of plots, the Tehran land use map (scale 1:25,000 for the year 2020) was obtained from the Tehran municipality (Figure 2 and Table 1). Based on land use similarity, the map was divided into five classes (Table 1 and Figure 2): (1) commercial and industrial land use, (2) parks and urban green spaces, (3) residential areas, (4) roads and transportation land use, and (5) urban services land use. To determine the number of plots for each land use class, a questionnaire was prepared and completed by 30 environmental experts, including national academic staff and Ph.D. candidates (Table 1 and Figure 2).
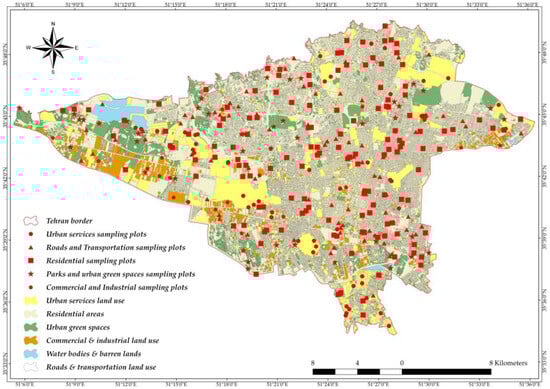
Figure 2.
Spatial distribution of sample plots within the city of Tehran.

Table 1.
Description, number of plots, and total area of land use classes in Tehran city.
2.2.4. Data Collection
It is crucial to identify the specific data that should be collected during the field survey [28]. In this study, two types of field data were gathered: (1) Plot Data, including percent measured, percent tree cover, GPS coordinates, and reference objects; and (2) Tree Data, encompassing species, diameter at breast height (DBH), tree status (dead or alive), distance and direction to the plot center, crown health, total tree height, live crown height, crown base height, crown width, whether the crown was missing, cover under the canopy, crown light exposure, whether it was a street or non-street location, whether it was public or private property, and GPS coordinates. Field data collection took place during the fully leafed period from June to September 2020. Measurements were conducted using a measuring tape and a clinometer. Although 330 plots were initially designated, 14 plots were found to be inaccessible (Table 1).
2.3. Carbon Sequestration and Storage Ecosystem Services of Trees
The i-Tree Eco model, created by the USA Department of Agriculture (USDA), is a comprehensive software suite designed to quantify the urban forest structure and ecological functions. i-Tree Eco utilizes standardized field data (sampling or full inventory) combined with air pollution and climatic data. This approach enables a detailed analysis of the urban forest structure, and the measurement of various ecological services provided by urban forests [17].
To calculate the annual carbon sequestration, the carbon stored in the previous year’s growth is deducted from the current year’s carbon storage (Equations (1) and (2); [28]). The annual sequestered carbon depends on several factors, including the average tree diameter (which relates to available biomass and the length of the growing season), tree diameter class, tree health, and the hours of sunlight exposure a tree receives [17].
where the carbon fraction is usually 0.5 [32]. The biomass of a tree can be estimated using allometric equations, which relate the biomass to measurable tree parameters such as DBH, height, and wood density (for more information about tree biomass calculation using allometric equations, see Appendix 10 in [31]).
Annual carbon sequestration = current year’s carbon storage − previous year’s carbon storage
Carbon storage = tree biomass × carbon fraction
3. Results and Discussion
3.1. Carbon Sequestration by Urban Trees in Tehran
Table 2 illustrates the ecosystem service of atmospheric carbon sequestration and its CO2 equivalent provided by Tehran’s urban trees across various land use strata. The net carbon sequestration by urban trees in Tehran is approximately 60,102 tons per year (t yr−1), equivalent to 220,393 t yr−1 CO2. The highest rate of carbon sequestration, 18,579 t yr−1 (30.9%), occurs within residential areas due to their large area and abundance of trees. It is worth noting that residential areas are the largest producers of carbon dioxide in Tehran, generating 18,339,000 t yr−1, equivalent to 39% of the city’s CO2 emissions [22]. Parks and urban green spaces rank second, with 15,681 t yr−1 (26.1%) of carbon sequestration. The lowest rate of carbon sequestration is in roads and transportation land use, with 6697 t yr−1 (11.4%) (Table 2).
Table 2.
Net carbon sequestration and its CO2 equivalent by Tehran’s urban trees across various land use strata.
Moreover, Table 2 shows the rate of carbon sequestration and its CO2 equivalent per hectare for various land uses in the year 2020. These data provide valuable insights into the carbon sequestration potential and environmental impact of different land use types within the study area, aiding in the formulation of effective environmental policies and land management strategies. On average, the carbon sequestration rate by urban trees in Tehran is approximately one ton per hectare per year (t ha−1 yr−1). Consistently with expectations, parks and urban green spaces demonstrate the highest rate of carbon sequestration per hectare, with 3.06 t ha−1 yr−1, equivalent to 11.21 t CO2 ha−1 yr−1. This is followed by urban services land use, with a carbon sequestration rate of 1.18 t ha−1 yr−1 and a CO2 equivalent of 4.32 t ha−1 yr−1. The other three land uses—roads and transportation, residential areas, and commercial and industrial land use—exhibit approximately the same carbon sequestration rate per hectare at about 3 t ha−1 yr−1.
Table 3 shows the urban tree species in Tehran that have the highest annual carbon sequestration rates. Cupressus arizonica leads with 11,890 tons per year (t yr−1), followed by Pinus eldarica at 8990 t yr−1, Platanus orientalis at 5099 t yr−1, and Robinia pseudoacacia at 3980 t yr−1. It should be noted that although Platanus orientalis and Pinus eldarica sequester carbon at higher rates, they have the lowest rate of carbon sequestration per hectare of leaf area (1.18 and 1.45 t yr−1 ha−1 of leaf area, respectively). These data provide important information about the carbon sequestration capabilities of various urban trees in Tehran, which may aid in the creation of effective environmental policies and approaches for green space management and tree cultivation.
Table 3.
Urban tree species of Tehran with the highest carbon sequestration rates.
3.2. Carbon Storage by Urban Trees in Tehran
Table 4 presents data on carbon storage and its CO2 equivalent in trees across various land use strata within Tehran city. Urban trees in Tehran store 254,578.6 tons of carbon, equivalent to 933,454.8 tons of CO2. Residential areas, with the highest percentage of tree presence (36.23%), account for the most significant carbon storage at 95,764.6 tons, equal to 351,136.8 tons of CO2 (37.6%). Parks and urban green spaces rank second, storing 59,565.1 tons of carbon, equivalent to 218,405.5 tons of CO2 (23.4%). Carbon storage in the other three land use classes—commercial and industrial, roads and transportation, and urban services—ranges, similarly, from 30,000 to 40,000 tons. Moreover, Table 4 provides information on carbon storage and its CO2 equivalent per hectare by urban trees in different land use classes across Tehran. Parks and urban green spaces exhibit the highest carbon storage per hectare, with 11.43 tons of carbon and a CO2 equivalent of 41.90 t ha−1. Trees in commercial and industrial land use store approximately 3.15 t ha−1 of carbon, with an 11.57 t ha−1 CO2 equivalent. Residential areas store about 3.72 t ha−1 of carbon, equivalent to 13.65 t ha−1 CO2. Roads and transportation land use store 3.09 t ha−1 of carbon, with an 11.3 t ha−1 CO2 equivalent. Urban services land use stores approximately 4.38 t ha−1 of carbon, with a CO2 equivalent of 16.8 t ha−1. Overall, the study area has an average carbon storage of 4.31 t ha−1, with a CO2 equivalent of 15.80 t ha−1. Trees serve as significant carbon sinks by absorbing CO2 from the atmosphere and storing it as carbon in their woody biomass [32]. As trees mature, they capture and store increasing amounts of carbon within their tissues. However, upon death and decay, these trees release a significant portion of this stored carbon back into the atmosphere. Consequently, carbon storage reflects the potential carbon release if trees are left to die and decay. Healthy trees continuously sequester carbon, and their preservation is crucial for reducing carbon emissions by ensuring this stored carbon remains sequestered [33]. Also, maintaining optimal growth conditions helps biomass accumulation [34]; hence, maintaining these conditions for urban trees is critical for maximizing their carbon sequestration potential.
Table 4.
Carbon storage and its CO2 equivalent in various land use strata within study area, Tehran.
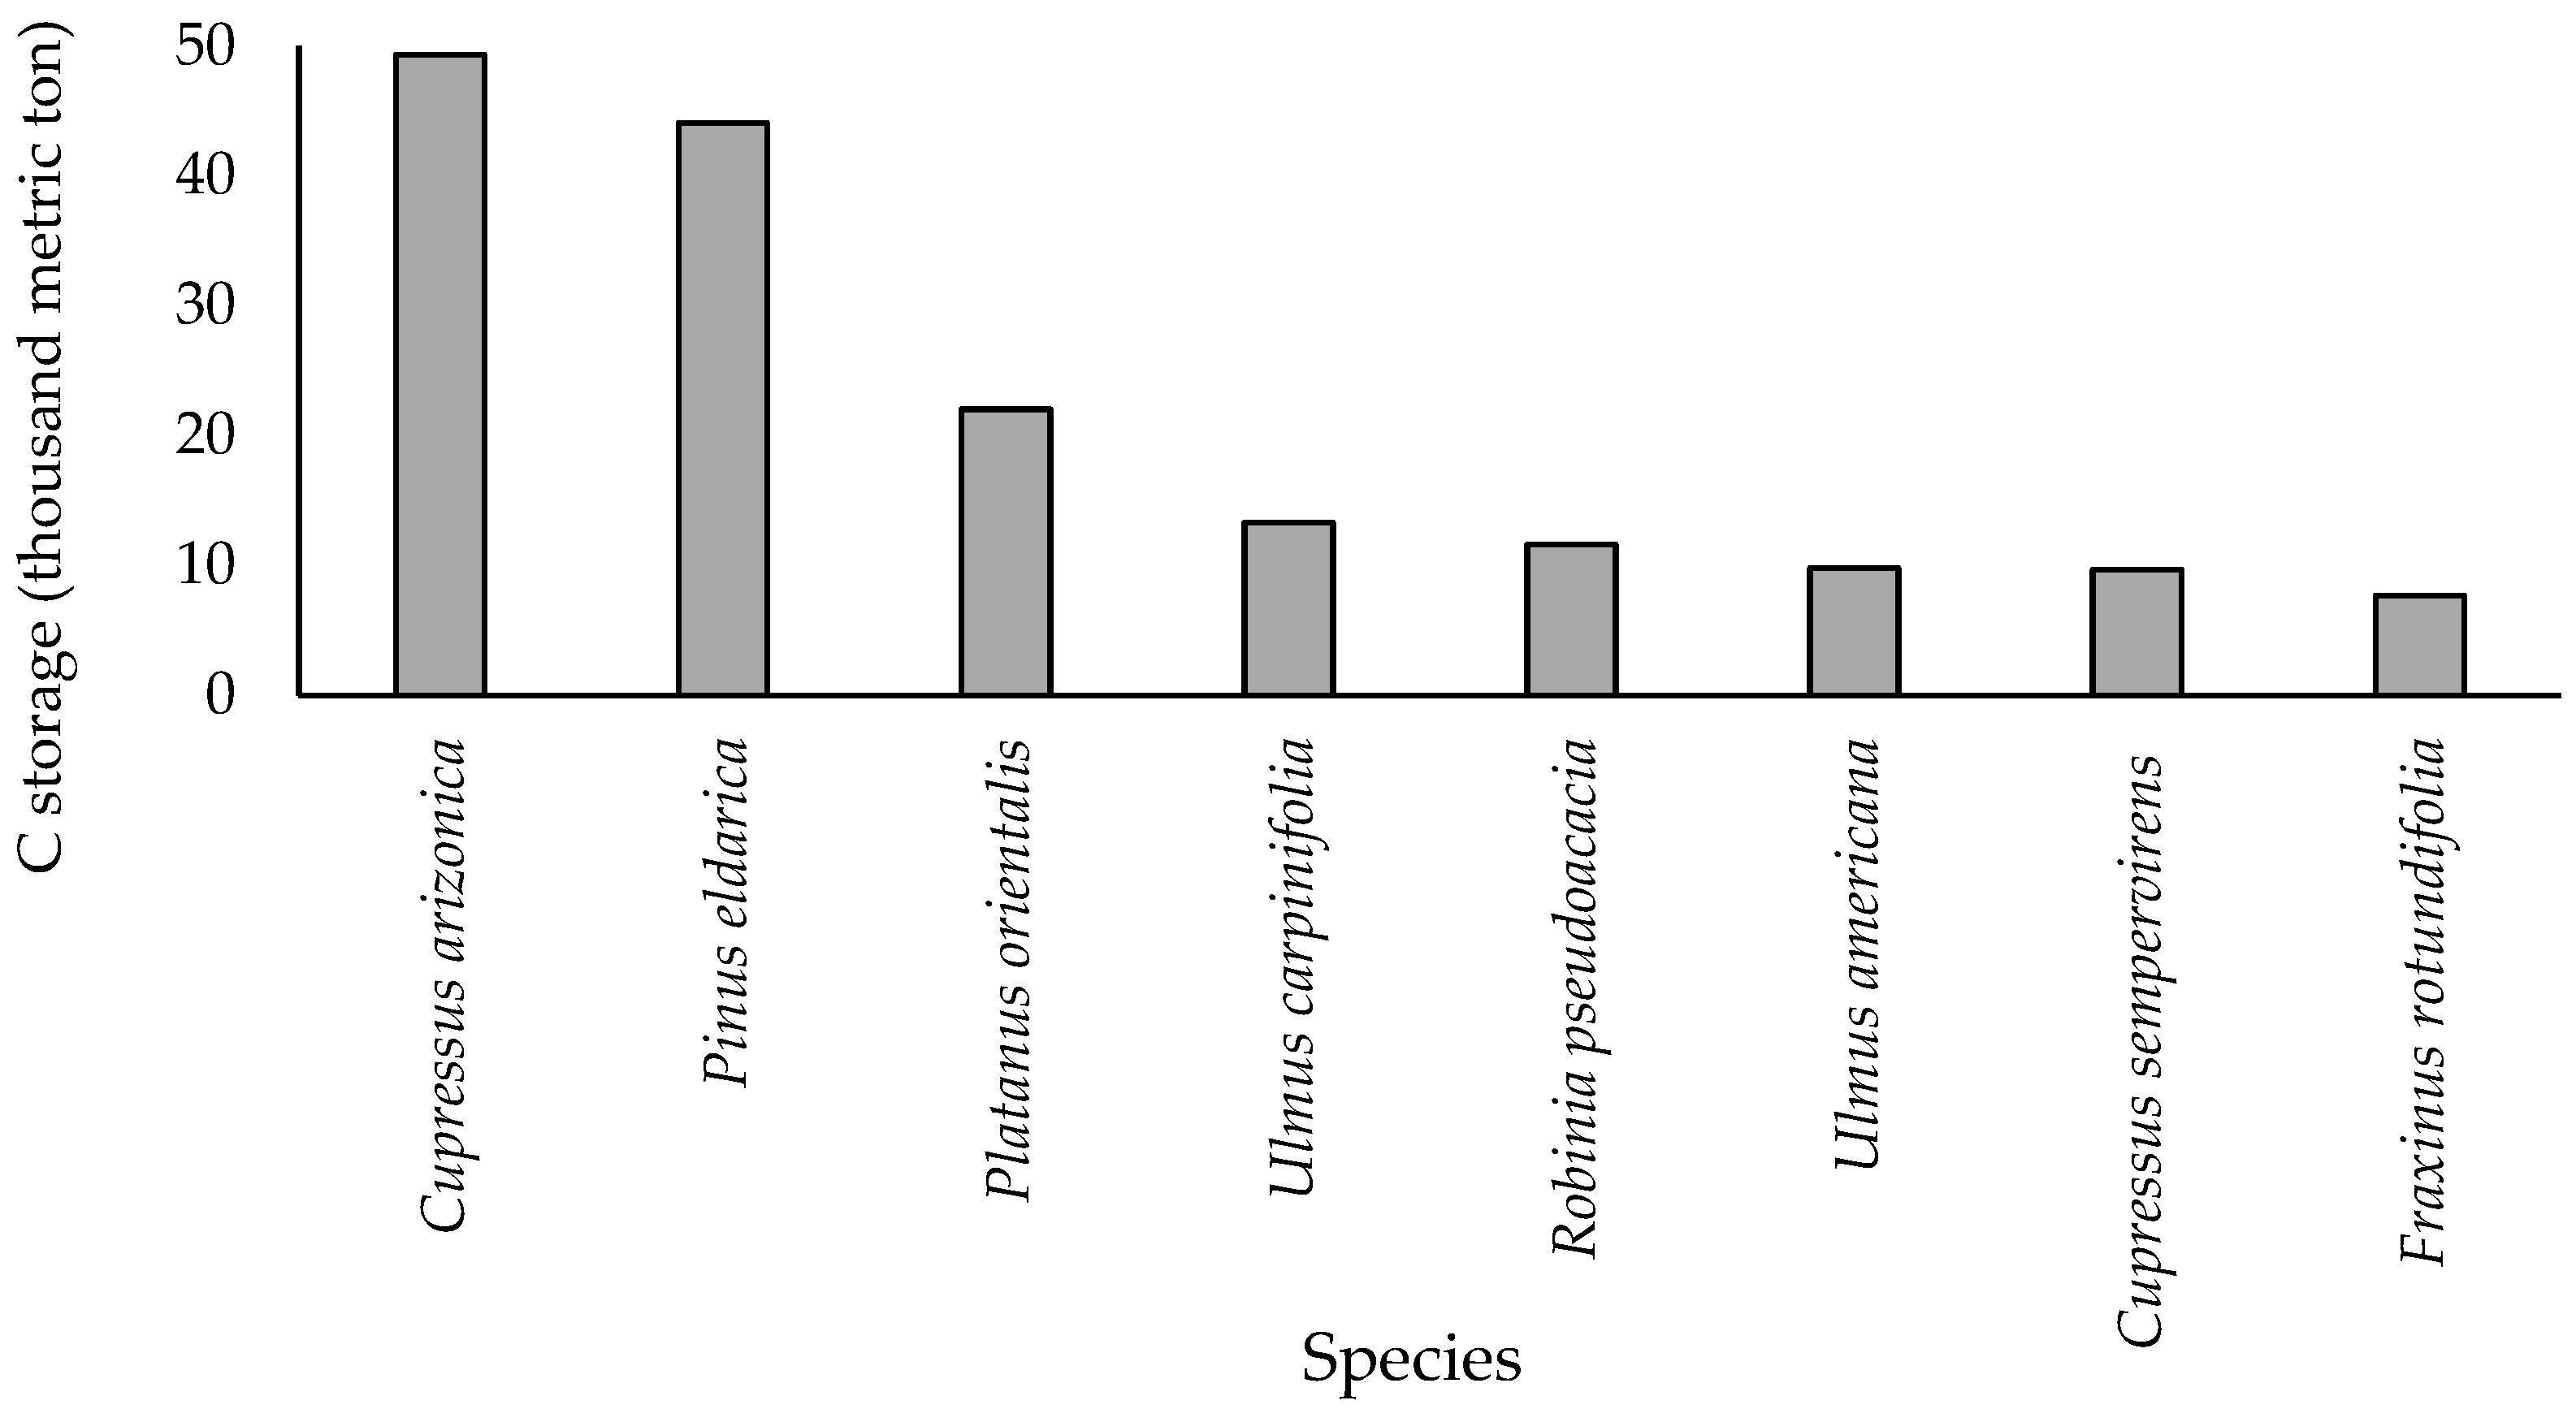
Figure 3 demonstrates the varying capacities of different tree species to store carbon. Urban forestry initiatives aiming to maximize carbon sequestration should prioritize species with higher storage capacities. Cupressus arizonica exhibits the highest carbon storage capacity at approximately 49,000 tons. Pinus eldarica follows closely with about 44,000 tons, making it the second highest sequester among the species listed (Figure 3).
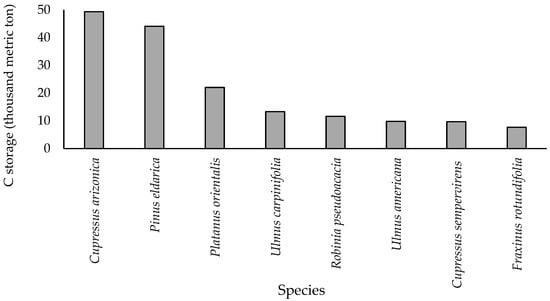
Figure 3.
Estimated carbon storage for urban tree species with highest storage capacity in Tehran.
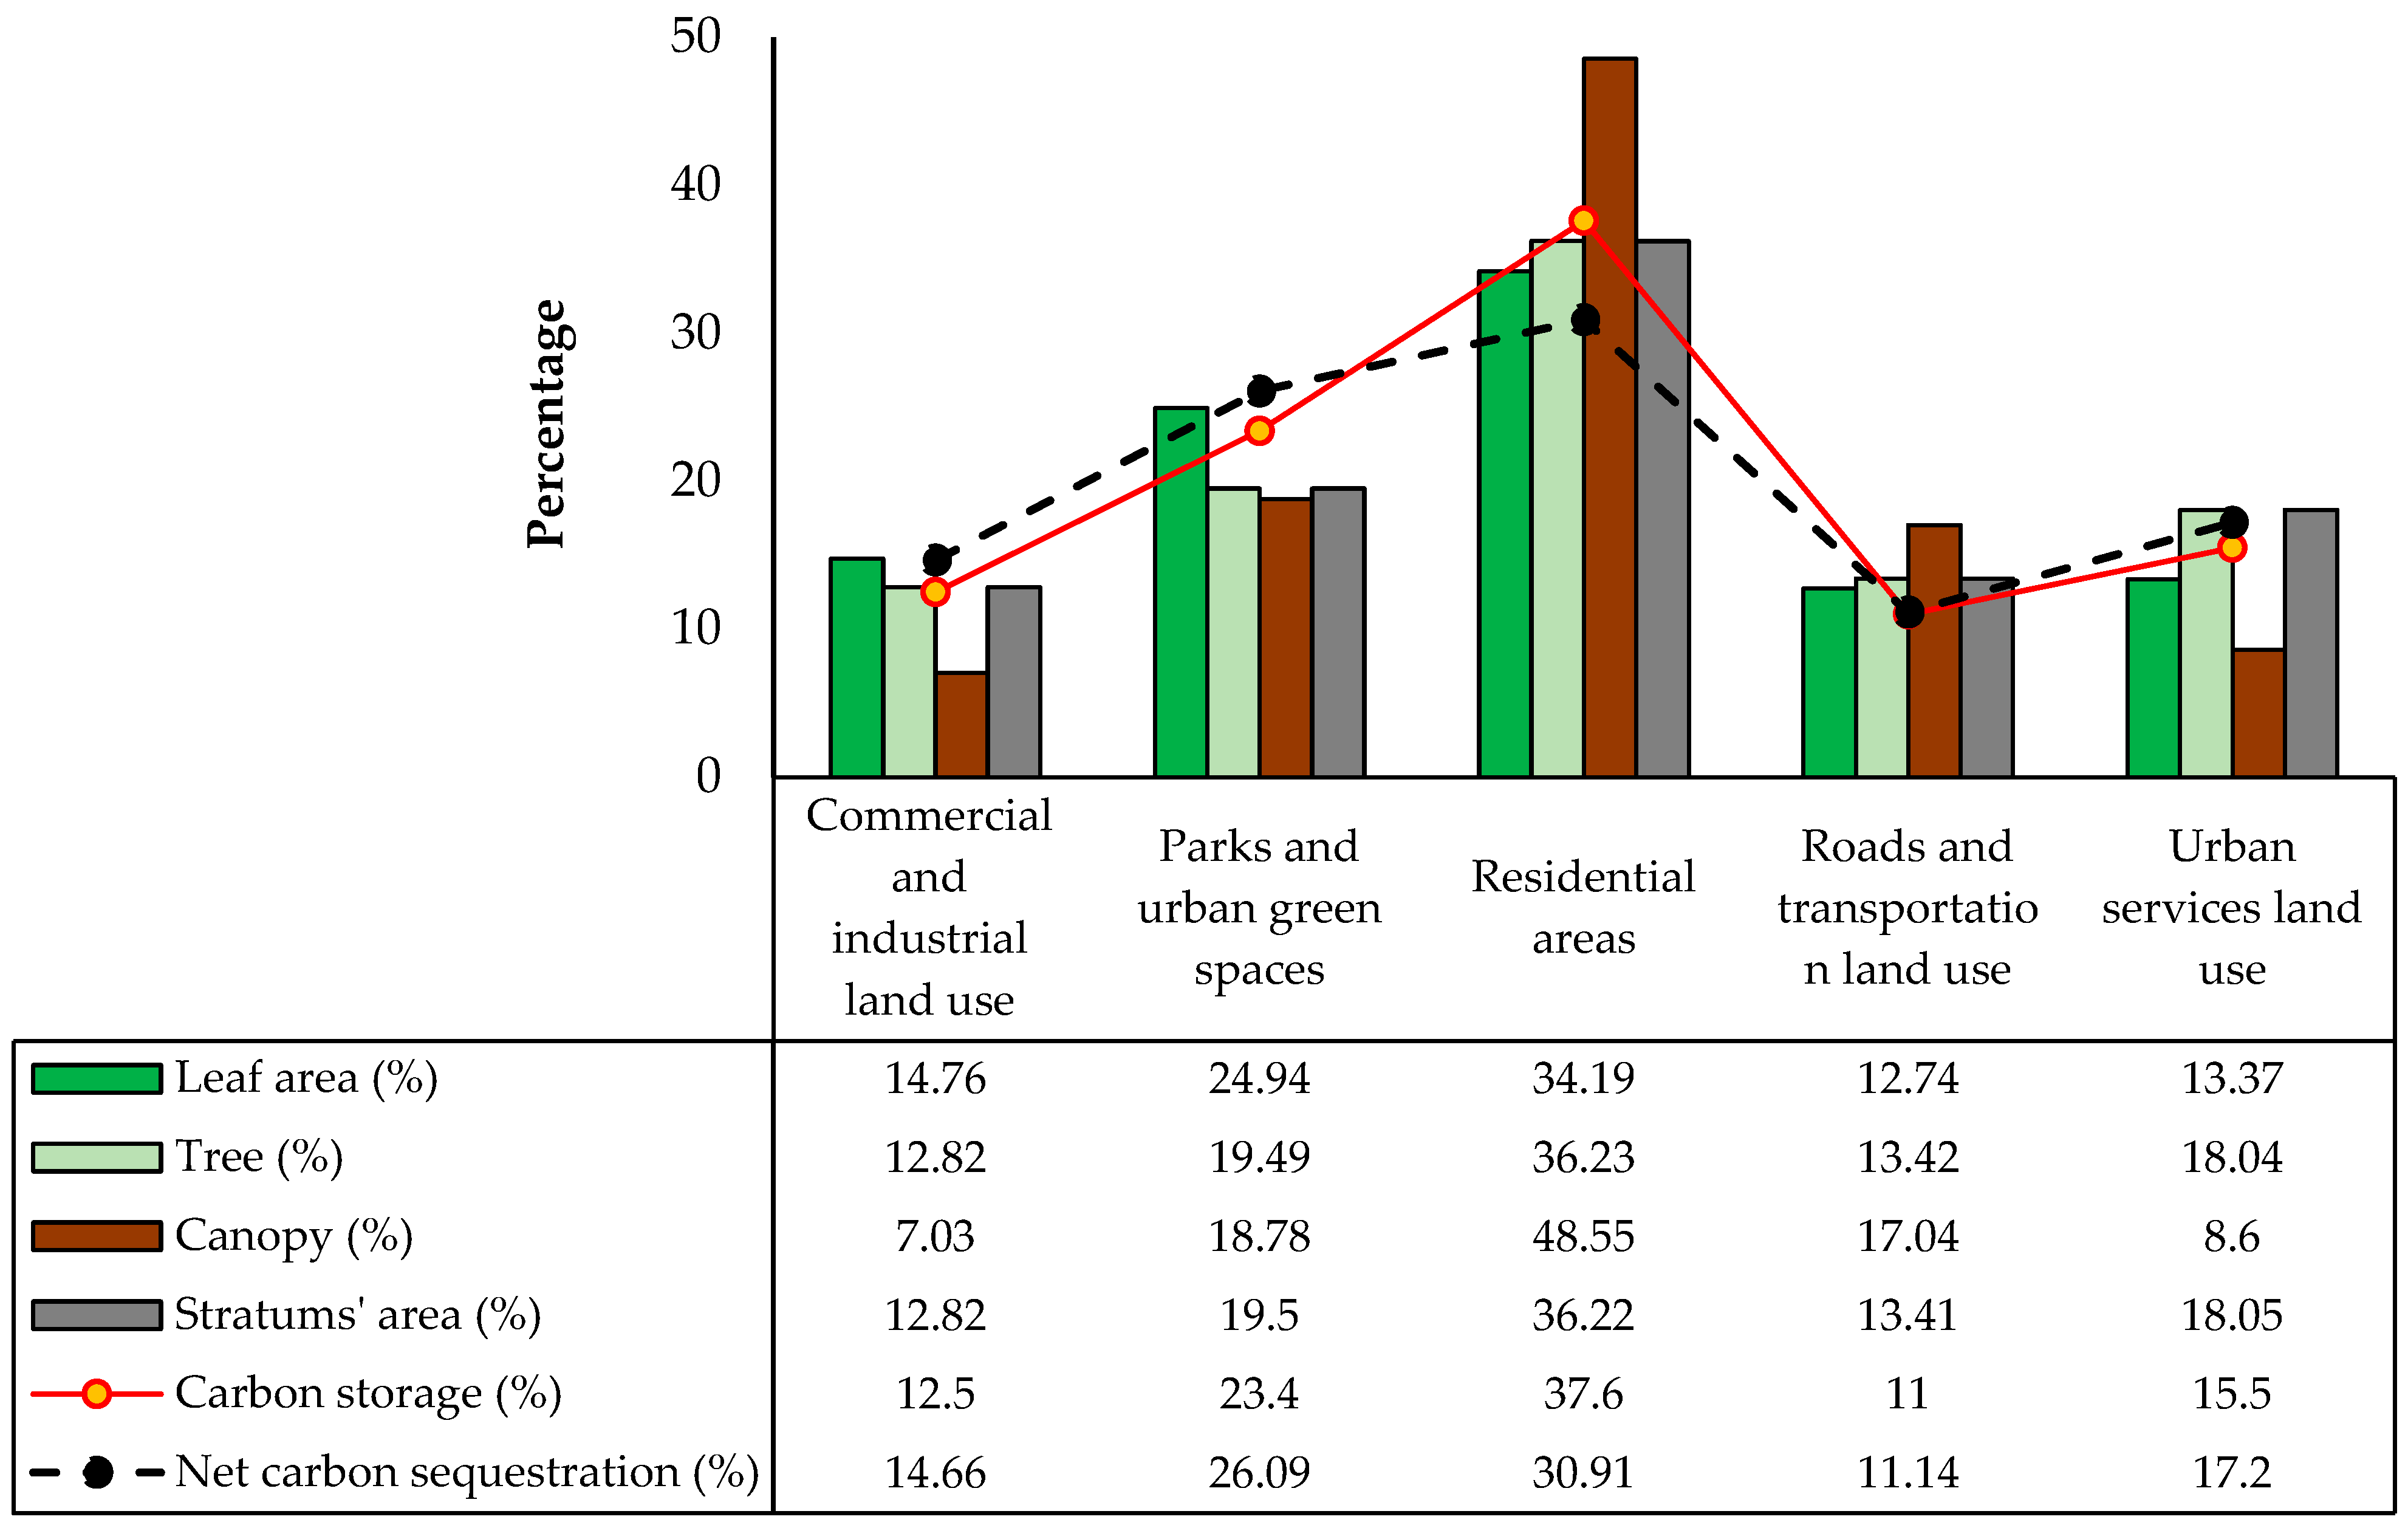
Figure 4 compares the carbon storage and sequestration, along with related structural characteristics, among different land classes. Residential land use and green spaces account for approximately 57% of total carbon storage and 61% of total carbon sequestration due to their higher tree cover and leaf area.
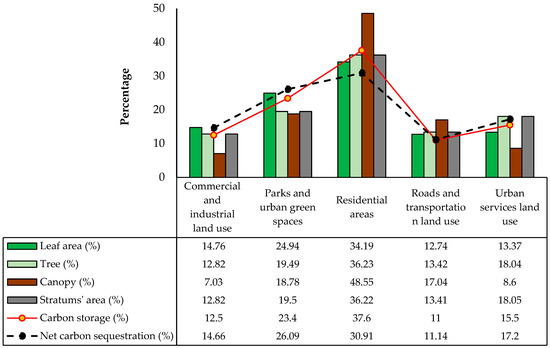
Figure 4.
Comparison of carbon storage and sequestration, along with related structural characteristics, among different land classes (all data are presented as a percentage).
Table 5 presents data on the average carbon storage and carbon sequestration per square meter of tree cover for various cities. These cities were selected due to their comparable tree cover percentages to Tehran. Carbon storage and sequestration are influenced by factors such as leaf area, tree presence percentage, age, and species diversity. Comparing Tehran to these other cities, we observe that Tehran has a moderate level of carbon storage but exhibits a high level of sequestration. Specifically, Tehran’s carbon sequestration per unit of tree canopy per year is relatively high, indicating efficient carbon absorption relative to its tree cover and density. In Tehran, carbon storage amounts to 2.29 kg per square meter of tree cover, while in other cities, this value ranges from 0.65 to 14.4 kg per square meter of tree cover (Table 5). Carbon sequestration in Tehran is 0.542 kg m−2 yr−1, compared with a range of 0.106 to 0.401 kg m−2 yr−1 in other urban areas. This high sequestration rate underscores the importance of expanding green spaces in Tehran to mitigate pollution and enhance environmental health. Future analyses should consider factors such as urban density, tree species diversity, and land use policies to better contextualize Tehran’s carbon metrics. The city’s notable carbon sequestration efficiency highlights the necessity of prioritizing green space development to address its environmental challenges.
Table 5.
The comparison of average carbon storage and carbon sequestration per square meter of tree cover by Tehran’s urban trees and those in select cities in the USA.
3.3. Management Implications
Cypress trees are widely used as ornamental trees in plantations and urban green spaces across temperate regions of the world, including arid, semiarid, Mediterranean, and humid climate regions [36,37,38,39,40]. Our findings indicate that Cupressus arizonica and Cupressus sempervirens L. var. horizontalis are highly efficient in carbon sequestration and storage compared with other species, making them ideal candidates for carbon sink projects. Moreover, C. arizonica is recommended for enhancing infiltration and groundwater recharge [35], while Cupressus sempervirens L. var. horizontalis is recommended for mitigating runoff and urban flooding [40]. Also, these species are drought-tolerant and adapted to arid environments [37,41,42].
We emphasize that evergreen trees, compared with deciduous trees, exhibit greater carbon storage and sequestration abilities, and as a result, are highly recommended for long-term carbon storage. These results support the conclusions of prior research [42,43,44]. Therefore, more attention should be given to selecting large evergreen trees for afforestation planning and urban green spaces in Tehran and similar areas. However, using only evergreen trees could lead to a monotonous landscape all year round.
3.4. Research Limitations
There are several limitations to this study that should be acknowledged. The accuracy of carbon sequestration and storage estimates is influenced by the sample size and the dimensions of the plots. Generally, collecting 200 random samples yields a 10% standard error across the whole study area [17]. Therefore, a higher number of sample plots enhances estimation precision. However, due to resource constraints and limited funding, this study employed 330 random sample plots across five land uses. Increasing the number of sample plots would yield a more accurate assessment of carbon sequestration and storage provisions, though it would also raise the time and cost associated with the field survey. Another limitation of this study is the reliance on a single year of meteorological and air quality data; ongoing, long-term data collection would provide more thorough insights into carbon assessments. Additionally, relying on the visual assessments of tree health and mortality during field measurements causes errors in the calculation of carbon storage and sequestration.
4. Conclusions
The present study offers insights into the significant role played by Tehran’s urban green spaces in offsetting carbon emissions and combating climate change. According to the latest report, CO2 emissions in Tehran are approximately 47,071 kilotons per year [22], while trees in the city sequester around 220,393 tons of CO2 per year. This means that city trees sequester about 0.46% of anthropogenic emissions annually. Given this low proportion of CO2 sequestration, it is recommended that, in addition to preserving and expanding urban green spaces, more emphasis be placed on pollution prevention approaches, such as reducing the use of fossil fuels and replacing them with renewable energy sources. Additionally, this study highlights the potential for the further enhancement of carbon sequestration through the strategic management and expansion of green infrastructure in Tehran’s urban areas. Prioritizing the planting of high-carbon-storage species like Cupressus arizonica and Cupressus sempervirens L. var. horizontalis could enhance carbon sequestration efforts in Tehran. For example, urban forestry initiatives should consider a diverse planting strategy that incorporates these high-storage species to reduce urban CO2 levels and optimize environmental benefits. Furthermore, since urban green areas sequester relatively small amounts of carbon compared with anthropogenic emissions, there is a need for additional approaches to achieve the objective of creating low-carbon cities.
Author Contributions
Conceptualization, R.R., N.M.D., H.E. and Y.R.; methodology, R.R.; software, R.R.; validation, R.R.; formal analysis, R.R.; data curation, R.R.; writing—original draft preparation, R.R.; writing—review and editing, M.V.M. and S.M.M.S.; visualization, R.R. and S.M.M.S.; supervision, N.M.D., H.E. and Y.R. All authors have read and agreed to the published version of the manuscript.
Funding
This research was partially funded by the Iranian National Science Foundation (No. 98012635).
Data Availability Statement
Data can be shared upon request.
Acknowledgments
We express our deepest gratitude to the i-Tree tools team, especially Jason Henning and Erika Teach, for their indispensable technical support. This research was generously funded in part by the Iranian National Science Foundation (Grant No. 98012635).
Conflicts of Interest
The authors declare no conflicts of interest.
References
- Zhao, Q.; Yu, P.; Mahendran, R.; Huang, W.; Gao, Y.; Yang, Z.; Ye, T.; Wen, B.; Wu, Y.; Li, S.; et al. Global climate change and human health: Pathways and possible solutions. Eco-Environ. Health 2022, 1, 53–62. [Google Scholar] [CrossRef]
- Yin, S.; Gong, Z.; Gu, L.; Deng, Y.; Niu, Y. Driving forces of the efficiency of forest carbon sequestration production: Spatial panel data from the national forest inventory in China. J. Clean. Prod. 2022, 330, 129776. [Google Scholar] [CrossRef]
- Meyers, R.A. Encyclopedia of Sustainability Science and Technology; Springer: New York, NY, USA, 2012; Volume 6. [Google Scholar]
- Wang, Y.; Chang, Q.; Li, X. Promoting sustainable carbon sequestration of plants in urban greenspace by planting design: A case study in parks of Beijing. Urban For. Urban Green. 2021, 64, 127291. [Google Scholar] [CrossRef]
- Esperon-Rodriguez, M.; Rymer, P.D.; Power, S.A.; Barton, D.N.; Cariñanos, P.; Dobbs, C.; Eleuterio, A.A.; Escobedo, F.J.; Hauer, R.; Hermy, M.; et al. Assessing climate risk to support urban forests in a changing climate. Plants People Planet 2022, 4, 201–213. [Google Scholar] [CrossRef]
- Deljouei, A.; Abdi, E.; Marcantonio, M.; Majnounian, B.; Amici, V.; Sohrabi, H. The impact of forest roads on understory plant diversity in temperate hornbeam-beech forests of Northern Iran. Environ. Monit. Assess. 2017, 189, 392. [Google Scholar] [CrossRef] [PubMed]
- Farzadkia, M.; Yavary Nia, M.; Yavari Nia, M.; Shacheri, F.; Nourali, Z.; Torkashvand, J. Reduction of the environmental and health consequences of cigarette butt recycling by removal of toxic and carcinogenic compounds from its leachate. Environ. Sci. Pollut. Res. 2024, 31, 23942–23950. [Google Scholar] [CrossRef]
- Bindajam, A.A.; Hang, H.T.; Alshayeb, M.J.; Shohan, A.A.A.; Mallick, J. Evaluating the impact of urbanization on the urban heat islands through integrated radius and non-linear regression approach. Environ. Sci. Pollut. Res. 2024, 31, 44120–44135. [Google Scholar] [CrossRef]
- Nejatian, N.; Yavary Nia, M.; Yousefyani, H.; Shacheri, F.; Yavari Nia, M. The improvement of wavelet-based multilinear regression for suspended sediment load modeling by considering the physiographic characteristics of the watershed. Water Sci. Technol. 2023, 87, 1791–1802. [Google Scholar]
- NOAA. National Centers for Environmental Information, Annual 2023 Global Climate Report. 2024. Available online: www.ncei.noaa.gov/access/monitoring/monthly-report/global/202313 (accessed on 6 March 2024).
- Schulze, E.D.; Schulze, I. Sustainable foresting: Easier said than done. Science 2010, 327, 957. [Google Scholar] [CrossRef]
- Estruch, C.; Curcoll, R.; Morguí, J.A.; Segura-Barrero, R.; Vidal, V.; Badia, A.; Villalba, G. Exploring how the heterogeneous urban landscape influences CO2 concentrations: The case study of the Metropolitan Area of Barcelona. Urban For. Urban Green. 2024, 99, 128438. [Google Scholar] [CrossRef]
- Guo, Y.; Ren, Z.; Wang, C.; Zhang, P.; Ma, Z.; Hong, S.; He, X. Spatiotemporal patterns of urban forest carbon sequestration capacity: Implications for urban CO2 emission mitigation during China’s rapid urbanization. Sci. Total Environ. 2024, 912, 168781. [Google Scholar] [CrossRef] [PubMed]
- Lisboa, M.A.N.; da Silva, L.V.A.; da Silva Nascimento, A.; de Oliveira Silva, A.; Teixeira, M.R.A.; Ferreira, M.F.R.; Ferreira, S.C.; da Silva, A.C.; Colares, A.V.; Júnior, J.T. Diversity, structure, and carbon sequestration potential of the woody flora of urban squares in the Brazilian semiarid region. Trees For. People 2024, 16, 100561. [Google Scholar] [CrossRef]
- Nowak, D.J.; Crane, D.E.; Stevens, J.C. Air pollution removal by urban trees and shrubs in the United States. Urban For. Urban Green. 2006, 4, 115–123. [Google Scholar] [CrossRef]
- Nowak, D.J.; Cumming, A.B.; Twardus, D.; Hoehn, R.E.; Oswalt, C.M.; Brandeis, T.J. Urban forests of Tennessee, 2009. In General Technical Report. SRS–149; US Department of Agriculture Forest Service, Southern Research Station: Asheville, NC, USA, 2012; Volume 149, 52p. [Google Scholar]
- Nowak, D.; Crane, D.; Stevens, J.; Hoehn, R.; Walton, J.; Bond, J. A ground-based method of assessing urban forest structure and ecosystem services. Arboric. Urban For. 2008, 34, 347–358. [Google Scholar] [CrossRef]
- Hirabayashi, S.; Endreny, T.A. Surface and Upper Weather Pre-Processor for i-Tree Eco and Hydro. 2014. Available online: https://www.itreetools.org/eco/resources/Surface_weather_and_upper_air_preprocessor_description.pdf (accessed on 10 January 2024).
- Crippa, M.; Guizzardi, D.; Banja, M.; Solazzo, E.; Muntean, M.; Schaaf, E.; Vignati, E. CO2 Emissions of All World Countries; JRC Science for Policy Report, European Commission; EUR: Brussels, Belgium, 2022; p. 31182. [Google Scholar]
- Hazrati, M.; Malakoutikhah, Z. An unclear future for Iranian energy transition in light of the Re-imposition of sanctions. Oil Gas Energy Law 2019, 17, 1875–1892. [Google Scholar]
- Motlagh, S.H.B.; Pons, O.; Hosseini, S.A. Sustainability model to assess the suitability of green roof alternatives for urban air pollution reduction applied in Tehran. Build. Environ. 2021, 194, 107683. [Google Scholar] [CrossRef]
- Shahbazi, H.; Abolmaali, A.M.; Alizadeh, H.; Salavati, H.; Zokaei, H.; Zandavi, R.; Torbatian, S.; Yazgi, D.; Hosseini, V. An emission inventory update for Tehran: The difference between air pollution and greenhouse gas source contributions. Atmos. Res. 2022, 275, 106240. [Google Scholar] [CrossRef]
- Ali-Taleshi, M.S.; Bakhtiari, A.R.; Hopke, P.K. Particulate and gaseous pollutants in Tehran, Iran during 2015-2021: Factors governing their variability. Sustain. Cities Soc. 2022, 87, 104183. [Google Scholar] [CrossRef]
- Afarideh, F.; Ramasht, M.H.; Mortyn, G. Air pollution and topography in Tehran. AUC Geogr. 2023, 58, 157–171. [Google Scholar] [CrossRef]
- Toulabi Nejad, M.T.; Ghalehteimouri, K.J.; Talkhabi, H.; Dolatshahi, Z. The relationship between atmospheric temperature inversion and urban air pollution characteristics: A case study of Tehran, Iran. Discov. Environ. 2023, 1, 17–22. [Google Scholar] [CrossRef]
- Zarghamipour, M.; Malakooti, H.; Bordbar, M.H. Spatio-temporal Analysis of the factors affecting NOx concentration during the evaluation cycle of high pollution episodes in Tehran metropolitan. Atmos. Pollut. Res. 2024, 15, 102177. [Google Scholar] [CrossRef]
- Xie, Y.; Hirabayashi, S.; Hashimoto, S.; Shibata, S.; Kang, J. Exploring the spatial pattern of urban Forest ecosystem services based on i-tree eco and spatial interpolation: A case study of Kyoto City, Japan. Environ. Manag. 2023, 72, 991–1005. [Google Scholar] [CrossRef]
- US Forest Service. i-Tree Eco User’s Manual v6.0. 2021. Available online: https://www.itreetools.org/documents/275/EcoV6_UsersManual.2021.09.22.pdf (accessed on 10 January 2024).
- Khoshnoodmotlagh, S.; Daneshi, A.; Gharari, S.; Verrelst, J.; Mirzaei, M.; Omrani, H. Urban morphology detection and it’s linking with land surface temperature: A case study for Tehran Metropolis, Iran. Sustain. Cities Soc. 2021, 74, 103228. [Google Scholar] [CrossRef]
- Parsa, V.A.; Salehi, E.; Yavari, A.R.; van Bodegom, P.M. Analyzing temporal changes in urban forest structure and the effect on air quality improvement. Sustain. Cities Soc. 2019, 48, 101548. [Google Scholar] [CrossRef]
- Nowak, D.J. Understanding i-Tree: 2021 Summary of Programs and Methods; General Technical Report NRS-200-2021; U.S. Department of Agriculture, Forest Service, Northern Research Station Madison: Madison, WI, USA, 2021. [Google Scholar]
- Chow, P.; Rolfe, G.L. Carbon and hydrogen contents of short-rotation biomass of five hardwood species. Wood Fiber Sci. 1989, 21, 30–36. [Google Scholar]
- Aba, S.C.; Ndukwe, O.O.; Amu, C.J.; Baiyeri, K.P. The role of trees and plantation agriculture in mitigating global climate change. Afr. J. Food Agric. Nutr. Dev. 2017, 17, 12691–12707. [Google Scholar]
- Sardoei, A.S.; Tahmasebi, M.; Bovand, F.; Ghorbanpour, M. Exogenously applied gibberellic acid and benzylamine modulate growth and chemical constituents of dwarf schefflera: A stepwise regression analysis. Sci. Rep. 2024, 14, 7896. [Google Scholar] [CrossRef] [PubMed]
- Nowak, D.J.; Greenfield, E.J.; Hoehn, R.E.; Lapoint, E. Carbon storage and sequestration by trees in urban and community areas of the United States. Environ. Pollut. 2013, 178, 229–236. [Google Scholar] [CrossRef]
- Kaçmaz, G.; Alkan, M.O.; Çobankaya, H.; Şen, D. Assessment of ecosystem services provided by street trees: Burdur (Türkiye) city center. Ege Üniversitesi Ziraat Fakültesi Derg. 2023, 60, 221–234. [Google Scholar] [CrossRef]
- Attarod, P.; Sadeghi, S.M.M.; Pypker, T.G.; Bagheri, H.; Bagheri, M.; Bayramzadeh, V. Needle-leaved trees impacts on rainfall interception and canopy storage capacity in an arid environment. New For. 2015, 46, 339–355. [Google Scholar] [CrossRef]
- Pourreza, M.; Moradi, F.; Khosravi, M.; Deljouei, A.; Vanderhoof, M.K. GCPs-free photogrammetry for estimating tree height and crown diameter in Arizona cypress plantation using UAV-mounted GNSS RTK. Forests 2022, 13, 1905. [Google Scholar] [CrossRef]
- Sadeghi, S.M.M.; Attarod, P.; Van Stan, J.T.; Pypker, T.G. The importance of considering rainfall partitioning in afforestation initiatives in semiarid climates: A comparison of common planted tree species in Tehran, Iran. Sci. Total Environ. 2016, 568, 845–855. [Google Scholar] [CrossRef] [PubMed]
- Panahandeh, T.; Attarod, P.; Sadeghi, S.M.M.; Bayramzadeh, V.; Tang, Q.; Liu, X. The performance of the reformulated Gash rainfall interception model in the Hyrcanian temperate forests of northern Iran. J. Hydrol. 2022, 612, 128092. [Google Scholar] [CrossRef]
- Brofas, G.; Karetsos, G.; Dimopoulos, P.; Tsagari, C. The natural environment of Cupressus sempervirens in Greece as a basis for its use in the Mediterranean region. Land Degrad. Dev. 2006, 17, 645–659. [Google Scholar] [CrossRef]
- Jazirei, M.H. Dryland Afforestation; University of Tehran: Tehran, Iran, 2009; pp. 167–345. 440p. [Google Scholar]
- Bao, Z.; Ma, J. On the design and construction of low-carbon plant landscape. Chin. Landsc. Archit. 2011, 1, 7–10. [Google Scholar]
- Weissert, L.F.; Salmond, J.A.; Schwendenmann, L. Photosynthetic CO2 uptake and carbon sequestration potential of deciduous and evergreen tree species in an urban environment. Urban Ecosyst. 2017, 20, 663–674. [Google Scholar] [CrossRef]
Disclaimer/Publisher’s Note: The statements, opinions and data contained in all publications are solely those of the individual author(s) and contributor(s) and not of MDPI and/or the editor(s). MDPI and/or the editor(s) disclaim responsibility for any injury to people or property resulting from any ideas, methods, instructions or products referred to in the content. |
© 2024 by the authors. Licensee MDPI, Basel, Switzerland. This article is an open access article distributed under the terms and conditions of the Creative Commons Attribution (CC BY) license (https://creativecommons.org/licenses/by/4.0/).