Article

Changes in Water Dynamics and Vigor of Recalcitrant Phoebe chekiangensis Seeds during Desiccation by Nuclear Magnetic Resonance and Transmission Electron Microscopy

1
College of Forestry and Grassland, College of Soil and Water Conservation, Nanjing Forestry University, Str. Longpan No.159, Nanjing 210037, China
2
Co-Innovation Center for Sustainable Forestry in Southern China, Nanjing 210037, China
3
Southern Tree Seed Inspection Center, National Forestry and Grassland Administration, Nanjing 210037, China
*
Author to whom correspondence should be addressed.
Forests 2024, 15(9), 1508; https://doi.org/10.3390/f15091508
Submission received: 18 July 2024 / Revised: 21 August 2024 / Accepted: 26 August 2024 / Published: 28 August 2024
(This article belongs to the Section Forest Ecophysiology and Biology)

Abstract

:
The vigor of recalcitrant seeds is closely related to seed moisture. Real-time, non-destructive monitoring of changes in water distribution and status during the seed desiccation, utilizing nuclear magnetic resonance (NMR) technology, is crucial for preserving the high vigor of these seeds. In this study, we investigated the changes in the vigor of Phoebe chekiangensis seeds during natural desiccation, focusing on seed germination, seed size, and ultrastructural changes, while also exploring seed moisture dynamics with NMR. Our results indicated that the moisture content of fresh, undehydrated P. chekiangensis seeds was 37.06%. As the seeds dried to 25.09% moisture content, their germination ability decreased by approximately 88%. Magnetic resonance images (MRIs) revealed that the internal water of fresh P. chekiangensis seeds was primarily concentrated in the embryonic axis and the middle of the cotyledons. During desiccation, water loss occurred from the exterior to the interior of the embryonic axis, and from the periphery to the center of the cotyledons. Low-field NMR results demonstrated that fresh, undehydrated seeds contained the highest proportion of free water at 55.47%, followed by immobile water at 37.88% and bound water at 4.36%. As drying progressed, the proportion of free water decreased significantly, while immobile water initially decreased and then increased markedly, and the proportion of bound water also rose. Combined with transmission electron microscopy results, we observed that when the seeds were dried to 28.11% moisture content or lower, the cells in the cotyledons and embryonic axis began to shrink due to free water loss, resulting in plasmic wall separation and a subsequent loss of seed vigor. Correlation analysis further revealed a highly significant relationship between the decrease in germination and the loss of free water of P. chekiangensis seeds.

1. Introduction

In recent years, numerous seed banking initiatives have emerged in response to the rapid loss of plant diversity [1]. These repositories provide essential germplasm resources needed to maintain and manage natural variation within and among species [2]. However, the long-term preservation of germplasm resources under seed bank storage conditions poses significant challenges due to the recalcitrance of certain plant species [3]. Currently, germplasm conservation primarily occurs in the form of seeds [4]. For example, 5% to 10% of angiosperms produce recalcitrant seeds that cannot survive dry conditions and die in the freezer due to ice crystal formation [3].
Unlike orthodox seeds, recalcitrant seeds are typically short-lived under natural conditions and rely on water for their survival [3,5]. Water serves as the medium for seed physiological metabolism, making water status crucial for biological activities [6]. In seeds, water generally exists in two forms: free water and bound water [4]. Bound water has been reported to play a vital role in the resistance of organisms to dehydration stress [7,8,9,10]. An increased amount of free water may facilitate solute accumulation, thereby enhancing osmoregulation, improving tolerance to water stress, and maintaining the volume of subcellular compartments [11,12,13]. The migration of free water has a minimal impact on material structure, whereas the migration of loosely bound water can result in cell shrinkage, pore formation, and cell collapse [14]. The relationship between cellular water organization and desiccation tolerance remains unresolved to this day [15].
During the drying process, various protective mechanisms operate simultaneously to maintain the physiological quality of seeds [16]. Ultrastructural analysis is a reliable method for evaluating these protective mechanisms, as it can visually reveal damage resulting from the absence of such mechanisms during drying, as well as the effects of the mechanisms themselves [17]. The integrity of the cell membrane is regarded as the primary protective mechanism for maintaining the physiological quality of seeds during drying, as it directly influences cellular metabolic functions [17]. Seyedin et al. [18] reported that drying at elevated temperatures leads to membrane damage and reduced germination rates, as evidenced by increased leakage of electrolytes and sugars following exposure to 50 °C. Similarly, Siddique and Wright [19] concluded that excessively high drying temperatures result in membrane damage that contributes to germination losses. Additionally, Quercus acutissima seeds became smaller during water loss [20].
Over the past two decades, nuclear magnetic resonance techniques have gained increasing prominence in plant science research [21,22,23,24,25,26,27,28]. Low-field nuclear magnetic resonance (LF-NMR) and magnetic resonance imaging (MRI) provide excellent opportunities for the non-invasive detection and quantitative visualization of water status and distribution within plant tissues [29,30,31,32]. NMR captures the moisture phase and migration in a sample by measuring the density and distribution of hydrogen protons, thereby revealing patterns of moisture change at the microscopic level [32]. Based on the assumption that the liquid present in wood is solely water, the amplitude of the NMR free induction decay (FID) signal is linearly related to the mass of water contained in the wood sample [33]. The NMR image contrasts with the spin density, reflecting the spatial distribution of protons (1H nuclei most often used) within the image [30]. Hu et al. [32] investigated the conversion of different moisture-binding types in single Hebei wheat kernels during isothermal drying at 60 °C using LF-NMR and studied moisture migration through MRI. Three water fractions were reported within broccoli, and MRI analysis showed that the water distribution within broccoli is heterogeneous [34]. Song et al. [29] found that the degree of freedom of free water inside poor vigor rice seed samples was diminished. However, to date, relatively few studies have focused on the moisture distribution and status of seeds during drying.
In this study, we used NMR and transmission electron microscopy (TEM) to analyze the water status and migration in P. chekiangensis seeds, as well as changes in seed vigor during desiccation. The objectives were (1) to elucidate the relationship between moisture content and seed germination in P. chekiangensis; (2) to examine the ultrastructural deterioration of seeds through TEM during desiccation; (3) to analyze seed moisture status and distribution during desiccation in P. chekiangensis, as well as to reveal the relationship between this information and changes in seed vigor.

2. Materials and Methods

2.1. Experimental Materials and Treatments

In mid-November 2022, mature fruits of Phoebe chekiangensis were collected in Jiaguan Town, Qionglai City, Sichuan Province, China (31°17′31″ N, 103°13′45″ E), and immediately placed in boxes with ice packs for transport back to the laboratory. Upon arrival, the peel was removed, and cracked or broken seeds were eliminated through water selection. Subsequently, the surface moisture of the seed coat was shade-dried, and seeds of uniform size were selected for the natural drying test. The initial moisture content of P. chekiangensis seeds was determined using the oven-drying method at 103 °C for 17 h [20,35].
For the desiccation experiment, seeds that were uniform in size and fullness were selected and spread evenly in a circular frame on a shelf in the room for natural drying (temperature range: 15–21 °C, relative humidity range: 30–53%). Additionally, three square porcelain plates were placed on the shelf, each containing approximately 250 g of fresh seeds, and the actual weight of the seeds on these plates was recorded. The seed moisture during the drying process was calculated using the weighing method, as outlined in Formula (1) [36].
The calculation formula of the moisture content is as follows [36]:
R = M 2 M 1 × 1 A M 2 × 100 %
where: R is the seed moisture content, %; M1 is the mass of the undried seed, g; M2 is the mass of the dried seed, g; A is the initial moisture content of the undried seed, %.
Seed samples were collected at moisture contents of 37.06% ± 0.004, 33.99% ± 0.14, 30.63% ± 0.34, 28.11% ± 0.48, 25.09% ± 0.54, 22.04% ± 0.58, 19.08% ± 0.60, and 16.04% ± 0.68. Fresh undried seeds served as the control group. A thermo-hygrometer was positioned on the shelf to monitor the daily temperature and humidity throughout the desiccation period.

2.2. Seed Standard Germination Test and Seed Size Calculation

During seed desiccation, 400 intact seeds (four replicates of 100 seeds each) from each desiccation treatment, including the control, were randomly selected for germination tests. As P. chekiangensis seeds are dormant [37,38], seeds from all desiccation treatments underwent 60 days of variable temperature stratification (15 °C for 16 h and 25 °C for 8 h, without light) to break dormancy. The germination test was conducted following the release of dormancy. After stratification, the seeds were taken out, washed, and then incubated in a constant temperature incubator at 30 °C. Germination was observed and recorded daily, with seeds considered germinated when the length of the radicle equaled the length of the seed. The germination experiment concluded on the 30th day, and the seed germination percentage was counted. The mean germination time (MGT) of the seeds was determined according to Lozano-Isla et al. [39].
For each treatment, including control, 300 seeds (three replicates of 100 seeds each) were randomly selected, and the transverse diameter, longitudinal diameter, and thickness of these seeds were measured using vernier calipers.

2.3. Observations on the Ultrastructure of Seeds

The seed drying treatments were 37.06% ± 0.004, 30.63% ± 0.34, 28.11% ± 0.48, 25.09% ± 0.54, and 16.04% ± 0.68 MC. Five seeds were randomly selected from each drying treatment, and each seed was sampled for both embryo axis and cotyledon parts. The cotyledon part of each seed was cut into a small cube of 1–2 mm at 1 mm directly below the embryo axis. Given the small size of the embryonic axis, the entire embryonic axis portion of each seed (as illustrated in Figure 1B with a red circle) was used as a sample tissue.
Referring to the method of Hari et al. [40], the seed samples subjected to different drying treatments were taken and immediately fixed in a 4% glutaraldehyde solution (vol/vol). After four hours of fixation, the samples were washed three times with sodium phosphate buffer (100 mM, pH 7.2), for 20 min each time. Subsequently, the seed samples were fixed with 2% (wt/vol) osmium tetroxide to complete blackness and washed with the sodium phosphate buffer again 3 times. The samples were dehydrated in stages with 30%, 50%, 70%, 90%, and 100% concentrations (vol/vol) of acetone, twice with 100% (vol/vol) acetone, for 30 min per stage, then infiltrated with SPI-PON 812 epoxy resin (SPI Chem, SPI Co., West Chester, PA, USA) and polymerized sequentially for 24 h at 37 °C, 45 °C and 65 °C, respectively. Ultra-thin sections (50–70 nm thickness) of the embedded tissues were made using an ultra-thin slicer (POWER TOME XL, RMC, Boeckeler Instruments, Inc., USA), and the sections were stained with uranium lead. The observation was performed using a JEOL JEM-1400 transmission electron microscope (Japan Electronics Co., Tokyo, Japan).

2.4. Changes in Moisture Distribution during Seed Desiccation

2.4.1. Changes in Moisture Distribution

A 7.0 T MRI scanner (Pharma Scan, BioSpin GmbH, Bruker Co., Billerica, MA, USA) was utilized to monitor the spatial distribution of moisture during the desiccation of P. chekiangensis seeds. Three seeds with intact appearance and uniform size were selected for natural drying, and MRI scans were performed when the moisture content of the seeds was 37.06% ± 0.004, 33.99% ± 0.14, 30.63% ± 0.34, 28.11% ± 0.48, and 25.09% ± 0.54. Images were acquired in two planes (sagittal and coronal; see Figure 1E,F). Anatomical images were captured using a turbo-rapid acquisition relaxation enhancement (RARE) PD-weighted sequence (repetition time (TR)/echo time (TE) = 2000/10 ms, slices = 8, field of view (FOV) = 2.8 × 2.8 cm2, number of averages = 15, matrix = 256 × 256, slice thickness/gap = 1/0 mm, flip angle = 180°), the scanning time was 24 min, and the pixel resolution was 109 μm. The spatial distribution of moisture in the seeds was visualized using false colors, with a relative scale ranging from zero (blue) to maximum (red) [41].

2.4.2. Calculation of Signal-to-Noise Ratio for Measurement Region of Interest of Seeds

The MRI scanner was used to obtain proton density-weighted images of seeds subjected to five different desiccation treatments. For each treatment, two planes were scanned for each seed. Five measurement regions of interest were selected for each plane in a seed (Figure 1E,F the red boxes). The image signal (S) of the region of interest was subsequently obtained, while the image noise was determined from the proton density-weighted images of the seeds. Finally, the signal-to-noise ratio (SNR) was calculated using Formula (2) [20]:
s i g n a l - t o - n o i s e   r a t i o = S i m a g e   n o i s e

2.5. Changes in Seed Moisture Status and Content during Desiccation

2.5.1. Changes in Seed Moisture Status and Content

Forty-five seeds of P. chekiangensis (three replicates of 15 seeds each), characterized by their intact appearance and uniform size, were selected for natural desiccation. Sampling occurred at moisture contents of 37.06% ± 0.004, 33.99% ± 0.14, 30.63% ± 0.34, 28.11% ± 0.48, 25.09% ± 0.54, 22.04% ± 0.58, 19.08% ± 0.60, and 16.04% ± 0.68. After sampling, each set of 15 seeds was wrapped in cling film and placed in glass test tubes, and then placed in a low-field NMR analyzer (MesoMR23-060H-I, 0.5T; Suzhou Niumei Instrument Co., Ltd., Suzhou, China) for detection. The T2 inversion spectrum was obtained by using Carr–Purcell–Meiboom–Gill (CPMG) pulse sequence determination and SIRT (joint iterative reconstruction technique) algorithm inversion operation. During the measurement, the temperature of the LF-NMR instrument was maintained at 32 °C. The radio frequency (RF) pulse frequency of the NMR spectrometer was set at 12.2 MHz, and the diameter of the probe coil was 25 mm. The main parameters of the CPMG pulse sequence were as follows: SF = 21 MHz, O1 = 214,200.80 Hz, P1 = 6 μs, P2 = 11 μs, TD = 240,018, TW = 2000 ms, NS = 16, TE = 0.1 ms, NECH = 12,000, and SW = 200 kHz.

2.5.2. Establishment of NMR Detection Method for Seed Moisture

The total peak area (total amplitude) of the T2 inversion spectrum is proportional to the number of hydrogen atoms in the seed sample, which is mainly from water molecules [20,42]. The moisture content of P. chekiangensis seeds can be determined by summing the peak areas (total amplitude) of the T2 inversion spectrum. Based on the moisture quality inside the seeds and the corresponding total amplitude of the NMR signal at different drying stages, the regression equation between the seed moisture quality and the total signal amplitude was obtained by regression analysis.

2.6. Statistical Analysis

The determined indicators were analyzed using one-way ANOVA, and Tukey’s multiple comparisons were employed to identify significant differences between the drying treatments (p < 0.05). The data were statistically analyzed and visualized with SPSS 22 and Origin 21. MRIs were examined using Bruker Para Vision 5.1 software (Bruker, Berlin, Germany), and pseudo-color maps were processed with ImageJ (Rawak Software Inc., Stuttgart, Germany). Pearson correlation analysis was conducted on the determined indicators, and regression analysis was performed to evaluate the relationship between the internal moisture quality of the seeds and the total amplitude of the NMR.

3. Results

3.1. Changes in Germination Percentage and Seed Size during Desiccation

The initial moisture content of P. chekiangensis seeds was 37.06%. The seed moisture content decreased with the duration of seed desiccation (Figure 2A). Additionally, we observed that the percentage of seed germination declined as the seed moisture content decreased (Figure 2A). At 30.63% seed moisture content, seed germination began to decrease significantly, showing a reduction of 20.66% compared to the control. At 28.11% moisture content, the germination percentage decreased by 59.96%. When the seeds were dried to 25.09% MC, the germination percentage dropped to 11.33%, representing a reduction of approximately 88%. As the seeds lose moisture, the mean germination time becomes longer (Figure 2B). At a moisture content of 16.04%, the seed germination percentage is approximately 0. At this point, calculating the mean germination time is not meaningful; therefore, this treatment of 16.04% MC is not included in Figure 2B.
The transverse diameter, longitudinal diameter, and thickness of P. chekiangensis seeds decreased as seed moisture content diminished (Table 1). At 30.63% of seed moisture content, the transverse diameter and thickness of the seeds were significantly reduced by 2.64% and 3.32%, respectively. At 25.09% of MC, the dimensions of the seeds were significantly smaller compared to the control, where the transverse diameter, longitudinal diameter, and thickness were reduced by 3.32%, 1.75%, and 3.95%, respectively.

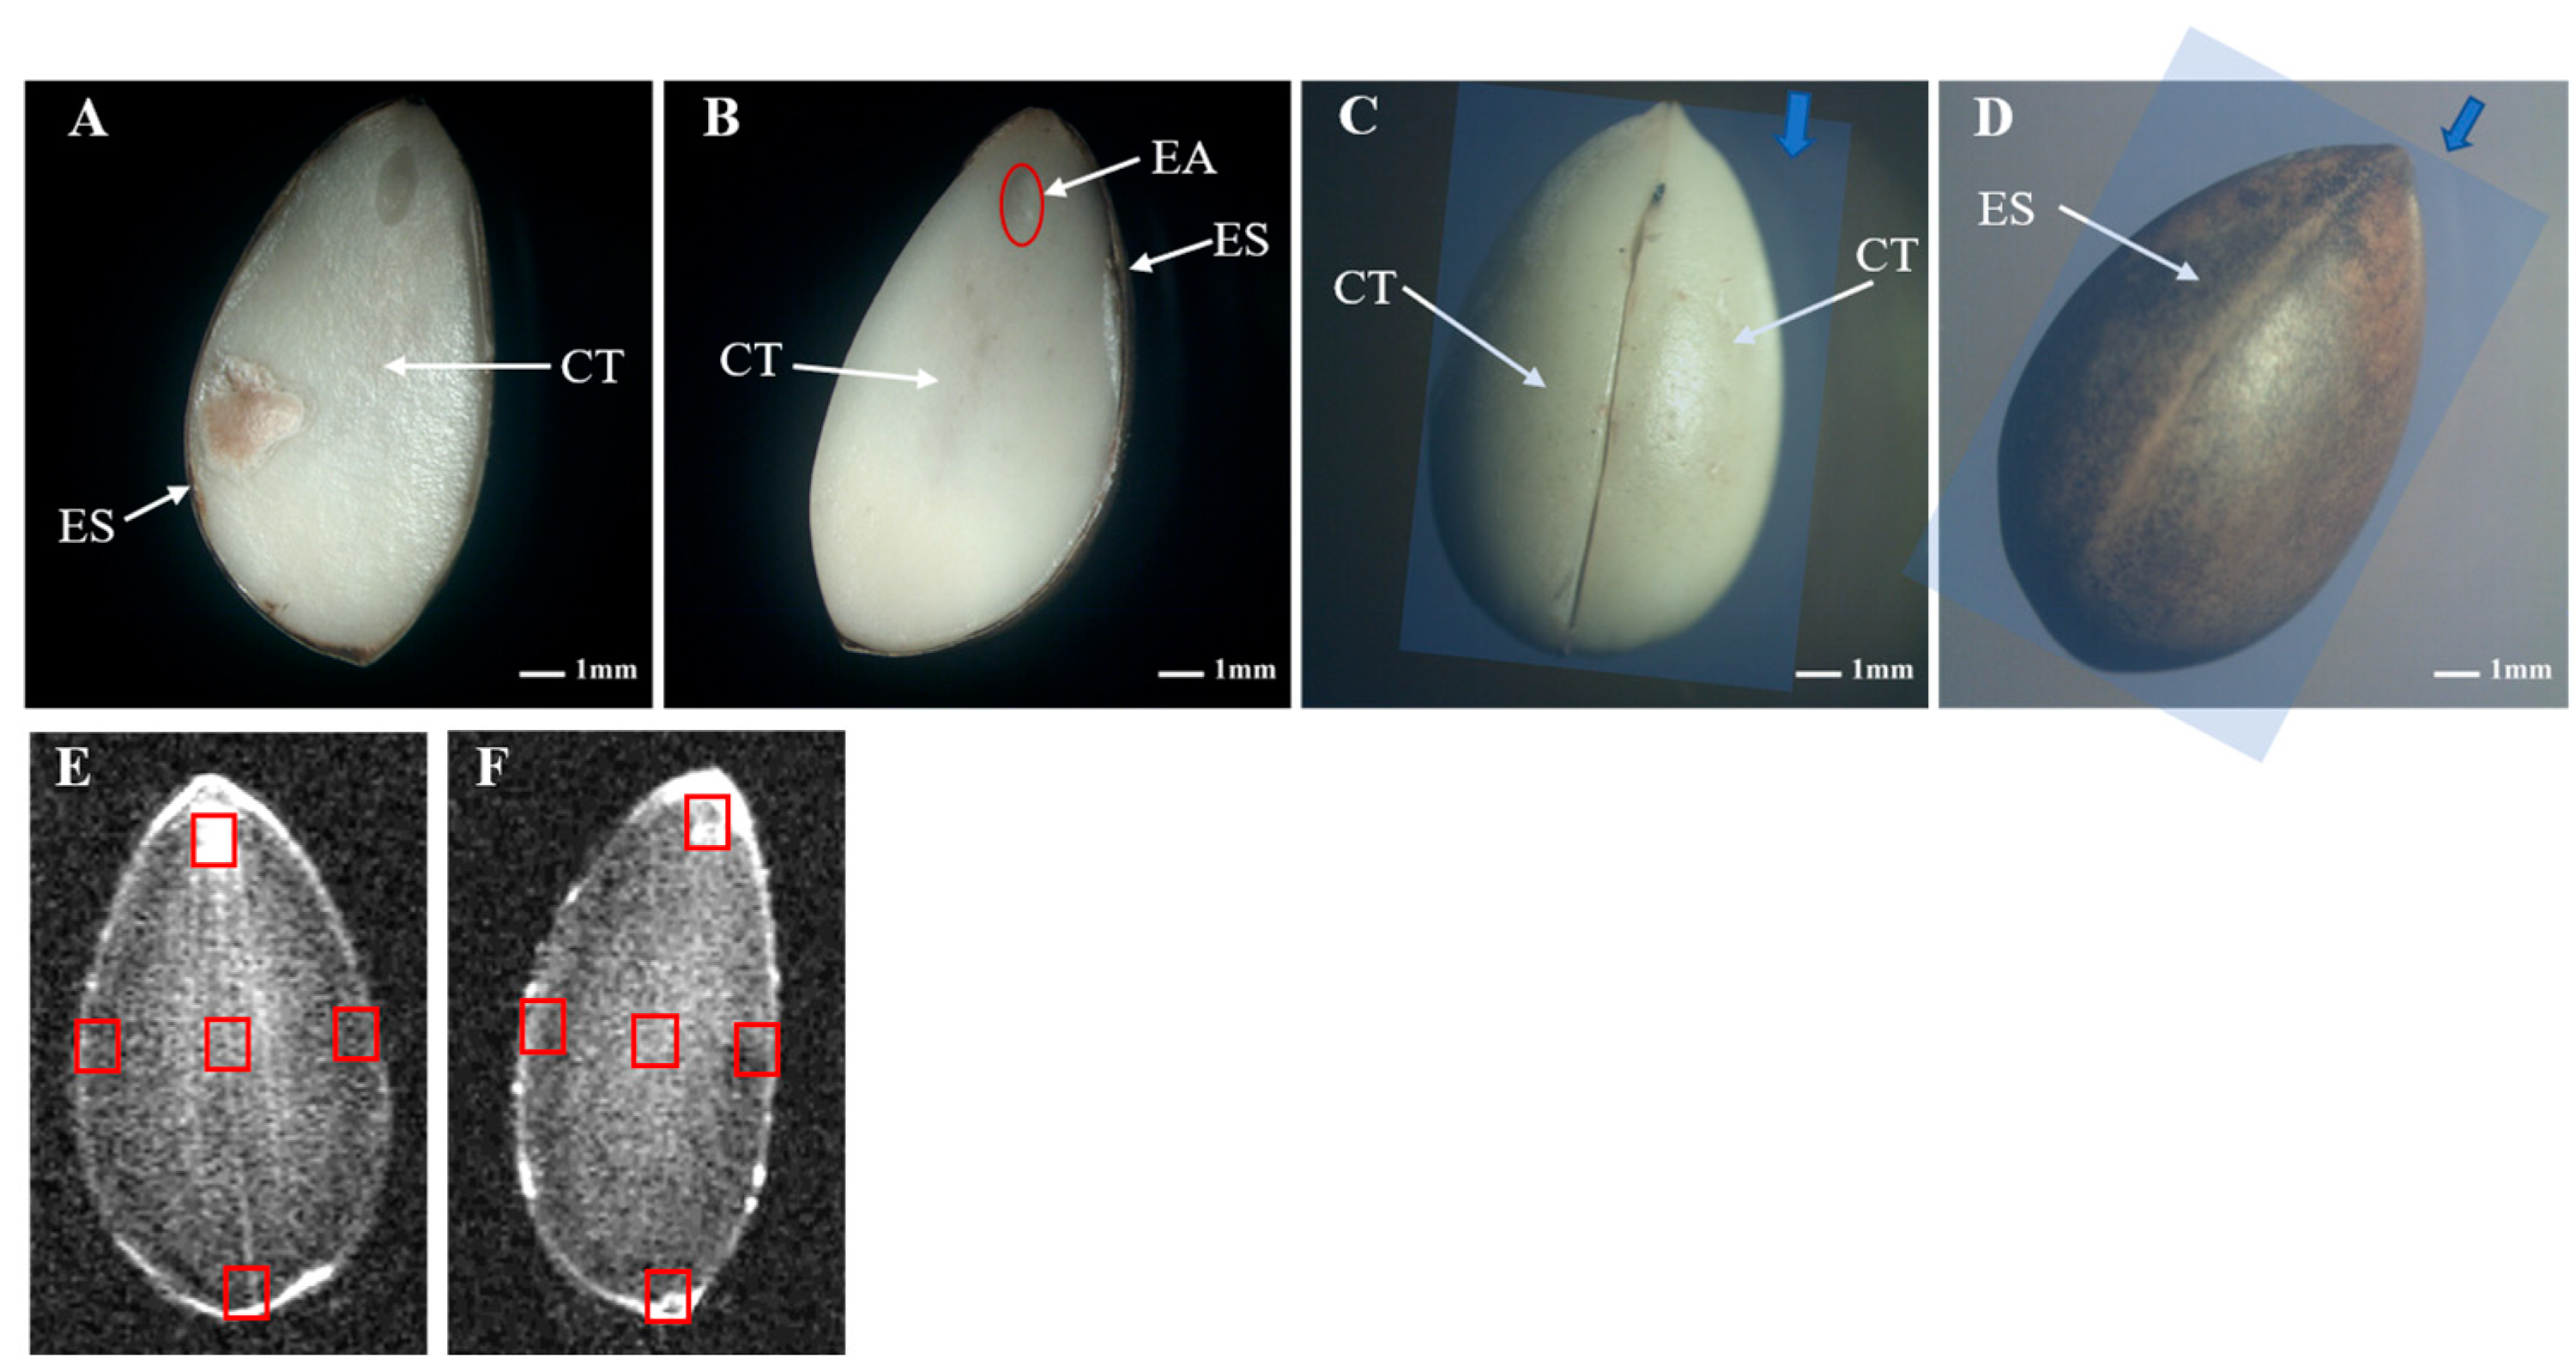
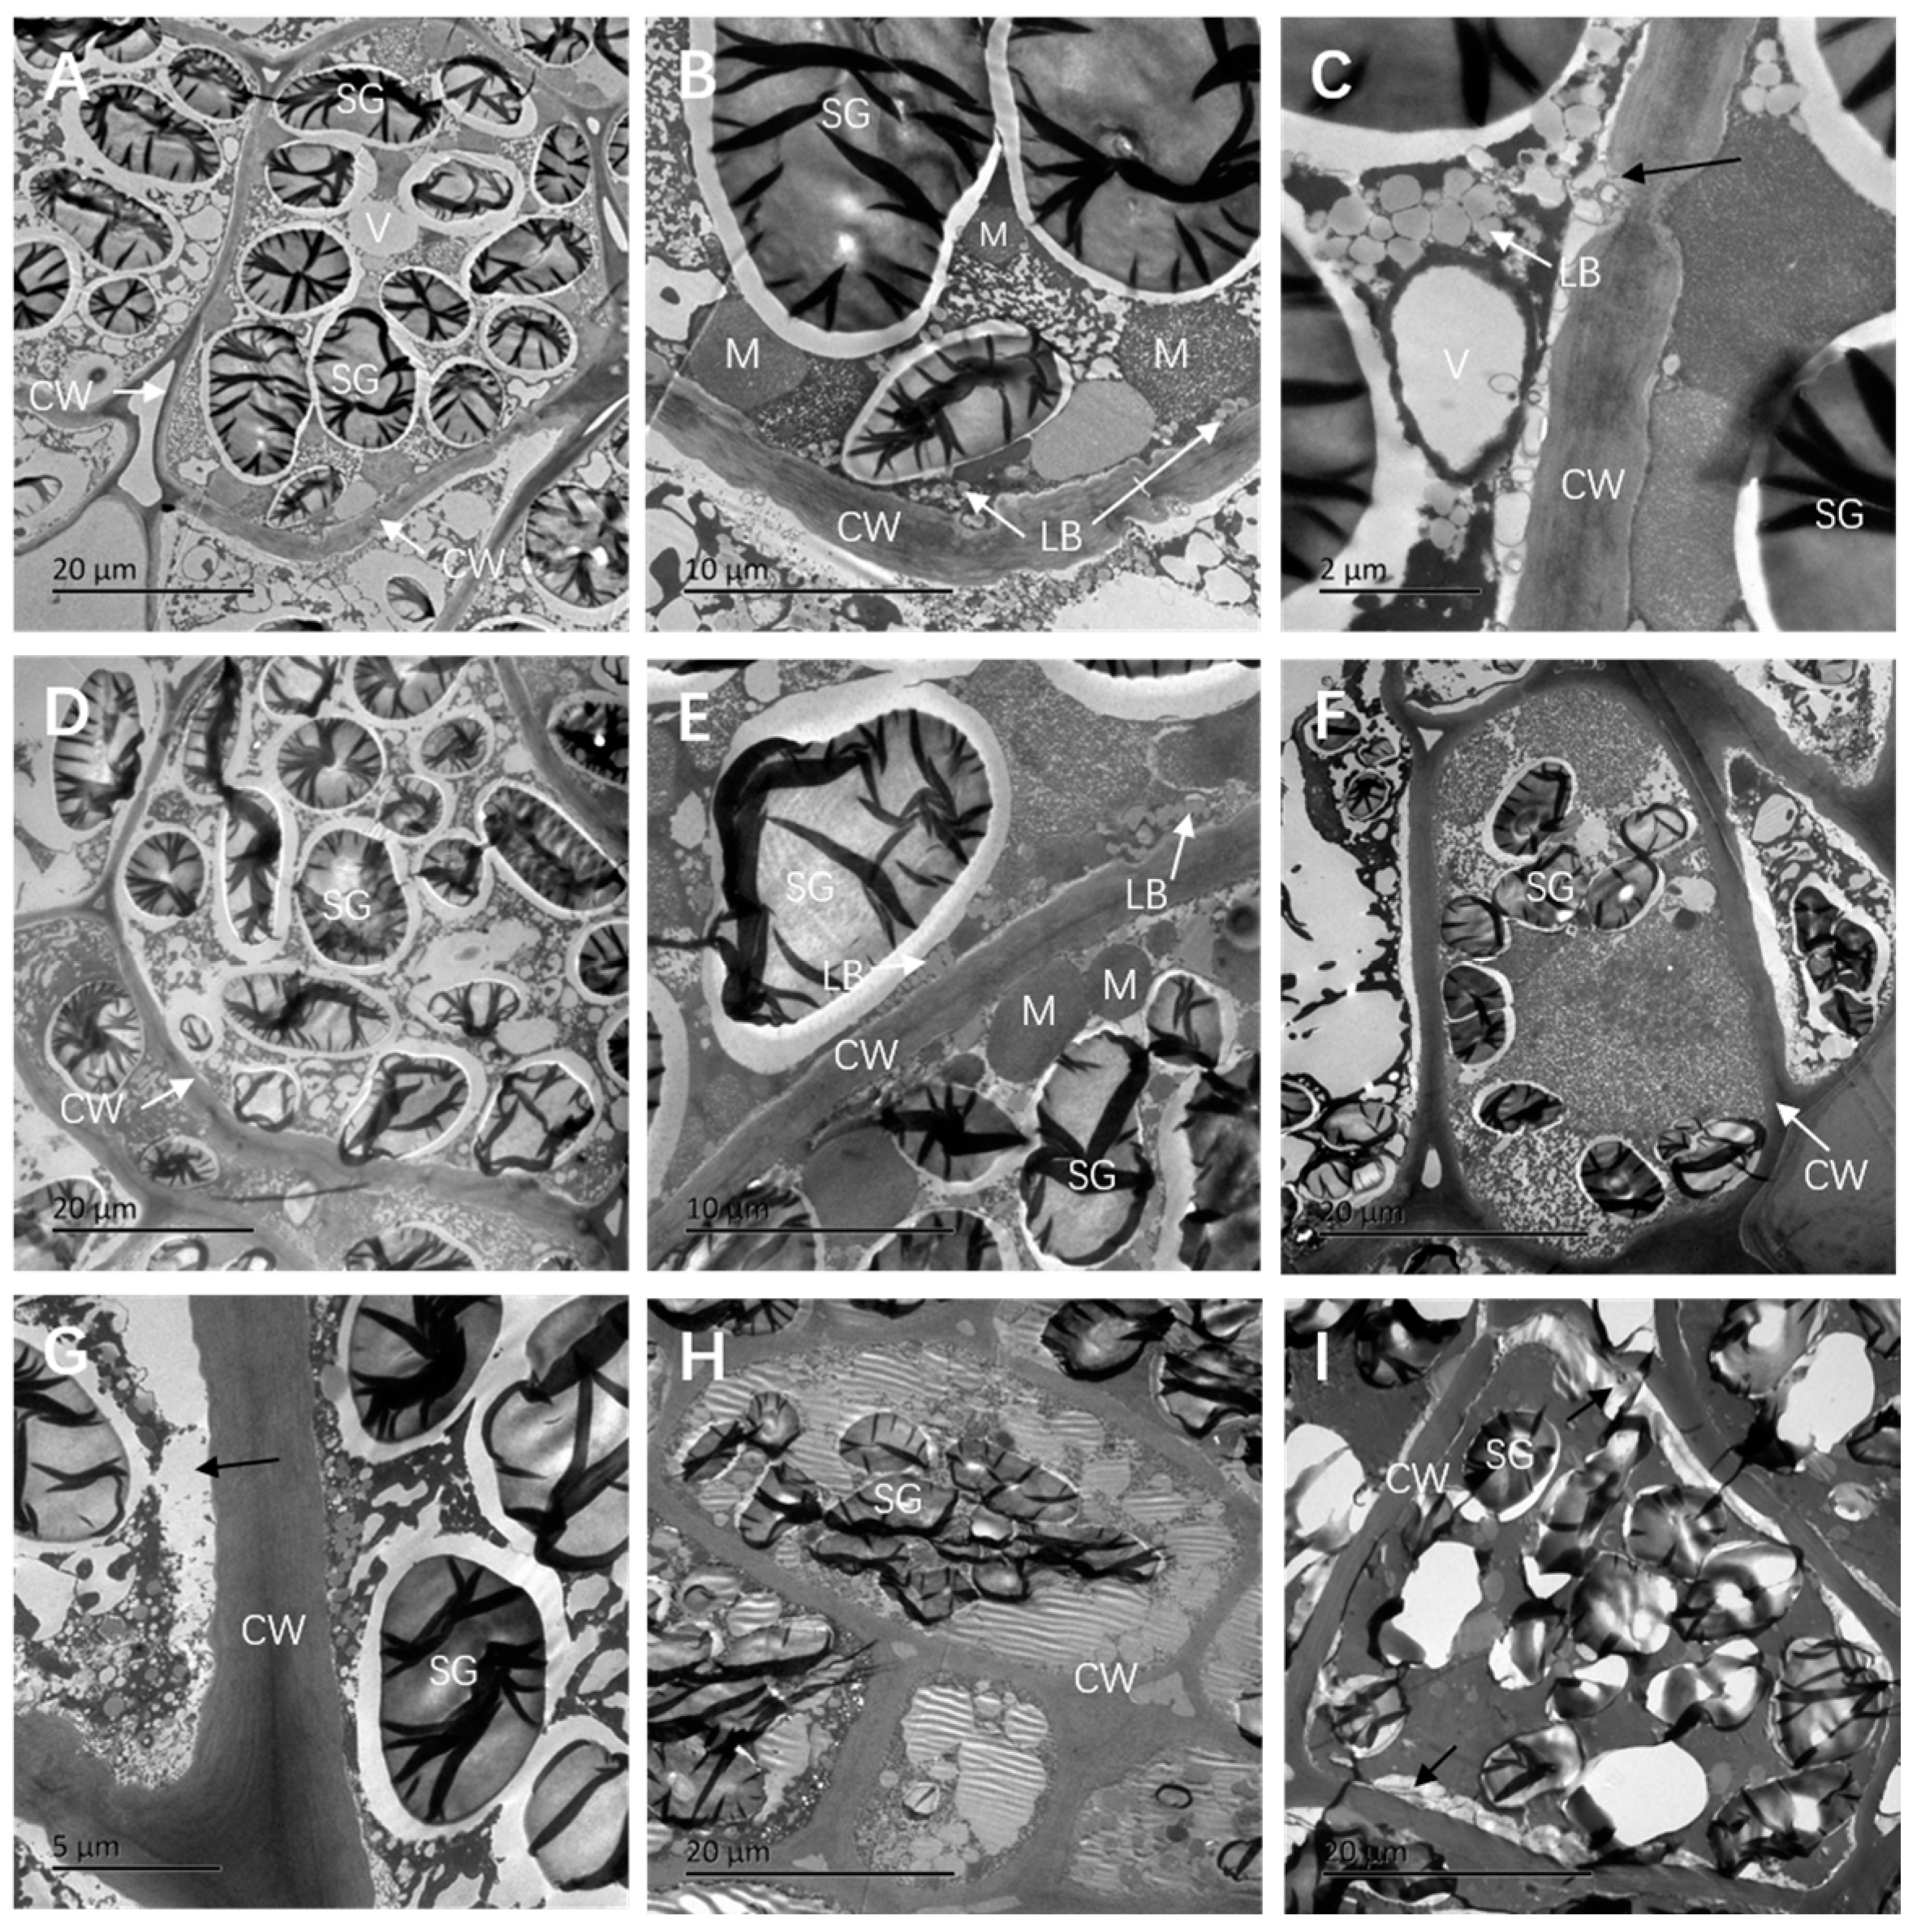
3.2. Changes in the Ultrastructure of Seed Embryos

Ultrastructure of Cotyledons: The cotyledon cells of fresh, undehydrated P. chekiangensis seeds are full, with regular and flat cell wall edges and clear outlines. Starch grains constitute the majority of the cell volume, accompanied by fewer vacuoles and a small number of mitochondria. Notably, lipid bodies are aggregated near the plasma membrane, which appears electron translucent, suggesting that the uptake of storage reserves is likely a result of active metabolism (Figure 3B,C). We also observed substance exchange between cotyledon cells (Figure 3C black arrow), further indicating that these cells exhibit signs of active metabolism. Upon drying the seeds to a moisture content of 30.63%, numerous small vacuoles emerged within the cotyledon cells (Figure 3D), potentially reflecting the response of P. chekiangensis seeds to desiccation stress. At this stage, the cell wall maintained a complete and clear outline. As the moisture content decreased to 28.11%, the organelles began to degrade, and starch grains started to disintegrate (Figure 3F), while cotyledon cells exhibited plasmic wall separation (Figure 3G, black arrow). When the moisture content reached 16.09%, plasmic wall separation in the cotyledon cells became more pronounced, leading to the complete degradation and fusion of organelles and cytoplasm, resulting in a disordered cell structure (Figure 3I).
Ultrastructure of the Embryonic Axis: We observed that the cells of the embryonic axis were smaller in size compared to the cotyledon cells. The embryonic axis cells displayed fullness and distinct cell wall boundaries, with a greater presence of large vacuoles (Figure 4A). Mitochondria exhibited an electron-transparent matrix, narrow cristae, and a well-defined membrane structure (Figure 4B). These observations indicate that the physiological functions of the embryonic axis cells remained intact. At a seed moisture content of 30.63%, dense heterochromatin plaques were noted in the nucleoplasm of the nucleus (Figure 4C). Additionally, well-developed endoplasmic reticulum and mitochondria were observed within the cell matrix, with an increase in mitochondria presence (Figure 4D). When dried to 28.11%, starch grains began to degrade, and the nuclear membrane showed signs of rupture (Figure 4E). When the moisture content of the seeds was 25.09% or lower, the embryonic axis cells exhibited significant plasmic wall separation, severe folding and deformation of the cell wall, and destruction of cellular structure (Figure 4F,G).

3.3. MRI Analysis

Fresh, undehydrated seeds exhibit the most substantial size, characterized by the largest red areas and highest water content (Figure 5A–E,a–e). As the seeds lose water, they decrease in size. Our findings indicate that the internal moisture of P. chekiangensis seeds is predominantly concentrated in the embryonic axis and the central region of the cotyledons (Figure 5A–E,a–e). When the seeds were dried to 33.99% MC, a reduction in moisture was first observed at the ends of the cotyledons (near the chalaza) and outermost circle, while the moisture-rich regions of the embryonic axis remained prominent (Figure 5B,b). Upon reaching a moisture level of 30.63%, there is a significant decrease in moisture in the central part of the cotyledons, and moisture in the outermost region of the embryonic axis begins to diminish as well (Figure 5C,c). With further drying, the moisture content in the embryonic axis gradually decreases, accompanied by a continued reduction in the middle part of the cotyledons (Figure 5D,E,d,e). In summary, the primary moisture storage sites in P. chekiangensis seeds are the embryonic axis and the central region of the cotyledons. The process of seed water loss occurs from the exterior to the interior of the embryonic axis, starting from the periphery to the middle of the cotyledons.
The signal-to-noise ratio (SNR) is crucial for digitizing MRI results, with a higher SNR indicating a stronger 1H signal intensity in a given region, which suggests a higher moisture content [20]. Our analysis revealed a variation in the ratio of SNR between the coronal and sagittal planes. In the coronal plane, the embryonic axis measurement area (R1) of fresh seeds exhibited the highest ratio of SNR at 6.38, followed by the cotyledon center measurement area (R2) at 3.53 and the cotyledon end measurement area (R3) at 2.72. The cotyledon peripheral measurement areas (R5 and R8) displayed the lowest SNR ratios of 2.40 and 2.26, respectively (Figure 5F). In the sagittal plane, the embryonic axis measurement area of fresh seeds (SR1) recorded the highest ratio of SNR of 7.04, followed by the cotyledon end and cotyledon center measurement areas (SR3 and SR2) at 3.79 and 3.67, respectively, while the cotyledon peripheral measurement areas (SR8 and SR5) showed SNR ratios of 2.81 and 2.71, respectively (Figure 5G). Overall, the ratio of SNR for each measurement area of the seed demonstrated a gradual decrease during desiccation. Notably, the SNR of the embryonic axis of the seed remained higher than that of the other seed regions throughout the water loss process.

3.4. Changes in T2 Inversion Spectrum during Seed Desiccation

We analyzed the NMR T2 inversion spectra of the seeds of P. chekiangensis subjected to various desiccation treatments. The results indicated that the T2 relaxation times were primarily distributed within a range of 0–1000 ms (Figure S1). The T2 inversion spectra (Figure S1) of all test subjects exhibited three main peaks corresponding to bound water (T21: 0–1 ms), immobile water (T22: 1–3 ms), and free water (T23: 3–100 ms), along with a secondary peak to the right of free water (T24: 100–1000 ms) [20,43]. This secondary peak represents water with a higher degree of freedom than free water; however, the proportion of the peak area occupied by the secondary peak is minimal, approaching zero, and can, therefore, be disregarded. Consequently, the primary focus of our analysis is on the three main water phases: bound water, immobile water, and free water. Bound water (T21) forms hydrogen bonds primarily with macromolecules within the cell and exhibits limited mobility [44]. Immobile water (T22) is predominantly restricted intercellular water, though it is slightly more mobile than bound water. Free water (T23) flows freely within the cell and serves as an effective solvent, actively participating in the metabolism of cellular substances [21].
During desiccation, both the relaxation range and peak time shifted due to alterations in the degree of freedom of water. Notably, the peak time of bound water increased significantly by 66.67% at the late stage of dehydration (19.08% of MC), varying between 0.07 and 0.15 ms throughout the dehydration period (Table 2). The relaxation range exhibited an overall increasing trend, and when dried to 19.08%, it increased by 143% compared to the control.
During the desiccation period, the peak time of immobile water exhibited an increasing trend followed by a decrease (Table 2). When the moisture content was reduced to 25.09%, the peak time increased by 34.78% compared to the control. Conversely, when dried to 16.04%, the peak time decreased by 13.66%. However, there was no significant difference in the peak time (p > 0.05). The relaxation range demonstrated an overall increasing trend, with a notable increase of approximately 16-fold when dried to 25.09%.
The peak time of free water increased during the drying process (Table 2). When the moisture content was reduced to 25.09%, the peak time increased significantly, approximately 9-fold (p < 0.05). However, no significant difference was observed in the relaxation range (p > 0.05).
During the desiccation period, the peak time of the secondary peak exhibited a decreasing trend (Table 2). When the moisture content was reduced to 28.11%, the peak time significantly decreased by 55.14% (p < 0.05). Overall, the relaxation range also demonstrated a decreasing trend, with a reduction of 47.92% when dried to 19.08%.

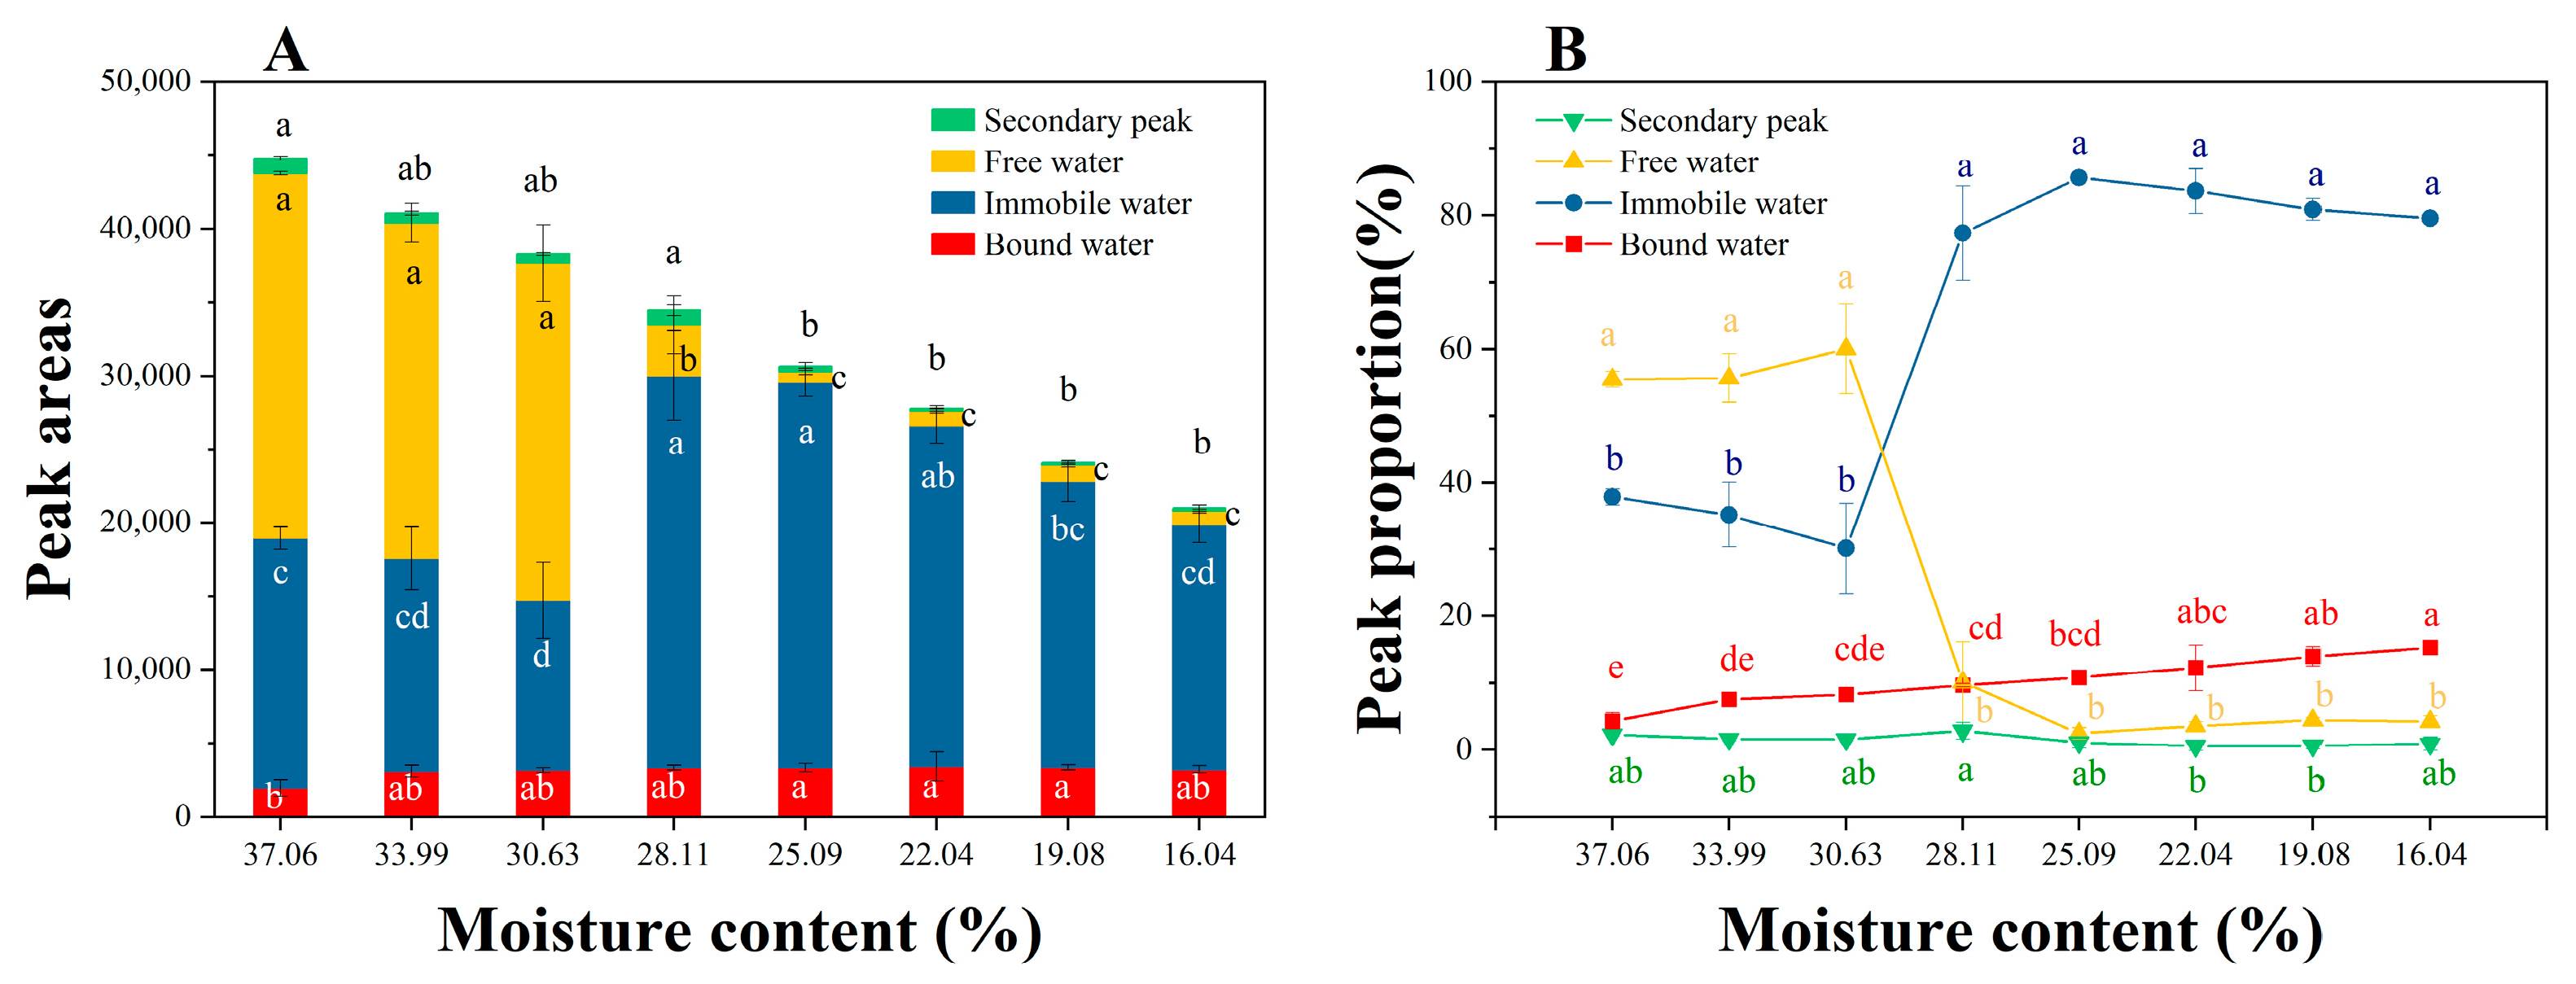
3.5. Dynamic Changes in Peak Area and Its Proportion

Figure 6 illustrates the dynamics of the peak areas and peak area proportions of the various water states during the water loss process of P. chekiangensis seeds. The peak areas corresponding to T21, T22, T23, and T24 are denoted as A21, A22, A23, and A24, respectively, with A representing the total peak area (A = A21 + A22 + A23 + A24). The peak area proportions for T21, T22, T23, and T24 are indicated as P21, P22, P23, and P24, where the sum of these proportions equals 100% (P21 + P22 + P23 + P24 = 100%).
A significant linear relationship was observed between the moisture content and the peak area of P. chekiangensis seeds (Figure S2). Consequently, peak areas A21, A22, and A23 can be utilized to quantify the relative contents of bound water, immobile water, and free water in the seeds [20]. In fresh seeds, the content of bound water, immobile water, and free water accounted for 4.36%, 37.88%, and 55.47% of the total water content, respectively, with free water being the predominant component (Figure 6A,B). During the drying process, the free water content of the seeds exhibited a decreasing trend, while the immobile water content displayed a decreasing trend followed by an increase, and the bound water content also increased (Figure 6A). When dried to 28.11% MC, the peak area of free water was significantly decreased by approximately 21398, in contrast to the peak area of immobile water, which significantly increased by about 9725, and bound water, which also increased by approximately 1372. When dried to 25.09% MC, the free water content decreased by about 97%.

3.6. Correlation Analysis

Seed moisture content exhibited a highly significant positive correlation with the peak area of free water (r = 0.88, p < 0.01) and the total peak area (r = 0.97, p < 0.01) (Figure 7). Conversely, it displayed a highly significant negative correlation with the peak area of bound water (r = −0.71, p < 0.01) and immobile water (r = −0.65, p < 0.01). Additionally, the seed germination percentage was found to be highly significantly and positively correlated with the peak area of free water (r = 0.94, p < 0.01) and total peak area (r = 0.95, p < 0.01). In contrast, it was highly significantly and negatively correlated with the peak area of immobile water (r = −0.79, p < 0.01) and significantly and negatively correlated with the peak area of bound water (r = −0.54, p < 0.05).

4. Discussion

4.1. Effect of Desiccation on Seed Germination of P. chekiangensis

P. chekiangensis seeds are known to be recalcitrant [45]. For this type of seed, maintaining a high moisture content is essential for survival, as even a small loss of moisture can lead to seed death. A study on Quercus ilex [46] demonstrated that reducing the moisture content of the seeds from 44% to 30% resulted in a decrease in germination from 100% to 17%. León-Lobos and Ellis [46] also reported that Castanea sativa seeds, initially at approximately 58% MC, were highly intolerant to desiccation; drying to 42.5% MC or less resulted in almost no germination. Similarly, Ganatsas and Tsakaldimi [47] found that the viability of Q. coccifera and Q. pubescens acorns was highly dependent on the MC. VÍCTOR et al. [48] observed that the germination of normal seedlings of Euterpe edulis seeds initially increased slightly before significantly decreasing during dehydration. They noted that the trend in the seed germination rate mirrored that of normal seedling establishment in the later stage. Additionally, Perán et al. [49] dried the embryonic axes of Artocarpus heterophyllus seeds to a water content of 0.39 g·g−1 and then rehydrated them through direct immersion, finding that the embryonic axes lost most of their viability. These studies underscore the importance of moisture retention in recalcitrant seeds, a finding that is consistent with our results. For P. chekiangensis, germination decreased from 91.17% to 72.33% when seeds were dried from 37.06% to 30.63%, at which stage the seeds began to suffer desiccation injury. When the moisture content was reduced to 25.09%, the germination percentage dropped to 11.33%, indicating a loss of approximately 88% of germination ability. Therefore, it is crucial to maintain a high moisture content for P. chekiangensis seeds during short-term storage and transport.

4.2. Changes in Ultrastructure of Cotyledons and Embryonic Axis of the Seeds

When the seeds were severely dehydrated (25.09% MC), the various organelles within the cotyledon cells, as well as the cytoplasm, were completely dissolved. The starch grains were degraded, the cells became wrinkled, and plasmic wall separation occurred. A similar deterioration was observed in the embryonic axis cells. At this stage, the seeds lost most of their germination ability, consistent with TEM observations of aged oat (Avena sativa L.) seeds [50]. In contrast, with mild dehydration (30.63% moisture content), the embryonic axis cells remained relatively intact, showing clear organelle structures and visible nuclei; however, an increase in vacuoles was noted. This finding is comparable to the TEM observations of embryonic axis-like cells in Taxillus chinensis seeds after 16 h of dehydration [51]. The appearance of vacuolization may indicate a cellular response to early mild desiccation. We found that the deterioration of seed cotyledon and embryonic axis cells during desiccation corresponded with a decline in seed germination rates. Additionally, during the desiccation, the cells of the cotyledons and embryonic axis of P. chekiangensis seeds shrank, which may correspond to the phenotypic feature of the seeds becoming smaller.

4.3. Water Distribution of P. chekiangensis Seeds during Desiccation

MRI, a non-destructive imaging tool, effectively visualizes the spatial distribution of water in seeds and tracks its migration during desiccation [52,53]. In the pseudo-color image, red indicates a high moisture content, while blue represents a low moisture content [54]. As the seeds were dried to 30.63%, the moisture content in the middle of the cotyledons diminished, and the moisture in the outermost circular region of the embryonic axis also decreased. At this stage, the germination percentage began to decline significantly, indicating a strong correlation between water loss in the cotyledon and embryonic axis and a decrease in seed vigor. The pseudo-color maps suggest that the embryonic axis is more resistant to water loss compared to the cotyledons. This resistance may be because the two hypertrophic cotyledons of P. chekiangensis seeds completely encase the embryonic axis, limiting its water loss during desiccation. This finding aligns with Duan et al. [55], who noted changes in MRI images during the processing of Paeoniae Radix Alba. They found that during the early stage of drying, the surface layer of Paeoniae Radix Alba was the first to lose water, with subsequent water loss occurring gradually from the outside to the inside. Similarly, Xu et al. [56] observed that during the drying process, the water contour in cylindrical carrot shrank toward the center, indicating that water loss in the central part occurred later. However, Chen and Shen [20] reported MRI images of Quercus acutissima seeds, noting that water loss occurred from the embryonic axis to the apex and from the center of the cotyledons to their ends. This finding is somewhat inconsistent with our results, and the discrepancy may be attributed to differences in seed size and morphological structure.

4.4. Changes in Water Status and Water Content of Each State during Desiccation

The length of the transverse relaxation time T2 reflects the degree of moisture freedom within seeds; thus, the moisture status in the sample can be determined by analyzing the position of the peak in the T2 inversion spectrum [27]. A shorter relaxation time corresponds to a lower degree of water freedom [57]. Three primary states of water were identified in the seeds of P. chekiangensis: bound water (0–1 ms), immobile water (1–3 ms), and free water (3–100 ms). During desiccation, the peak of bound water shifted to the right, while the peak of immobile water initially shifted to the right and subsequently to the left. The peak of free water also shifted to the right. The increased freedom of bound water may be attributed to the degradation of macromolecular groups, such as sugars, within the seeds, which diminished the water binding capacity. In the pre-middle stage of desiccation (37.06–22.04% of MC), the mobility of immobile water increased, possibly due to damage to organelles within the cells, which reduced water binding. Conversely, in the late stage of desiccation (19.08–16.04% of MC), immobile water mobility decreased, likely due to cell shrinkage, which contracted subcellular structures, thereby reducing the mobility of hydrogen protons and enhancing the binding capacity of cellular water. The increased mobility of free water during the later stages of water loss indicates that the integrity of the cell membrane was compromised, making it difficult to prevent the movement and dissipation of water within the cytoplasm. The findings of Sun et al. [58] contrast with ours, as they observed that the peaks of free water, bound water, and immobile water all shifted to the right during the room-temperature storage of fresh jujubes. In contrast, the peaks of free, bound, and immobile water in the seeds of Quercus acutissima [20] exhibited a left-shifted trend. These variations in water status during water loss highlight that different experimental materials exhibit distinct patterns of change, which we speculate may be influenced by differences in nutrient composition and treatment conditions.
Water is essential for the survival of living organisms, and it exists in different forms: bound water, immobile water, and free water. These can transform into one another in varying proportions [59]. At 28.11% MC, the free water content significantly decreased, while immobile and bound water increased. This suggested that, in response to desiccation stress, some free water was converted into immobile water and bound water in P. chekiangensis seeds. This conversion enhanced the moisture retention capacity of the seeds and reduced the rate of moisture loss. By the end of the seed drying process (16.04% MC), there is not enough intracellular moisture to sustain the active metabolism of the seeds due to a significant loss of free water. Consequently, cellular activity diminished, leading to a loss of seed vigor. Luo et al. [60] reported that the loss of free water was most pronounced during the storage of olecranon peach, with changes in free water correlating with fruit hardness and deterioration. Our findings align closely with theirs.
Bound water plays a crucial role in the resistance of organisms to desiccation stress [61]. It can remain unfrozen at temperatures ranging from −20 to 25 °C, possesses no solvent properties, and is hardly involved in physiological processes [7,62]. Some researchers believe that the content of “unfreezable” water in living tissues is greater than that found in dead tissues and that the removal of this “vital water” from cells can lead to cell death [7,62]. In contrast, free water exhibits different kinetic and thermodynamic properties compared to bound water and is actively involved in metabolic processes. Free water can be readily removed through slow desiccation and influences various biological processes, including loss of expansion, cessation of cell enlargement, and stomatal closure, which in turn impacts crucial physiological and biochemical reactions [63]. Therefore, the survival of seeds during drying appears to depend on the moisture retention capacity of the cells. Vertucci and Leopold [7] identified differences in moisture binding between desiccation-tolerant and non-desiccation-tolerant plants, hypothesizing that desiccation-sensitive seeds may lack moisture that is tightly bound to macromolecules or may fail to conserve such moisture during desiccation. Jiang [64] observed that after drying orthodox seeds, free water was entirely lost while bound water was retained; conversely, in recalcitrant seeds, moisture remained in the same state and was gradually and slowly lost. In fresh seeds of P. chekiangensis, free water constitutes the highest percentage, while bound water represents the lowest. When the seeds were dried to an MC of 25.09% or lower, the free water content decreased by approximately 97%, even lower than the bound water, at which stages seed vigor was lost. Therefore, we hypothesize that the desiccation intolerance of P. chekiangensis seeds may be attributed to the insufficient bound water and the rapid, substantial loss of free water. Additionally, TEM results indicated that when dried to an MC of 28.11% or lower, the cells of the cotyledons and embryonic axis began to shrink due to free water loss and plasmic wall separation, leading to loss of seed vigor. Correlation analysis revealed a strong relationship between the decrease in seed germination and the loss of free water (r = 0.94, p < 0.01). The vigor of P. chekiangensis seeds is particularly sensitive to free water loss. We proposed that the significant reduction in free water within these seeds indicates damage to the membrane system, membrane lipid peroxidation, cytoplasmic degradation, and the accumulation of toxic substances, ultimately resulting in diminished seed vigor.
Kuroki [65] found that during desiccation, the resurrection plant Haberlea rhodopensis, despite losing water easily and rapidly, can maintain a constant proportion of certain water status. The constancy of this proportion implies specific maintenance of the water molecular structure, i.e., the existence of a dynamic regulatory mechanism for keeping water in a specific state, which may be favorable for the desiccation tolerance of the plant. In contrast, the proportions of the three main water phases in P. chekiangensis seeds during desiccation were imbalanced. In fresh seeds of P. chekiangensis, free water > immobile water > bound water. However, upon seed death, immobile water > bound water > free water. The inability to maintain a balanced proportion of these water phases during the drying process may be a contributing factor to the sensitivity of recalcitrant seeds to desiccation.

5. Conclusions

This study investigated the changes in seed vigor of P. chekiangensis during natural desiccation, with a focus on seed germination, ultrastructure, and internal water distribution and status using NMR technology. Our findings demonstrate that P. chekiangensis seeds are highly sensitive to water loss. Initially, the seeds had a moisture content of 37.06%, and drying to 25.09% resulted in an approximately 88% loss of their vigor. Therefore, maintaining adequate moisture is crucial for the survival of recalcitrant seeds.
As a non-destructive real-time visualization method, NMR offers new perspectives and insights into the information on internal moisture in seeds during desiccation. We observed that in fresh P. chekiangensis seeds, water was predominantly concentrated in the embryonic axis and the middle of the cotyledons. Water loss occurred from the exterior to the interior of the embryonic axis and from the periphery to the center of the cotyledons. The water status within the seeds can be categorized into bound water, immobile water, free water, and a secondary peak to the right of free water. Fresh, undehydrated P. chekiangensis seeds exhibited the highest free water content, followed by immobile water and bound water. As desiccation progressed, the free water content significantly decreased, immobile water content initially decreased before rising substantially, and bound water content increased. We hypothesize that the desiccation intolerance of P. chekiangensis seeds may be attributed to a deficiency in bound water and a rapid, substantial loss of free water. Correlation analysis revealed a highly significant relationship between the reduction in seed germination and the loss of free water.

Supplementary Materials

The following supporting information can be downloaded at: https://www.mdpi.com/article/10.3390/f15091508/s1, Figure S1: LF-NMR T2 relaxation time inversion spectrum waterfall of different moisture content of Phoebe chekiangensis seeds; Figure S2: Linear regression analysis of seed moisture and nuclear magnetic resonance signal amplitude in Phoebe chekiangensis.

Author Contributions

Conceptualization, H.H. and H.G.; methodology, H.H.; software, H.H.; investigation, H.H., W.G. and Y.H.; data curation, H.H., W.G. and Y.H.; writing—original draft preparation, H.H.; writing—review and editing, H.G.; visualization, H.H. All authors have read and agreed to the published version of the manuscript.

Funding

This study was supported by the Postgraduate Research & Practice Innovation Program of Jiangsu Province (KYCX22_1110). The source of funding is the Department of Education of Jiangsu Province.

Data Availability Statement

The data are included in the article.

Acknowledgments

We are very grateful to Qian Wang for her advice on this manuscript, and to Rong Gao and Sifan Shen for their help in handling the experimental materials.

Conflicts of Interest

The authors declare no conflicts of interest. The funders had no role in the design of the study; in the collection, analyses, or interpretation of data; in the writing of the manuscript; or in the decision to publish the results.

References

  1. Pennisi, E. Tending the global garden. Science 2010, 329, 1274–1277. [Google Scholar] [CrossRef]
  2. Walters, C.; Volk, G.M.; Richards, C.M. Genebanks in the post-genomic age: Emerging roles and anticipated uses. Biodiversity 2008, 9, 68–71. [Google Scholar] [CrossRef]
  3. Berjak, P.; Pammenter, N. From Avicennia to Zizania: Seed recalcitrance in perspective. Ann. Bot. 2008, 101, 213–228. [Google Scholar] [CrossRef] [PubMed]
  4. Hu, J.; Guan, Y. (Eds.) Seed Biology, 2nd ed.; Higher Education Press: Beijing, China, 2022; pp. 284–290. [Google Scholar]
  5. Walters, C.; Berjak, P.; Pammenter, N.; Kennedy, K.; Raven, P. Preservation of recalcitrant seeds. Science 2013, 339, 915–916. [Google Scholar] [CrossRef] [PubMed]
  6. Krishnan, P.; Singh, R.; Verma, A.; Joshi, D.; Singh, S. Changes in seed water status as characterized by NMR in developing soybean seed grown under moisture stress conditions. Biochem. Biophys. Res. Commun. 2014, 444, 485–490. [Google Scholar] [CrossRef] [PubMed]
  7. Vertucci, C.W.; Leopold, A.C. The relationship between water binding and desiccation tolerance in tissues. Plant Physiol. 1987, 85, 232–238. [Google Scholar] [CrossRef]
  8. Farrant, J.M.; Pammenter, N.W.; Berjak, P. Recalcitrance—A current assessment. Seed Sci. Technol. 1988, 16, 155–166. [Google Scholar]
  9. Pritchard, H. Water potential and embryonic axis viability in recalcitrant seeds of Quercus rubra. Ann. Bot. 1991, 67, 43–49. [Google Scholar] [CrossRef]
  10. Sakurai, M.; Kawai, H.; Inoue, Y.; Hino, A.; Kobayashi, S. Effects of trehalose on the water structure in yeast cells as studied by in vivo 1H NMR spectroscopy. Bull. Chem. Soc. Jpn. 1995, 68, 3621–3627. [Google Scholar] [CrossRef]
  11. El-Saidi, M.; Gabr, A.; El-Kadi, M.; El-Zeiny, H. The effect of certain pre-sowing seed treatments and early phosphorus supplement on cell sap concentration and water fractions in leaves of maize (Zea mays L.) plants grown under soil moisture stress conditions. Biol. Plant. 1975, 17, 281–291. [Google Scholar] [CrossRef]
  12. Rascio, A.; Russo, M.; Platani, C.; Di Fonzo, N. Drought intensity effects on genotypic differences in tissue affinity for strongly bound water. Plant Sci. 1998, 132, 121–126. [Google Scholar] [CrossRef]
  13. Misik, S. Bound water in vine cane studied by microwave method. Acta Hortic. 2000, 526, 177–182. [Google Scholar] [CrossRef]
  14. Joardder, M.U.; Karim, A.; Kumar, C.; Brown, R.J. Porosity: Establishing the Relationship between Drying Parameters and Dried Food Quality; Springer: Berlin/Heidelberg, Germany, 2015; pp. 15–19. [Google Scholar]
  15. Sun, W.Q. Dielectric Relaxation of Water and Water-Plasticized Biomolecules in Relation to Cellular Water Organization, Cytoplasmic Viscosity, and Desiccation Tolerance in Recalcitrant Seed Tissues. Plant Physiol. 2000, 124, 1203–1216. [Google Scholar] [CrossRef] [PubMed]
  16. Wang, P.; Li, D.; Wang, L. Drying damage on physiological properties of rice seed associated with ultrastructure changes. Int. J. Food Eng. 2017, 13, 20170096. [Google Scholar] [CrossRef]
  17. Donadon, J.R.; Resende, O.; Teixeira, S.d.P.; Santos, J.M.d.; Moro, F.V. Effect of hot air drying on ultrastructure of crambe seeds. Dry. Technol. 2013, 31, 269–276. [Google Scholar] [CrossRef]
  18. Seyedin, N.; Burris, J.S.; Flynn, T.E. Physiological studies on the effects of drying temperatures on corn seed quality. Can. J. Plant Sci. 1984, 64, 497–504. [Google Scholar] [CrossRef]
  19. Siddique, A.B.; Wright, D. Effects of Different Drying Time and Temperature on Moisture Percentage and Seed Quality (Viability and Vigour) of Pea Seeds (Pisum sativum L.). Asian J. Plant Sci. 2003, 2, 978–982. [Google Scholar] [CrossRef]
  20. Chen, H.; Shen, Y. Investigation of Water Distribution and Mobility Dynamics in Recalcitrant Quercus acutissima Seeds during Desiccation Using Magnetic Resonance Methods. Forests 2023, 14, 738. [Google Scholar] [CrossRef]
  21. Sun, Q.; Zhang, M.; Yang, P. Combination of LF-NMR and BP-ANN to monitor water states of typical fruits and vegetables during microwave vacuum drying. LWT 2019, 116, 108548. [Google Scholar] [CrossRef]
  22. Winisdorffer, G.; Musse, M.; Quellec, S.; Barbacci, A.; Le Gall, S.; Mariette, F.; Lahaye, M. Analysis of the dynamic mechanical properties of apple tissue and relationships with the intracellular water status, gas distribution, histological properties and chemical composition. Postharvest Biol. Technol. 2015, 104, 1–16. [Google Scholar] [CrossRef]
  23. Xin, Y.; Zhang, M.; Adhikari, B. Effect of trehalose and ultrasound-assisted osmotic dehydration on the state of water and glass transition temperature of broccoli (Brassica oleracea L. var. botrytis L.). J. Food Eng. 2013, 119, 640–647. [Google Scholar] [CrossRef]
  24. Zhang, L.; McCarthy, M.J. Black heart characterization and detection in pomegranate using NMR relaxometry and MR imaging. Postharvest Biol. Technol. 2012, 67, 96–101. [Google Scholar] [CrossRef]
  25. Xu, C.; Li, Y.; Yu, H. Effect of far-infrared drying on the water state and glass transition temperature in carrots. J. Food Eng. 2014, 136, 42–47. [Google Scholar] [CrossRef]
  26. Li, J.; Chen, M.; Cheng, D.; Li, W.; Guo, S.; Chen, C.; Liu, C.; Chen, S. An accurate and effective single-seed moisture selection method based on nuclear magnetic resonance (NMR) in maize. Comput. Electron. Agric. 2022, 193, 106649. [Google Scholar] [CrossRef]
  27. Gu, Y.; Chen, Y.; Yue, X.; Xiong, P.; Pan, D.; Song, P.; Luo, B. LF-NMR/MRI Determination of Different 6-Benzylaminopurine Concentrations and Their Effects on Soybean Moisture. Front. Plant Sci. 2022, 13, 885804. [Google Scholar] [CrossRef]
  28. Krishnan, P.; Joshi, D.; Nagarajan, S.; Moharir, A. Characterization of germinating and non-viable soybean seeds by nuclear magnetic resonance (NMR) spectroscopy. Seed Sci. Res. 2004, 14, 355–362. [Google Scholar] [CrossRef]
  29. Song, P.; Kim, G.; Song, P.; Yang, T.; Yue, X.; Gu, Y. Rapid and non-destructive detection method for water status and water distribution of rice seeds with different vigor. Int. J. Agric. Biol. Eng. 2021, 14, 231–238. [Google Scholar] [CrossRef]
  30. Garnczarska, M.; Zalewski, T.; Kempka, M. Water uptake and distribution in germinating lupine seeds studied by magnetic resonance imaging and NMR spectroscopy. Physiol. Plant. 2007, 130, 23–32. [Google Scholar] [CrossRef]
  31. Garnczarska, M.; Zalewski, T.; Kempka, M. Changes in water status and water distribution in maturing lupin seeds studied by MR imaging and NMR spectroscopy. J. Exp. Bot. 2007, 58, 3961–3969. [Google Scholar] [CrossRef]
  32. Hu, X.; Wu, P.; Zhang, S.; Chen, S.; Wang, L. Moisture conversion and migration in single-wheat kernel during isothermal drying process by LF-NMR. Dry. Technol. 2019, 37, 803–812. [Google Scholar] [CrossRef]
  33. Li, C.; Zhang, M.; Yu, J. Determining wood moisture content by free induction decay of nuclear magnetic resonance. J. Beijing For. Univ. 2012, 34, 142–145. [Google Scholar] [CrossRef]
  34. Xu, F.; Jin, X.; Zhang, L.; Chen, X.D. Investigation on water status and distribution in broccoli and the effects of drying on water status using NMR and MRI methods. Food Res. Int. 2017, 96, 191–197. [Google Scholar] [CrossRef] [PubMed]
  35. International Seed Testing Association (ISTA). International Rules for Seed Testing. Chapter 9: Determination of Moisture Content; International Seed Testing Association (ISTA): Bassersdorf, Switzerland, 2004. [Google Scholar]
  36. Feng, J.; Shen, Y.; Shi, F.; Li, C. Changes in seed germination ability, lipid peroxidation and antioxidant enzyme activities of Ginkgo biloba seed during desiccation. Forests 2017, 8, 286. [Google Scholar] [CrossRef]
  37. Shi, X.; Shi, Z. Dormancy of Phoebe chekiangensis Seed. J. Zhejiang For. Coll. 1990, 7, 377–382. [Google Scholar]
  38. Shi, X.; Shi, Z. Study on Seed and Dormancy of Phoebe chekiangensis and Its Releasing Ways. SEED 1990, 76. [Google Scholar] [CrossRef]
  39. Lozano-Isla, F.; Benites-Alfaro, O.E.; Pompelli, M.F. GerminaR: An R package for germination analysis with the interactive web application “GerminaQuant for R”. Ecol. Res. 2019, 34, 339–346. [Google Scholar] [CrossRef]
  40. Krishnan, H.B.; Kim, W.-S.; Oehrle, N.W.; Smith, J.R.; Gillman, J.D. Effect of heat stress on seed protein composition and ultrastructure of protein storage vacuoles in the cotyledonary parenchyma cells of soybean genotypes that are either tolerant or sensitive to elevated temperatures. Int. J. Mol. Sci. 2020, 21, 4775. [Google Scholar] [CrossRef]
  41. Wu, Y.; Shen, Y.B. The structural and chemical characteristics of the pericarp are important in Tilia miqueliana seed dormancy. New For. 2021, 52, 875–888. [Google Scholar] [CrossRef]
  42. Li, Y.; Obadi, M.; Shi, J.; Sun, J.; Chen, Z.; Xu, B. Determination of moisture, total lipid, and bound lipid contents in oats using low-field nuclear magnetic resonance. J. Food Compos. Anal. 2020, 87, 103401. [Google Scholar] [CrossRef]
  43. Song, P.; Yue, X.; Gu, Y.; Yang, T. Assessment of maize seed vigor under saline-alkali and drought stress based on low field nuclear magnetic resonance. Biosyst. Eng. 2022, 220, 135–145. [Google Scholar] [CrossRef]
  44. Kamal, T.; Cheng, S.; Khan, I.A.; Nawab, K.; Zhang, T.; Song, Y.; Wang, S.; Nadeem, M.; Riaz, M.; Khan, M.A.U. Potential uses of LF-NMR and MRI in the study of water dynamics and quality measurement of fruits and vegetables. J. Food Process Preserv. 2019, 43, e14202. [Google Scholar] [CrossRef]
  45. He, H.; Gao, H.; Xue, X.; Ren, J.; Chen, X.; Niu, B. Variation of sugar compounds in Phoebe chekiangensis seeds during natural desiccation. PLoS ONE 2024, 19, e0299669. [Google Scholar] [CrossRef] [PubMed]
  46. Leon-Lobos, P.; Ellis, R.H. Comparison of seed desiccation sensitivity amongst Castanea sativa, Quercus ilex and Q. cerris. Seed Sci. Technol. 2018, 46, 233–237. [Google Scholar] [CrossRef]
  47. Ganatsas, P.; Tsakaldimi, M. A comparative study of desiccation responses of seeds of three drought-resistant Mediterranean oaks. For. Ecol. Manag. 2013, 305, 189–194. [Google Scholar] [CrossRef]
  48. Panza, V.; Láinez, V.; Maldonado, S.; Maroder, H.L. Effects of desiccation on Euterpe edulis Martius seeds. Biocell 2007, 31, 383–390. [Google Scholar] [CrossRef]
  49. Perán, R.; Pammenter, N.; Naicker, J.; Berjak, P. The influence of rehydration technique on the response of recalcitrant seed embryos to desiccation. Seed Sci. Res. 2004, 14, 179–184. [Google Scholar] [CrossRef]
  50. Yan, H.; Jia, S.; Mao, P. Melatonin priming alleviates aging-induced germination inhibition by regulating β-oxidation, protein translation, and antioxidant metabolism in oat (Avena sativa L.) seeds. Int. J. Mol. Sci. 2020, 21, 1898. [Google Scholar] [CrossRef] [PubMed]
  51. Wei, S. Study on Biological Characteristics of Recalcitrant Seeds and Mechanism of Desiccation Sensitivity of Taxillus chinensis (DC.) Danser. Ph.D. Thesis, Peking Union Medical College, Beijing, China, 2017. [Google Scholar]
  52. Tuomainen, T.V.; Himanen, K.; Helenius, P.; Kettunen, M.I.; Nissi, M.J. Quantitative magnetic resonance imaging of Scots pine seeds and the assessment of germination potential. Can. J. For. Res. 2022, 52, 685–695. [Google Scholar] [CrossRef]
  53. Terskikh, V.V.; Feurtado, J.A.; Ren, C.; Abrams, S.R.; Kermode, A.R. Water uptake and oil distribution during imbibition of seeds of western white pine (Pinus monticola Dougl. ex D. Don) monitored in vivo using magnetic resonance imaging. Planta 2005, 221, 17–27. [Google Scholar] [CrossRef]
  54. Li, M.; Li, B.; Zhang, W. Rapid and non-invasive detection and imaging of the hydrocolloid-injected prawns with low-field NMR and MRI. Food Chem. 2018, 242, 16–21. [Google Scholar] [CrossRef]
  55. Duan, W.; Li, Y.; Cui, L.; Liu, F.; Yang, G.; Guo, L.; Wang, X. Analyze moisture transformation and transport rules during processing of Paeoniae Radix Alba by using low-field NMR. China J. Chin. Mater. Medica 2017, 42, 2092–2096. [Google Scholar] [CrossRef]
  56. Xu, J.; Xu, G.; Zhang, X.; Gu, Z.; Zhang, S.; Li, H. Moisture transport in carrot during hot air drying using magnetic resonance imaging. Trans. Chin. Soc. Agric. Eng. 2013, 29, 271–276. [Google Scholar] [CrossRef]
  57. Song, P.; Xu, J.; Ma, H.; Wang, C.; Yang, T.; Gao, H. Moisture phase state and distribution characteristics of seed during rice seed soaking process by low field nuclear magnetic resonance. Trans. Chin. Soc. Agric. Eng. 2016, 32, 204–210. [Google Scholar] [CrossRef]
  58. Sun, B.; Zhao, H.; Feng, X.; Huang, X.; Wang, N. Studies on the Change of Moisture State of Fresh Jujube during Storage Base on LF-NMR and MRI. J. Chin. Inst. Food Sci. Technol. 2016, 16, 252–257. [Google Scholar] [CrossRef]
  59. Cheng, E.; Song, P.; Hou, T.; Zhang, B.; Wu, L. Determining the effects of LFHV-PEF treatment on the water distribution and vigor of aged rice seeds using LF-NMR. Int. J. Agric. Biol. Eng. 2022, 15, 190–196. [Google Scholar] [CrossRef]
  60. Luo, J.; Tang, M.; Qiu, Y.; Liu, J.; Wang, Q. Change of water status during olecranon peach storage by LF-NMR technique. J. Zhongkai Univ. Agric. Eng. 2019, 32, 23–27. [Google Scholar] [CrossRef]
  61. Levitt, J. Frost, drought, and heat resistance. Annu. Rev. Plant Physiol. 1951, 2, 245–268. [Google Scholar] [CrossRef]
  62. Ambastha, V.; Tiwari, B.S. Cellular water and anhydrobiosis in plants. J. Plant Growth Regul. 2015, 34, 665–671. [Google Scholar] [CrossRef]
  63. Moore, J.P.; Le, N.T.; Brandt, W.F.; Driouich, A.; Farrant, J.M. Towards a systems-based understanding of plant desiccation tolerance. Trends Plant Sci. 2009, 14, 110–117. [Google Scholar] [CrossRef]
  64. Xiaocheng, J.; Xiaoquan, Y.; Jiarui, F.; Junxian, H. Differences between the water status in orthodox seeds and that in recalcitrant seeds. Acta Sci. Nat. Univ. Norm. Hunan 1996, 19, 54–58. [Google Scholar]
  65. Kuroki, S.; Tsenkova, R.; Moyankova, D.; Muncan, J.; Morita, H.; Atanassova, S.; Djilianov, D. Water molecular structure underpins extreme desiccation tolerance of the resurrection plant Haberlea rhodopensis. Sci. Rep. 2019, 9, 3049. [Google Scholar] [CrossRef] [PubMed]
Figure 1. Morphological structure (AD) of Phoebe chekiangensis seeds and schematic diagram of seed measurement regions of interest (E,F). (A) The longitudinal section of the seed (sagittal plane); (B) the other half of the longitudinally cut seed; (C) the seed with the seed coat removed; (D) the front view of an intact seed; the coronal plane is a longitudinal section along the direction of the blue arrow in the figure; (E) schematic diagram of coronal plane of the seed, the red box area is the signal-to-noise ratio (SNR) measurement area of interest in the coronal plane; (F) schematic diagram of the seed sagittal plane, the red box area is the SNR measurement area in the sagittal plane. EA: embryo axis, CT: cotyledon, ES: endocarp and seed coat.
Forests 15 01508 g001
Figure 2. Changes in moisture content (A), germination percentage (A) and mean germination time (B) of seeds of Phoebe chekiangensis during desiccation. Different lowercase letters represent significant differences between treatments at the p < 0.05 level.
Forests 15 01508 g002
Figure 3. TEM observation of ultrastructure of cotyledons of seeds during desiccation. (AC) represents fresh undehydrated (37.06%) seeds, (D,E) represent 30.63% moisture content, (F,G) represent 28.11% moisture content, (H) represents 25.09% moisture content and (I) represent 16.04% moisture content. The black arrows in (C) represent the exchange of substances between cells. The black arrows of (G,I) represent cells showing plasmic wall separation. CW, cell wall; LB, lipid body; M, mitochondrion; SG, starch grain; V, vacuole.
Forests 15 01508 g003
Figure 4. TEM observation of ultrastructure of embryo axis of seeds during desiccation. (A,B) represent fresh undehydrated (37.06%) seeds, (C,D) represent 30.63% moisture content, (E) represents 28.11% moisture content, (F) represents 25.09% moisture content, and (G) represents 16.04% moisture content. The black arrows in (F,G) indicate that the cells show plasmic wall separation and cell wall folding. CW, cell wall; ER, endoplasmic reticulum; LB, lipid body; M, mitochondrion; N, nucleus; Nu, nucleolus; SG, starch grain; V, vacuole.
Forests 15 01508 g004
Figure 5. Pseudo-color images and maps of signal-to-noise ratio (SNR) change in P. chekiangensis seeds during desiccation. In pseudo-color images, the redder the color, the greater the hydrogen proton density in the seed sample. (AE) represents MRIs of the coronal plane of seeds with different moisture contents (37.06%, 33.99%, 30.63%, 28.11%, 25.09%), and (ae) represent MRIs of the sagittal plane of the seeds. (F) shows the change in the ratio of SNR of each measurement area in the coronal plane of the seed during desiccation, and (G) shows the change in the ratio of SNR of each measurement area in the sagittal plane. The top right of (F,G) are schematic diagrams of the seed SNR measurement regions, numbered from top to bottom as R1 (SR1), R2 (SR2), R3 (SR3), and from left to right as R5 (SR5), R8 (SR8).
Forests 15 01508 g005
Figure 6. Changes in peak area and peak proportion of P. chekiangensis seeds during desiccation. Lowercase letters for different moisture content in the same water phase represent significant differences at the p < 0.05 level. “Secondary peak” is a secondary peak to the right of free water. The four illustrations in (A,B) refer to the four water phases in the seeds of P. chekiangensis.
Forests 15 01508 g006
Figure 7. Correlation analysis between indicators during desiccation. The size of the circles in the figure indicates the degree of correlation (r), with larger circles indicating a higher degree of correlation. “*” and “**” indicate significant differences at the p < 0.05 and p < 0.01 levels, respectively. MC: moisture content, GP: germination percentage. R1–R3, R5, and R8 refer to the SNR of the measurement area of interest in the seed coronal plane. SR1-SR3, SR5, and SR8 refer to the SNR in the sagittal plane of the seed.
Forests 15 01508 g007
Table 1. Changes in seed size during desiccation.
Moisture Content/%Transverse
Diameter/mm
Longitudinal
Diameter/mm
Thickness/mm
37.067.82 ± 0.06 a12.59 ± 0.08 a7.08 ± 0.13 a
33.997.70 ± 0.01 b12.50 ± 0.04 ab6.86 ± 0.04 b
30.637.61 ± 0.03 c12.42 ± 0.07 abc6.85 ± 0.05 b
28.117.59 ± 0.03 c12.40 ± 0.08 abcd6.81 ± 0.06 bc
25.097.56 ± 0.02 c12.37 ± 0.07 bcde6.80 ± 0.06 bcd
22.047.42 ± 0.04 d12.30 ± 0.05 cde6.68 ± 0.02 cd
19.087.39 ± 0.02 d12.25 ± 0.07 de6.66 ± 0.03 d
16.047.39 ± 0.02 d12.21 ± 0.09 e6.67 ± 0.01 cd
Different lowercase letters in the same column represent significant differences at the p < 0.05 level according to the Tukey test. Data represent mean ± SD.
Table 2. LF-NMR parameters of P. chekiangensis seeds during desiccation.
Moisture Content/%T21T22T23T24
Relaxation Range/msPeak Time/msRelaxation Range/msPeak Time/msRelaxation Range/msPeak Time/msRelaxation Range/msPeak Time/ms
37.060.14 ± 0.02 de0.09 ± 0.01 b3.06 ± 0.28 d1.61 ± 0.31 a180.48 ± 32.46 a8.42 ± 0.58 c322.97 ± 43.03 a312.32 ± 38.76 a
33.990.13 ± 0.03 e0.07 ± 0.01 b2.71 ± 1.00 d1.75 ± 0.88 a149.34 ± 21.75 a6.99 ± 0.28 c308.40 ± 11.69 a284.36 ± 29.61 ab
30.630.11 ± 0.00 e0.07 ± 0.00 b1.41 ± 0.45 d1.20 ± 0.00 a118.59 ± 9.09 a3.85 ± 0.57 c239.95 ± 64.49 a209.82 ± 8.51 ab
28.110.18 ± 0.01 cd0.08 ± 0.01 b21.40 ± 6.61 c2.04 ± 0.21 a55.96 ± 22.30 a28.19 ± 16.30 bc306.84 ± 153.93 a140.12 ± 51.04 b
25.090.20 ± 0.01 bc0.08 ± 0.00 b52.72 ± 1.85 a2.17 ± 0.08 a143.06 ± 88.15 a80.53 ± 21.81 a201.58 ± 29.22 a286.96 ± 95.79 ab
22.040.20 ± 0.03 bc0.09 ± 0.02 b40.31 ± 1.65 b2.06 ± 0.21 a222.41 ± 136.67 a84.79 ± 20.04 a186.83 ± 60.26 a267.26 ± 46.08 ab
19.080.34 ± 0.01 a0.15 ± 0.04 a29.84 ± 4.20 c1.52 ± 0.06 a172.21 ± 64.10 a64.99 ± 10.85 ab168.19 ± 20.52 a266.28 ± 69.40 ab
16.040.25 ± 0.01 b0.09 ± 0.01 b26.66 ± 3.99 c1.39 ± 0.10 a142.34 ± 70.76 a61.65 ± 16.56 ab187.72 ± 112.27 a235.81 ± 83.96 ab
Different lowercase letters in the same column represent significant differences at the p < 0.05 level according to the Tukey test. Data represent mean ± SD.
Disclaimer/Publisher’s Note: The statements, opinions and data contained in all publications are solely those of the individual author(s) and contributor(s) and not of MDPI and/or the editor(s). MDPI and/or the editor(s) disclaim responsibility for any injury to people or property resulting from any ideas, methods, instructions or products referred to in the content.

