Article

The Impact of Changes in Green Space Structures on Thermal Mitigation and Costs under a Constant Green Volume

by
Zilong Li
,
Zhiyong Qi
,
Bohong Zheng
and
Xi Luo
*
School of Architecture and Art, Central South University, Changsha 410083, China
*
Author to whom correspondence should be addressed.
Forests 2024, 15(9), 1525; https://doi.org/10.3390/f15091525
Submission received: 7 August 2024 / Revised: 20 August 2024 / Accepted: 28 August 2024 / Published: 29 August 2024
(This article belongs to the Section Urban Forestry)

Abstract

:
Green space improves outdoor thermal comfort and promotes the residents’ physical and mental health. Currently, many cities are using green volume indicators to evaluate the quality of residential green space and to help form the latest evaluation standards. However, from the perspective of plant green volume, the impact of green space structures on thermal mitigation has not been emphasized. Furthermore, the cost of green space will change with the green space structures. Therefore, we evaluate the impact of changes in green space structures on thermal mitigation and costs from the perspective of plant green volume and aim to find suitable allocations of plant green volume, which balance thermal mitigation with cost savings. This study analyzed the regional climate and residential green space structures. Then, we discussed the relationship between thermal mitigation and the costs of different structures. The analytical results indicated that thermal comfort improves as the green volume of trees increases, with costs also increasing. Where the green volume exceeds 70%, no “extreme heat stress” moments occur for the whole day. When the green volume of trees increases from 20% to 60%, the thermal mitigation is 3.62 °C. However, the mitigation is only 1.74 °C when the green volume increases from 60% to 100%, which is less than half of the former, numerically. This study suggests that the green volume of trees in residential green spaces should be controlled at 60%–70% and the corresponding green volume of shrubs should be 30%–40%. This study rationally balances the thermal mitigation and costs of residential green space, which will directly guide residential green space planning in real situations.

1. Introduction

Green space is a general term for all types of green land in cities, and it is vital for promoting communication [1], beautifying the environment [2], and regulating the climate [3]. As city temperatures consistently break new records [4], scholars in urban planning have analyzed the causes of urban warming and found that green space performs well in mitigating urban heat islands and improving thermal environments [5,6]. In residential areas, green space creates pleasant places for residents’ outdoor activities and promotes their physical and mental health [7]. Furthermore, it also regulates the outdoor thermal environments [8]. Therefore, the latest studies focus on evaluating the quality of green space [9], especially the impact of quality on residents’ thermal comfort [10].
In urban green space planning and design, scholars have qualitatively analyzed the impact of different types of plants on thermal comfort and also quantified the level of this impact through greenery indicators. Generally, trees have the most significant cooling effects, followed by shrubs and grasses [11]; with higher canopy coverage of green space, the space’s thermal comfort is better [12]. In addition, existing greenery indicators, including green land ratio [13], green coverage ratio [14], and tree canopy coverage ratio [15], were used to evaluate the green volume and quality of green space in residential areas. A study in a hot and humid region noted that the temperatures of surroundings decreased significantly with the increase in the green coverage ratio [16]. Similarly, the latest study also proved that outdoor thermal comfort improved linearly with the increase in tree canopy coverage [17]. These findings indicated that the greenery indicators are positively correlated with the outdoor thermal comfort level, which is helpful for residential green space design. Namely, with a continuous increase in green indicators, a higher cooling potential for green space is released. Other scholars also observed that increasing the canopy coverage is not sustainably effective in improving outdoor thermal comfort in different heights of residential areas. For example, in a 33-floor residential area, the cooling effect of green space is insignificant and the green coverage increases by more than 25% [18]. Actually, it is insufficient to capture the distribution of plant green volume in green space by the green land ratio or coverage ratio. Specifically, these indicators only reflect the percentage of greenery in the plane and can not quantify the three-dimensional green volume in spaces [19]. Three-dimensional green volume indicates the volume of space occupied by all plants in a space; it is evaluated by the green plot ratio (GPR), depending on the plant leaf area index (LAI) [20]. In particular, the LAI is a metric that quantifies the three-dimensional green volume of a single plant. Since three-dimensional green volume can better reflect the greenery quality of green space, Chinese cities such as Sichuan, Shenzhen, and Fujian have started to use GPR to evaluate the quality of residential green spaces and require it to reach 3.0 wherever possible [21,22,23]. In the latest study, we confirmed that a change in GPR could impact the intensity of urban heat islands and outdoor thermal comfort [24]. However, the green space is composed of trees, shrubs, and grasses in different proportions of green volume [25]. This study has only initially proposed an appropriate value for GPR and has not analyzed the effect of the variation in the green volume of trees, shrubs, and grasses on thermal comfort within a limited GPR. This is because, under the limited green volume requirement, the change in the green volume proportion of trees, shrubs, and grasses may affect the lighting, ventilation, cooling, and humidifying effect of the green space. In addition, constructing ideal green spaces by changing the number and spatial distribution of plants to evaluate their thermal comfort benefits is the typical research methodology [26]. This method considered the thermal mitigation of green spaces but ignored an actual issue, where an increase in plant numbers inevitably leads to changes in economic costs in planning practice. For sustainable urban development, balancing the thermal mitigation of a green space with economic costs is not only helpful to human thermal comfort but also an essential guide for realistic green space planning and design.
Therefore, this study aims to evaluate the thermal mitigation of residential green space from the spatial green volume distribution perspective, followed by incorporating the cost of green space into the evaluation, which concerns sustainable urban development. This innovative angle that we proposed is of great value in urban residential greenery, as it releases the cooling potential and reduces the economic cost of green space construction within a limited green volume. In order to address current gaps and realize our research goal, this paper selects green space in a residential area of Changsha City, Hunan Province, as an experiment. We constructed multiple green space scenarios of equal GPR and analyzed their thermal mitigation and economic costs. The analytical results show that, by adjusting the proportion of plant green volume in the green space, it is possible to improve thermal comfort and control the economic budget effectively. Finally, from the perspective of green space planning and renewal, practical green space patterns and economic budgets are proposed for the relevant departments.

2. Materials and Methods

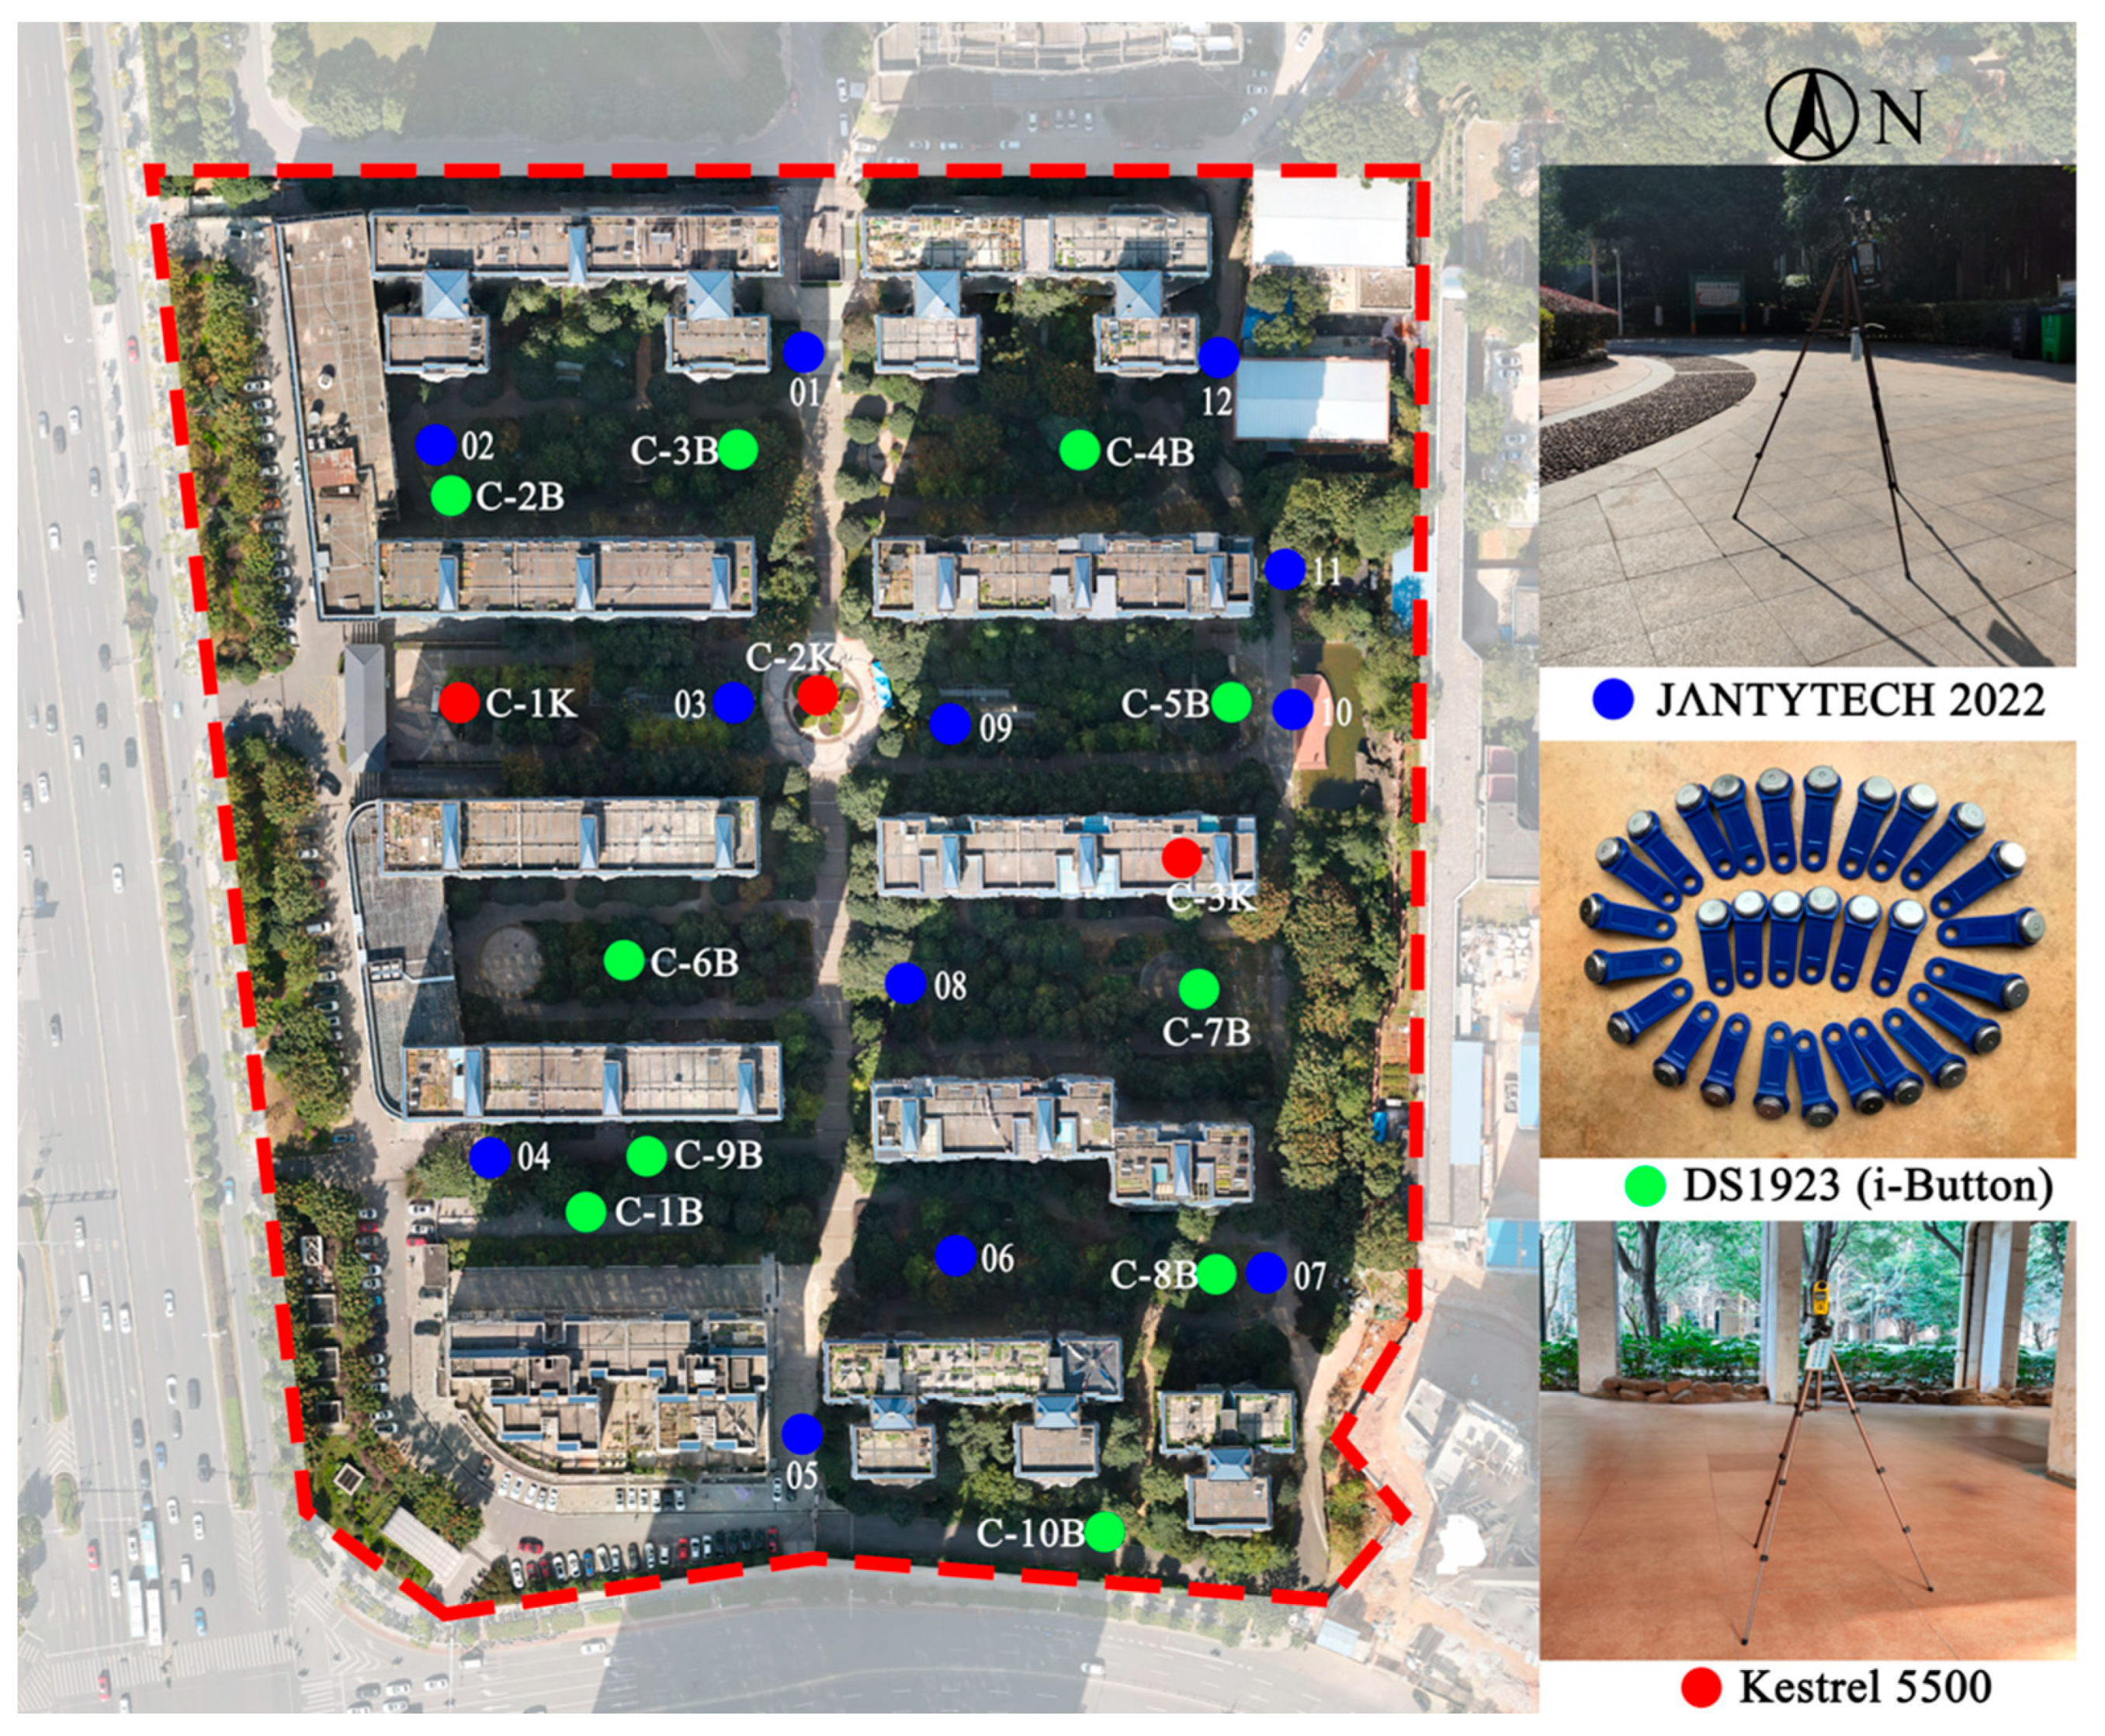
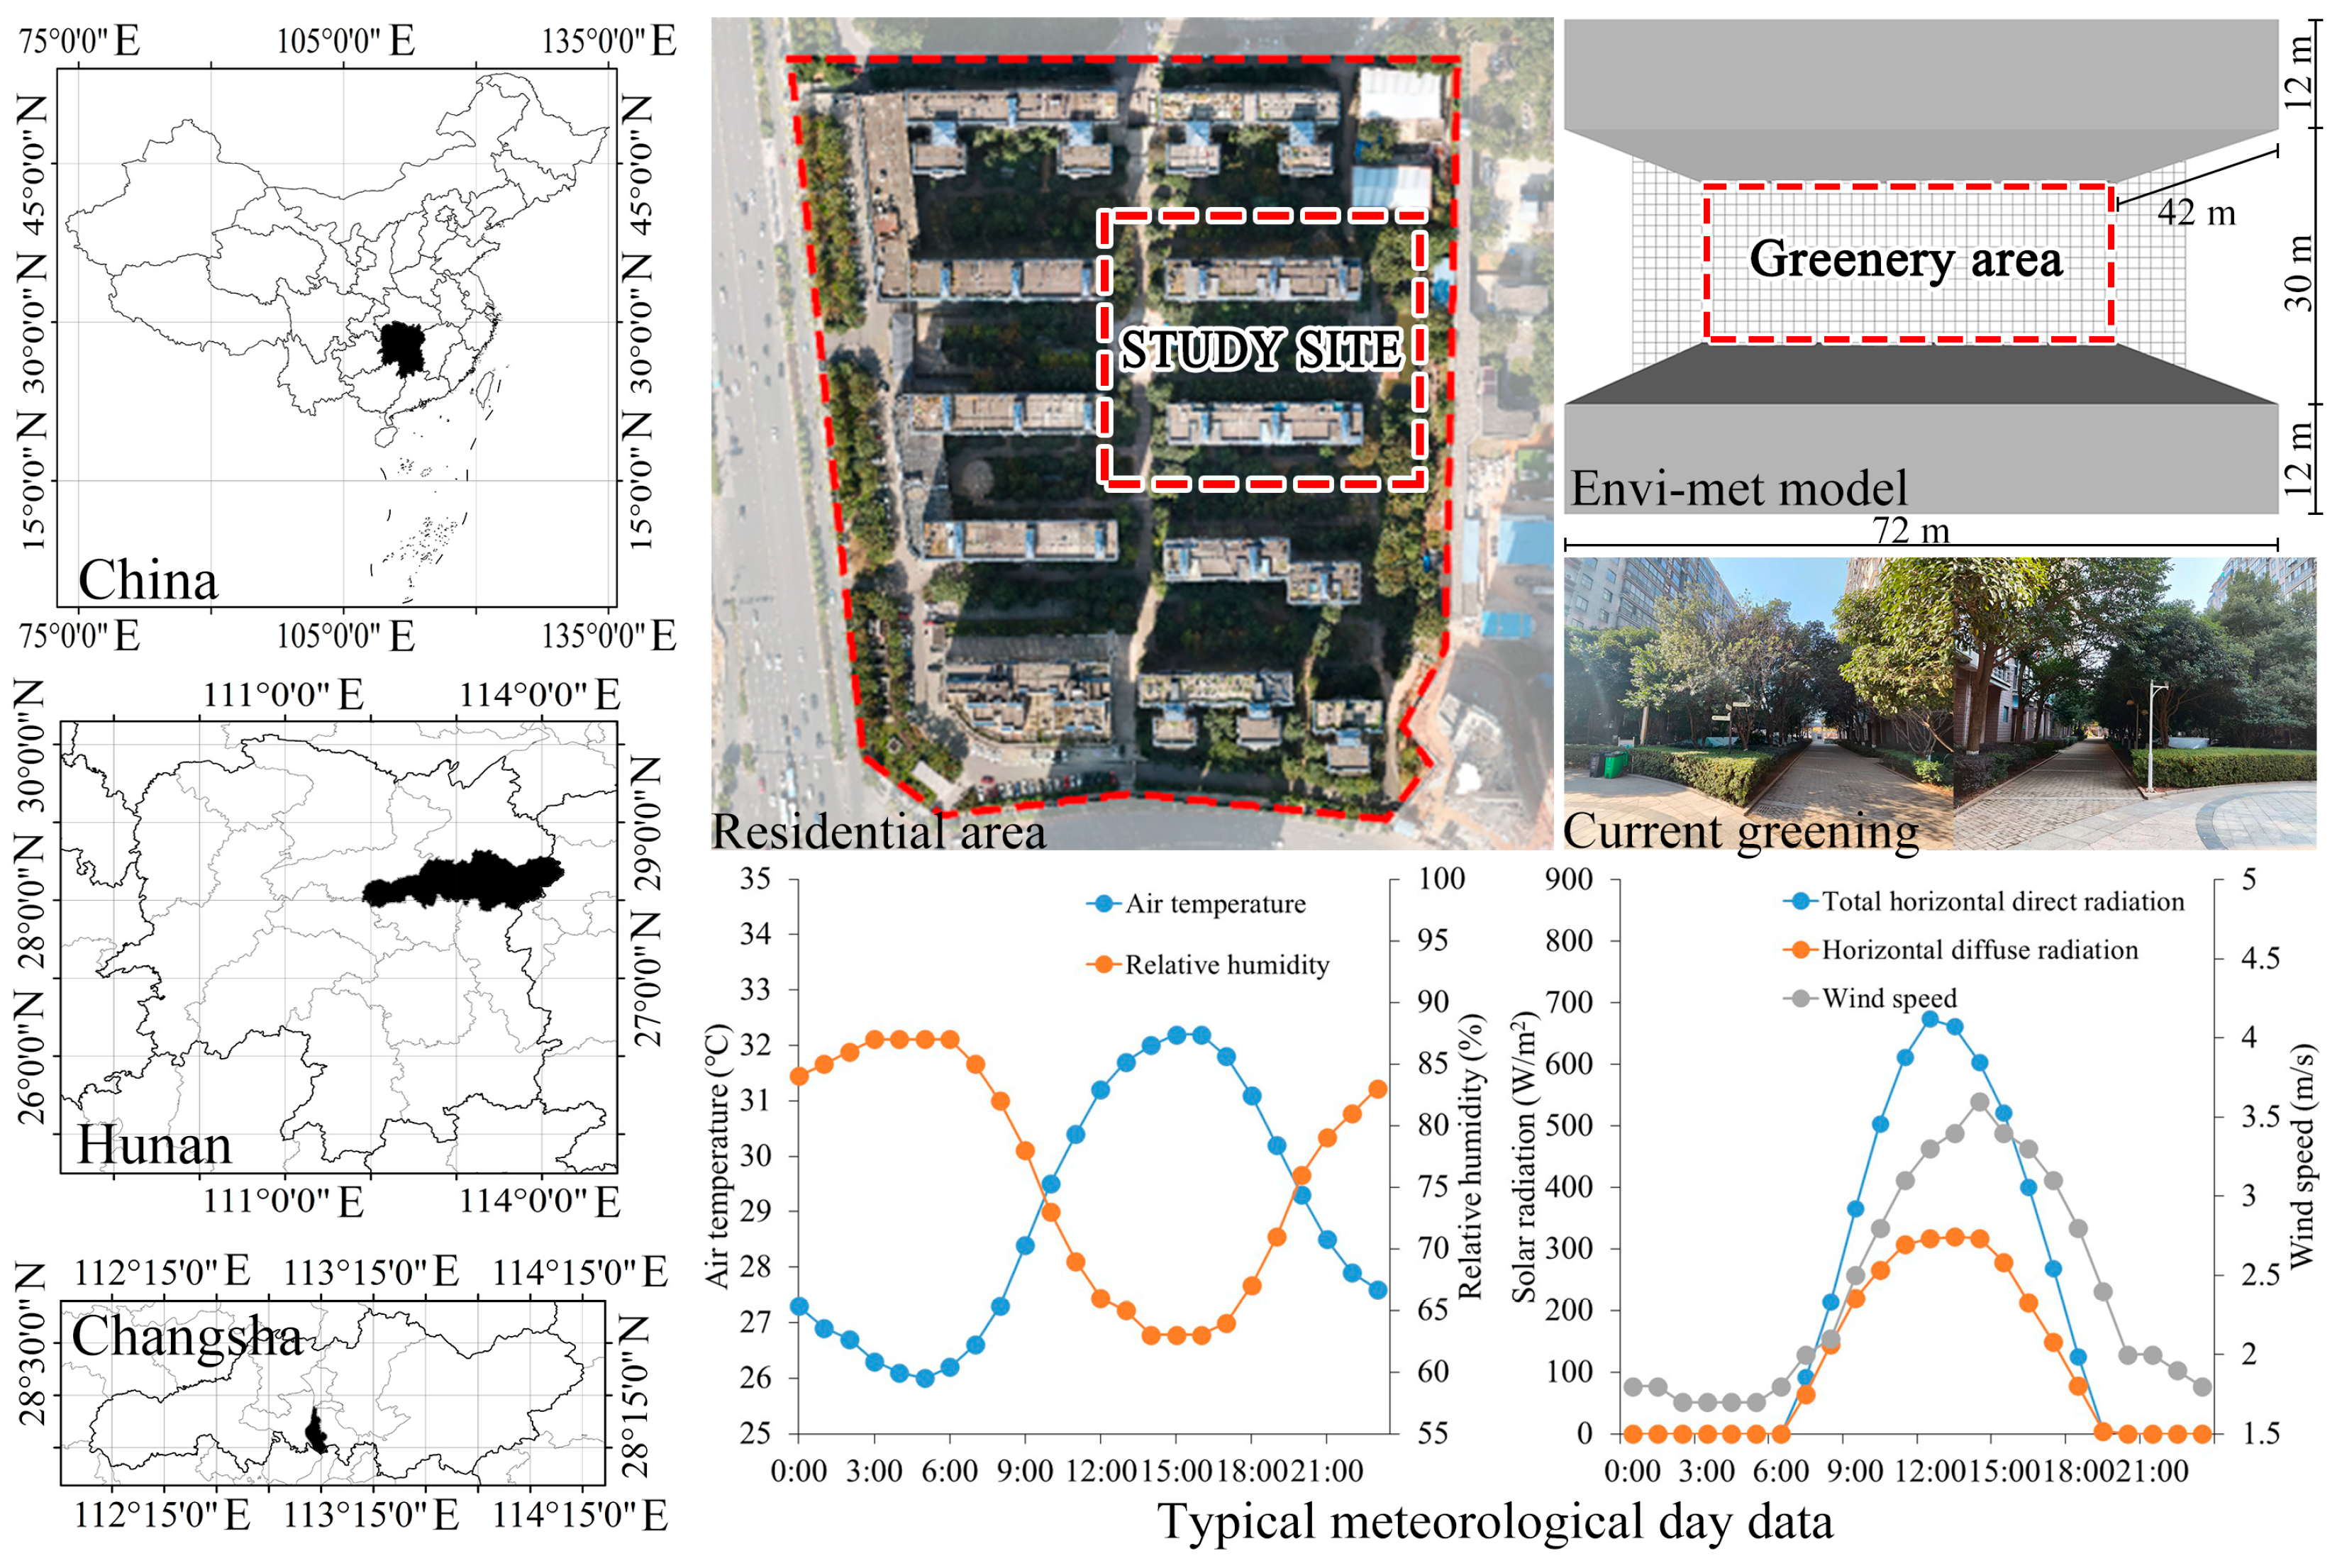
2.1. Research Background and Model Information

In residential areas, green space is the open area between buildings that is used for greenery. In this study, we selected a green space, shown in Figure 1, surrounded by two 42 m high buildings in a typical residential area, which is located in Changsha. The layout of the buildings is in rows and columns, the most common form in Changsha. The building has a length of 72 m, a width of 12 m, and a height of 42 m. The study site area is 3888 m2 (72 m × 54 m), and the green space area is 2160 m2 (72 m × 30 m). In the Envi-met model, the grid cell sizes in X, Y, and Z are 2, 2, and 3 m, respectively. In the classification of Köppen climate zones, Changsha belongs to the humid subtropical climate [27]. The climatic backdrop is a hot summer and cold winter [28], with a long duration of high temperatures in summer and winters which are wet and cold. In this context, it is relevant to study the summer thermal mitigation of residential green space in this region.
Envi-met (version 5.6.1) is employed to simulate the change in plant green volume in green space. Envi-met, as a hydrodynamic software, has an excellent ability to simulate natural plants [29,30]. It can simulate soil–plant–atmosphere interactions by importing meteorological data. Figure 1 illustrates the climatic characteristics of Changsha in summer. “Design standard for the thermal environment of urban residential areas” provides typical meteorological day data, consisting of air temperature, wind speed, relative humidity, and solar radiation [31]. The highest air temperature is 32.2 °C, while the mean air temperature for the day is 28.9 °C. In addition to high air temperature, high relative humidity is another significant feature, with the lowest relative humidity being 63% and the highest being 87%. Wind speed is high during the daytime and low at night. The highest wind speed can reach 3.6 m/s, and the mean wind speed is 2.4 m/s. The highest direct and diffuse radiation is 674 W/m2 and 320 W/m2, respectively. Based on these data, we can construct the models needed for the study. Figure 2 shows the simulation framework of Envi-met, which mainly includes building modeling, green space structure modeling, meteorological data input, simulation operation, and result output.

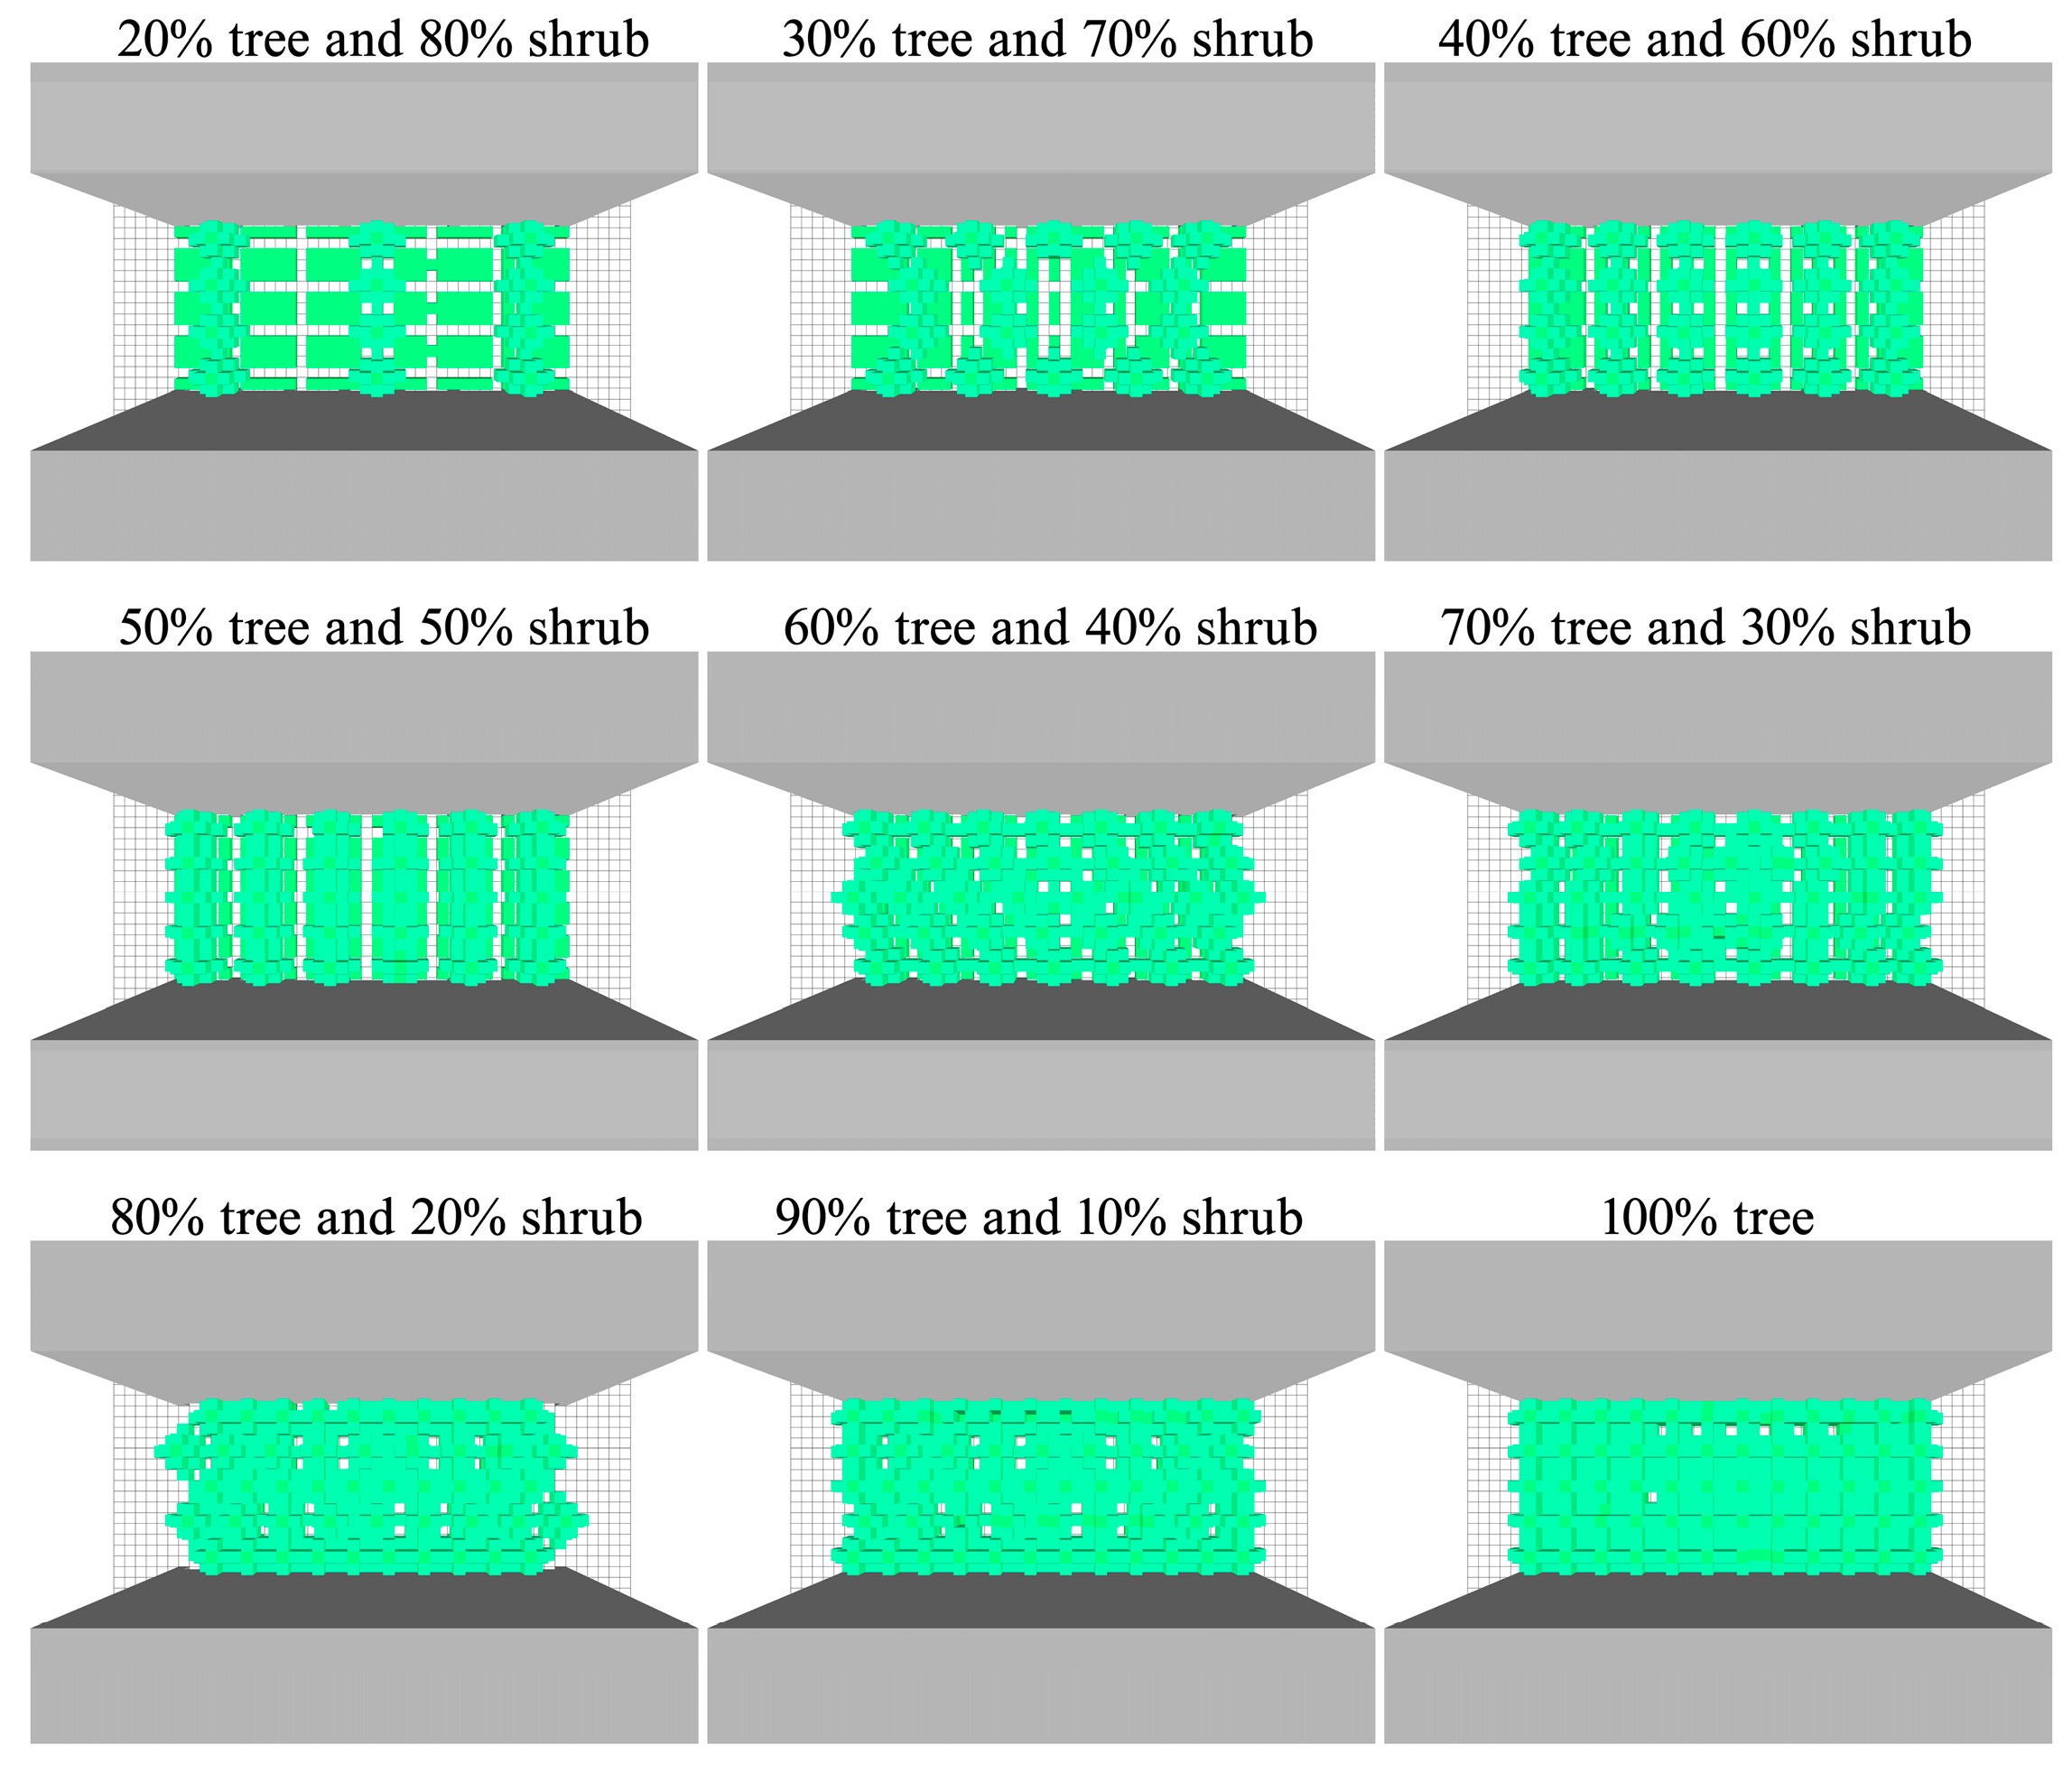
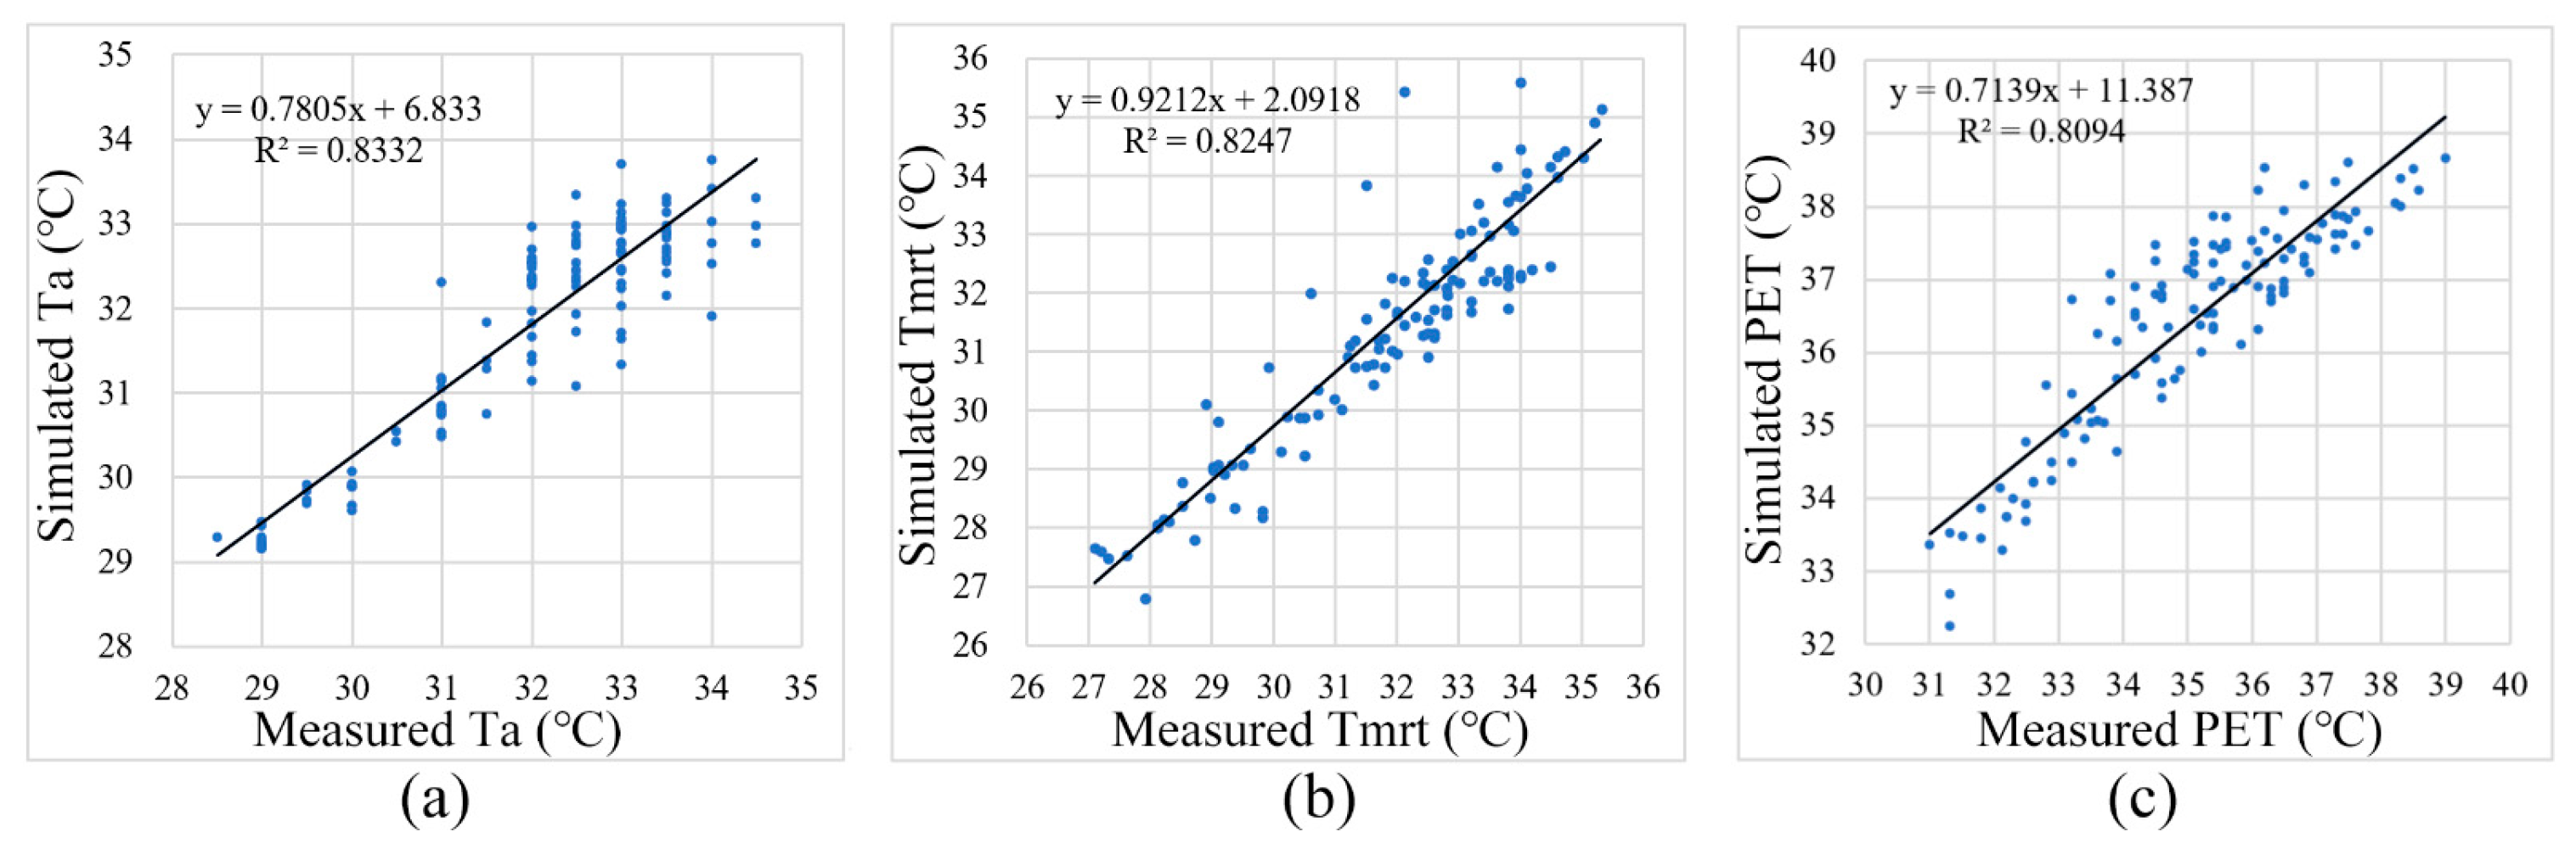
2.2. Residential Green Space Scenarios Setup and Envi-Met Verification

The GPR is an indicator used to measure the volume of green space [19], and many cities incorporate it into their evaluation index systems for measuring the quality of green space in residential areas. In our latest study, we discussed the effect of changes in GPR on thermal comfort and found that it was superior for the whole day when the GPR reached 2.5 [24]. However, the study only analyzed the changes in thermal comfort from the perspective of the total green volume of space. It did not further discuss the impact of changes in the green volume of trees, shrubs, and grasses on thermal comfort where the overall green volume is limited in green space. Furthermore, related studies aim to analyze the ideal green space patterns, ignoring the economic costs of green space construction in practice. Therefore, this study discusses the effect of variation in the green volume of plants on thermal mitigation and green space costs.
In this study, the total three-dimensional green volume of residential green space consists of the green volume of trees and shrubs, and Equation (1) describes the calculation of the total green volume. We constructed nine green space structures with an exact GPR of 2.5, as shown in Figure 3, where the green volume of trees increased from 20% to 100% in 10% intervals. Correspondingly, the green volume of shrubs decreased from 80% to 0. For the green space plant selection, we chose Cinnamomum camphora and Pittosporum tobira as green space plants, which are common trees and shrubs in residential areas in Changsha. Table 1 shows the original information on plants. The reason for at least 20% of the green volume of trees is that the standard of residential areas states that the green space must include a certain number of trees to create spatial shade [32]. As grass has a weak impact on the thermal environment and thermal comfort, this study did not consider the change in the green volume of grass. Based on Equation (1) and Table 1, it can be calculated that, when the green volume of trees is 20% and the green volume of shrubs is 80%, the corresponding number of plants is 12 trees and 320 shrubs, respectively. For every 10% increase in the green volume of trees, the number of trees increases by six plants. Correspondingly, the number of shrubs decreases by 40 plants. Furthermore, the cost of green space includes the material cost of trees and shrubs. According to Equation (2), the method of calculating the cost of green space is based on the unit price of plants and their quantity. Therefore, this study can analyze the relationship between the cost and thermal mitigation of green spaces.
G P R = a N a · π R a 2 · L A I a + b N b · π R b 2 · L A I b S
C O S T = 2380 · G P R · S · α π R a 2 · L A I a + 160 · G P R · S · β π R b 2 · L A I b
N a represents the number of trees, N b represents the number of shrubs, and S represents the area of the study site. α and β in Equation (2) are the green volume share of trees and shrubs, respectively. α took values in the range of 0.2 to 1.0 and β took values in the range of 0 to 0.8.
Before formal simulation, we need to verify the accuracy of Envi-met in a specific climatic backdrop. Our latest study has conducted field measurements and verified the accuracy of the Envi-met in residential green spaces, as shown in Figure 4. We used several instruments for the measurements, including JANTYHCH 2022, Kestrel 5500, and i-Button (Table A1). We collected the measured values on a summer day and compared them with the simulated values, which Envi-met calculated. Figure 4 shows that they have a significant correlation. The R2 (correlation coefficients) of air temperature, Tmrt (mean radiant temperature), and PET (physiological equivalent temperature) were 0.833, 0.825, and 0.809, respectively. The closer R2 is to 1, the higher the degree of explanation of the simulated data to the measured data. The R2 in this study are all higher than 0.8, which is powerfully explanatory. This experiment proves that Envi-met-simulated results of thermal environment parameters in green spaces are scientific and valid.

3. Results

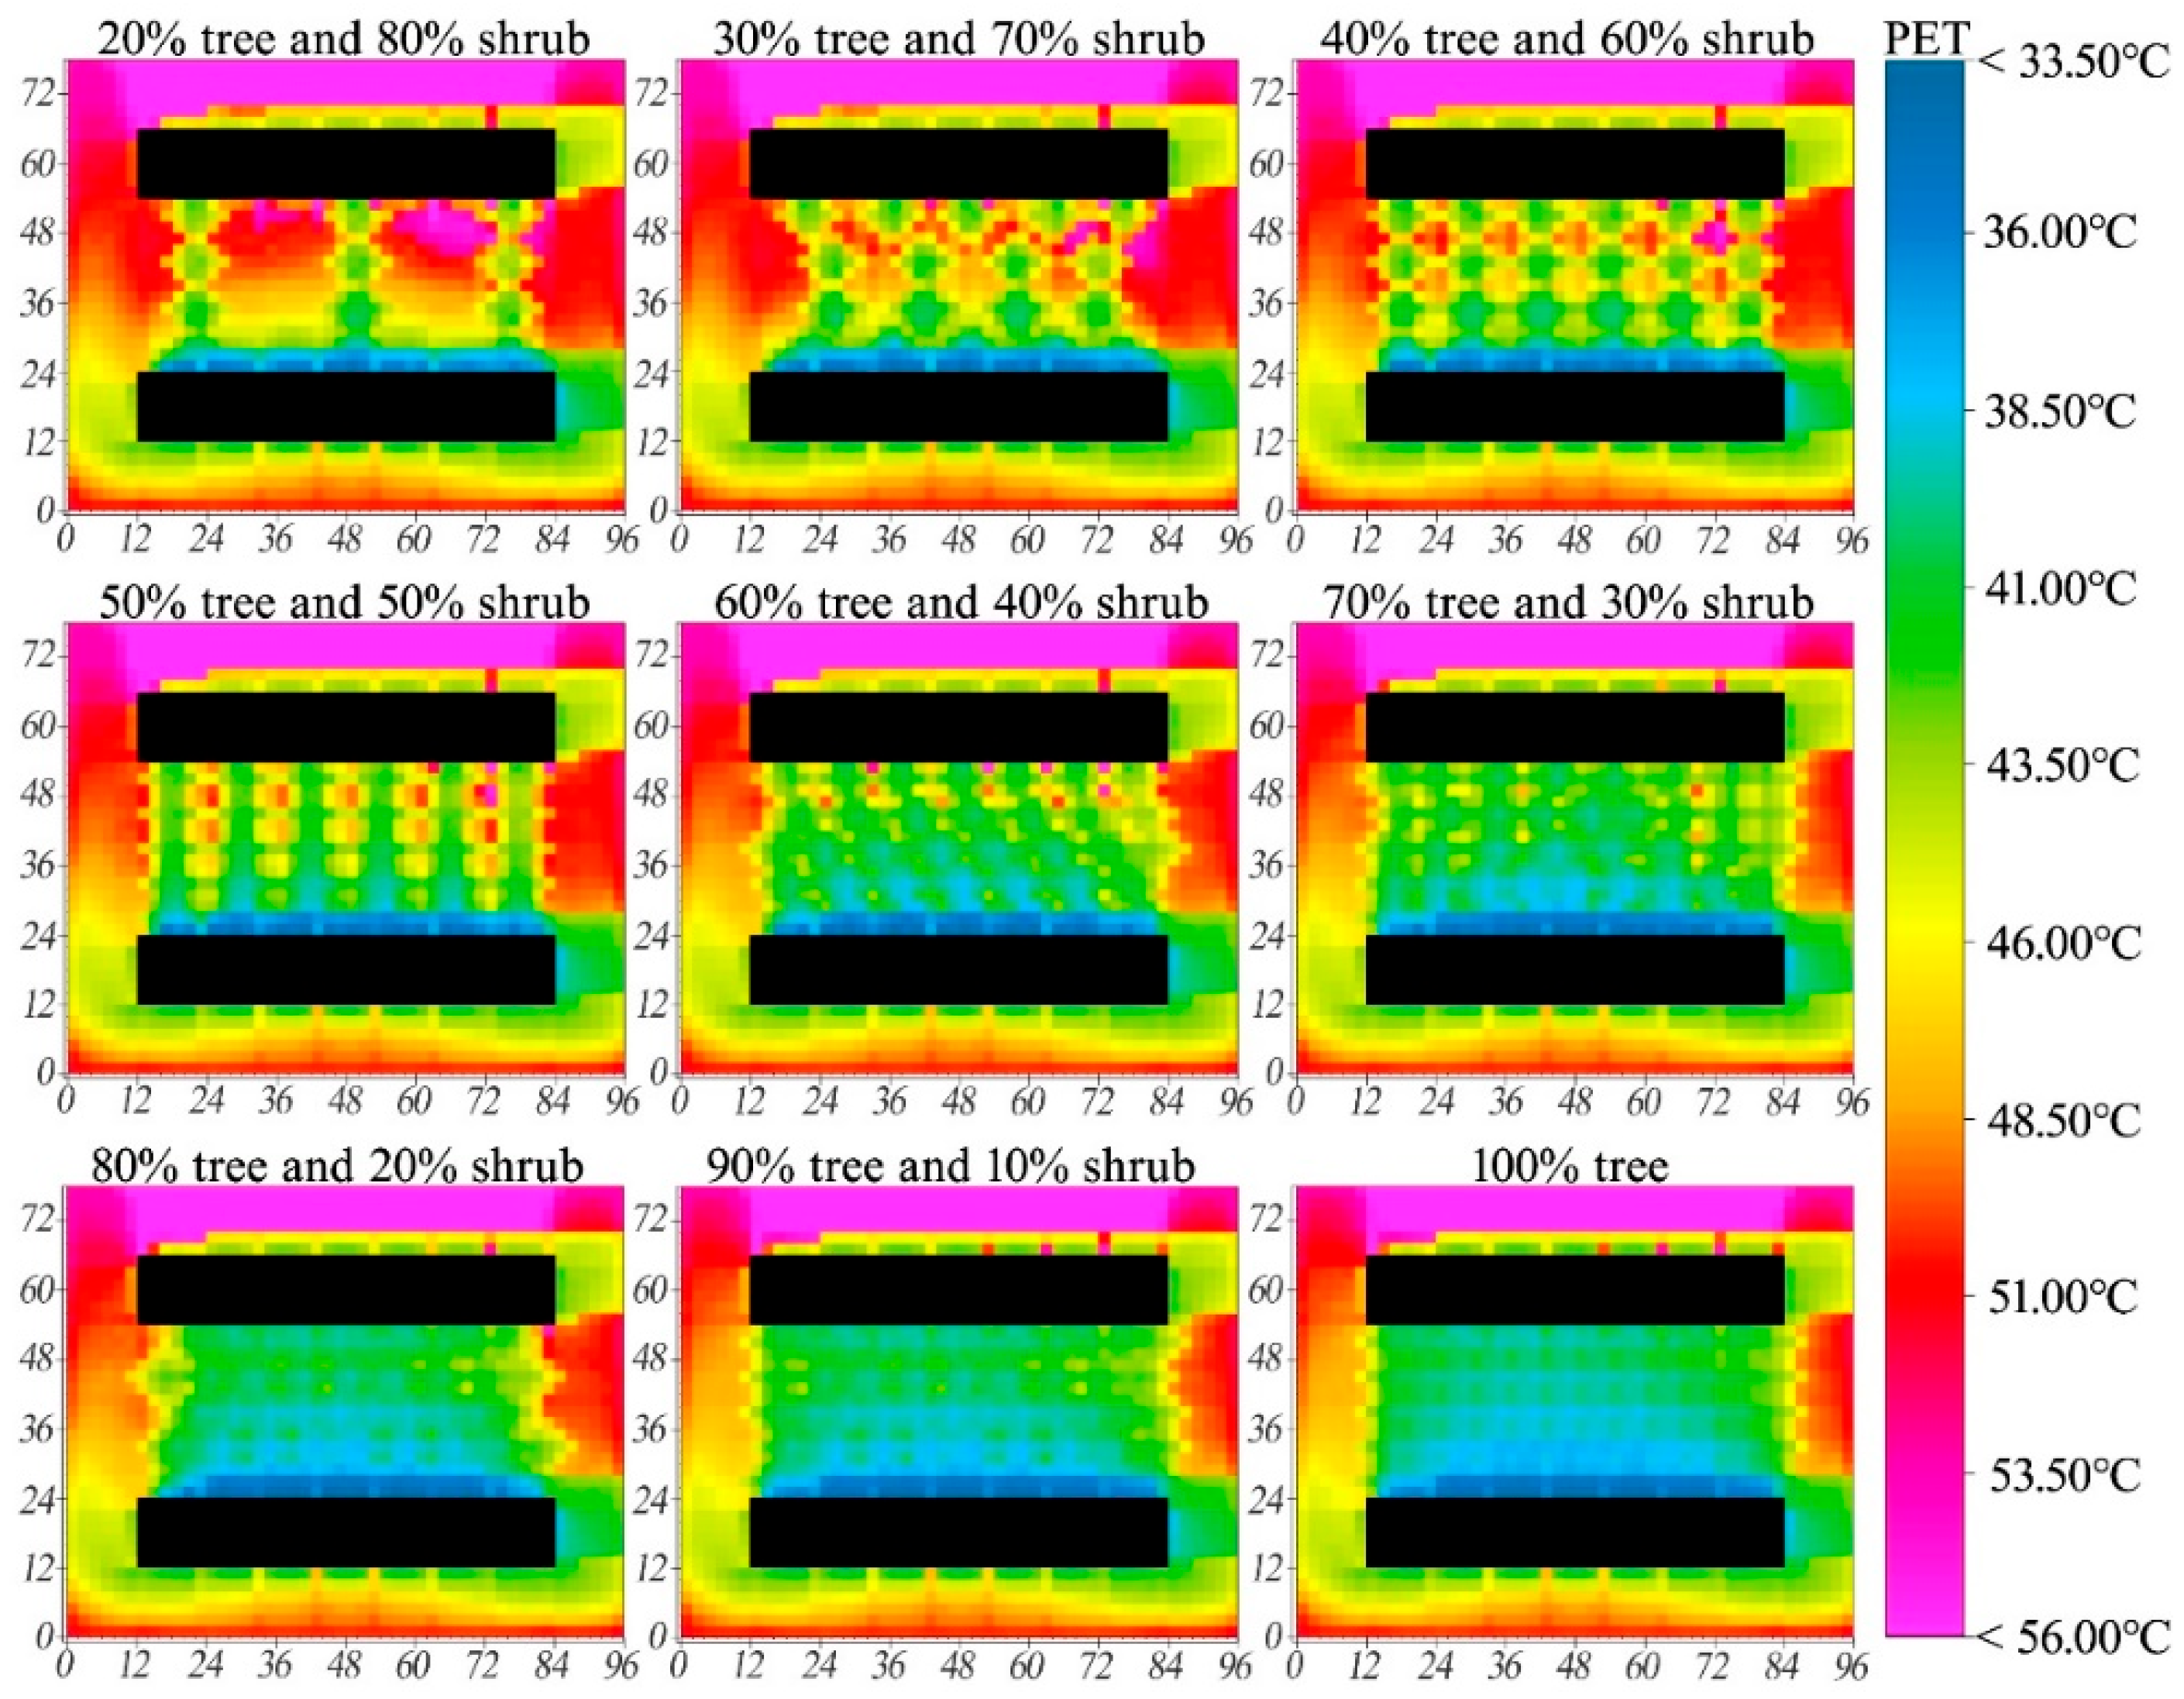
3.1. The Thermal Comfort of Nine Green Space Scenarios

We analyzed the outdoor thermal mitigation of nine residential green space scenarios under typical summer weather day conditions, and Figure 5 shows the outdoor PET distribution of the nine residential green space scenarios. The PET reflects human thermal comfort calculated based on air temperature, relative humidity, wind speed, and mean radiant temperature. The PET corresponds to the level of human thermal perception (Table 2) [33,34]. It is used to characterize the thermal mitigation of green space. In Figure 5, the spatial heterogeneity of the PET in residential green space is evident with the increase in the green volume of trees. With the PET gradually decreasing, the thermal comfort is improved.
Figure 6 shows the outdoor PET variations for the nine scenarios, and each data are the average of the greenery area. As the green volume of trees increases from 20% to 100% and the green volume of shrubs decreases from 80% to 0, PET begins to decrease dramatically in the spatial and temporal distributions, which means the thermal comfort is mitigated significantly under equal total green volume. Thermal mitigation is concentrated in daytime hours, most pronounced at 14:00 h. We compared the PET of the nine green space scenarios at 14:00 h, finding that the PET decreased by 6.79 °C with an increase in the green volume of trees from 20% to 100%. Where the green volume of trees increases to 70%, the PET decreases near 41 °C, indicating that extreme heat stress is alleviated. As the green volume of trees exceeds 70%, all-day thermal comfort is relieved from “extreme heat stress” to “intense heat stress” and below. Furthermore, between 18:00 and 5:00 the next day, for every 10% increase in the green volume of trees, the mean PET only decreased by 0.03 °C, which suggests that changes in green space structures have a weak effect on night-time thermal mitigation.
The study calculated the mean PET during the daytime (8:00–18:00) and compared it to the PET at 14:00 (Figure 7). Despite the numerical differences between the mean PET and the 14:00 PET, the trend in the two data sets was in 99% agreement. The outdoor PET decreased at different rates where the green volume of trees increased and the green volume of shrubs decreased. For each 10% increase in the green volume of trees during the sequential increase from 20% to 100%, the mean thermal mitigation of the green space was 0.67 °C and 0.85 °C for the mean daytime and 14:00, respectively. With the green volume of trees increased from 60% to 70%, the thermal mitigation of the green space during the daytime was 0.60 °C, which is below 0.67 °C. Furthermore, the thermal mitigation at 14:00 was 0.84 °C, below 0.85 °C. By analyzing the thermal mitigation of the green space during the daytime, we found that the mitigation generated by increasing the green volume of trees from 20% to 60% accounted for 67.59% of the total mitigation. In contrast, the mitigation of increasing the green volume of trees from 60% to 100% was only 32.41%, less than half of the 67.59%.

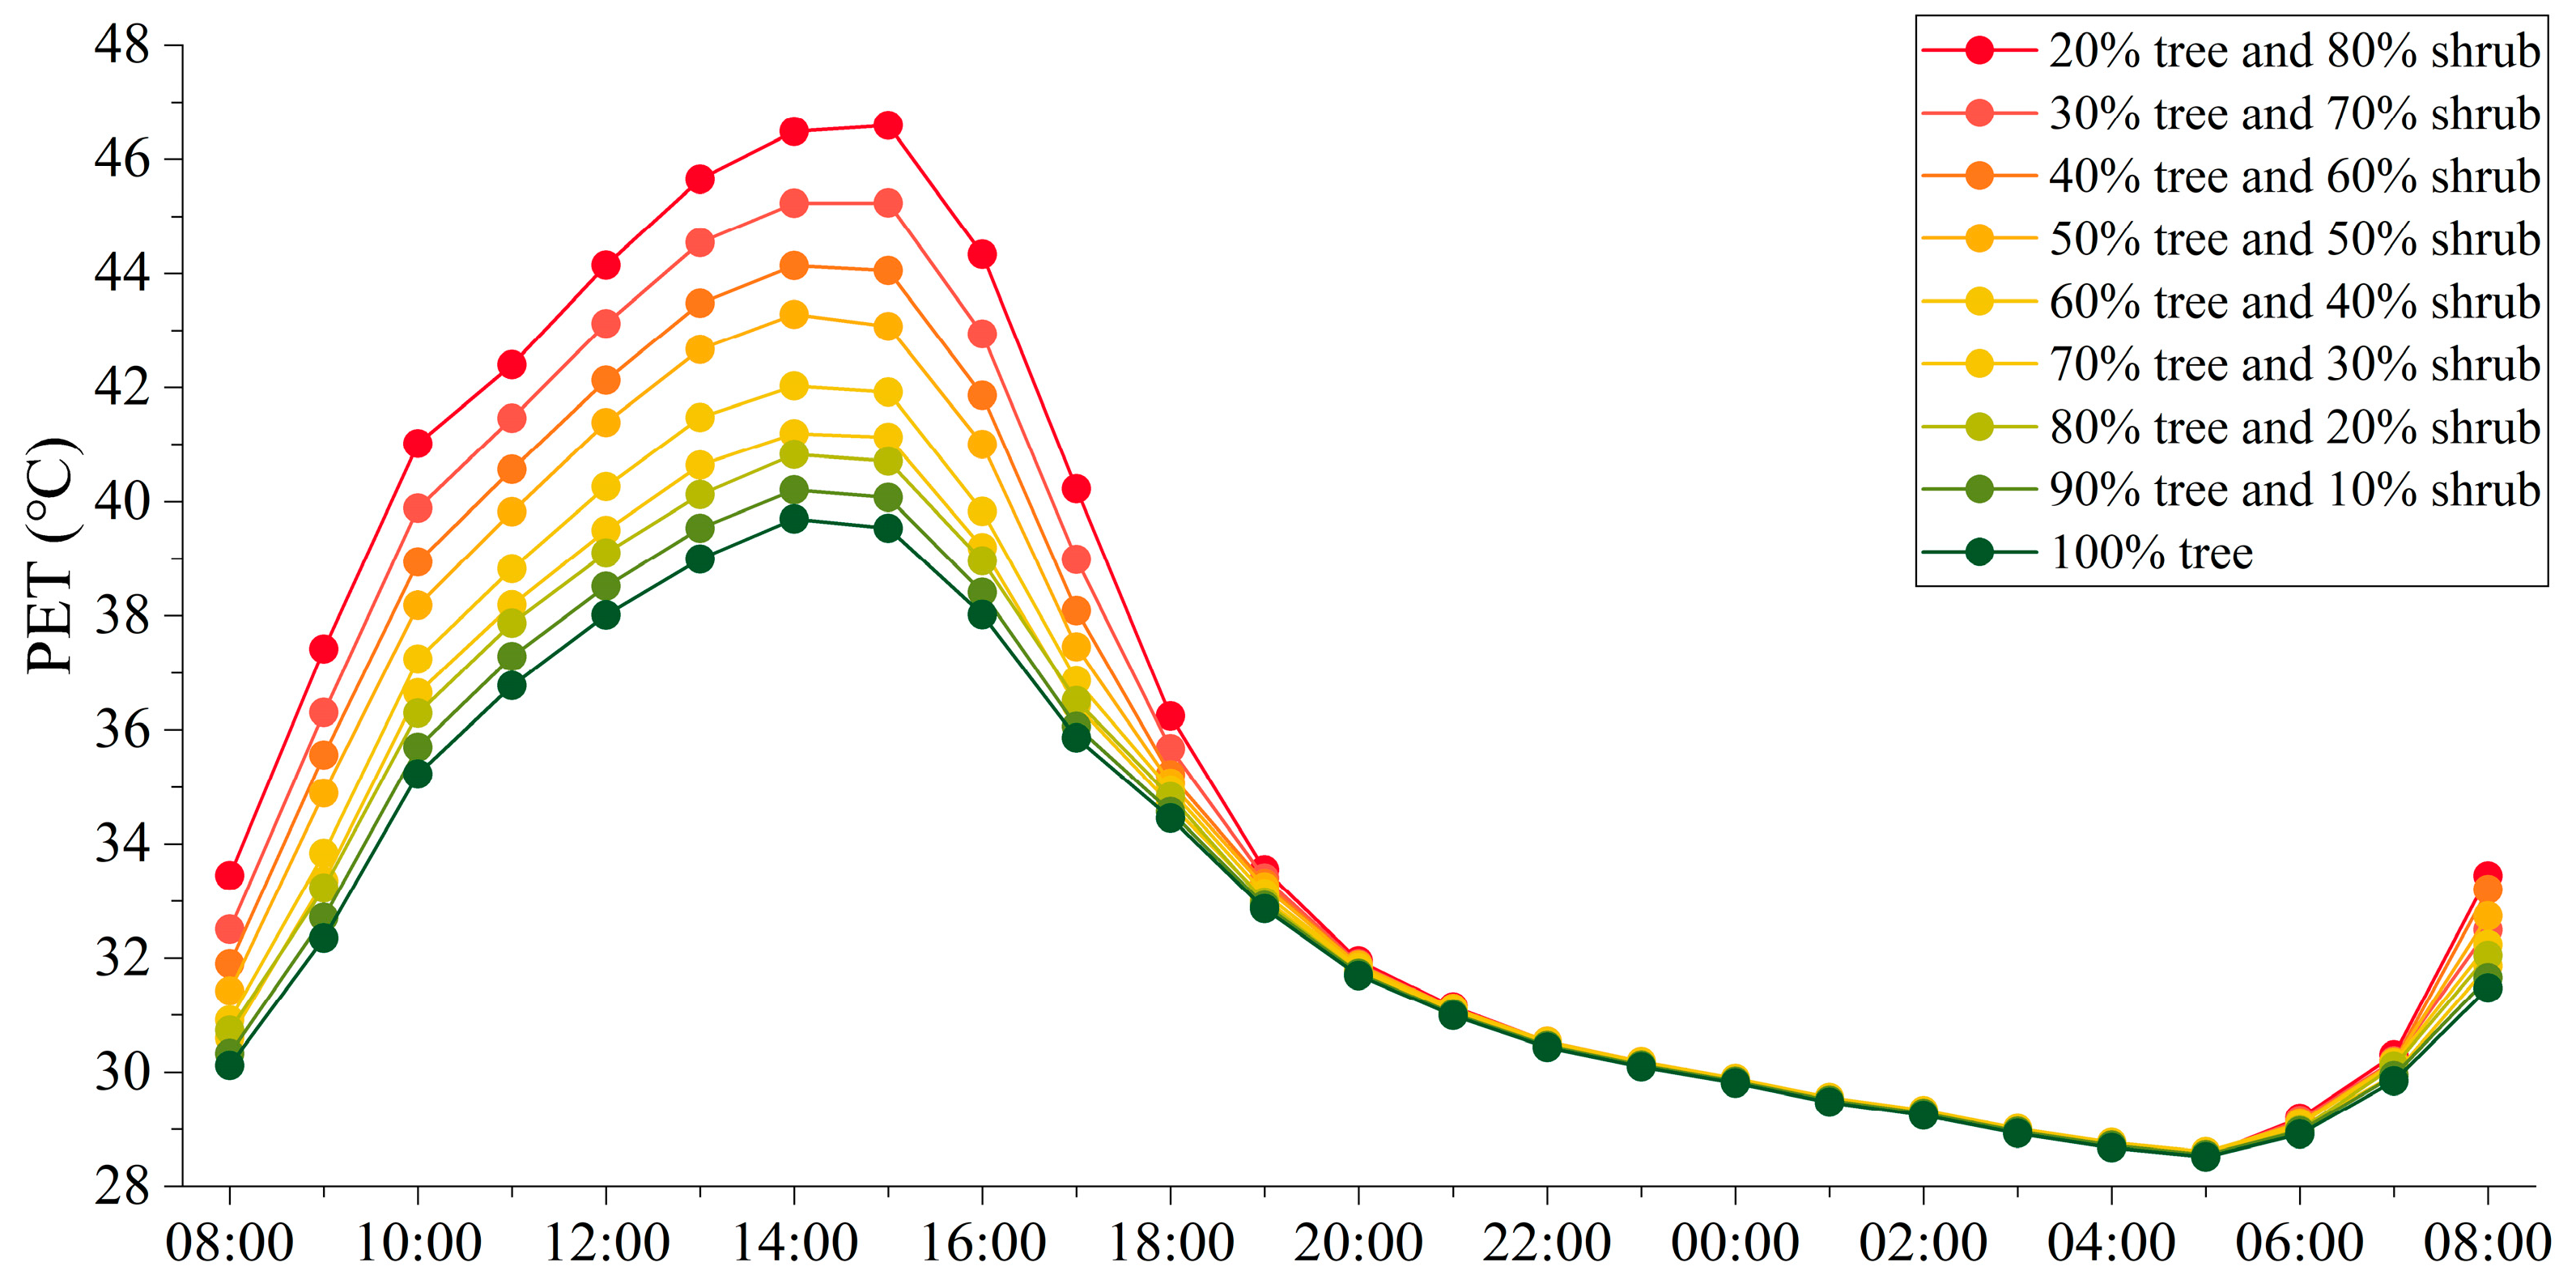
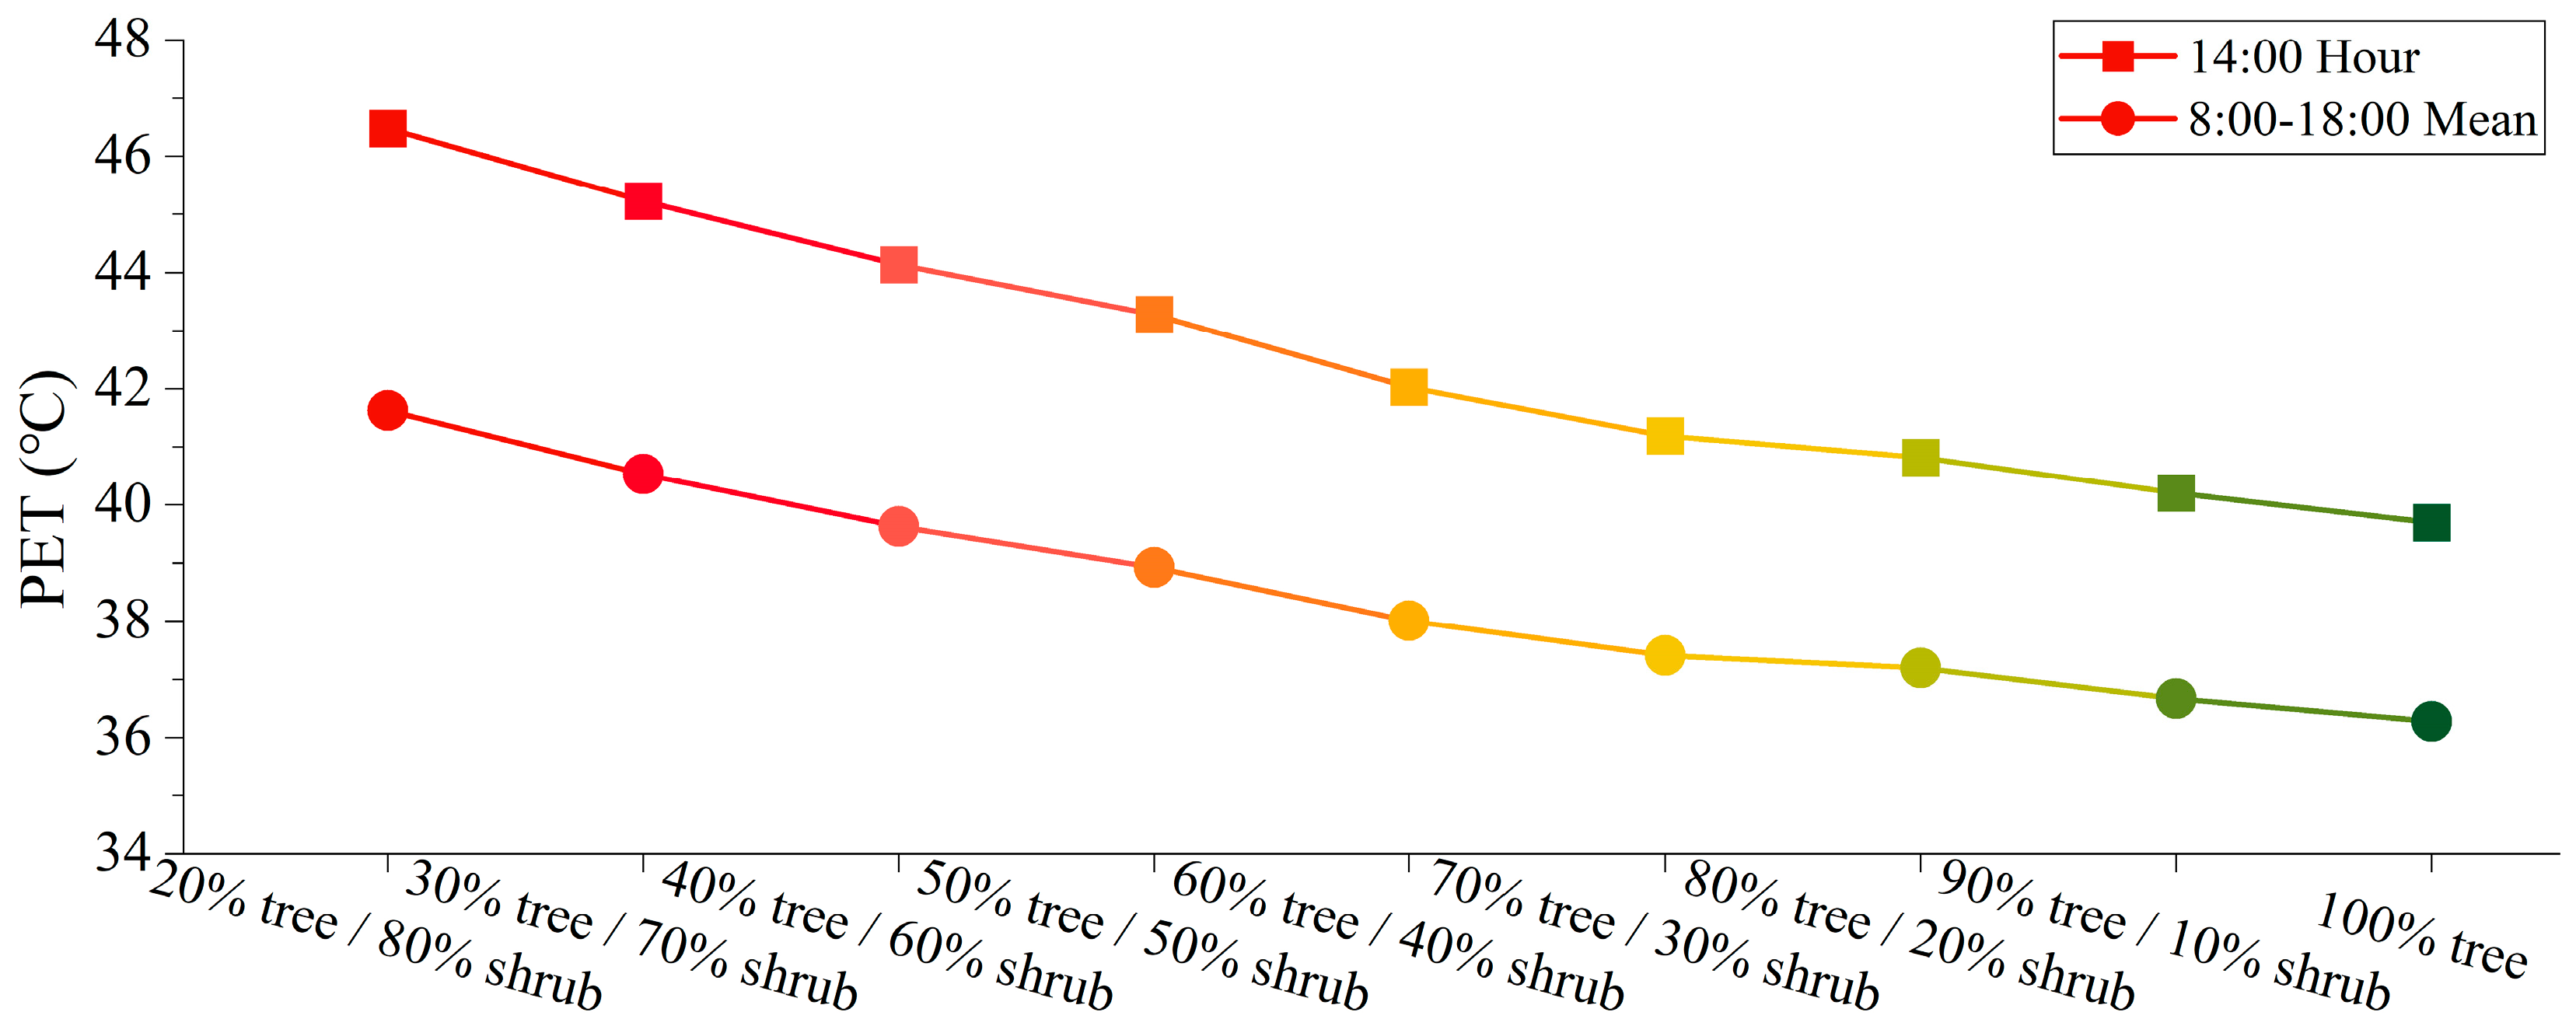
3.2. The Thermal Mitigation and Economics of Nine Scenarios

We further analyzed the impact of nine green space scenarios on outdoor thermal mitigation. Figure 8 illustrates the linear relationship between the green volume of trees and outdoor PET in two separate phases, including the green volume of trees increasing from 20% to 60% and 60% to 100%. Since the thermal mitigation effect of green space is already below average when the green volume of trees increases above 60%, we chose 60% as the distinction point between the two phases. The fitted equations revealed that, when the green volume of trees was within 60%, the thermal mitigation was more than twice as high per unit increase in green as when it was above 60%.
Figure 9 shows the relationship between the cost of the nine green space scenarios, the percentage of green volume of trees and shrubs, and the change in mean PET during daytime hours. The cost of green space includes the material cost of trees and shrubs. In Figure 9, the x-axis represents the green volume of trees, which increased from 20% to 100% while the corresponding green volume of shrubs decreased from 80% to 0, and the y-axis represents the PET and economic cost, respectively.
With the increase in the green volume of trees, the cost of green space increased and the PET decreased. When the green volume of trees increased from 20% to 40%, the cost increased to CNY 95,892 and the PET decreased by 2.00 °C. When the green volume of trees increased from 40% to 60%, the cost increased to CNY 111,528 and the PET decreased by 1.62 °C. When the green volume of trees is in the range of 20% to 60%, with each increase of CNY 7812, the thermal mitigation of the green space rises up to 0.90 °C. However, with the green volume of trees in the range of 60% to 100%, thermal mitigation of the green space is 0.43 °C for every CNY 7812 increase in cost. The results indicate that spending more on increasing the green volume of trees does not substantially and consistently improve the thermal comfort of the green space where the volume reaches a certain amount.

4. Discussion

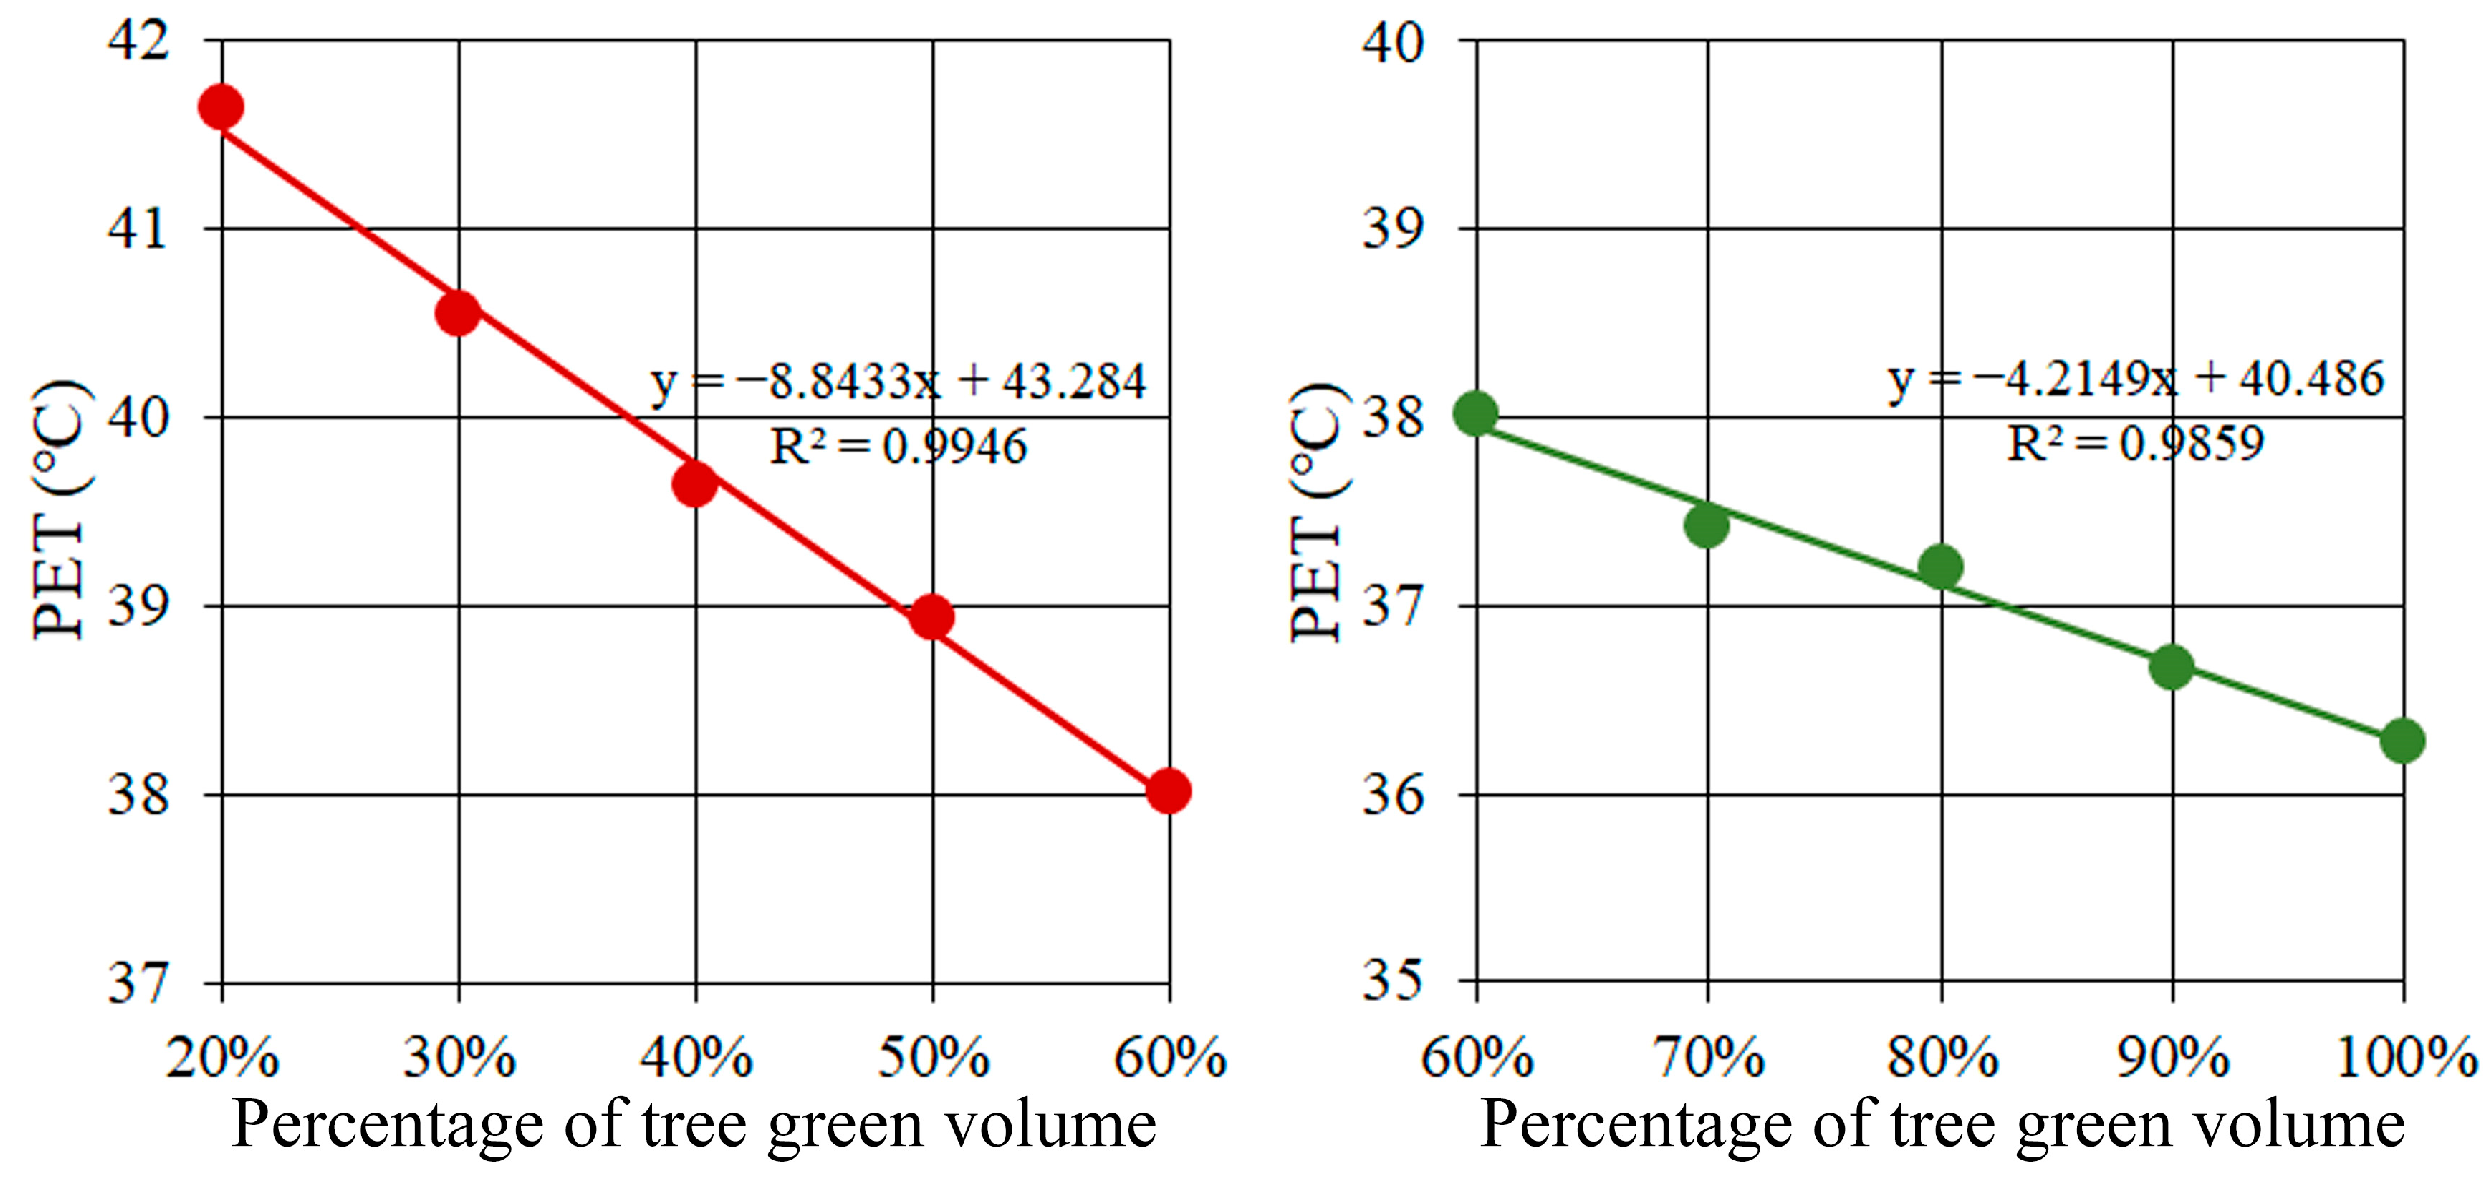
4.1. Analysis of Differences in Thermal Mitigation of Green Space Scenarios

Different green space structures affect outdoor thermal comfort effectively. Essentially, it is caused by the differences in the distribution of green volume in residential green spaces. In this study, we developed nine scenarios for residential green spaces where the green volume of trees increased from 20% to 100%. The increase in the green volume of trees implies a higher leaf area density at the height of the tree canopy, which results in more significant shading and transpiration from the tree canopy [35]. Furthermore, canopy shading effectively reduces the amount of solar radiation received at ground level and was proven to be one of the most critical ways trees can improve thermal comfort [36,37]. Specifically, in this study, where the green volume of trees increased to 100%, the mean Tmrt of the whole day was reduced by 5.08 °C. Transpiration from plant leaves effectively reduces air temperature and increases relative humidity, positively improving thermal comfort [38]. The outdoor air temperature was reduced by 0.70 °C when the tree green volume increased from 20% to 100%. Shrubs increase relative humidity at their nearby heights [39]. However, this effect is weak in regard to improving thermal comfort in sun-exposed environments.
A sustained increasing green volume of trees did not continually significantly improve thermal comfort. We found that the thermal mitigation of green space differed between the 20%–60% and 60%–100% stages, with the thermal mitigation of the former being twice that of the latter because, where the green volume of trees reaches a specific value, the shading effect of greenery is no longer significant. Furthermore, with the total green volume of residential green space being constant, the increase in the green volume of trees will inevitably lead to a decrease in the green volume of shrubs. The mean wind speed at the pedestrian height increased by 0.23 m/s when the percentage of shrubs was reduced from 80% to 0, and this increase directly contributed to thermal mitigation. Typically, high wind speed creates a cozier environment in summer and may notably exacerbate the outdoor cold in winter [40]. Therefore, considering the annual climate change in hot summer and cold winter cities, the residential green space structure of matching trees and shrubs is suitable.

4.2. Residential Green Space Structure Proposals Based on Thermal Mitigation and Costs

The study aims to guide residential green space structures, and we integrate the relationship between thermal mitigation and the economics of green spaces within limited green volume. In reality, a high green volume of trees implies high construction costs for green space with different plant prices [41]. From the perspective of residential thermal comfort, harmonizing the relationship between green space construction costs and thermal mitigation will directly guide realistic green space structures in cities. According to the analytical results, we found that for every CNY 7812 increase in cost, the PET decreased by 0.90 °C when the trees were between 20% and 60%. With the green volume of trees above 60%, the increase in cost only caused a decrease in the PET of 0.43 °C. This means that, when the green volume of trees reaches a specific value, the green space’s thermal comfort can not be improved constantly. For sustainable urban development, results indicate that it is uneconomical to continue to increase the percentage of trees. This study suggests that the green volume of trees in residential green spaces should be maintained at 60%–70% and the corresponding green volume of shrubs should be controlled at 30% to 40%. Our findings will advance the goal of sustainable green space development in residential areas. The study area has a humid subtropical climate. As a natural cooling strategy, green space can effectively mitigate the high summer temperatures in this region, and our findings provide a direct reference for green space design in its residential areas. Although these findings may not be precisely applicable to other climates because of climatic differences, green space structures suitable for other climate zones can also be obtained with our methodology.
This study evaluates the impact of changes in green space structures on thermal mitigation and costs under a constant green volume. An excessive green volume of trees will cause more costs without providing significant thermal mitigation. Admittedly, our study has the following limitations for future discussion. First, an attempt is made in future studies to analyze the effect of changes in green space structure on thermal comfort under different seasons, especially in winter. Second, the study selected a 14-floor-high residential area for analysis. In the subsequent study, we need to consider different floor heights of residential areas and develop green space structure standards, which will provide theoretical references for policymakers or municipal authorities. Finally, we will consider a broader range of plant choices and analyze the impact of tree and shrub pairings of high, medium, and low leaf area index plants on the thermal mitigation and costs of green space.

5. Conclusions

For sustainable residential green space planning and design, this study analyzed the impact of green space structures on thermal comfort and practical economics under a constant green volume. The findings will provide practical improvements for residential green space structures. By increasing the green volume of trees, thermal mitigation increases, and so does the economic cost of green space. When the green volume of trees increased from 20% to 100%, the PET decreased by 5.36 °C. The highest PET is below 41 °C as the green volume of trees is above 70%, which means no extreme heat stress moments throughout the whole day. Although the increase in the economic cost of green space is the same, the thermal mitigation is halved, where the green volume of trees is between 60% and 100% compared to the green volume between 20% and 60%. When the green volume of trees is less than 60%, the thermal mitigation benefit is 0.90 °C per 10% increase in green volume. The mitigation is less than 0.45 °C when the green volume exceeds 60%. Spending more to increase the green volume of trees will not significantly improve the thermal mitigation of residential green spaces. The practical green space planning should control the tree-to-shrub green volume ratio. In residential green spaces, we should pay attention to thermal mitigation and economics to provide practical implementation references.
This study focused on the impacts of structural changes in green spaces in residential areas on thermal mitigation and costs, rationally balancing the thermal mitigation and economic costs of green volume. It provided a reference model for green space design in residential areas from the perspective of three-dimensional green volume and economic cost, which is helpful for the quality of green space improvement and sustainable social development. In the future, our research will adopt more methods to evaluate and improve the quality of green spaces from multiple perspectives and to clarify the importance of green spaces to residents.

Author Contributions

Conceptualization, Z.L.; methodology, Z.L.; software, Z.L. and B.Z.; validation, B.Z. and Z.Q.; formal analysis, Z.L.; investigation, Z.L.; resources, X.L. and B.Z.; data curation, Z.L.; writing—original draft preparation, Z.L.; writing—review and editing, Z.L. and X.L.; visualization, Z.L.; supervision, B.Z. and X.L.; project administration, B.Z. and X.L.; funding acquisition, Z.L., B.Z. and X.L. All authors have read and agreed to the published version of the manuscript.

Funding

This research was funded by the Hunan Provincial Innovation Foundation for Postgraduate, grant number CX20230144; the Hunan Provincial Natural Science Foundation, grant number 2023JJ30693.

Data Availability Statement

Data are available upon request by contacting the correspondence.

Conflicts of Interest

The authors declare no conflicts of interest.

Appendix A

Table A1 and Figure A1 describe measuring instruments and field measurements.
Table A1. Information on measuring instruments [24].
InstrumentsIndicatorsInstrument Precision
JANTYTHCH 2022air temperature0.1 °C
wind speed0.1 m/s
black globe temperature0.1 °C
Kestrel 5500wind direction
wind speed0.1 m/s
DS1923 (i-Button)Ta/RH0.1 °C/0.1%
Figure A1. Measurement points and instrument layout in the study area [24].
Forests 15 01525 g0a1

References

  1. Huang, W.W.; Lin, G.S. The relationship between urban green space and social health of individuals: A scoping review. Urban For. Urban Green. 2023, 85, 127969. [Google Scholar] [CrossRef]
  2. Qi, J.D.; Lin, E.S.; Tan, P.Y.; Zhang, X.D.; Ho, R.G.; Sia, A.; Olszewska-Guizzo, A.; Waykool, R. Representing the landscape visual quality of residential green spaces in Singapore with 3D spatial metrics. Urban For. Urban Green. 2023, 90, 128132. [Google Scholar] [CrossRef]
  3. Yang, Y.J.; Zhou, D.; Wang, Y.P.; Meng, X.Z.; Gu, Z.L.; Xu, D.; Han, X.X. Planning method of centralized greening in high-rise residential blocks based on improvement of thermal comfort in summer. Sustain. Cities Soc. 2022, 80, 103802. [Google Scholar] [CrossRef]
  4. Yuan, Y.F.; Liao, Z.; Zhou, B.Q.; Zhai, P.M. Unprecedented Hot Extremes Observed in City Clusters in China during Summer 2022. J. Meteorol. Res. 2023, 37, 141–148. [Google Scholar] [CrossRef]
  5. Grilo, F.; Pinho, P.; Aleixo, C.; Catita, C.; Silva, P.; Lopes, N.; Freitas, C.; Santos-Reis, M.; McPhearson, T.; Branquinho, C. Using green to cool the grey: Modelling the cooling effect of green spaces with a high spatial resolution. Sci. Total Environ. 2020, 724, 138182. [Google Scholar] [CrossRef] [PubMed]
  6. Zhang, D.H.; Xie, X.; Zhou, C.S. Spatial influence of exposure to green spaces on the climate comfort of urban habitats in China. Urban Clim. 2023, 51, 101657. [Google Scholar] [CrossRef]
  7. Yin, J.; Ramanpong, J.; Chang, J.; Wu, C.D.; Chao, P.H.; Yu, C.P. Effects of blue space exposure in urban and natural environments on psychological and physiological responses: A within-subject experiment. Urban For. Urban Green. 2023, 87, 128066. [Google Scholar] [CrossRef]
  8. Juul, V.; Nordbo, E.C.A. Examining activity-friendly neighborhoods in the Norwegian context: Green space and walkability in relation to physical activity and the moderating role of perceived safety. BMC Public Health 2023, 23, 259. [Google Scholar] [CrossRef] [PubMed]
  9. Xia, T.Y.; Zhao, B.; Xian, Z.; Zhang, J.G. How to Systematically Evaluate the Greenspace Exposure of Residential Communities? A 3-D Novel Perspective Using UAV Photogrammetry. Remote Sens. 2023, 15, 1543. [Google Scholar] [CrossRef]
  10. Gomaa, M.M.; El Menshawy, A.; Nabil, J.; Ragab, A. Investigating the Impact of Various Vegetation Scenarios on Outdoor Thermal Comfort in Low-Density Residential Areas of Hot Arid Regions. Sustainability 2024, 16, 3995. [Google Scholar] [CrossRef]
  11. Li, J.Y.; Zheng, B.H.; Bedra, K.B. Evaluating the improvements of thermal comfort by different natural elements within courtyards in Singapore. Urban Clim. 2022, 45, 101253. [Google Scholar] [CrossRef]
  12. Wang, H.H.; Cai, Y.; Deng, W.F.; Li, C.; Dong, Y.; Zhou, L.; Sun, J.Y.; Li, C.; Song, B.Z.; Zhang, F.F.; et al. The Effects of Tree Canopy Structure and Tree Coverage Ratios on Urban Air Temperature Based on ENVI-Met. Forests 2023, 14, 80. [Google Scholar] [CrossRef]
  13. Zhu, R.R.; Liu, Y.B.; Yan, B.W.; Zhang, X.T.; Yuan, L.Y.; Wang, Y.F.; Pan, Y.T. Effects of district parameters, green space and building density on thermal comfort—A case study of Badaguan District in Qingdao. Case Stud. Therm. Eng. 2023, 42, 102705. [Google Scholar] [CrossRef]
  14. Mihara, K.; Hii, D.J.C.; Takasuna, H.; Sakata, K. How does green coverage ratio and spaciousness affect self-reported performance and mood? Build. Environ. 2023, 245, 110939. [Google Scholar] [CrossRef]
  15. Kim, S.W.; Brown, R.D. Pedestrians’ behavior based on outdoor thermal comfort and micro-scale thermal environments, Austin, TX. Sci. Total Environ. 2022, 808, 152143. [Google Scholar] [CrossRef]
  16. Lin, C.; Yang, J.H.; Huang, J.; Zhong, R.Z. Examining the Effects of Tree Canopy Coverage on Human Thermal Comfort and Heat Dynamics in Courtyards: A Case Study in Hot-Humid Regions. Atmosphere 2023, 14, 1389. [Google Scholar] [CrossRef]
  17. Zhao, Y.; Yang, J.H.; Fang, Z.S.; Zhang, X.; Guo, T.Y.; Li, Y.K. Passive design strategies to improve student thermal comfort: A field study in semi-outdoor spaces of academic buildings in hot-humid areas. Urban Clim. 2024, 53, 101807. [Google Scholar] [CrossRef]
  18. Li, Y.N.; Lin, D.L.; Zhang, Y.H.; Song, Z.P.; Sha, X.H.; Zhou, S.Q.; Chen, C.; Yu, Z.W. Quantifying tree canopy coverage threshold of typical residential quarters considering human thermal comfort and heat dynamics under extreme heat. Build. Environ. 2023, 233, 110100. [Google Scholar] [CrossRef]
  19. Ong, B.L. Green plot ratio: An ecological measure for architecture and urban planning. Landsc. Urban Plan. 2003, 63, 197–211. [Google Scholar] [CrossRef]
  20. Halecki, W.; Stachura, T.; Fudala, W.; Stec, A.; Kubon, S. Assessment and planning of green spaces in urban parks: A review. Sustain. Cities Soc. 2023, 88, 104280. [Google Scholar] [CrossRef]
  21. Sichuan Provincial Department of Housing and Urban-Rural Development. Design Standard for Residential Buildings in Sichuan Province; Southwest Jiaotong University Press: Chengdu, China, 2021. [Google Scholar]
  22. Shenzhen Housing and Construction Bureau. Assessment Standard for Green Building; China Archiecture Publishing: Beijing, China, 2018. [Google Scholar]
  23. Fujian Provincial Department of Housing and Urban-Rural Development. Assessment Standard for Green Building in Fujian Province; Fujian Provincial Department of Housing and Urban-Rural Development: Fujian, China, 2021. [Google Scholar]
  24. Zheng, J.; Li, Z.L.; Zheng, B.H. A Study on the Effect of Green Plot Ratio (GPR) on Urban Heat Island Intensity and Outdoor Thermal Comfort in Residential Areas. Forests 2024, 15, 518. [Google Scholar] [CrossRef]
  25. Liao, J.J.; Tan, X.; Li, J.Y. Evaluating the vertical cooling performances of urban vegetation scenarios in a residential environment. J. Build. Eng. 2021, 39, 102313. [Google Scholar] [CrossRef]
  26. Atwa, S.; Ibrahim, M.G.; Murata, R. Evaluation of plantation design methodology to improve the human thermal comfort in hot-arid climatic responsive open spaces. Sustain. Cities Soc. 2020, 59, 102198. [Google Scholar] [CrossRef]
  27. Ličina, V.F.; Cheung, T.; Zhang, H.; De Dear, R.; Parkinson, T.; Arens, E.; Chun, C.; Schiavon, S.; Luo, M.; Brager, G. Development of the ASHRAE global thermal comfort database II. Build. Environ. 2018, 142, 502–512. [Google Scholar] [CrossRef]
  28. Liu, W.W.; Zhang, Y.X.; Deng, Q.H. The effects of urban microclimate on outdoor thermal sensation and neutral temperature in hot-summer and cold-winter climate. Energy Build. 2016, 128, 190–197. [Google Scholar] [CrossRef]
  29. Simon, H.; Lindén, J.; Hoffmann, D.; Braun, P.; Bruse, M.; Esper, J. Modeling transpiration and leaf temperature of urban trees—A case study evaluating the microclimate model ENVI-met against measurement data. Landsc. Urban Plan. 2018, 174, 33–40. [Google Scholar] [CrossRef]
  30. Bruse, M. Die Auswirkungen Kleinskaliger Umweltgestaltung auf das Mikroklima: Entwicklung des Prognostischen Numerischen Modells ENVI-Met zur Simulation der Wind-, Temperatur-und Feuchteverteilung in Städtischen Strukturen; Ruhr-Universität Bochum: Bochum, Germany, 1999. [Google Scholar]
  31. Ministry of Housing and Urban-Rural Development of the People’s Republic of China. Design Standard for Thermal Environment of Urban Residential Areas; China Archiecture Publishing: Beijing, China, 2013. [Google Scholar]
  32. Ministry of Housing and Urban-Rural Development of the People’s Republic of China. Standard for Urban Residential Area Planning and Design; China Archiecture Publishing: Beijing, China, 2018. [Google Scholar]
  33. Matzarakis, A.; Mayer, H.; Iziomon, M.G. Applications of a universal thermal index: Physiological equivalent temperature. Int. J. Biometeorol. 1999, 43, 76–84. [Google Scholar] [CrossRef] [PubMed]
  34. Heidari, A.; Davtalab, J.; Sargazi, M.A. Effect of awning on thermal comfort adjustment in open urban space using PET and UTCI indexes: A case study of Sistan region in Iran. Sustain. Cities Soc. 2024, 101, 105175. [Google Scholar] [CrossRef]
  35. Luo, X.Y.; Zhao, Y.; Li, Y.K.; Yang, J.H.; Guo, T.Y. Effects of tree species and planting forms on the thermal comfort of campsites in hot and humid areas of China. Int. J. Biometeorol. 2024, 68, 1437–1449. [Google Scholar] [CrossRef]
  36. Liu, Z.X.; Brown, R.D.; Zheng, S.L.; Jiang, Y.; Zhao, L.H. An in-depth analysis of the effect of trees on human energy fluxes. Urban For. Urban Green. 2020, 50, 126646. [Google Scholar] [CrossRef]
  37. Xiao, Q.K.; Fan, X.; Guo, Y.Y.; Li, S.T.; He, W.; Deng, Y.C.; Xiao, Z.Y.; Wang, P.C.; Wu, C.G. Tree form characteristics as criteria for tree species selection to improve pedestrian thermal comfort in street canyons: Case study of a humid subtropical city. Sustain. Cities Soc. 2024, 105, 105339. [Google Scholar] [CrossRef]
  38. Huang, J.; Kong, F.H.; Yin, H.W.; Middel, A.; Liu, H.Q.; Zheng, X.D.; Wen, Z.H.; Wang, D. Transpirational cooling and physiological responses of trees to heat. Agric. For. Meteorol. 2022, 320, 108940. [Google Scholar] [CrossRef]
  39. Li, J.Y.; Zheng, B.H.; Ouyang, X.; Chen, X.; Bedra, K.B. Does shrub benefit the thermal comfort at pedestrian height in Singapore? Sustain. Cities Soc. 2021, 75, 103333. [Google Scholar] [CrossRef]
  40. Sun, B.; Zhang, H.; Zhao, L.; Qu, K.C.; Liu, W.H.; Zhuang, Z.C.; Ye, H.Y. Microclimate Optimization of School Campus Landscape Based on Comfort Assessment. Buildings 2022, 12, 1375. [Google Scholar] [CrossRef]
  41. Yu, M.; Song, S.Q.; Jiang, C.L.; Ding, K.; Tan, L.; Ma, J.; Li, Y.Y. Multi-objective optimization of plant community characteristics in urban green spaces. Urban For. Urban Green. 2024, 98, 128397. [Google Scholar] [CrossRef]
Figure 1. Study site and meteorological data.
Forests 15 01525 g001
Figure 2. Envi-met simulation framework.
Forests 15 01525 g002
Figure 3. Nine residential green space scenarios with equal green volume.
Forests 15 01525 g003
Figure 4. Comparison of measured and simulated values [24]. (a) correlation coefficient of air temperature, (b) correlation coefficient of mean radiant temperature, (c) correlation coefficient of PET.
Forests 15 01525 g004
Figure 5. Outdoor PET distribution for nine residential green space scenarios.
Forests 15 01525 g005
Figure 6. Hourly outdoor PET for nine residential green space structures.
Forests 15 01525 g006
Figure 7. Mean PET and hottest moment PET for nine residential green space scenarios.
Forests 15 01525 g007
Figure 8. Thermal stress mitigation benefits at different stages of tree green volume.
Forests 15 01525 g008
Figure 9. Thermal mitigation and costs of nine green space scenarios.
Forests 15 01525 g009
Table 1. Information on plants.
PlantsCinnamomum camphoraPittosporum tobira
TypeTreeShrub
LAI4.26.0
Height (m)7.01.3
Crown width (m)7.02.0
Unit cost (¥)2380160
Table 2. The PET corresponds to the feelings of the human body [33,34].
PETThermal PerceptionPhysiological Stress Levels
below 4 °CVery coldExtreme cold stress
4 °C to 8 °CColdIntense cold stress
8 °C to 13 °CCoolModerate cold stress
13 °C to 18 °CSlightly coolSlight cold stress
18 °C to 23 °CCozyNo heat or cold stress
23 °C to 29 °CSlightly warmSlight heat stress
29 °C to 35 °CWarmModerate heat stress
35 °C to 41 °CHotIntense heat stress
above 41 °CVery hotExtreme heat stress
Disclaimer/Publisher’s Note: The statements, opinions and data contained in all publications are solely those of the individual author(s) and contributor(s) and not of MDPI and/or the editor(s). MDPI and/or the editor(s) disclaim responsibility for any injury to people or property resulting from any ideas, methods, instructions or products referred to in the content.

