Article

Evolution of Vegetation Growth Season on the Loess Plateau under Future Climate Scenarios

1
School of Tourism & Research Institute of Human Geography, Xi’an International Studies University, Xi’an 710128, China
2
China Academy of Space Technology (Xi’an), Xi’an 710101, China
*
Author to whom correspondence should be addressed.
Forests 2024, 15(9), 1526; https://doi.org/10.3390/f15091526
Submission received: 24 July 2024 / Revised: 23 August 2024 / Accepted: 27 August 2024 / Published: 29 August 2024
(This article belongs to the Section Forest Meteorology and Climate Change)

Abstract

:
In recent decades, vegetation phenology, as one of the most sensitive and easily observed features under climate change, has changed significantly under the influence of the global warming as a result of the green house effect. Vegetation phenological change is not only highly related to temperature change, but also to precipitation, a key factor affecting vegetation phenological change. However, the response of vegetation phenology to climate change is different in different regions, and the current research still does not fully understand the climate drivers that control phenological change. The study focuses on the Loess Plateau, utilizing the GIMMS NDVI3g dataset to extract vegetation phenology parameters from 1982 to 2015 and analyzing their spatial–temporal variations and responses to climate change. Furthermore, by incorporating emission scenarios of RCP4.5 (medium and low emission) and RCP8.5 (high emission), the study predicts and analyzes the changes in vegetation phenology on the Loess Plateau from 2030 to 2100. The long-term dynamic response of vegetation phenology to climate change and extreme climate is explored, so as to provide a scientific basis for the sustainable development of the fragile Loess Plateau. The key findings are as follows: (1) From 1982 to 2015, the start of the growing season (SOS) on the Loess Plateau shows a non-significant delay (0.06 d/year, p > 0.05), while the end of the growing season (EOS) is significantly delayed at a rate of 0.1 d/year (p < 0.05). (2) In the southeastern part of the Loess Plateau, temperature increases led to a significant advancement of SOS. Conversely, in the Maowusu Desert in the northwest, increased autumn precipitation caused a significant delay in EOS. (3) From 2030 to 2100, under the RCP4.5 and RCP8.5 scenarios, temperatures are projected to rise significantly at rates of 0.018 °C/year and 0.06 °C/year, respectively. Meanwhile, precipitation will either decrease insignificantly at −0.009 mm/year under RCP4.5 or increase significantly at 0.799 mm/year under RCP8.5. In this context, SOS is projected to advance by 19 days and 28 days, respectively, under RCP4.5 and RCP8.5, with advancement rates of 0.049 days/year and 0.228 days/year. EOS is projected to be delayed by 14 days and 27 days (p < 0.05), respectively, with delay rates of 0.084 d/year and 0.2 d/year.

1. Introduction

Vegetation phenology is one of the most sensitive and easy-to-observe characteristics under climate change [1,2,3], which can effectively mirror alterations in climate and the natural environment and serves as a crucial indicator [4,5,6]. In recent decades, global climate change and frequent extreme weather events brought about by the greenhouse effect have had a significant impact on many terrestrial ecosystems, changing phenology [7,8]. The advance of plant greening time in spring and the postponement of leaf senescence in autumn explain the most intuitive impact of global warming on the terrestrial ecosystem [9,10,11].
In the sixth report of the Intergovernmental Panel on Climate Change (IPCC), continuously increasing greenhouse gas emissions will lead to intensified global warming, and two-thirds of spring phenological events will have advanced, driven by regional climate changes (very high confidence) [12]. Compared with 50 years ago, deciduous plants in Mediterranean ecosystems unfold an average of 16 days earlier, and deciduous leaves delay an average of 13 days [13]. In Europe, for every 1 °C increase in temperature, the spring phenological phase is 2.5 days earlier on average [14]. In predictions regarding the phenology of the arid North American grasslands, the length of the vegetation growing season is projected to increase by approximately 5 weeks by 2100 [15]. However, in Asia, after extracting vegetation phenological parameters from Advanced Very-High-Resolution Radiometer (AVHRR) Normalized Difference Vegetation Index (NDVI) data, Piao et al. found that during the period from 1982 to 1999, the average green return of temperate vegetation in spring in China was 0.79 d/year, and autumn dormancy was delayed 0.37 d/year [16]. Ma et al. used remote sensing data to quantify the effect of temperature on phenology in Qinling Mountains, Shaanxi Province, China. From 2000 to 2010, the advance rate of the ground phenology in Qinling Mountains was 0.1656 d/year, and the late phase was 0.1091 d/year [17]. In the arid desert steppe region of the northwestern Loess Plateau, phenological changes are primarily controlled by temperature. Conversely, in the semi-arid region encompassing agricultural and grassland areas, phenological changes are predominantly influenced by precipitation [18]. However, the response of vegetation phenology to climate change is different in different regions, and the current research still does not fully understand the climate drivers that control phenology change.
Future climate change is expected to greatly exceed the currently observed climate anomalies [19], and it is important to explore how phenology will change in the next century. It is estimated that by the end of the 21st century, the surface temperature of the Earth will rise by 0.3~4.8 °C compared with the beginning of the 21st century [20], which could significantly alter the timing of the spring green-up and leaf senescence of vegetation. Driven by the high emission scenario Representative Concentration Pathway 8.5 (RCP8.5) climate, 18 million hectares of temperate forest in New England will have a significant growth season extension in 2100 [21]. According to the climate forecasts for the next two periods (2041–2050 and 2090–2099), climate warming is the main driver of the autumn phenology postponement of temperate deciduous forests in the United States [22]. Future projections for the phenological periods of the Tibet Plateau indicate that by 2040, the spring green-up time on the Plateau will advance by approximately 1.6~2.0 days, while autumn leaf senescence will be delayed by approximately 1.1~1.7 days [23]. However, the response of vegetation phenology to climate change is different in different regions. According to the long-term observation of ground stations, the growing season of birch shows different trends in Finland and Russia, respectively; the autumn phenology of birch trees in Finland shows little change, while in Russia, there is an insignificant trend towards earlier onset [24]. Therefore, under the continuous climate change, phenological changes will be highly uncertain, with research on predicting phenological changes highly necessary. The Loess Plateau has arid and semi-arid climatic conditions, where evaporation is generally higher than the actual precipitation, and vegetation is very sensitive to climatic factors [25,26]. During 2001 and 2018, the phenological phase of vegetation on the Loess Plateau underwent obvious change, with SOS advanced and EOS postponed in more than 70% of the areas [27]. However, the evolution of vegetation phenological changes on the Loess Plateau under future climate change scenarios remains unknown.
In summary, this study will take the Loess Plateau as the research object, based on the GIMMS NDVI3g dataset, and use the maximum ratio method, trend analysis, correlation analysis and other methods to investigate the variations in the timing and spatial distribution of vegetation phenology, as well as their relationship with temperature and precipitation trends over the period 1982–2015. Within the context of two distinct emission scenarios: Representative Concentration Pathway 4.5 (RCP4.5: medium and low emission) and Representative Concentration Pathway 8.5 (RCP8.5: high emission), the phenological changes in the study area from 2030 to 2100 were predicted, in order to explore the long-term dynamic response of vegetation phenology to climate change and extreme climate, with the aim of establishing a reliable scientific basis to guide the sustainable development endeavors in the vulnerable Loess Plateau.

2. Materials and Methods

2.1. Study Area

The Loess Plateau (Figure 1) is located in the central and western regions of China, spanning seven provinces, municipalities and autonomous regions, including Shaanxi, Shanxi, Inner Mongolia and Ningxia, with a total area of about 6.4 × 10⁵ km2, accounting for 6.7% of the country’s total area. The Loess Plateau starts from Taihang Mountain in Shanxi Province in the east, ends in Riyue Mountain in Qinghai Province in the west, goes directly to the Ordos Plateau in the north, and is bounded by Qinling Mountains in Shaanxi Province in the south. The regional scope is roughly 33°–41° N and 100°–114° E. The overall average altitude of the Loess Plateau is approximately 1408 m, which rises step by step from southeast to northwest. According to this, the geomorphological types of the whole study area can be divided into the mountain area, loess hilly region, Loess Plateau area, loess platform area and river valley plain area. The Loess Plateau is a continental monsoon climate [28], which is a transitional zone between a semi-arid and semi-humid warm temperate zone and mid-temperate zone. The average annual temperature on the Loess Plateau is about 3.6~14.3 °C, and the average annual precipitation is about 300–600 mm [29]. It is warm and humid in summer and autumn, and cold and dry in winter and spring. The Loess Plateau is one of the loess geomorphological regions with the largest area, the widest distribution, and the thickest in the world. The southeast of the Loess Plateau has a semi-humid climate, high precipitation and abundant groundwater, and the zonal vegetation is mainly Arbor shrub forest with more water demand. On the other hand, the northwest of the Loess Plateau is mainly arid and semi-arid, with little precipitation. The zonal vegetation in this area is mainly grassland and desert grassland, and the vegetation coverage is very low. Most areas are unable to support large-scale planting. The western region of the Loess Plateau, encompassing Qinghai Province, is characterized by an alpine climate typical of arid regions, with low temperature and high precipitation, and there is a lot of glacier meltwater in spring and summer, forming a certain-scale alpine oasis ecosystem [30].

2.2. Data Source and Processing

As one of the most widely used plant cover indexes, the Normalized Difference Vegetation Index (NDVI) is widely used in crop growth monitoring and vegetation change monitoring. In this paper, the NDVI time-series data compiled between 1982 and 2015 produced by Global Inventory Modeling and Mapping Studies (GIMMS) working group are selected as the basic data for vegetation phenological remote-sensing monitoring; the spatial resolution of this dataset is 1/12 degree, and the temporal resolution is half a month. The original GIMMS NDVI3g.v1 data file is transformed into the commonly used Geotiff format by using Python 2.7 programming carried by ArcGIS 10.2. Given the comprehensive consideration of smoothing effect and computational efficiency, the Whittaker smoother (WS) method is used to smooth the NDVI timing curve [31,32]. WS reduces the weight of low noise and mistrust values through iterative procedures to make the smooth curve close to the upper envelope of the data, thus obtaining the most reliable NDVI time-series curve [31]. According to the smoothed time-series curve, the maximum ratio method was used to extract the phenological parameters, namely, the beginning of the growing season (SOS), the ending period of the growing season (EOS) and the length of the growing season (LOS). The spatial resolution of the extracted phenological parameters remains consistent with that of the GIMMS NDVI3g data, at 1/12 degree, and the time range covers from 1982 to 2015.
The meteorological data used in this paper, including the daily temperature and precipitation recorded by the national standard meteorological stations, a total of 90 stations across the Loess Plateau, are all from the Chinese surface climate data daily dataset (V3.0) of the China Meteorological data sharing Service Network (http://cdc.cma.gov.cn/, accessed on 22 August 2024); the time range spans from 1982 to 2015. Then, the meteorological stations’ daily records of temperature and precipitation measurements were input into Anusplin 4.3 for interpolation, resulting in daily raster datasets with the same spatial resolution of 1/12 degree as the phenological data extracted from GIMMS NDVI3g. The time range for both datasets spans from 1982 to 2015. Subsequently, the monthly temperature and precipitation raster datasets were generated by summing the daily values and calculating the average over each month, based on the daily raster datasets. Finally, we obtained two sets of climate datasets: one with daily temporal resolution and 1/12 degree spatial resolution, covering the time range from 1982 to 2015; and the other with monthly temporal resolution and the same 1/12 degree spatial resolution, also covering the same time range.
When studying the changes in vegetation phenology under future climate scenarios, this paper uses the global daily temperature and precipitation forecasts for the next 100 years under (Representative Concentration Pathways) RCP4.5 (medium and low emission) and RCP8.5 (high emission) emission scenarios, respectively, using the MRI-CGCM3 climate model with relatively high spatial resolution in the fifth coupled model comparison plan, the Coupled Model Intercomparison Project Phase 5 (CMIP5). The spatial resolution is 1.125° × 1.12°. The MRI-CGCM3 climate model under RCP4.5 and RCP8.5 scenarios is then used to estimate the SOS and EOS for 2030–2100 in the Loess Plateau. This study predicts the start and end dates of the growing season for vegetation using a temperature threshold model [24] and daily temperature data under two future climate scenarios. The temperature threshold model is simple and effective, determining the start or end of the growing season when temperatures exceed a set threshold for five consecutive days. The specific approach is as follows: (1) Firstly, we calculated the average temperature of the five days preceding SOS and EOS for each pixel based on phenological data and concurrent daily meteorological data spanning from 1982 to 2015. (2) For SOS, it was defined as the date when the temperature exceeded the threshold for five consecutive days before May 31st of each year, as predicted by the model. (3) For EOS, it was defined as the date when the temperature fell below the threshold for five consecutive days after July 1st of each year, as predicted by the model.

2.3. Statistical Analysis

Theil–Sen Median [33,34] is often used to analyze trends in time-series data. It can avoid being influenced by a lack of time-series data and the distribution of data on the analysis results, and can eliminate the interference of abnormal values in the time series. Therefore, in this paper, Theil–Sen Median is used to describe the amplitude and direction of variable trend in the long-time series trend analysis of climatic factors, phenological parameters and future climate scenarios. The formula can be represented as follows:
Sen_slope = m e d i a n x j x i j i ,   1 < i < j < n
Sen_slope represents the value of Theil–Sen Medianslope. Where i and j are a certain year in the during the observation period, respectively, and xi, xj is the vegetation phenological parameter value for I and j. Sen_slope > 0 indicates a trend that is behind schedule, while Sen_slope < 0 indicates a trend that is ahead of schedule; the absolute value of Sen_slope indicates the magnitude of change.
Pearson’s correlation analysis method is used to analyze the correlation among climate factors, vegetation phenological parameters, and future climate scenarios on multiple scales, and the correlation degree between variables is characterized by the correlation coefficient r. In particular, (1) the relationships between the SOS and spring (March to May) temperature and precipitation were evaluated; and (2) the correlations between the EOS and the summer (June to August) and autumn (September to November) temperature and precipitation were calculated. The formula for calculating r is as follows:
r = t = 1 n x t x ¯ y t y ¯ t = 1 n x t x ¯ 2 t = 1 n y t y ¯ 2
where xt is the meteorological data for year t. yt is the phenological parameter value for year t.
p-value is used for the significance test of Sen_slope and the correlation coefficient r.

3. Results

3.1. Characteristics of Spatio-Temporal Variation in Growing Season

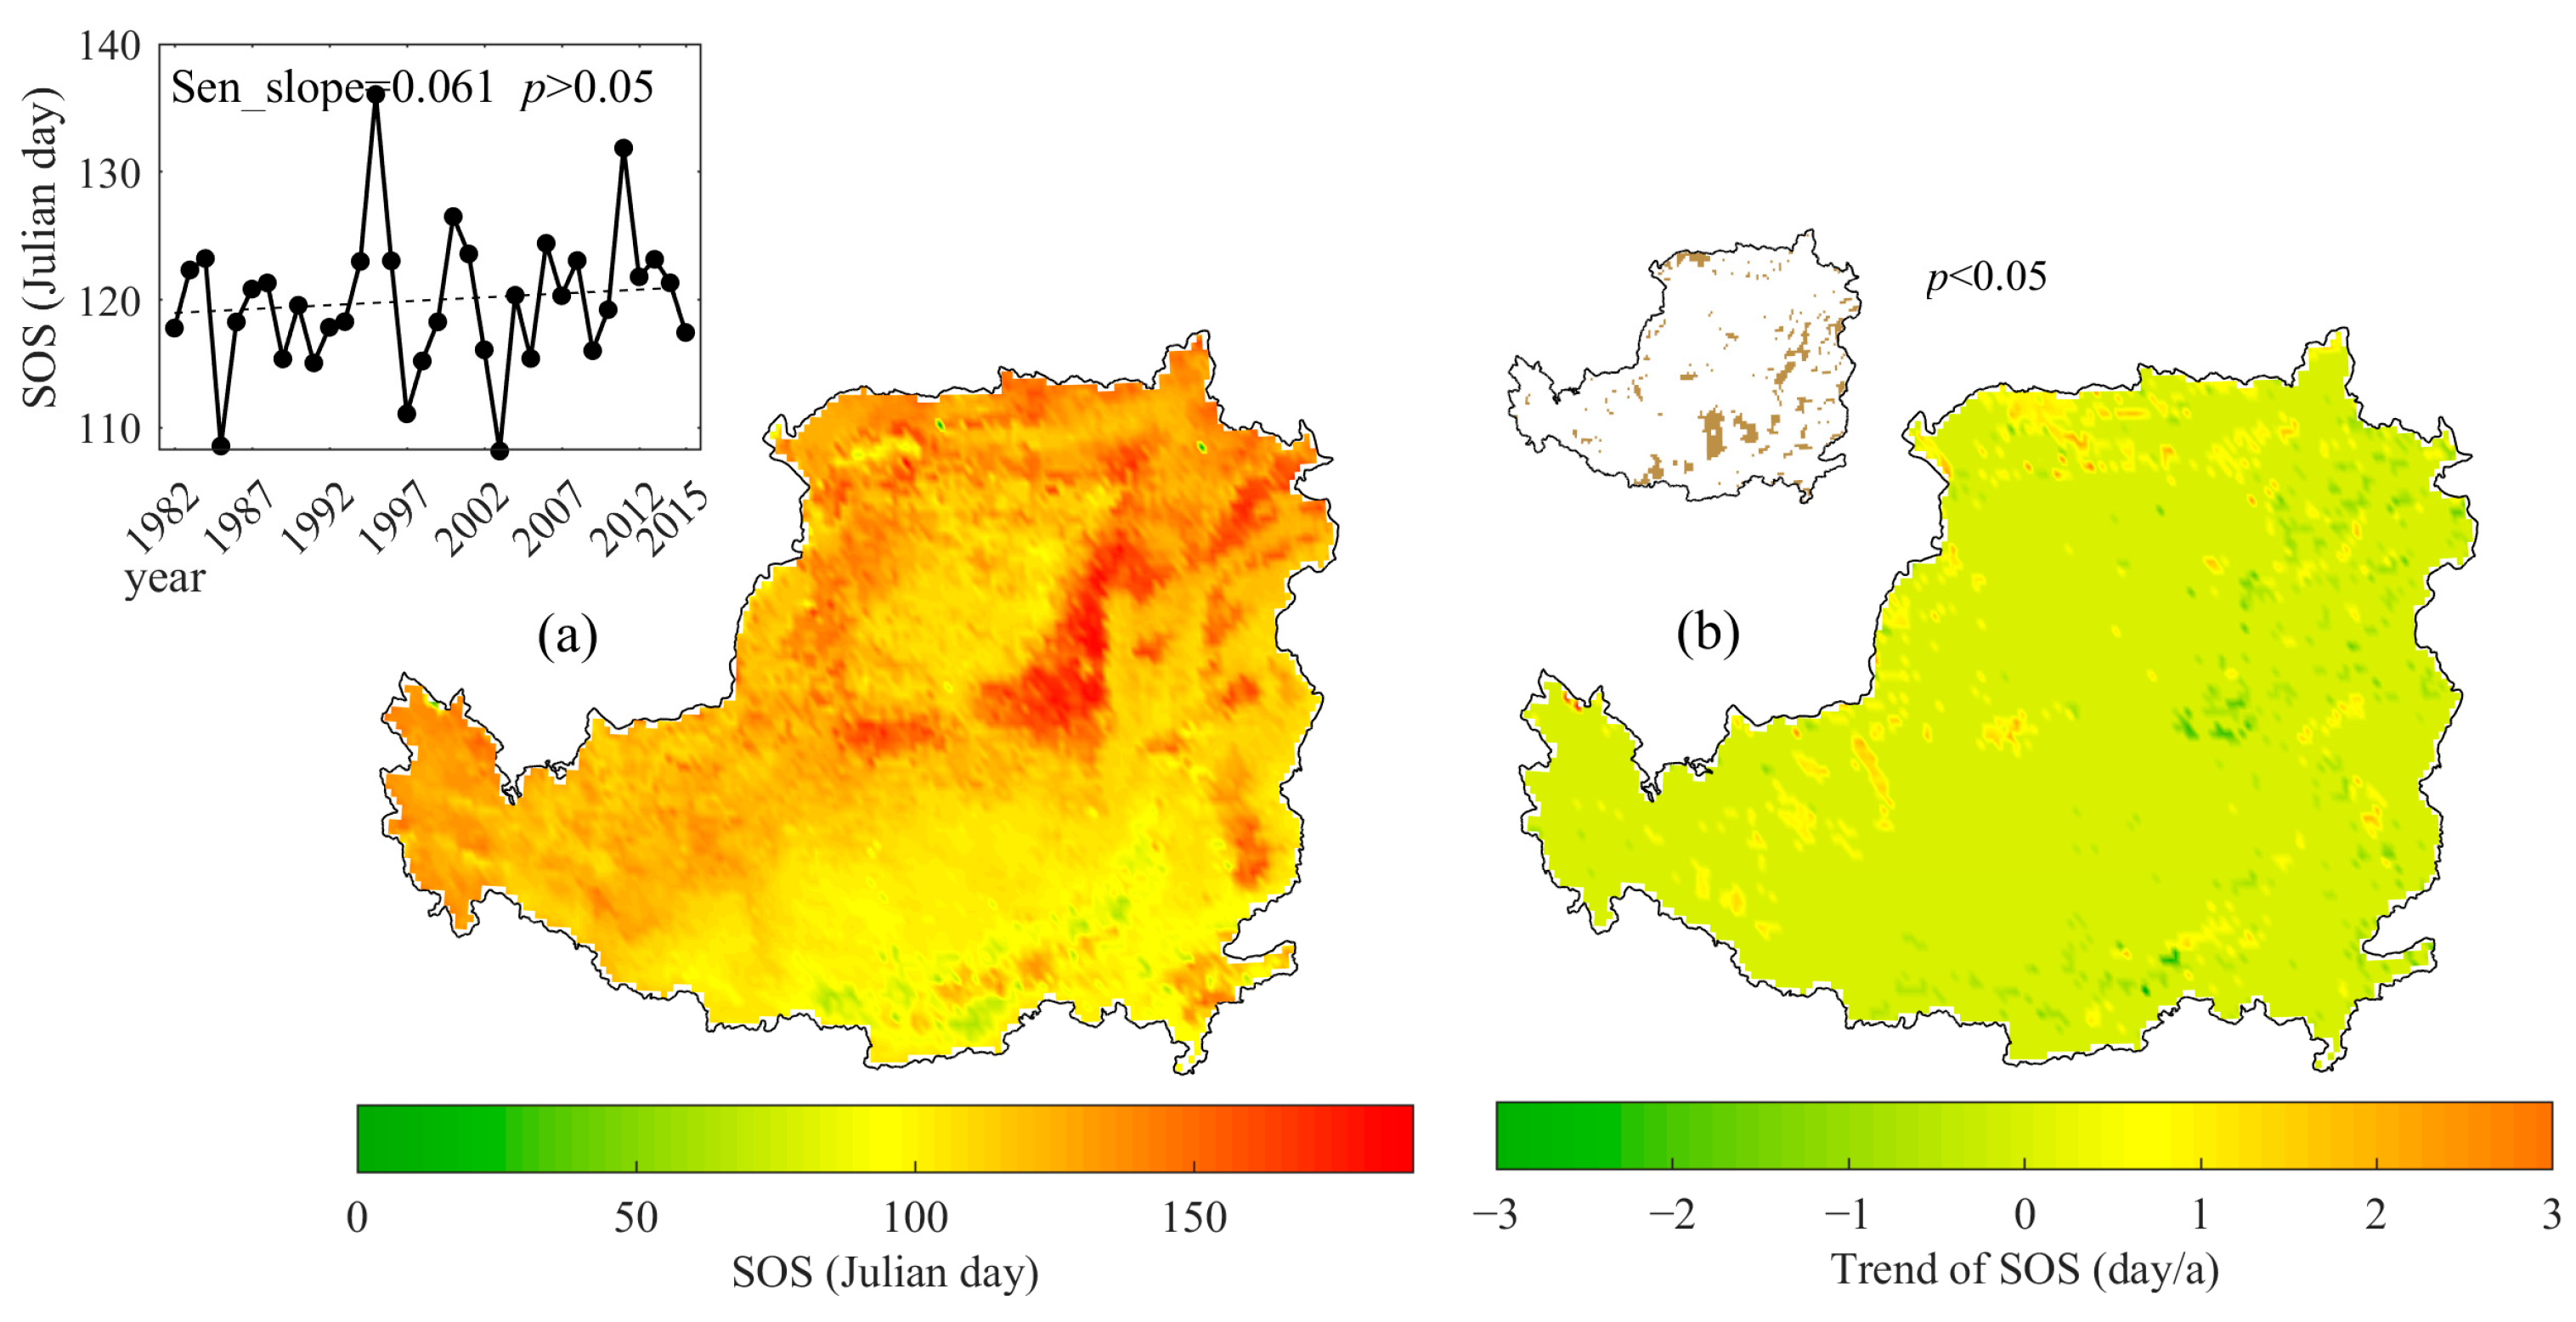
On the whole, there was no significant postponement trend in SOS in the Loess Plateau, and the postponement rate was 0.06 d/year (Figure 2a). During the period from 1984 to 1995, SOS showed an early trend. During the decade from 1995 to 2005, SOS fluctuated and changed, showing postponement–advance–postponement–advance. From 2005 to now, SOS has been postponed year by year. There are obvious differences in the spatial distribution of SOS changes in the Loess Plateau (Figure 2b). Among them, the areas with the advance in SOS are concentrated in the southeast of the Loess Plateau at low latitudes and elevations, accounting for 44.57% of the total area of the Loess Plateau, with an average advance of 0.022 days per year. The areain which the SOS is delayed is distributed in the northwest of the Loess Plateau at higher latitudes and elevations, with an area of 55.43%, with an average delay of 0.026 d/year. The area with a significant advance in SOS in the Loess Plateau accounts for about 12.47% of the total area of the Loess Plateau, with an average delay of 0.26 days per year, mainly distributed in the southern part of the Loess Plateau in northern Shaanxi, the western part of the Guanzhong Plain and the northern plain of Shanxi Province; the vegetation types that significantly advanced were mostly coniferous and broad leaf forests. The area with significant postponement in SOS on the Loess Plateau accounts for about 17.87% of the total area, with an average delay of 0.3 days per year, mainly distributed in the northern Ordos Plateau, Yinchuan Basin, Longzhong Plateau and other areas; the vegetation types are mainly grassland.
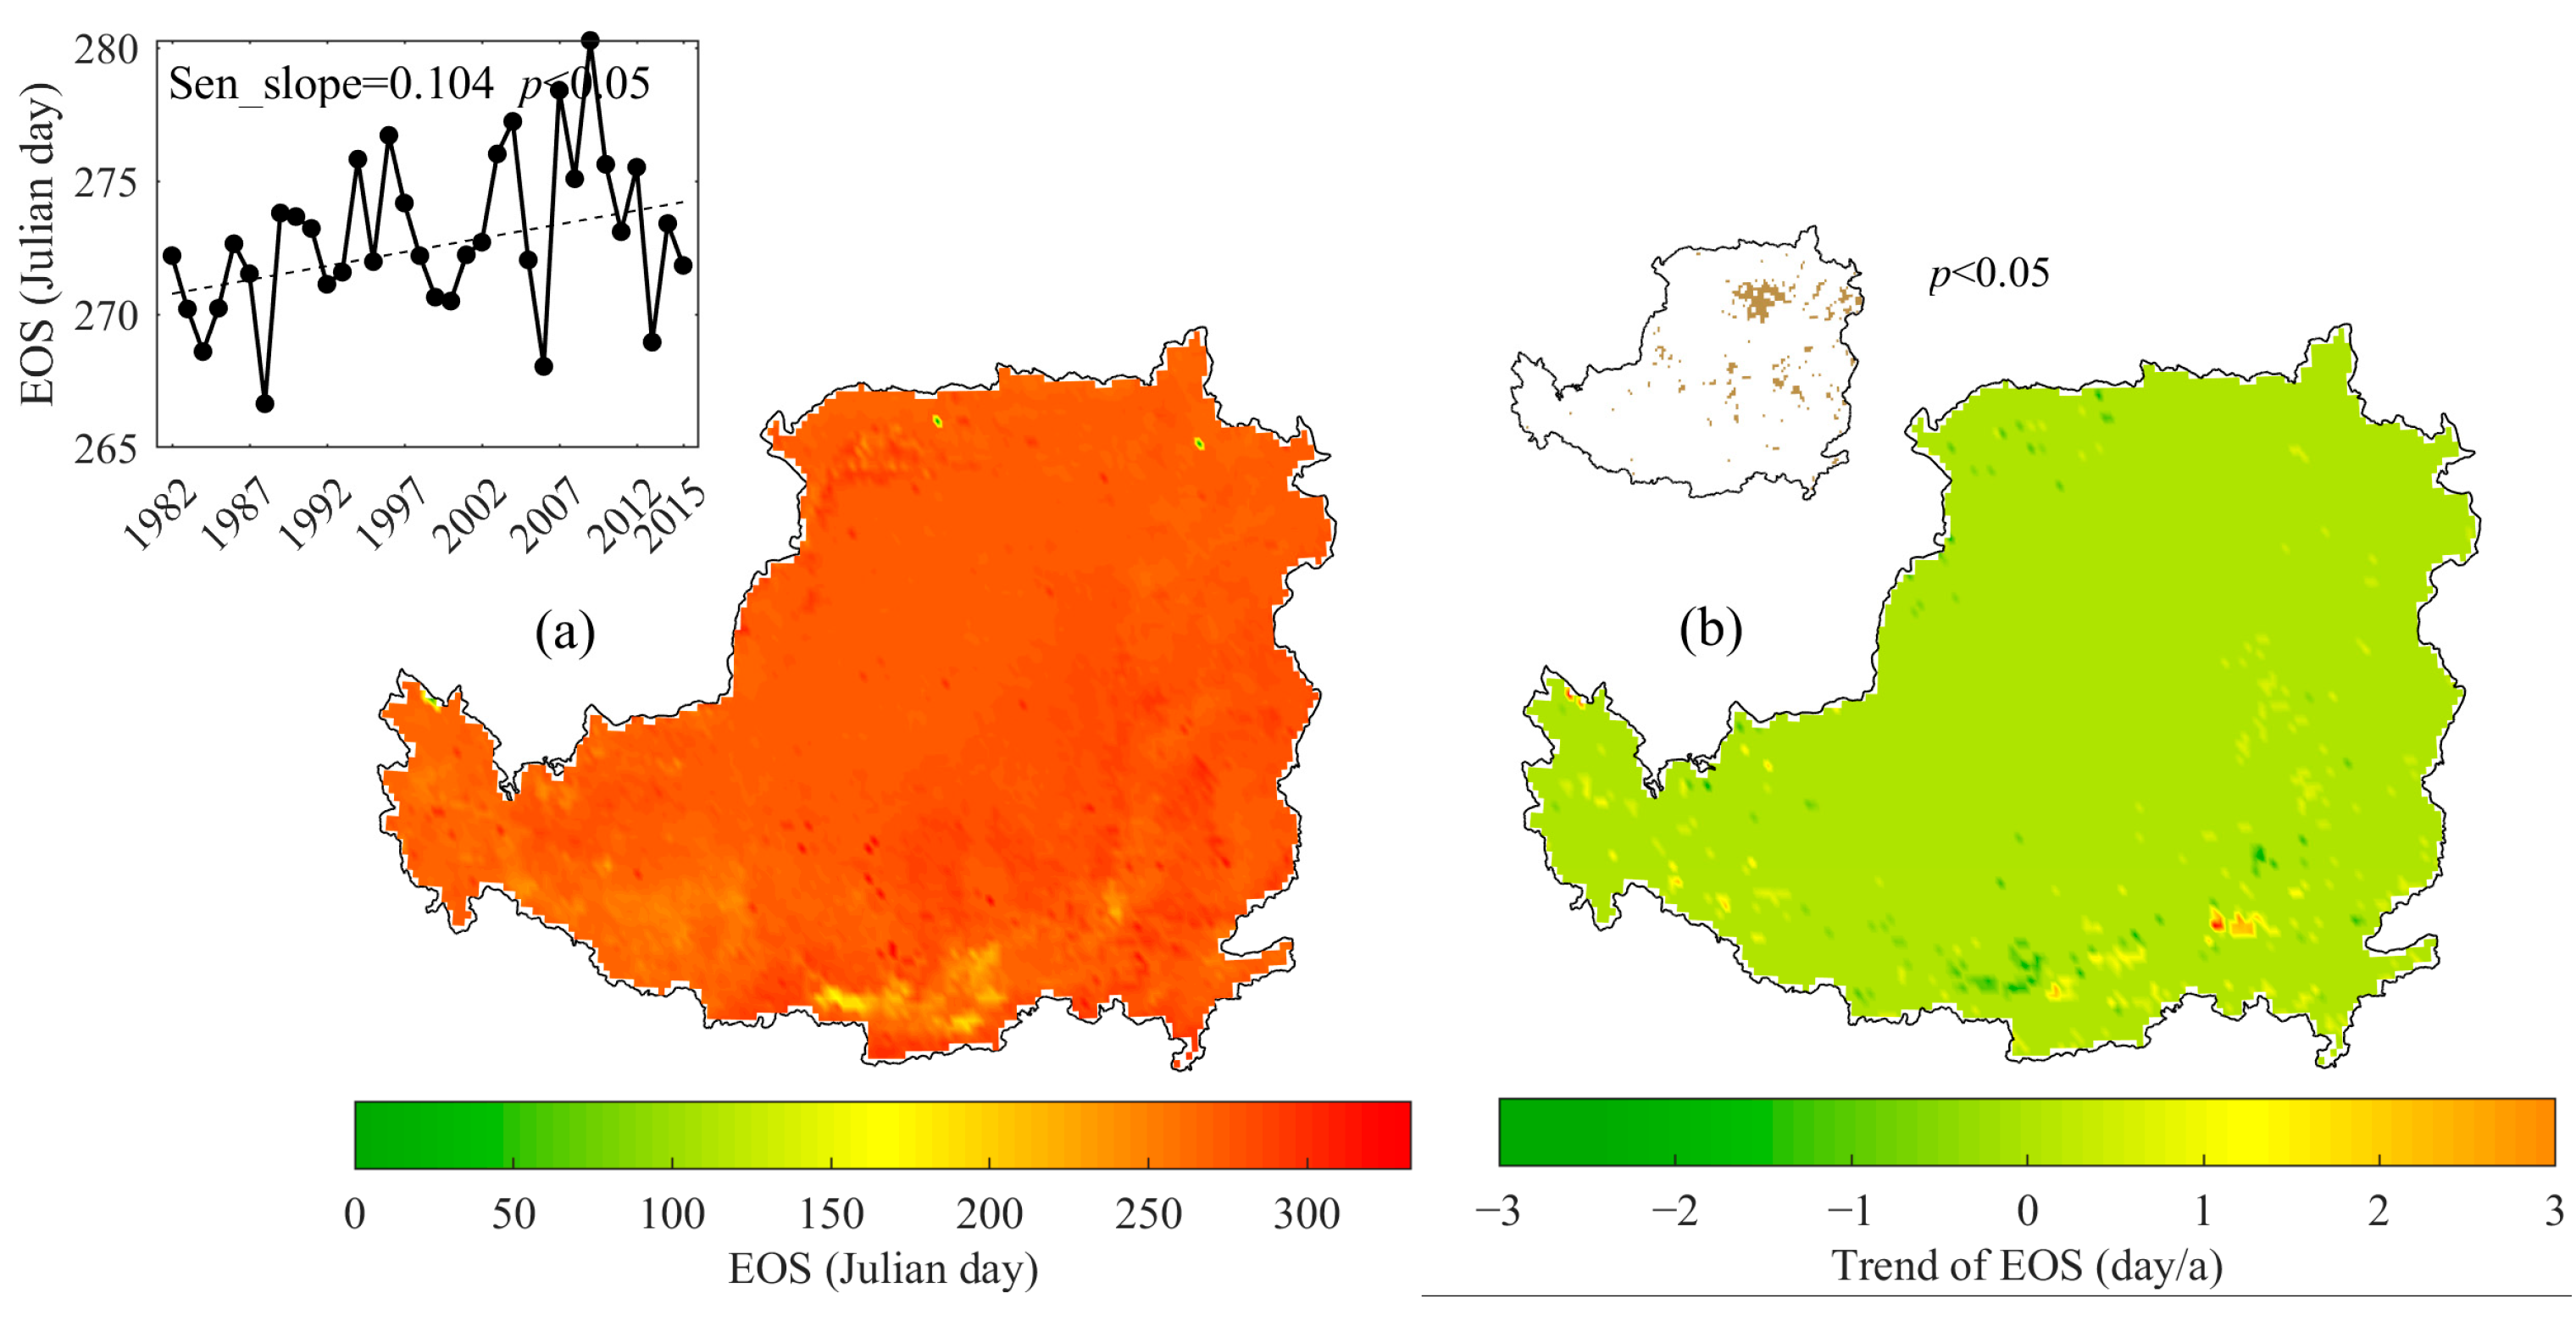
The EOS in the Loess Plateau showed a significant postponement trend (p < 0.05), and the postponement range was 0.1 d/year (Figure 3a). Since 1989, EOS shows a trend of fluctuation and postponement year by year. The area indicating a delay in EOS on the Loess Plateau accounts for 54.76% of the total area of the Loess Plateau (Figure 3b), which is mainly distributed in the northern Shaanxi Loess Plateau, Yinchuan Basin, north–central Shanxi Province and the Ordos Plateau in the middle and eastern regions of the Loess Plateau. The proportion of the areain which EOS has progressed is 45.23%, mainly distributed in Longzhong Loess Plateau, Guanzhong Plain and part of Fen-Wei Plain. The area of significant postponement in EOS on the Loess Plateau accounts for about 18.92% of the total area of the Loess Plateau, with an average delay of 0.12 days per year. The areas showing a significant delay in EOS are mainly distributed in the Ordos Plateau, Maowusu Desert, Northern Shaanxi Loess Plateau, Shanxi Taihang Mountains and Lvliang Mountains, and these areas are basically areas with a substantial increase in autumn precipitation. There are few areas with a significant advance in EOS on the Loess Plateau, accounting for only 5.5% of the total area of the Loess Plateau, but the advance range is relatively high, with an average advance of 0.14 days per year, sporadically distributed in the northern Ordos Plateau and around the Yinchuan Basin. Among all vegetation types, grassland has the highest proportion of significantly delayed areas.
On the whole, the LOS in the Loess Plateau showed no significant shortened trend, but the shortened range was very small, only 0.005 days per year, which was much less than that of SOS and EOS (Figure 4a). From 1982 to 1995, LOS showed a fluctuation trend of prolongation and shortening. From 1995 to 2010, the change trend in LOS was relatively gentle, and the change was very small. After 2010, LOS showed a trend of shortening. Among them, the area with an extension trend accounts for 55.25% of the total area of the Loess Plateau, with an average extension of 0.1 d/year; the shortened area accounts for 44.47%, with an average reduction of 0.11 d/year (Figure 4b). Similar to the spatial distribution of the SOS variation trend, the areas with prolonged LOS trends are also concentrated in the southeast of the Loess Plateau with better hydrothermal conditions, while the shortened regions are distributed in the arid northwest of the Loess Plateau. The significantly extended area of LOS in the Loess Plateau accounts for about 20.2% of the total area of the Loess Plateau, with an average extension of 0.67 days per year, mainly distributed in Guanzhong Plain, Northern Shaanxi Loess Plateau, northern Shanxi and other areas. The area where SOS is significantly shortened in the Loess Plateau accounts for about 8.1% of the total area, with an average annual reduction of 0.79 days, mainly distributed in the Yinchuan Basin, the northern Ordos Plateau and other areas. The LOS of the grassland and meadow generally shows a shortening trend, while that of shrub, grassland, coniferous and broadleaf forests shows an extending trend.

3.2. Temperature and Precipitation Trends in the Loess Plateau from 1982 to 2015

As shown in Figure 5, the variation trend in air temperature in different time scales of the Loess Plateau is basically the same, showing an upward trend, and the difference in spatial distribution is mainly shown in the range of change and the region of significant change. Among them, the change trend in average annual temperature passed the significance test of p < 0.01 in the whole study area, and showed a very significant increasing trend. The rising range of Qinghai and Shanxi and northern Shaanxi was larger, which was more than 0.06 °C/a in some areas. The regional distribution of air temperature in different seasons showed a significant increasing trend (p < 0.05), and the order of regional area from more to less was spring > summer > autumn > winter. The rising range of temperature in spring is greater than the average annual temperature, and the warming range in Longzhong Loess Plateau and Guanzhong Plain is more than 0.08 °C/a.
As illustrated in Figure 5, the patterns of annual precipitation distribution across the Loess Plateau show significant variability. The annual average precipitation exhibits an increasing trend, predominantly in the heartland of the Loess Plateau, which accounts for 68.6%. In contrast, the northwestern, northeastern, and southeastern parts of the plateau show a decreasing trend in annual average precipitation, covering a smaller area of only 31.4%. In most areas of the Loess Plateau, spring (82.32%) and summer (79.82%) precipitation trends predominantly exhibit a decrease, with only a few areas showing an increase. In autumn, precipitation trends show an increase across almost the entire Loess Plateau (99.23%, p < 0.05). Autumn precipitation trends demonstrate the highest number of significant results (47.9%) in terms of spatial distribution and are concentrated primarily in the northwestern part of the plateau.

3.3. Response of SOS to Changes in Temperatureand Precipitation in Spring

Figure 6 shows the correlation between SOS and spring temperature across the Loess Plateau over the period from 1982 to 2015. As shown in Figure 6, SOS on the Loess Plateau is mainly negatively correlated with spring air temperature (Figure 6) (the area ratio is about 58.94%) and spring precipitation (Figure 6) (the area ratio is about 63.52%). With the increase in temperature and precipitation in spring, it is beneficial to advance the SOS of vegetation returning to green in most areas. Among them, there is a significant negative correlation between SOS and air temperature in 17.87% of the regions (Figure 6). These areas are mainly distributed in the southeastern region of the Loess Plateau, including the southern part of the Loess Plateau in northern Shaanxi, Lvliang Mountain in Shanxi, Taihang Mountain and Longdong Plateau. Among them is the highest proportion of areas where coniferous and broadleaf forests, shrub and grasslands show a significant negative correlation with spring temperature. The increase in temperature in spring is the largest in these areas, and the temperature in some areas is more than 0.8 °C/10 a (Figure 5). The area with significant positive correlation between SOS and spring temperature accounts for only 3.03% of the total area, which is distributed in Maowusu Desert, Yinchuan Basin and other local areas. These areas are in the arid climate zone, the precipitation is scarce, and the precipitation in spring shows a downward trend. Therefore, increased temperatures during spring may induce water deficiency in vegetation, ultimately delaying the restriction period of the SOS. According to Figure 5, the spring precipitation on the Loess Plateau tends to decrease slightly in recent decades. Therefore, the correlation between SOS and precipitation is weak, with a significant correlation area of only 8.04%, scattered in the Maowusu Desert. From the monthly scale correlation coefficients r (Figure 6), spring temperatures in March have the greatest impact on the start of the growing season (SOS), with a significant negative correlation observed in 13.03% of the area, which is mainly distributed in the southeast of the Loess Plateau. In contrast, only 4.12% of the area shows a significant negative correlation with precipitation in March.

3.4. Response of EOS to the Changes in Temperature and Precipitation in Summer and Autumn

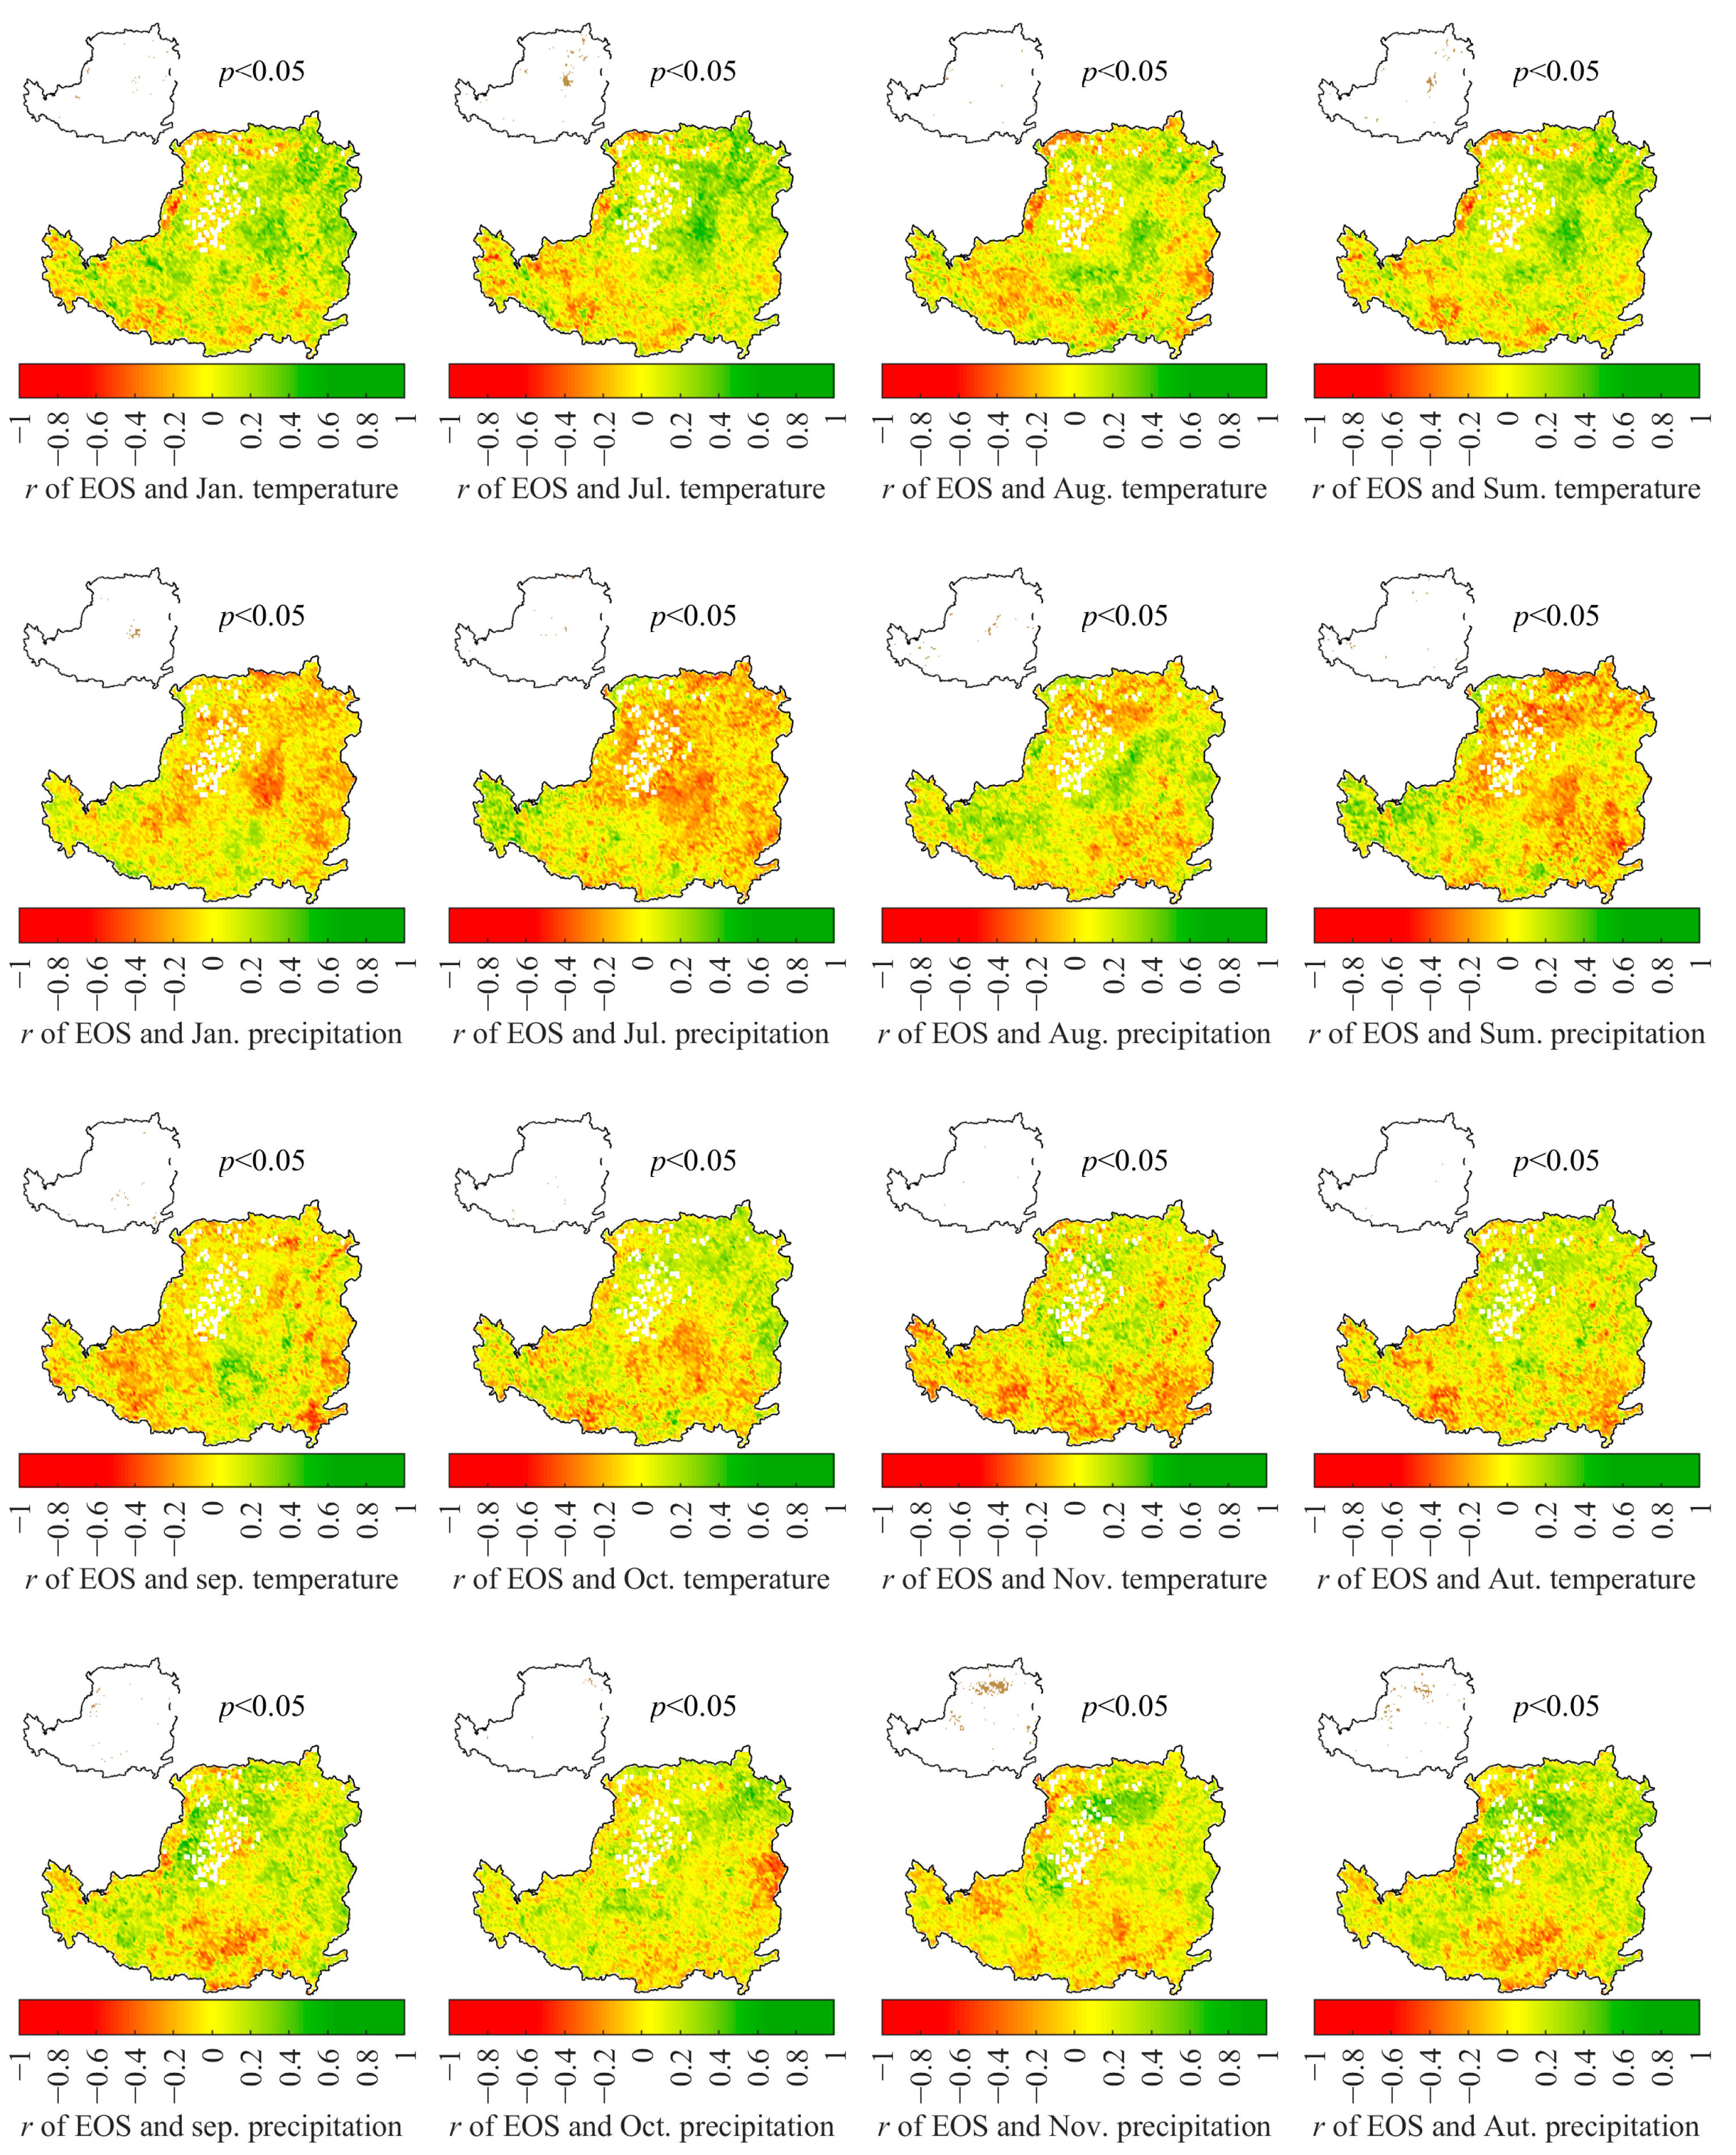
Figure 7 shows the correlation between the start of the vegetation growing season (EOS) and summer and autumn temperature in the Loess Plateau from 1982 to 2015. Due to the high temperature in summer and autumn in the Loess Plateau, the temperature needs of most of the vegetation growth have been met. Therefore, EOS is less sensitive to the increase in temperature in summer and autumn. In summer, the EOS in most parts of the Loess Plateau is positively correlated with air temperature, accounting for 61.34% of the total area of the Loess Plateau. With the increase in summer temperature, EOS on the Loess Plateau is gradually delayed. However, there are few areas with significant positive correlation (p < 0.05), accounting for only 7.04% of the total area, mainly distributed in the border area of the Loess Plateau and Lvliang Mountain in northern Shanxi and northwest Shaanxi. Among them, cropland vegetation responds relatively strongly to summer temperatures, exhibiting a larger share of areas that display a significant positive relationship. In autumn, the area gap between EOS postponement and advance with the increase in temperature is relatively small, accounting for 50.34% and 49.66% of the total area of the Loess Plateau, respectively. The area with significant correlation (p < 0.05) is only 4.24%, which is mainly distributed in the eastern part of Longzhong Loess Plateau. The temperature in July has the greatest impact on the end of the growing season (EOS), with 8.78% of the area showing a significant positive correlation, but the distribution of these areas is relatively scattered.
Figure 7shows the correlation between the end of vegetation growing season (EOS) and summer and autumn precipitation in the Loess Plateau from 1982 to 2015. As shown in the figure, in summer, the area of the Loess Plateau where EOS is negatively correlated with precipitation accounts for 55.18% of the total area. During this period, the summer precipitation in most parts of the Loess Plateau did not decrease significantly (p > 0.05). Therefore, with the decrease in summer precipitation, EOS tends to be delayed. The influence of summer precipitation on EOS is small, and the area with significant delayed/significant negative correlation is only 3.94%, scattered in the Ordos Plateau. In autumn, the effect of autumn precipitation on EOS is significantly greater than that in summer, and the significant correlation area accounts for 14.27% of the total area, which is higher than that in summer (7.82%). Grassland and meadow are the most significantly affected by autumn precipitation. Due to the significant increase in autumn precipitation, EOS showed a delayed trend, and the proportion of delayed area was 67.39%. Among them, significant positive correlation accounted for 12.3%, mainly distributed in the Maowusu Desert with dry climate. The significant negative correlation area is less, accounting for only 1.97%, scattered in the local area of Guanzhong basin in Shaanxi province. Autumn precipitation in November has the greatest impact on the end of the growing season (EOS), with 13.39% of the area showing a significant positive correlation, mainly distributed in the Maowusu Desert region.

3.5. Prediction of Climate Change under Different Climate Scenarios

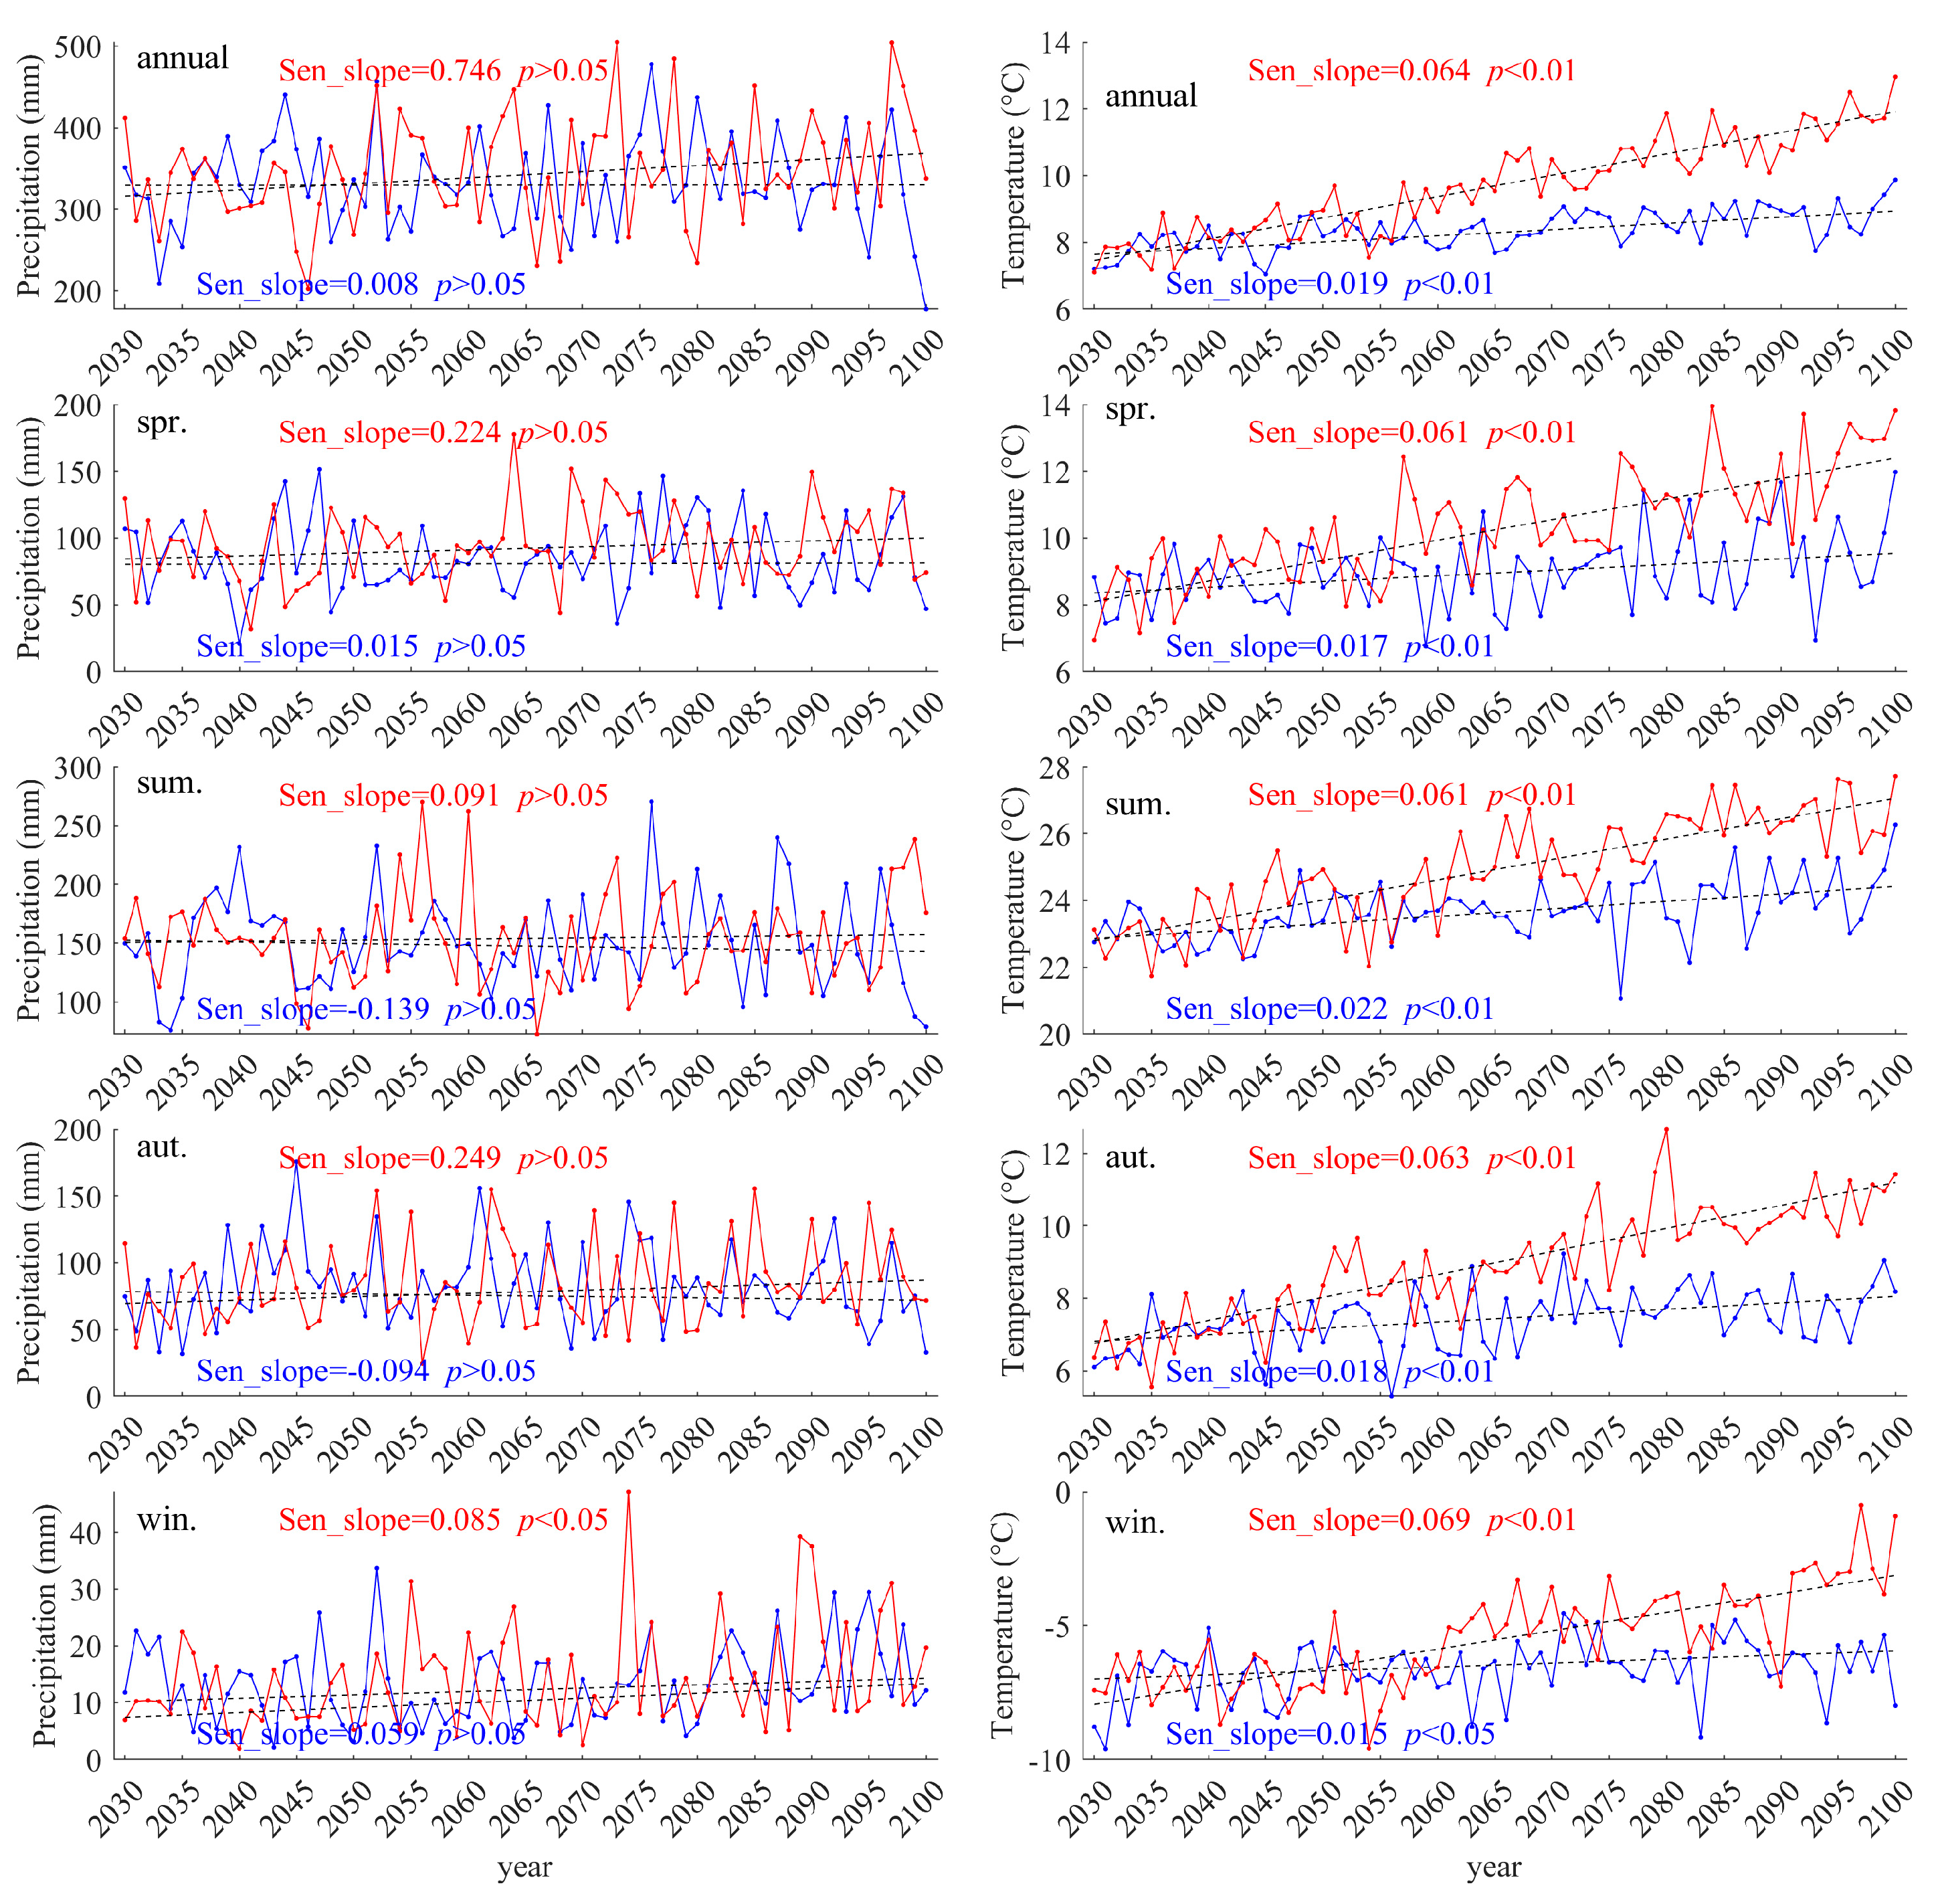
The Intergovernmental Panel on Climate Change (IPCC) released various greenhouse gas emission scenarios to simulate future climate changes. This project uses future climate scenario data from the MRI-CGCM3 climate model under medium–low emissions (RCP4.5) and high emissions (RCP8.5). We analyzed the temperature and precipitation trends in the Loess Plateau from 2030 to 2100 (Figure 8). Under the RCP4.5 scenario, the annual mean temperature in the Loess Plateau shows a significant increasing trend from 2030 to 2100 (p < 0.05), increasing by 0.019 °C each year. The annual precipitation shows a weak, non-significant increasing trend (p > 0.05, 0.008 mm/year). Under the RCP8.5 scenario, the annual mean temperature shows a significant increasing trend (p < 0.05), with a faster yearly rise of 0.064 °C compared to RCP4.5. The annual mean precipitation shows a non-significant increasing trend (p > 0.05), with an increase rate of 0.746 mm/year. In the seasonal temperature and precipitation predictions, different seasons exhibit varying trends. Under the RCP4.5 scenario, all four seasons show significant increasing temperature trends (p < 0.05), with the highest increase rate in summer (0.022 °C/year) and the lowest in winter (0.015 °C/year). Spring and autumn temperatures increase at the same rate of approximately 0.018 °C/year. In the RCP4.5 scenario, spring and winter precipitation shows a non-significant increasing trend (p > 0.05), with rates of 0.015 mm/year and 0.059 mm/year, respectively. Summer and autumn precipitation shows a non-significant decreasing trend (p > 0.05), with rates of −0.139 mm/year and −0.094 mm/year, respectively. Under the RCP8.5 scenario, all four seasons show significant increasing temperature trends (p < 0.05). Winter temperatures increase at the highest rate of 0.069 °C/year, while spring temperatures increase at the lowest rate of 0.061 °C/year. Summer and autumn temperatures increase at rates of 0.062 °C/year and 0.063 °C/year, respectively. In the RCP8.5 scenario, only winter precipitation shows a significant increasing trend (p < 0.05), with an increase rate of 0.085 mm/year. Other seasonal precipitation changes are non-significant (p > 0.05) but show increasing trends. Spring and autumn precipitation increases at the most noticeable rates of 0.224 mm/year and 0.249 mm/year, respectively, while summer precipitation increases at a relatively lower rate of 0.091 mm/year.

3.6. Prediction of Phenological Changes under Different Climatic Scenarios

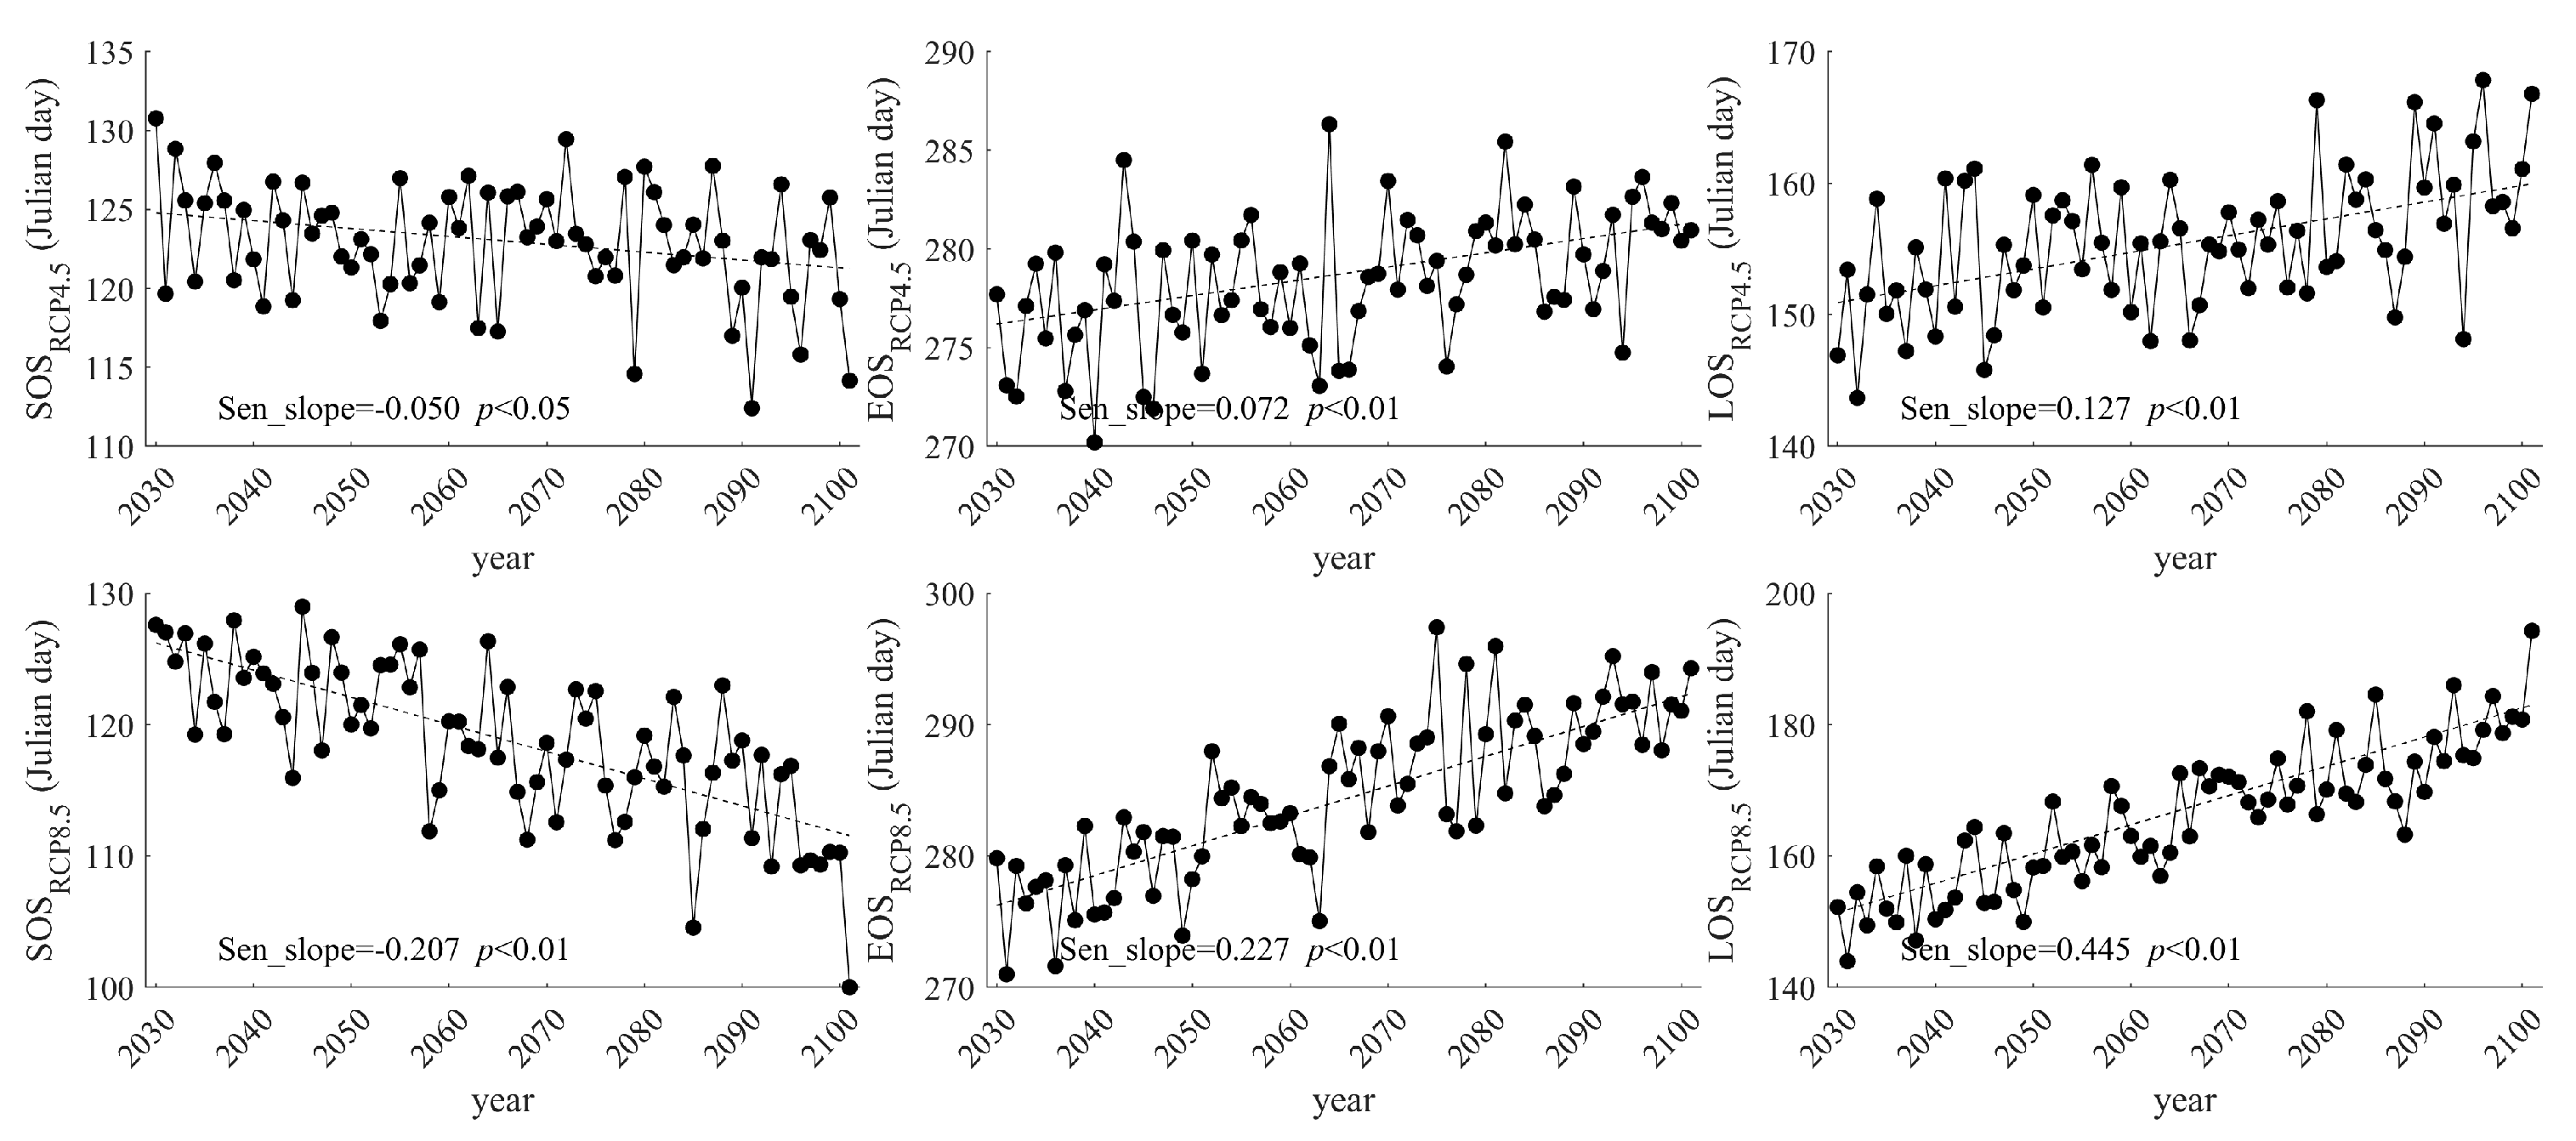
Figure 9 and Figure 10 show the SOS, EOS and LOS trend changes and spatial distribution in the Loess Plateau from 2030 to 2100 under the RCP4.5 and RCP8.5 scenarios. Under RCP4.5, overall, SOS advances from 131 d to 112 d at 0.05 d/year (p < 0.05) (Figure 9). Within the region, there is also a widespread trend in advancement, with 78.19% of pixels showing an advance; among them, 17.52% of pixels show a significant advance, with an average rate of change of approximately 0.1 d/year (p < 0.05). These significantly advanced pixels are mainly located in the Maowusu Desert, the southern part of the Loess Plateau, and western Shanxi (Figure 10). These areas are dominated by vegetation types such as grassland, coniferous and broadleaf forests, and cultivated crops. EOS delays from 272 d to 288 d at 0.072 d/year (p < 0.01) (Figure 9), the spatial variations in the changes are evident, with a larger delay observed in the area to the east of the central line of the Loess Plateau and a smaller delay to the west (Figure 10). The areas where the EOS shows a significant delay are mainly located in the central and western parts of the Loess Plateau, accounting for 61.44% of the region. The rate of change is approximately 0.11 day/year (p < 0.05). This region is dominated by grassland and cultivated crops. LOS extends from 143 d to 166 d at0.127 d/year (p < 0.01) (Figure 9); the regions with significant changes in LOS are mainly distributed in the basin areas west of the Taihang Mountain and at the intersections of the Loess Plateau with Inner Mongolia, Ningxia, Gansu, and Shaanxi, with a change rate of approximately 0.16 days/year (p < 0.05).
Compared to the RCP4.5 scenario, under the RCP8.5 scenario, the changes in SOS, EOS and LOS on the Loess Plateau are more significant (p < 0.01) and exhibit larger magnitudes of change (all greater than 0.2 d/year), both in the overall trend (Figure 9) and in the spatial distribution (Figure 10). The intra-regional patterns of differences are similar to those under the RCP4.5 scenario, but the contrasts are more pronounced.

4. Discussion

It is generally believed that climate change is the main driving force of the seasonal–interannual dynamics of vegetation growth in the Northern Hemisphere [35]. The effect of climatic variables on vegetation phenology is contingent upon the varying stages of phenological occurrences and their respective significance in particular regions [11]. In the past few decades, there are obvious regional differences in climate change on the Loess Plateau; although the Loess Plateau is warm and humid as a whole, it tends to be warm and dry in the southeast and warm and humid in the northwest [36]. Our results confirm that under the background of climate change with rising temperature, the phenological changes in vegetation in the southeast and northwest of the Loess Plateau are not consistent. The SOS in the southeast, specifically within the semi-humid zone of the Loess Plateau, is significantly ahead of schedule, and the areas where EOS is significantly delayed are concentrated in the northwest of the semi-arid Loess Plateau. Warming in spring helps vegetation break winter dormancy faster and switch to the next stage of ontogeny earlier [37]. However, in the drier northwest of the Loess Plateau, the water demand of SOS may take precedence over temperature, and the higher spring temperature aggravates the evaporation of soil water, which adversely affects the growth of vegetation [38]. The significant postponement of EOS in the northwest of the Loess Plateau may be due to the fact that the increase in autumn precipitation alleviates the limitation of water deficiency on nutrient absorption and prolongs the life cycle of vegetation [39]. Additionally, it is noteworthy that our study utilizes Sen’s slope method to investigate vegetation phenology and trends in climate change. While this method does not require the assumption of a specific data distribution and possesses robust characteristics [33,34], its reliance on median calculation may render it less sensitive to certain changes within the dataset, particularly when multiple trends coexist. Wang et al. (2019), in their research on vegetation gradual change pattern detection, have highlighted the existence of diverse patterns of vegetation change, suggesting that the selection of a single trend analysis method may not be sufficient to fully capture the complexity of vegetation dynamics [40]. Consequently, the exclusive use of Sen’s slope method in this paper to explore the direction and magnitude of vegetation phenology changes may be limiting, and we anticipate improving upon this approach in future studies.
Since the beginning of the 20th century, the trend of climate warming slow down has been generally observed in most parts of the world; that is, the intermittent period of climate warming [41]. This leads to the stagnation or reversal of the advance trend in SOS in some parts of the Northern Hemisphere [42]. However, based on the available evidence, it is not enough to tell whether the weakening trend in SOS is a short-term change or whether it will continue into the coming decades. There are great spatial differences in phenological changes in different continents and latitudes [43]. In the Loess Plateau, our prediction results show that vegetation phenology has made significant progress due to the significant increase in temperature from 2030 to 2100, and each phenological phase has changed significantly under the prediction of two carbon emission scenarios. Among them, the SOS was significantly ahead of schedule (RCP4.5 was 0.05 d, and RCP 8.5 for 0.21 d/year), which was significantly higher than that of SOS (not significantly delayed, 0.06 d/year) from 1982 to 2015. However, due to the limitation of precipitation, light and other climatic factors, the advance speed of SOS in high latitudes is significantly lower than that in lower latitudes [44]. The spring precipitation in the Loess Plateau did not increase significantly from 2030 to 2100, which may alleviate the restriction of water on SOS in advance in arid and semi-arid areas. In the RCP4.5 climate scenario, the delay rate of EOS is expected to be slower than that in 1982–2015, during which the precipitation decreases in summer and autumn. Therefore, the seasonal precipitation in the phenological period may be one of the main factors controlling the phenological changes in the Loess Plateau.
In temperate vegetation, phenology varies greatly in different geomorphology and climate types according to different climatic zones and vegetation types [45]. This may lead to regional differences in phenological changes within a certain range, with different climate changes. A climate forecast for the Mediterranean region shows that due to drought (reduced annual precipitation and prolonged summer drought) and increased temperature (which will increase evaporation and further reduce soil water content), this forces the seasonal activity of vegetation to move to wetter areas [46]. Our conclusion confirms that the SOS on the Loess Plateau has significantly advanced, expanding southward from the Maowusu Desert in the north under RCP4.5 to the Guanzhong Plain, southern Longzhong Plateau, and other humid areas in the southern Loess Plateau under RCP8.5. The area where the EOS is significantly delayed has also expanded southward from the Ordos Plateau, Maowusu Desert, and Yinchuan Basin under RCP4.5 to the southern Longzhong Plateau and Guanzhong Plain under RCP8.5. It is worth noting that future climate change is expected to greatly exceed the currently observed climate anomalies [47]. We have a limited understanding of the climatic mechanisms that control the dynamics of vegetation growth, and the prediction of future vegetation phenological changes is highly uncertain [48]. The seasonal climate factors that control phenology need to be further studied and analyzed.

5. Conclusions

In the analysis of the phenological changes in vegetation in the past 30 years, it is found that the phenology of the Loess Plateau shows obvious regional changes. SOS was mainly distributed in the southeast of the Loess Plateau in advance, while EOS was significantly delayed in the northeast of the Loess Plateau. Under the expectation of further warming on the Loess Plateau, especially under different warming scenarios, the vegetation phenology will change significantly during 2030–2100. The start of the growing season (SOS) is significantly advancing, while the end of the growing season (EOS) is significantly delaying. However, compared to the RCP4.5 scenario, the rate of advancement in SOS and the rate of delay in EOS under the RCP8.5 scenario will be significantly faster. This indicates that under a higher emission scenario (RCP8.5), the seasons on the Loess Plateau are shifting even more rapidly, with earlier starts to the growing season and later ends, potentially impacting agricultural activities and ecosystem functioning in the region. In short, our results reveal the spatio-temporal variations in the phenology of the Loess Plateau over the coming decades under different carbon emission scenarios, which will provide key data support for understanding the changes in vegetation under global warming.

Author Contributions

Conceptualization, H.H. and T.Z.; methodology, H.H. and T.Z.; software, P.L.; investigation, Z.T. and X.L.; resources, T.Z. and G.M.; data curation, X.L. and P.L.; writing—original draft preparation, H.H. and G.M.; writing—review and editing, H.H. and T.Z.; project administration, H.H.; research group leader, H.H. and T.Z. All authors have read and agreed to the published version of the manuscript.

Funding

This research was supported by the research plan project of Shaanxi Provincial Department of Education, Grant No. 23JK0624; the MOE (Ministry of Education in China) Project of Humanities and Social Sciences, Grant No.23YJCZH068; Natural Science Basic Research Program of Shaanxi, China, Grant No.2024JC-YBMS-233.

Data Availability Statement

The data presented in this study are available on request from the corresponding author.

Conflicts of Interest

The authors declare no conflict of interest.

References

  1. Badeck, F.W.; Bondeau, A.K.; Doktor, D.; Lucht, W.; Schaber, J. Responses of spring phenology to climate change. New Phytol. 2004, 162, 295–309. [Google Scholar] [CrossRef]
  2. Richardson, A.D.; Keenan, T.F.; Migliavacca, M.; Ryu, Y.; Sonnentag, O.; Toomey, M. Climate change, phenology, and phenological control of vegetation feedbacks to the climate system. Agric. For. Meteorol. 2013, 169, 156–173. [Google Scholar] [CrossRef]
  3. Kong, D.; Zhang, Q. Changes in vegetation phenology and meteorological factors on the Qinghai Tibet Plateau from 1982 to 2013. J. Geogr. Sci. 2017, 72, 39–52. (In Chinese) [Google Scholar]
  4. Zhen, J.; Ge, Q. Changes of Plant Phenological Period and Its Response to Climate Change for the last 40 years in China. Agric. Meteorol. 2003, 24, 28–32. (In Chinese) [Google Scholar]
  5. Zheng, J.; Ge, Q.; Hao, Z. Impacts of climate warming on plants phenophases in China for the last 40 years. Chin. Sci. Bull. 2002, 47, 1826–1831. [Google Scholar]
  6. Jeong, S.J.; Chang-Hoi, H.O.; Gim, H.J.; Brown, M.E. Phenology shifts at start vs. end of growing season in temperate vegetation over the Northern Hemisphere for the period 1982–2008. Glob. Chang. Biol. 2011, 17, 2385–2399. [Google Scholar]
  7. Williams, S.E.; Bolitho, E.E.; Fox, S. Climate change in Australian tropical rainforests: An impending environmental catastrophe. Proc. Biol. Sci. 2003, 270, 1887–1892. [Google Scholar] [CrossRef]
  8. Ge, Q.; Dai, J.; Zhen, J. Progress in Phenology Research and Challenges Faced by Modern Phenology in China. Bull. Chin. Acad. Sci. 2010, 25, 310–316. (In Chinese) [Google Scholar]
  9. Zhen, J.; Ge, Q. The impact of climate warming on plant phenological changes in China over the past 40 years. Chin. Sci. Bull. 2002, 47, 64–69. (In Chinese) [Google Scholar]
  10. Chmielewski, F.M.; Rötzer, T. Response of tree phenology to climate change across Europe. Agric. For. Meteorol. 2001, 108, 101–112. [Google Scholar] [CrossRef]
  11. Piao, S.L.; Liu, Q.; Chen, A.P.; Janssens, I.A.; Fu, Y.S.; Dai, J.H.; Liu, L.L.; Lian, X.; Shen, M.G.; Zhu, X.L. Plant phenology and global climate change: Current progresses and challenges. Glob. Chang. Biol. 2019, 25, 1922–1940. [Google Scholar] [CrossRef] [PubMed]
  12. Pörtner, H.-O.; Roberts, D.C.; Tignor, M.; Poloczanska, E.S.; Mintenbeck, K.; Alegría, A.; Craig, M.; Langsdorf, S.; Löschke, S.; Möller, V.; et al. Climate Change 2022: Impacts, Adaptation and Vulnerability. Contribution of Working Group II to the Sixth Assessment Report of the Intergovernmental Panel on Climate Change; Cambridge University Press: Cambridge, UK; New York, NY, USA, 2022; p. 3056. [Google Scholar]
  13. Peñuelas, J.; Filella, I. Responses to a Warming World. Science 2001, 294, 793–795. [Google Scholar] [CrossRef]
  14. Menzel, A.; Sparks, T.; Estrella, N.; Koch, E.; Aasa, A.; Ahas, R.; Alm-KÜBler, K.; Bissolli, P.; BraslavskÁ, O.G.; Briede, A.; et al. European phenological response to climate change matches the warming pattern. Glob. Chang. Biol. 2006, 12, 1969–1976. [Google Scholar] [CrossRef]
  15. Hufkens, K.; Keenan, T.F.; Flanagan, L.B.; Scott, R.L.; Bernacchi, C.J.; Joo, E.; Brunsell, N.A.; Verfaillie, J.; Richardson, A.D. Productivity of North American grasslands is increased under future climate scenarios despite rising aridity. Nat. Clim. Chang. 2016, 6, 710–714. [Google Scholar] [CrossRef]
  16. Piao, S.; Fang, J.; Zhou, L.; Ciais, P.; Zhu, B. Variations in satellite-derived phenology in China’s temperate vegetation. Glob. Chang. Biol. 2006, 12, 672–685. [Google Scholar] [CrossRef]
  17. Ma, X.; Bai, H.; He, Y.; Qin, J. The Vegetation Remote Sensing Phenology of Qinling Mountains Based on NDVI and It’s Response to Temperature:Taking within the Territory of Shaanxi as an Example. Sci. Geogr. Sin. 2015, 35, 125–130. (In Chinese) [Google Scholar]
  18. Li, Q.; Zhang, C.; Ren, Z. Analysis of Temporal and Spatial Variation of Vegetation Phenology in the Loess Plateau. Sci. Agric. Sin. 2016, 49, 4352–4365. (In Chinese) [Google Scholar]
  19. Liang, N.; Emily, E.R.; Bradley, S. Raymond Projected Changes in Climate Extremes over the Northeastern United States. J. Clim. 2015, 28, 3289–3310. [Google Scholar]
  20. Intergovernmental Panel on Climate Change (IPCC). Climate Change 2013: The Physical Science Basis; Cambridge University Press: Cambridge, UK, 2014; pp. 31–116. [Google Scholar]
  21. Duveneck, M.J.; Thompson, J.R. Climate change imposes phenological trade-offs on forest net primary productivity. J. Geophys. Res. 2017, 122, 2298–2313. [Google Scholar] [CrossRef]
  22. Xie, Y.; Wang, X.; Silander, J.A., Jr. Deciduous forest responses to temperature, precipitation, and drought imply complex climate change impacts. Proc. Natl. Acad. Sci. USA 2015, 112, 13585–13590. [Google Scholar] [CrossRef]
  23. Ling, X. Study on the Spatiotemporal Changes of Vegetation Phenology in the Qinghai Tibet Plateau under Climate Change Scenarios; University of Electronic Science and Technology: Chengdu, China, 2022. (In Chinese) [Google Scholar]
  24. Wang, X. Simulation and Impact Mechanism of Regional Vegetation Phenological Changes Based on Multi Source Data; University of the Chinese Academy of Sciences: Beijing, China, 2018. (In Chinese) [Google Scholar]
  25. Gou, J.J.; Wang, F.; Jin, K.; Dong, Q. Cooling ellectindueed by vegetation restoration on the Loess Platea. Acta Feologica Sin. 2017, 38, 3970–3978. (In Chinese) [Google Scholar]
  26. Xie, B.N.; Qin, Z.F.; Wang, Y.; Chang, Q.R. Spatial and temporal variation in terrestrial net primary productivity on Chinese Loess Plateau and its influential factors. J. Trans. Chin. Soc. Agric. Eng. 2014, 30, 252–261. (In Chinese) [Google Scholar]
  27. Ji, Z.X.; Pei, T.T.; Chen, Y.; Qin, G.X.; Hou, Q.Q.; Xie, B.P.; Wu, H.W. Vegetation phenology change and its response to seasonal climate changes on the Loess Plateau. Acta Feologica Sin. 2021, 41, 6600–6612. (In Chinese) [Google Scholar]
  28. Zhou, S. Meteorology and Climatology, 3rd ed.; Higher Education Press: Beijing, China, 1997. (In Chinese) [Google Scholar]
  29. Comprehensive Investigation of the Loess Plateau of the Chinese Academy of Sciences. Resource Picture Collection of the Agricultural Climate of Loess High Lands; China Meteorological Press: Beijing, China, 1990; 45p. (In Chinese) [Google Scholar]
  30. Xu, Z.X.; Zhang, N. Long-term trend of precipitation in the Yellow River basin during the past 50 years. Geogr. Res. 2006, 25, 27–34. (In Chinese) [Google Scholar] [CrossRef]
  31. Atzberger, C.; Eilers, P.H. A time series for monitoring vegetation activity and phenology at 10-daily time steps covering large parts of South America. Int. J. Digit. Earth 2011, 4, 365–386. [Google Scholar] [CrossRef]
  32. Eilers, P.H.C. A perfect smoother. Anal. Chem. 2003, 75, 3631–3636. [Google Scholar] [CrossRef]
  33. Shi, Q.; Lu, J.; Yu, Q.; Han, J. Temporal and Spatial Dynamics in Carbon Utilization Efficiency and Driving Mechanisms in Southeast Tibet from 2012 to 2022. Forests 2024, 15, 338. [Google Scholar] [CrossRef]
  34. Yang, X.; Meng, F.; Fu, P.; Zhang, Y.; Liu, Y. Spatiotemporal change and driving factors of the Eco-Environment quality in the Yangtze River Basin from 2001 to 2019. Ecol. Indic. 2021, 131, 108214. [Google Scholar] [CrossRef]
  35. Seddon, A.W.R.; Macias-Fauria, M.; Long, P.R.; Benz, D.; Willis, K.J. Sensitivity of global terrestrial ecosystems to climate variability. Nature 2016, 531, 229–232. [Google Scholar] [CrossRef]
  36. Chen, L.X.; Zhou, X.J.; Li, W.L.; Luo, Y.F.; Zhu, W.Q. Characteristics of the climate change and its formation mechanism in china in last 80 years. Acta Meteorol. Sin. 2004, 62, 634–646. (In Chinese) [Google Scholar]
  37. Saxe, H.; Cannell, M.; Johnsen, Ø.; Ryan, M.; Vourlitis, G. Tree and forest functioning in response to global warming. New Phytol. 2001, 149, 369–399. [Google Scholar] [CrossRef]
  38. Nan, C.; Tao, W.; Huijuan, N.; Yuecun, M.; Xuhui, W.; Myneni, R.B.; Shilong, P. Changes in satellite-derived spring vegetation green-up date and its linkage to climate in China from 1982 to 2010: A multimethod analysis. Glob. Chang. Biol. 2013, 19, 881–891. [Google Scholar]
  39. Estiarte, M.; Peñuelas, J. Alteration of the phenology of leaf senescence and fall in winter deciduous species by climate change: Effects on nutrient proficiency. Glob. Chang. Biol. 2015, 21, 1005–1017. [Google Scholar] [CrossRef] [PubMed]
  40. Wang, J.; Xie, Y.; Wang, X.; Dong, J.; Bie, Q. Detecting Patterns of Vegetation Gradual Changes (2001–2017) in Shiyang River Basin, Based on a Novel Framework. Remote Sens. 2019, 11, 2475. [Google Scholar] [CrossRef]
  41. Easterling, D.R.; Wehner, M.F. Is the climate warming or cooling? Geophys. Res. Lett. 2009, 36. [Google Scholar] [CrossRef]
  42. Barichivich, J.; Briffa, K.R.; Myneni, R.B.; Osborn, T.J.; Melvin, T.M.; Ciais, P.; Piao, S.; Tucker, C. Large-scale variations in the vegetation growing season and annual cycle of atmospheric CO2 at high northern latitudes from 1950 to 2011. Glob. Chang. Biol. 2013, 19, 3167–3183. [Google Scholar] [CrossRef]
  43. Wang, X.; Piao, S.; Xu, X.; Ciais, P.; MacBean, N.; Myneni, R.B.; Li, L. Has the advancing onset of spring vegetation green-up slowed down or changed abruptly over the last three decades? Glob. Ecol. Biogeogr. 2015, 24, 621–631. [Google Scholar] [CrossRef]
  44. Cohen, J.; Furtado, J.C.; Barlow, M.; Alexeev, V.A.; Cherry, J.E. Asymmetric seasonal temperature trends. Geophys. Res. Lett. 2012, 39. [Google Scholar] [CrossRef]
  45. AghaKouchak, A.; Farahmand, A.; Melton, F.S.; Teixeira, J.; Anderson, M.C.; Wardlow, B.D.; Hain, C.R. Remote sensing of drought: Progress, challenges and opportunities. Rev. Geophys. 2015, 53, 452–480. [Google Scholar] [CrossRef]
  46. Christensen, J.H.; Hewitson, B.; Busuioc, A.; Chen, A.; Gao, X.; Held, R.; Jones, R.; Kolli, R.K.; Kwon, W.K.; Laprise, R. Regional climate projections. In Climate Change, 2007: The Physical Science Basis; Cambridge University Press: Cambridge, UK; New York, NY, USA, 2007. [Google Scholar]
  47. Fan, F.; Bradley, R.S.; Rawlins, M.A. Climate change in the northeastern US: Regional climate model validation and climate change projections. Clim. Dyn. 2014, 43, 145–161. [Google Scholar] [CrossRef]
  48. Anav, A.; Murray-Tortarolo, G.N.; Friedlingstein, P.; Sitch, S.A.; Piao, S.; Zhu, Z. Evaluation of Land Surface Models in Reproducing Satellite Derived Leaf Area Index over the High-Latitude Northern Hemisphere. Part II: Earth System Models. Remote Sens. 2013, 5, 3637–3661. [Google Scholar] [CrossRef]
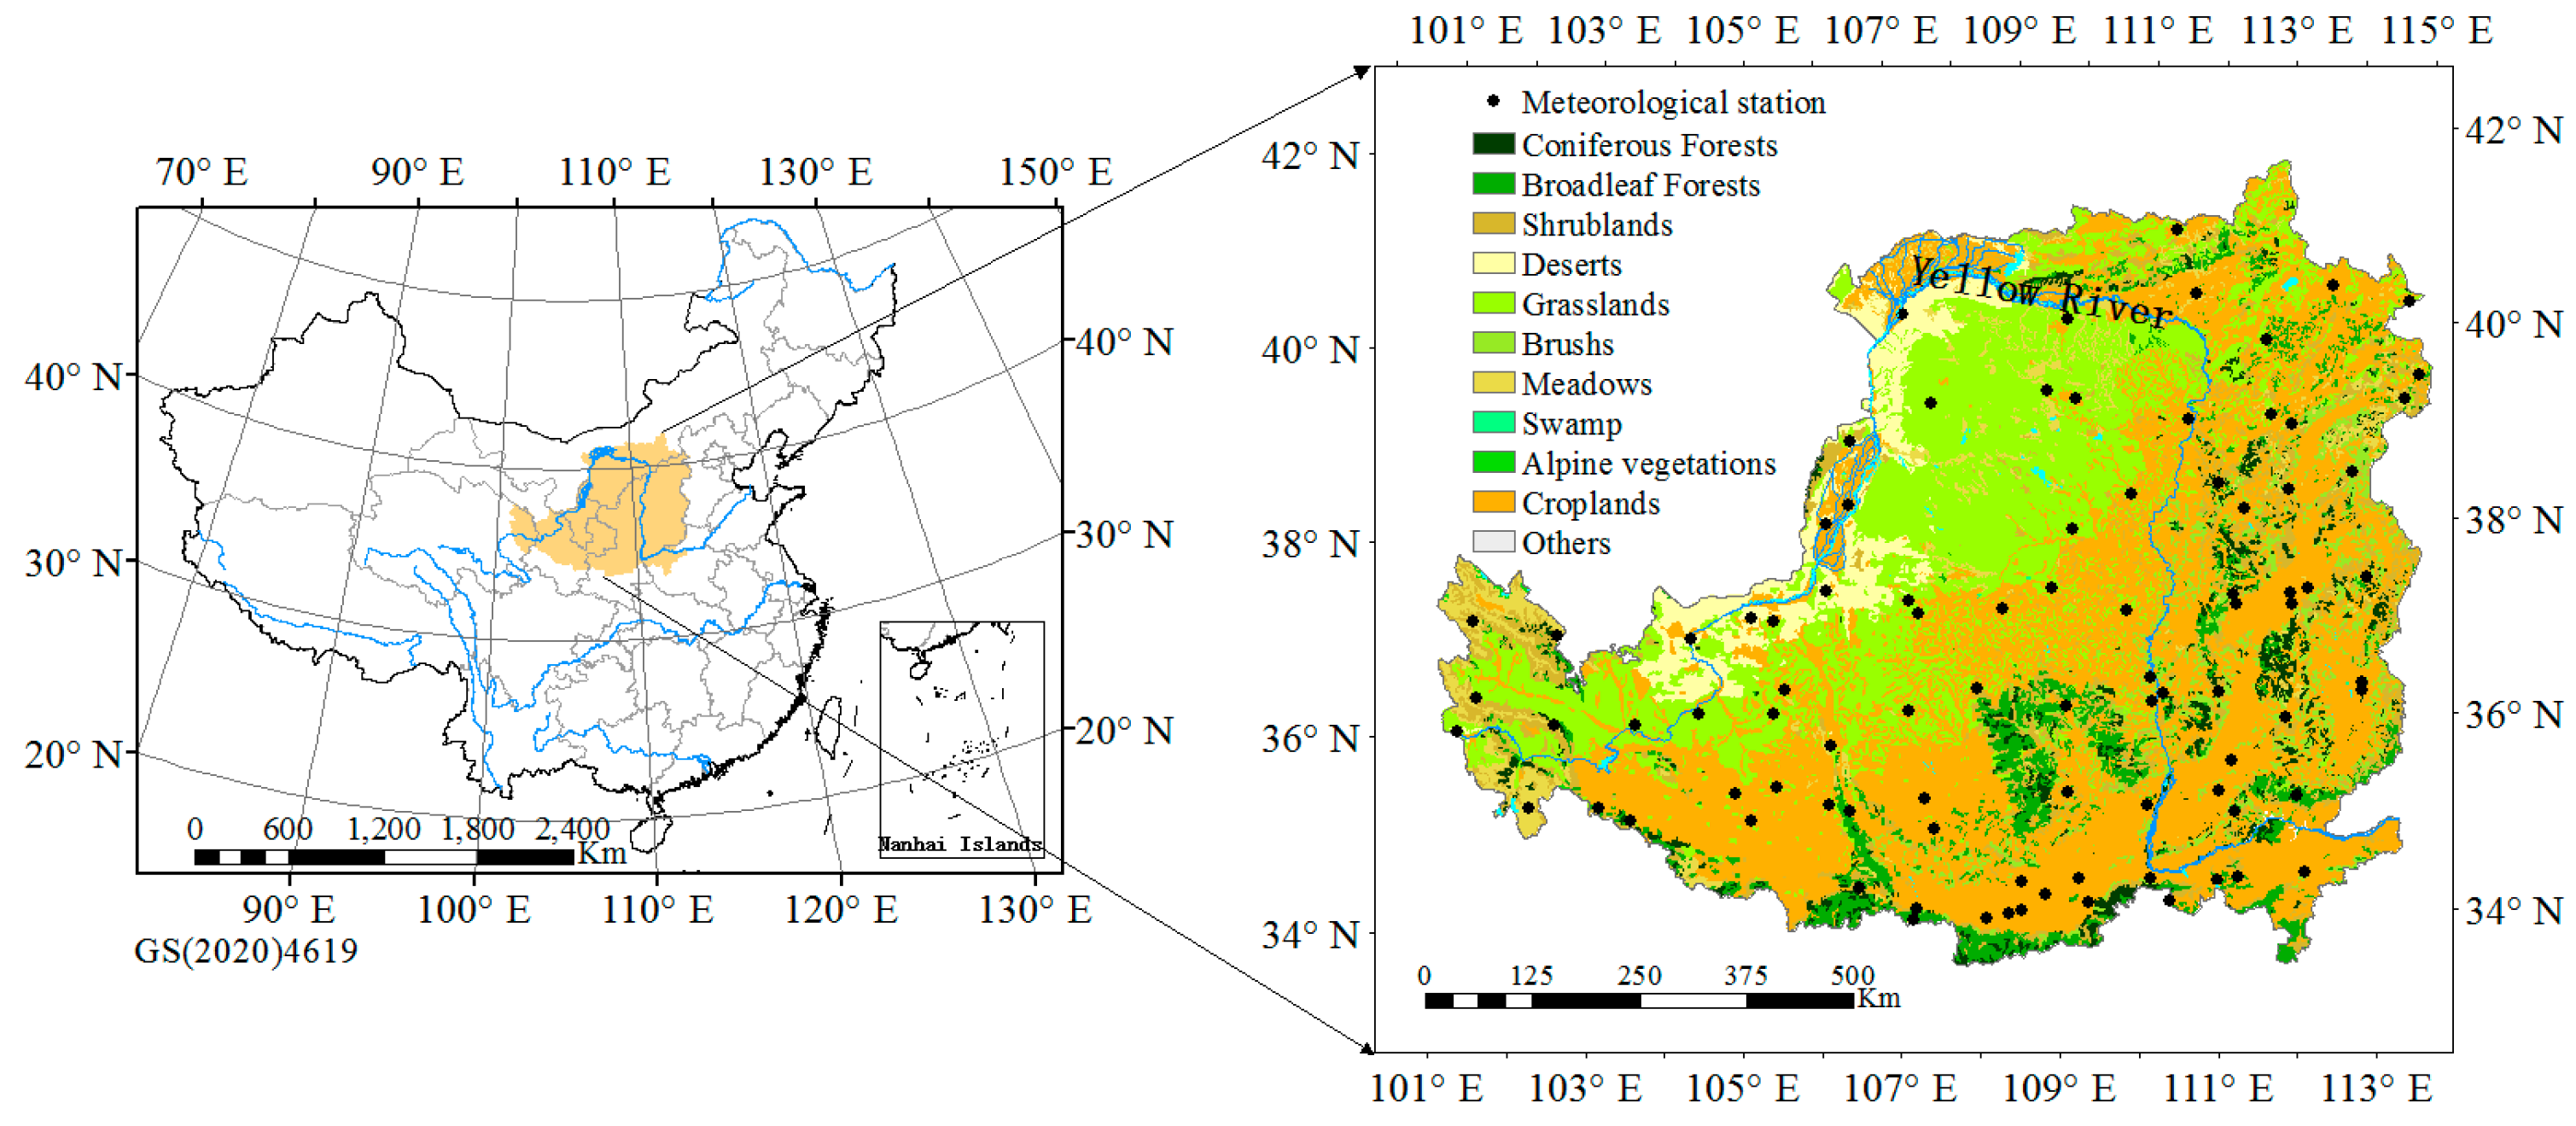
Figure 1. The geographical location of the Loess Plateau and its vegetation distribution.
Forests 15 01526 g001
Figure 2. The trend in SOS in the Loess Plateau from 1982 to 2015.
Forests 15 01526 g002
Figure 3. The trend in EOS in the Loess Plateau from 1982 to 2015.
Forests 15 01526 g003
Figure 4. The trend in LOS in the Loess Plateau from 1982 to 2015.
Forests 15 01526 g004
Figure 5. Spatial distribution of temperature and precipitation trends in the Loess Plateau from 1982 to 2015.
Forests 15 01526 g005
Figure 6. Correlation between SOS and spring temperature and precipitation in the Loess Plateau.
Forests 15 01526 g006
Figure 7. Correlation between EOS and summer and autumn temperature and precipitation in the Loess Plateau.
Forests 15 01526 g007
Figure 8. Trends in temperature and precipitation changes in the Loess Plateau from 2030 to 2100, the blue line represent the RCP4.5 and the red linerepresentRCP8.5.
Forests 15 01526 g008
Figure 9. The trend in SOS, EOS and LOS in the Loess Plateau from 2030 to 2100.
Forests 15 01526 g009
Figure 10. Spatial distribution of phenological changes in the Loess Plateau from 2030 to 2100.
Forests 15 01526 g010
Disclaimer/Publisher’s Note: The statements, opinions and data contained in all publications are solely those of the individual author(s) and contributor(s) and not of MDPI and/or the editor(s). MDPI and/or the editor(s) disclaim responsibility for any injury to people or property resulting from any ideas, methods, instructions or products referred to in the content.