Article

Suitability and Structural Optimization of Vegetation Restoration on the Loess Plateau: A MaxEnt Model-Based Study of Environmental and Anthropogenic Impacts

by
Jie Luo
1,
Yirui Chen
1,
Ying Wu
1,
Guoying Xie
1,
Weitian Jia
1,
Muhammad Fahad Sardar
2,
Manal Abdulaziz Binobead
3 and
Xiang Li
1,*
1
College of Landscape Architecture and Art, Northwest A&F University, Yangling 712100, China
2
Key Laboratory of Ecological Prewarning, Protection and Restoration of Bohai Sea, Ministry of Natural Resources, School of Life Sciences, Shandong University, Qingdao 266237, China
3
Department of Food Science and Nutrition, College of Agriculture Food Science, King Saud University, Riyadh 11451, Saudi Arabia
*
Author to whom correspondence should be addressed.
Forests 2024, 15(9), 1528; https://doi.org/10.3390/f15091528
Submission received: 27 July 2024 / Revised: 23 August 2024 / Accepted: 27 August 2024 / Published: 30 August 2024
(This article belongs to the Section Forest Ecology and Management)

Abstract

:
In recent years, the problem of ecosystem degradation caused by human activities has become increasingly serious. Vegetation restoration is a key means to solve this problem, which has increased. To address the suitability and structural optimization of vegetation restoration in the Loess Plateau (China), the MaxEnt model was used to quantify the impacts of environmental and human activities on the planting suitability of vegetation restoration species at the raster scale. Three layers of trees, shrubs, and herbs with 12 common vegetation restoration species were selected. The factor index system was constructed by combining climatic, ecological, and socio-economic data, and the MaxEnt model predicted land suitability. It was found that human activities significantly increased the unsuitable planting area. This especially affected Robinia pseudoacacia in the tree layer and Amorpha fruticosa in the shrub layer. High and medium suitable areas were mainly sparsely populated areas with close water sources. Through maximum suitability optimization, it was identified that the overall spatial distribution of the three layers in the study area was relatively consistent, and the structural dominance of trees + shrubs + herbs and single herbs in the vertical structure was obvious; these were concentrated in the southwestern and northeastern parts of the study area, respectively. In addition, organic content (OC) and distance from the road to woodland (RW) were the dominant factors affecting land suitability, with a contribution rate of more than 50% and up to 80%. These results provide a scientific basis for optimizing planting structures. They are of significant theoretical and practical significance in guiding vegetation restoration work.

1. Introduction

In recent years, the intensification of human activities has significantly altered the structure and function of urban ecosystems, leading to significant damage to ecosystem health [1], resulting in fragmented landscapes, reduced biodiversity, and degradation of ecosystem services [2], which have attracted extensive attention from both the scientific community and policymakers. In this context, vegetation restoration, as a key means to alleviate the contradiction between ecological environmental protection and socio-economic development [3], has become increasingly critical in achieving sustainable development.
To address these challenges, ecologists and environmental managers increasingly rely on advanced models and tools to assess and guide vegetation restoration efforts. Species distribution modeling (SDM) is one of these key tools, which predicts the spatial distribution of species on the landscape and their changes over time or space by combining observations of species occurrence or abundance with environmental variables [4]. There are various types of SDM models, including dynamic simulation models [5], such as CLIMEX and BIOCLIM, generalized additive models (GAMs) [6], generalized linear models (GLMs), and maximum entropy (MaxENT) models [7], among others. Each of these models has its advantages; the MaxEnt model has been widely recognized and applied due to its fast operation speed, high prediction accuracy, and ability to assess important environmental factors [8] automatically. Currently, the MaxEnt model has been applied in a variety of fields, such as predicting the distribution of individual animal species from a small number of records [9], predicting the suitability of crops [10], and investigating the relationship between medicinal plants’ geographical distribution and environmental conditions [11].
Climate, ecological conditions, and human activities are crucial factors that affect the growth and distribution of plants. Climate is a major driver of plant species distribution [12]. For example, plants are sensitive to changes in precipitation, and changes in rainfall conditions affect effective plant water, functional type, and phenology to some extent [13]. Ecological conditions such as topography, vegetation, and soils also significantly impact plant distribution. Topographic changes affect vegetation vertical structure by modulating the microclimate, while slope affects plant distribution suitability by influencing hydrological characteristics [14]. Interactions between plants and soil and soil microorganisms can influence the performance of individual plants, which in turn impacts the distribution of the whole community [15]. In addition, human activities usually have a wide range of effects on plant distribution and abundance in various forms. These effects include soil physicochemical properties, land management, and difficulties properly dealing with pollution from life and production [16].
Previous studies focused on single species and natural factors like temperature, water, and light. However, vegetation restoration usually requires careful consideration of multiple factors such as climate, human disturbance, and the economy [17]. Therefore, a comprehensive evaluation of the effects of these factors on species distribution in vegetation restoration is crucial for accurately assessing the suitability of vegetation restoration and optimizing planting structures.
The Loess Plateau region has lost a large amount of natural vegetation during long-term development, making the region one of the most severely affected by soil erosion in the world, with severe soil erosion, ecological fragility, and sensitivity to climate change [18]. Restoration and re-establishment of vegetation are the most important means to improve ecological conditions in the Loess Plateau region [19], which plays an important role in soil and water conservation in this region [20]. Therefore, it is ecologically imperative to study the suitability of vegetation restoration and optimization of vegetation planting structures on the Loess Plateau.
The Loess Plateau, as a key region on China’s ecological restoration strategy map, has demonstrated remarkable results in its ecological restoration and management. This provides valuable practical cases and experiences for the global ecological governance field. In recent years, the region has actively deployed and implemented a series of comprehensive ecological protection and restoration projects, including returning farmland to forests and grasslands [21], integrated management of small watersheds [22], and construction of silt dams [23], which have effectively curbed the spreading trend of soil erosion and desertification, and contributed to the benign transformation of the Loess Plateau’s ecological environment.
In this study, the Loess Plateau served as the subject of research. The dual impacts of the environment and human activities were analyzed at the raster scale using the MaxEnt model to obtain the significant impact factors of different species and the suitability of different areas for the growth of different vegetation restoration species. At the same time, according to the principle of maximum suitability, it not only provides a basis for optimizing the horizontal and vertical structure of ecosystem restoration but also provides a reference for managers and project implementers. The specific objectives are (1) to determine the suitability distribution of different vegetation restoration species; (2) to optimize the horizontal planting structure of each layer according to the principle of maximum suitability and to determine the vertical structure of the three layers of trees, shrubs, and herbs; and (3) to identify the key factors affecting the suitability distribution of different vegetation restoration species.

2. Materials and Methods

2.1. Study Area

The Loess Plateau (100°~114° E, 33°~41° N) is located in the north-central part of China (Figure 1a), is one of the four major plateaus in China, and is situated on the second step of China’s terrain, with a total area of about 640,000 km2, and the administrative areas involved include southwestern Nei Menggu, the greater part of Shanxi, north-central Shaanxi, east-central Gansu, eastern Qinghai, northwestern Henan, and the Ningxia Hui Autonomous Region. The study area has a warm-temperate continental monsoon climate [24], with a precipitation range of 103 mm~934 mm, with a mean precipitation of 435 mm (Figure 1b), and a temperature range of −9.6 °C~15.4 °C, with a mean temperature of 7.7 °C (Figure 1c). There are 19 soil types in the region, with Cambisols being the dominant soil type, accounting for 45.05% (Figure 1d).
The Loess Plateau consists of seven land use types: arable land, built-up land, forest land, grassland, scrubland, unused land, and water. Among them, grassland and arable land are the main land use types, accounting for 41.08% and 30.36%, respectively. Grassland is more concentrated in the northwestern part of the region, in the Inner Mongolia Autonomous Region. Arable land is more concentrated in Shaanxi Province in the southern part of the region, Shanxi Province in the eastern part, and Henan Province in the southeastern part of the region (Figure 1e).

2.2. Framework

The study used the MaxEnt model to construct a research framework (Figure 2) to quantify the effects of environmental and human activities on the planting suitability of vegetation restoration species while optimizing vegetation restoration structures on the Loess Plateau. Firstly, the distribution points (Figure A1, Figure A2 and Figure A3) of vegetation restoration species in three layers of trees, shrubs, and herbs (4 species in each layer, 12 species in total) and relevant climatic, ecological, and socio-economic data from the study area were obtained. Then, a factor indicator system was constructed according to the species’ growing conditions. A total of 35 environmental factors in 3 categories (Figure A4) were preprocessed to produce data with identical ranges, image sizes, and ranks. The MaxEnt model was applied to estimate 12 species (Table A1) to obtain each species’ land suitability, factor contribution percentage, and factor response curves. We used screened factors for secondary validation because there may be correlations between factors and species data points that may not fully cover the study area. Related studies have shown that the MaxEnt model has higher prediction accuracy when the sample size is small [25]. Finally, the land suitability of plants in three-layer slices was compared cross-grid. The most suitable species were selected according to the principle of maximum suitability to obtain horizontal spatial distributions of each of the trees, shrubs, and herbs. We stacked the three to obtain a vertical structure to optimize the spatial distribution of species for vegetation restoration on the Loess Plateau.

2.3. MaxEnt Predictions

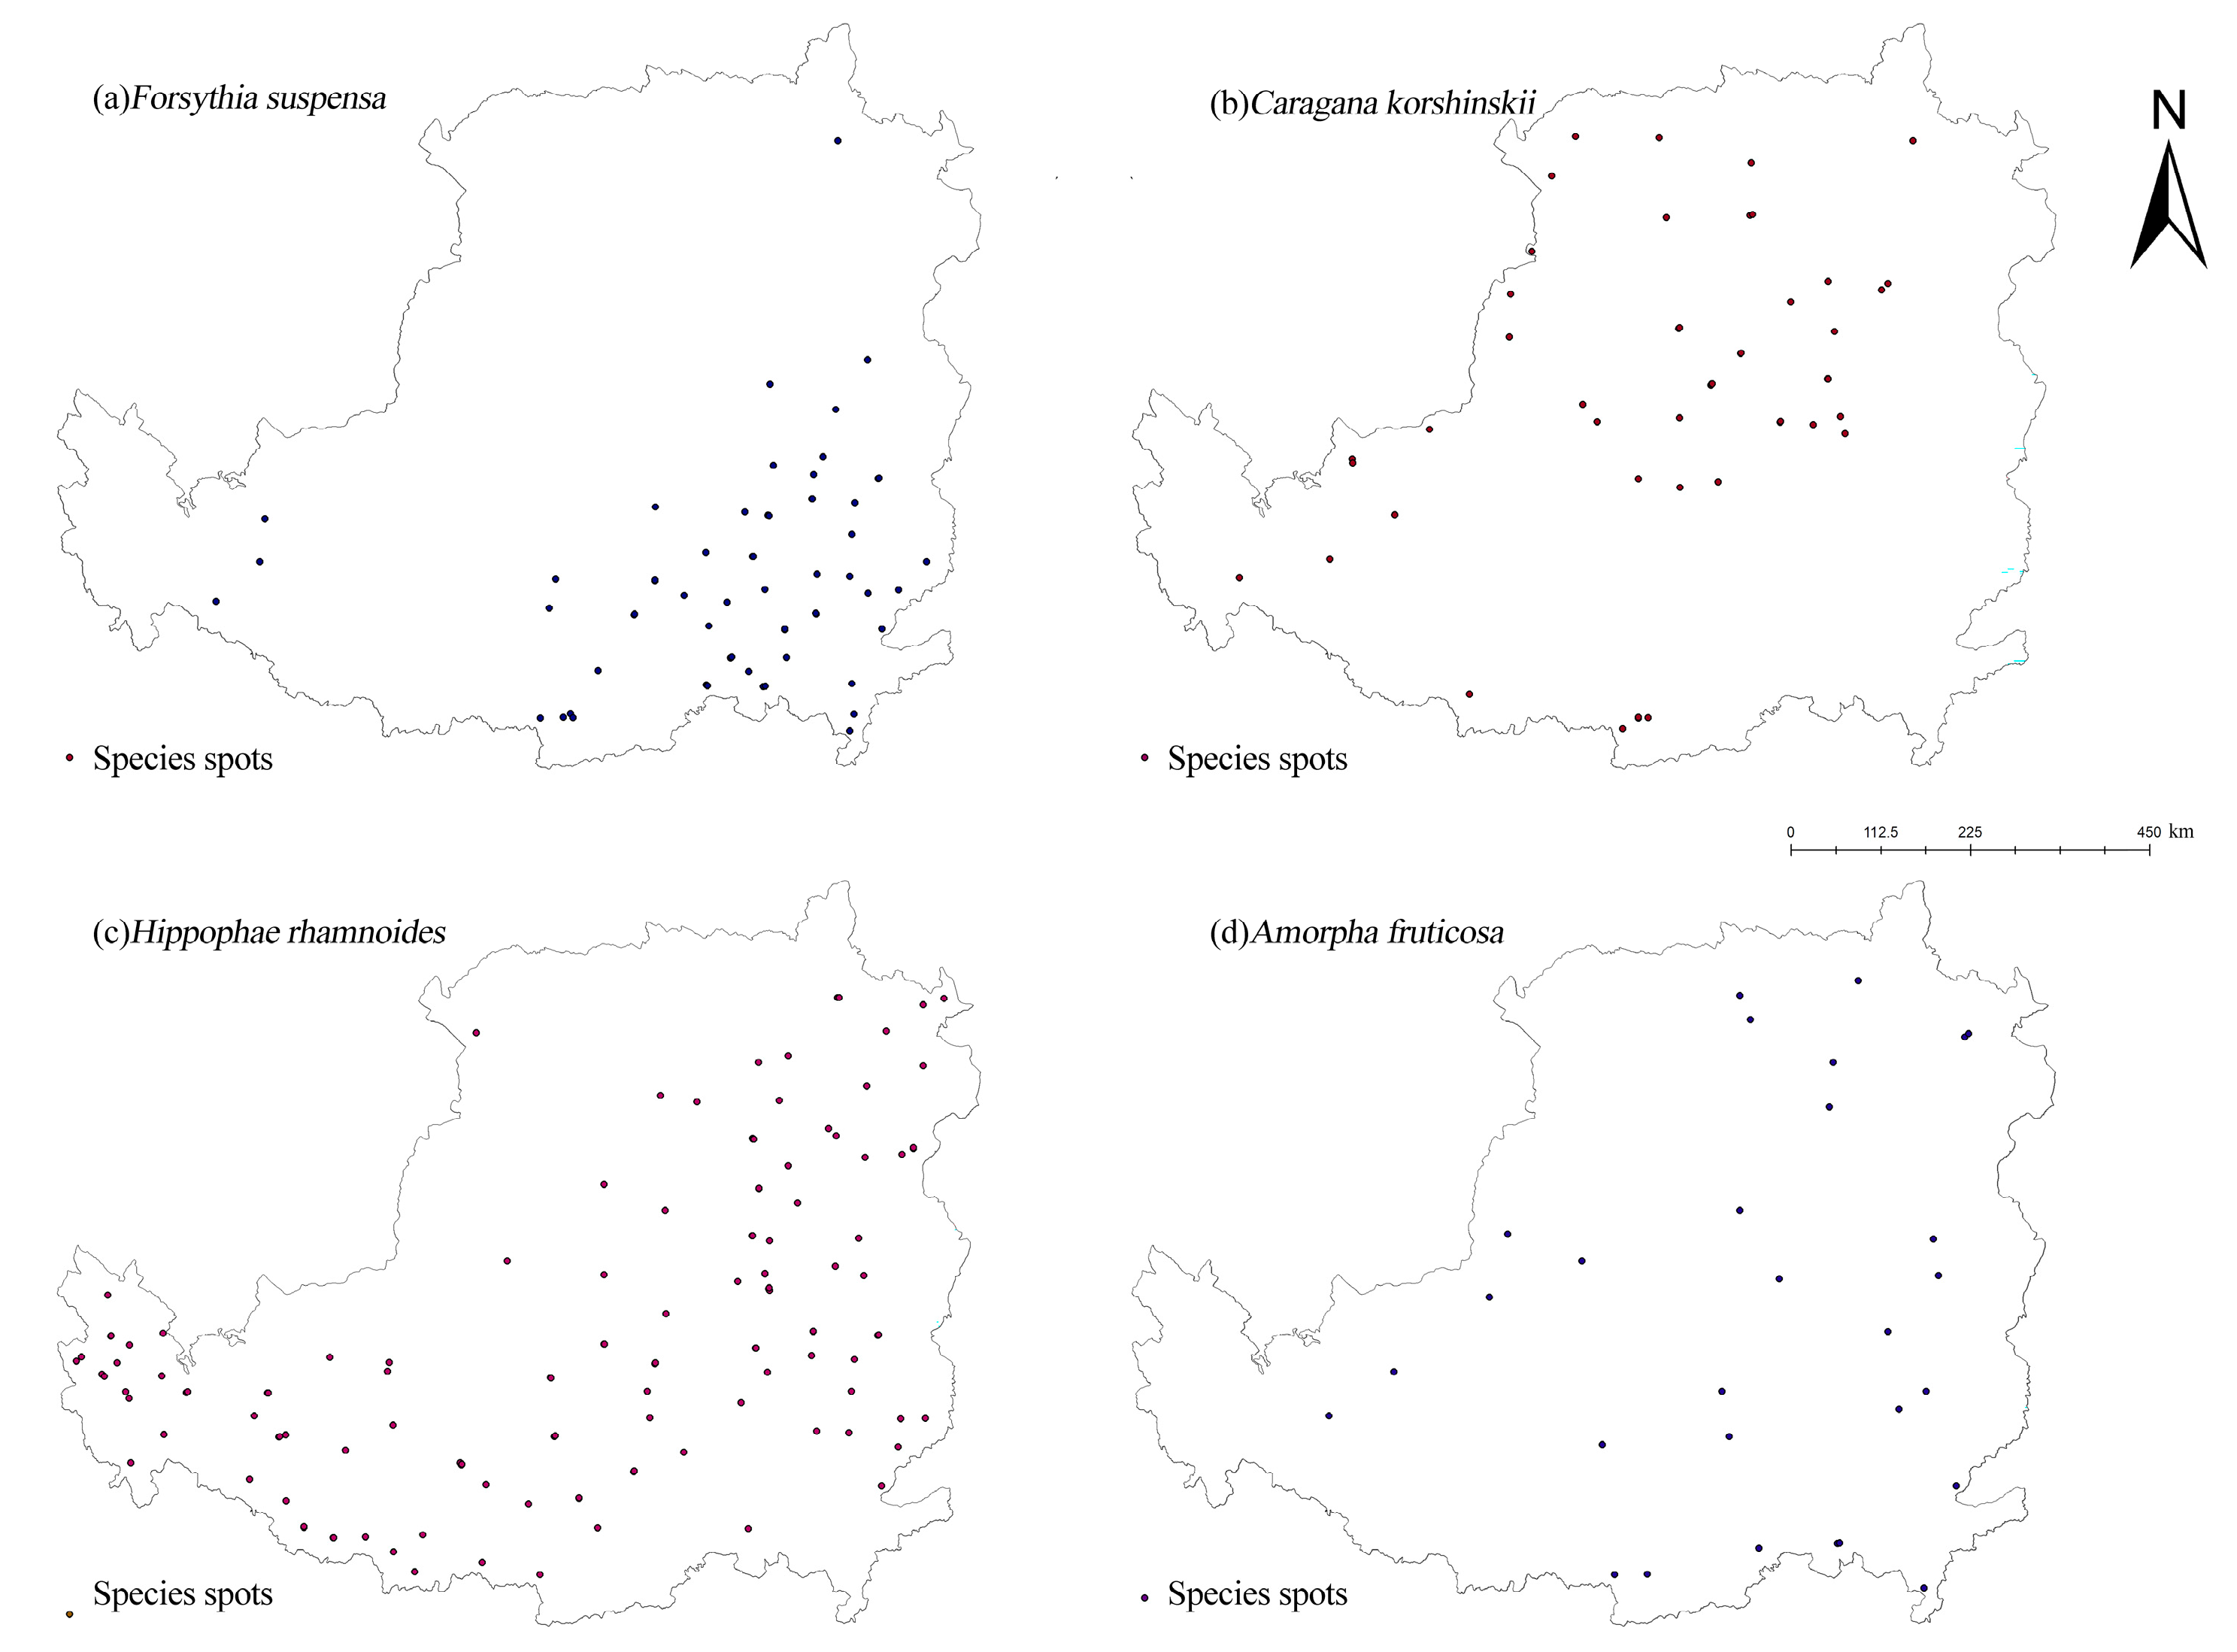
2.3.1. Species Distribution Records

The plant geographical distribution data were obtained from the Global Biodiversity Information Service Network (GBIF, http://www.gbif.org/, accessed on 30 May 2024). For the sample point data of the 12 species, data outside the study area and spatially autocorrelated data were excluded. They were converted to CSV format to be used as training data for the maximum model. The 12 species selected were common in the construction of vegetation restoration on the Loess Plateau. The trees were Robinia pseudoacacia [26], Salix matsudana [27], Populus tremula [28], and Pinus tabuliformis [29]; the shrubs were Forsythia suspensa [30], Caragana korshinskii [31], Hippophae rhamnoides [32], and Amorpha fruticosa [33]; and the herbs were Agropyron cristatum [34], Elymus sibiricus [35], Avena sativa [36], and Medicago sativa [37].

2.3.2. Factor Data and Preprocessing

It has been shown that climatic conditions such as temperature and precipitation and ecological conditions such as topography, sunshine, and soil are closely related to the growth and distribution of plants [38]. In addition, with the development of cities, increasingly intense human activities have also significantly impacted plant growth and distribution [39].
Based on existing studies [40], this study screened and synthesized 35 key factors, covering three aspects: climate, ecology, and human activities (Table 1). Among them, climatic and ecological factors were categorized as environmental factors, consisting of 19 climatic and 12 ecological factors; four factors specifically reflect the impact of human activities.
Climate data were obtained from Global Weather and Climate Data 2020 from the WorldClim website, sunshine data from the Global Resources Data Cloud (GRDC), and topography and NDVI data from the Resource Environmental Science and Data Platform (RESDP). Slope (Sl) and aspect (Asp) were obtained from DEM processing.
Organic content (OC), topsoil calcium carbonate (CaCO3), pH, and available water capacity (AWC) were obtained from the soil dataset provided by the Food and Agriculture Organisation of the United Nations (FAO, https://www.fao.org/soils-portal/data-hub/soil-maps-and-databases, accessed on 3 June 2024). The AWC data refer to the category of available water content in this study, and categories 1, 2, 3, 4, 5, 6, and 7 correspond to 150, 125, 100, 75, 50, 15, and 0 mm/m of available water, respectively. Due to the limited availability of world soil data from the FAO, we added total nitrogen (TN), total phosphorus (TP), and total potassium (TK) data from the 2010–2018 Chinese high-resolution National Soil Information Grid (NSIG) basic attribute dataset provided by the Spatiotemporal Triple Pole Environmental Big Data Platform. Anthropogenic factors included distance from road to woodland (RW), distance from water source to woodland (WW), gross domestic product (GDP) per capita, and population density (POP).
In this study, ArcGIS 10.8.1 software was used to unify the boundaries of the data. At the same time, the coordinate system was WGS_1984_UTM_Zone_49N with a resolution of 1 km × 1 km, and we applied the raster to the ASCII tool in ArcGIS 10.8.1 software to convert the raster data into the ASCII required for the MaxEnt and ENMTools format.

2.3.3. MaxEnt Model Construction and Accuracy Evaluation

MaxEnt is a machine learning model that models the spatial distribution of species by learning the relationship between samples and environmental variables [41]. Due to problems such as possible correlations between environmental variables affecting model accuracy [42], the first modeling operation prediction was carried out using all the factors, and the preprocessed geographical distribution data of 12 species were imported into the MaxEnt (3.4.1, Steven J. Phillips, New York, NY, USA) software along with the data of 35 factors to obtain the factor contribution of each species. Subsequently, the 35-factor data were imported into ENMTools. The Correlation tool was used to perform correlation analysis on the 35 factors, calculate the correlation coefficient table between the factors, screen out the factors with the absolute value of correlation coefficient > 0.8, rank the factors according to the factor contribution rate of each species, and exclude the factors with even lower contribution rates; then, the remaining factors were the dominant factors of each species. Finally, the geographical distribution data of the 12 species and their corresponding dominant factors were imported into MaxEnt 3.4.1 software again for secondary validation of the model.
Receiver operating characteristic (ROC) curves were used in the MaxEnt model to test the accuracy of the predictive effect of the model fit. Its accuracy is measured by the ROC’s area under the curve (AUC). A value in the range 0.5 < AUC ≤ 0.6 indicates that the model fails to predict, 0.6 < AUC ≤ 0.7 indicates that the prediction effect is poor and the accuracy is low, 0.7 < AUC ≤ 0.8 indicates that the prediction effect and the credibility are average, 0.8 < AUC ≤ 0.9 indicates that the prediction effect and the credibility are better, and 0.9 < AUC ≤ 1.0 indicates that the prediction effect is excellent and the credibility is high [43].

2.3.4. Evaluation of Vegetation Restoration Potential Distribution and Structure Optimization

The ASCLL format of the prediction results was converted to raster format using ArcGIS (10.8.1, Environmental Systems Research Institute, Redlands, CA, USA), and the value of the species potential distribution probability p was 0–1. The suitability distribution of different vegetation restoration species was obtained by selecting appropriate thresholds using the reclassification function of the spatial analysis tool: the planting area p ≥ 0.05, the non-suitable area p < 0.05, the sub-suitable area 0.05 ≤ p < 0.33, the moderately suitable area 0.33 ≤ p < 0.66, and the highly suitable area p ≥ 0.66 [10].
Based on the probability of the presence of four species in each layer slice, the grid calculator was used to compare the maximum probability of the presence of species in each grid cell, and the most suitable species were selected to obtain the layout of the respective planting structure for each layer slice. Finally, the maximum suitability optimization results of the three-layer slices were superimposed to obtain a vertical structure of vegetation restoration species on the Loess Plateau.

3. Results

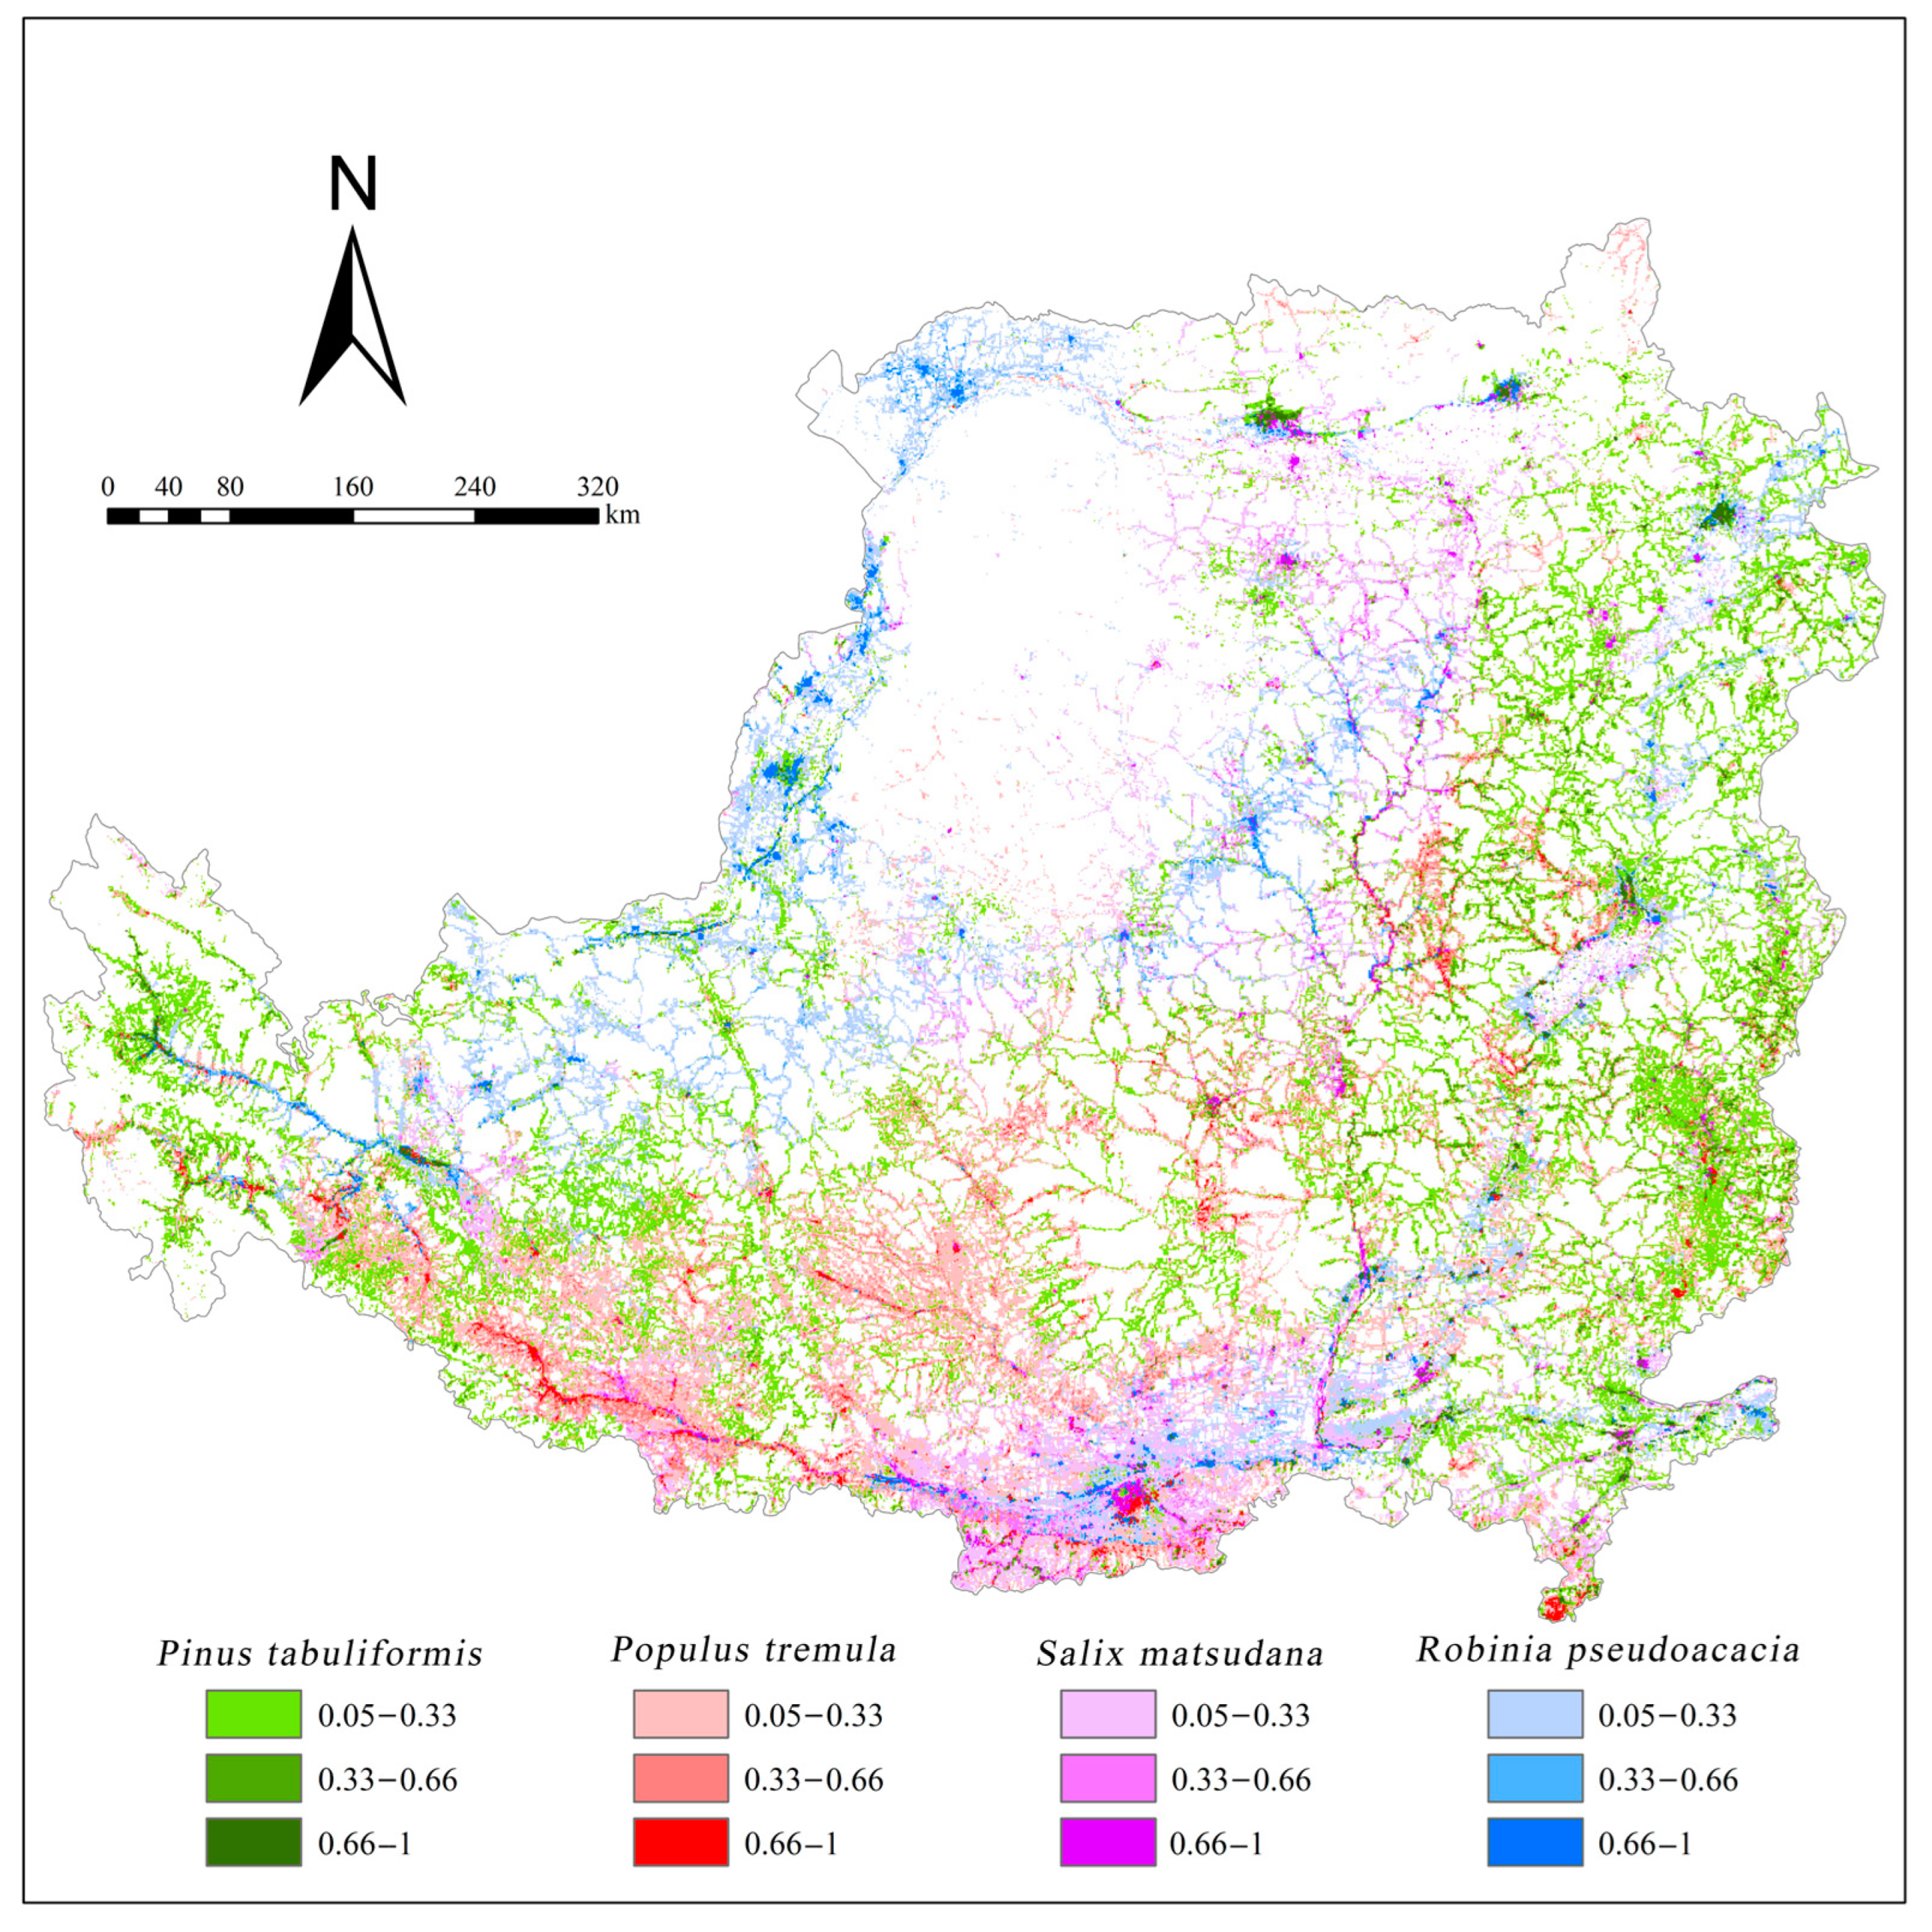
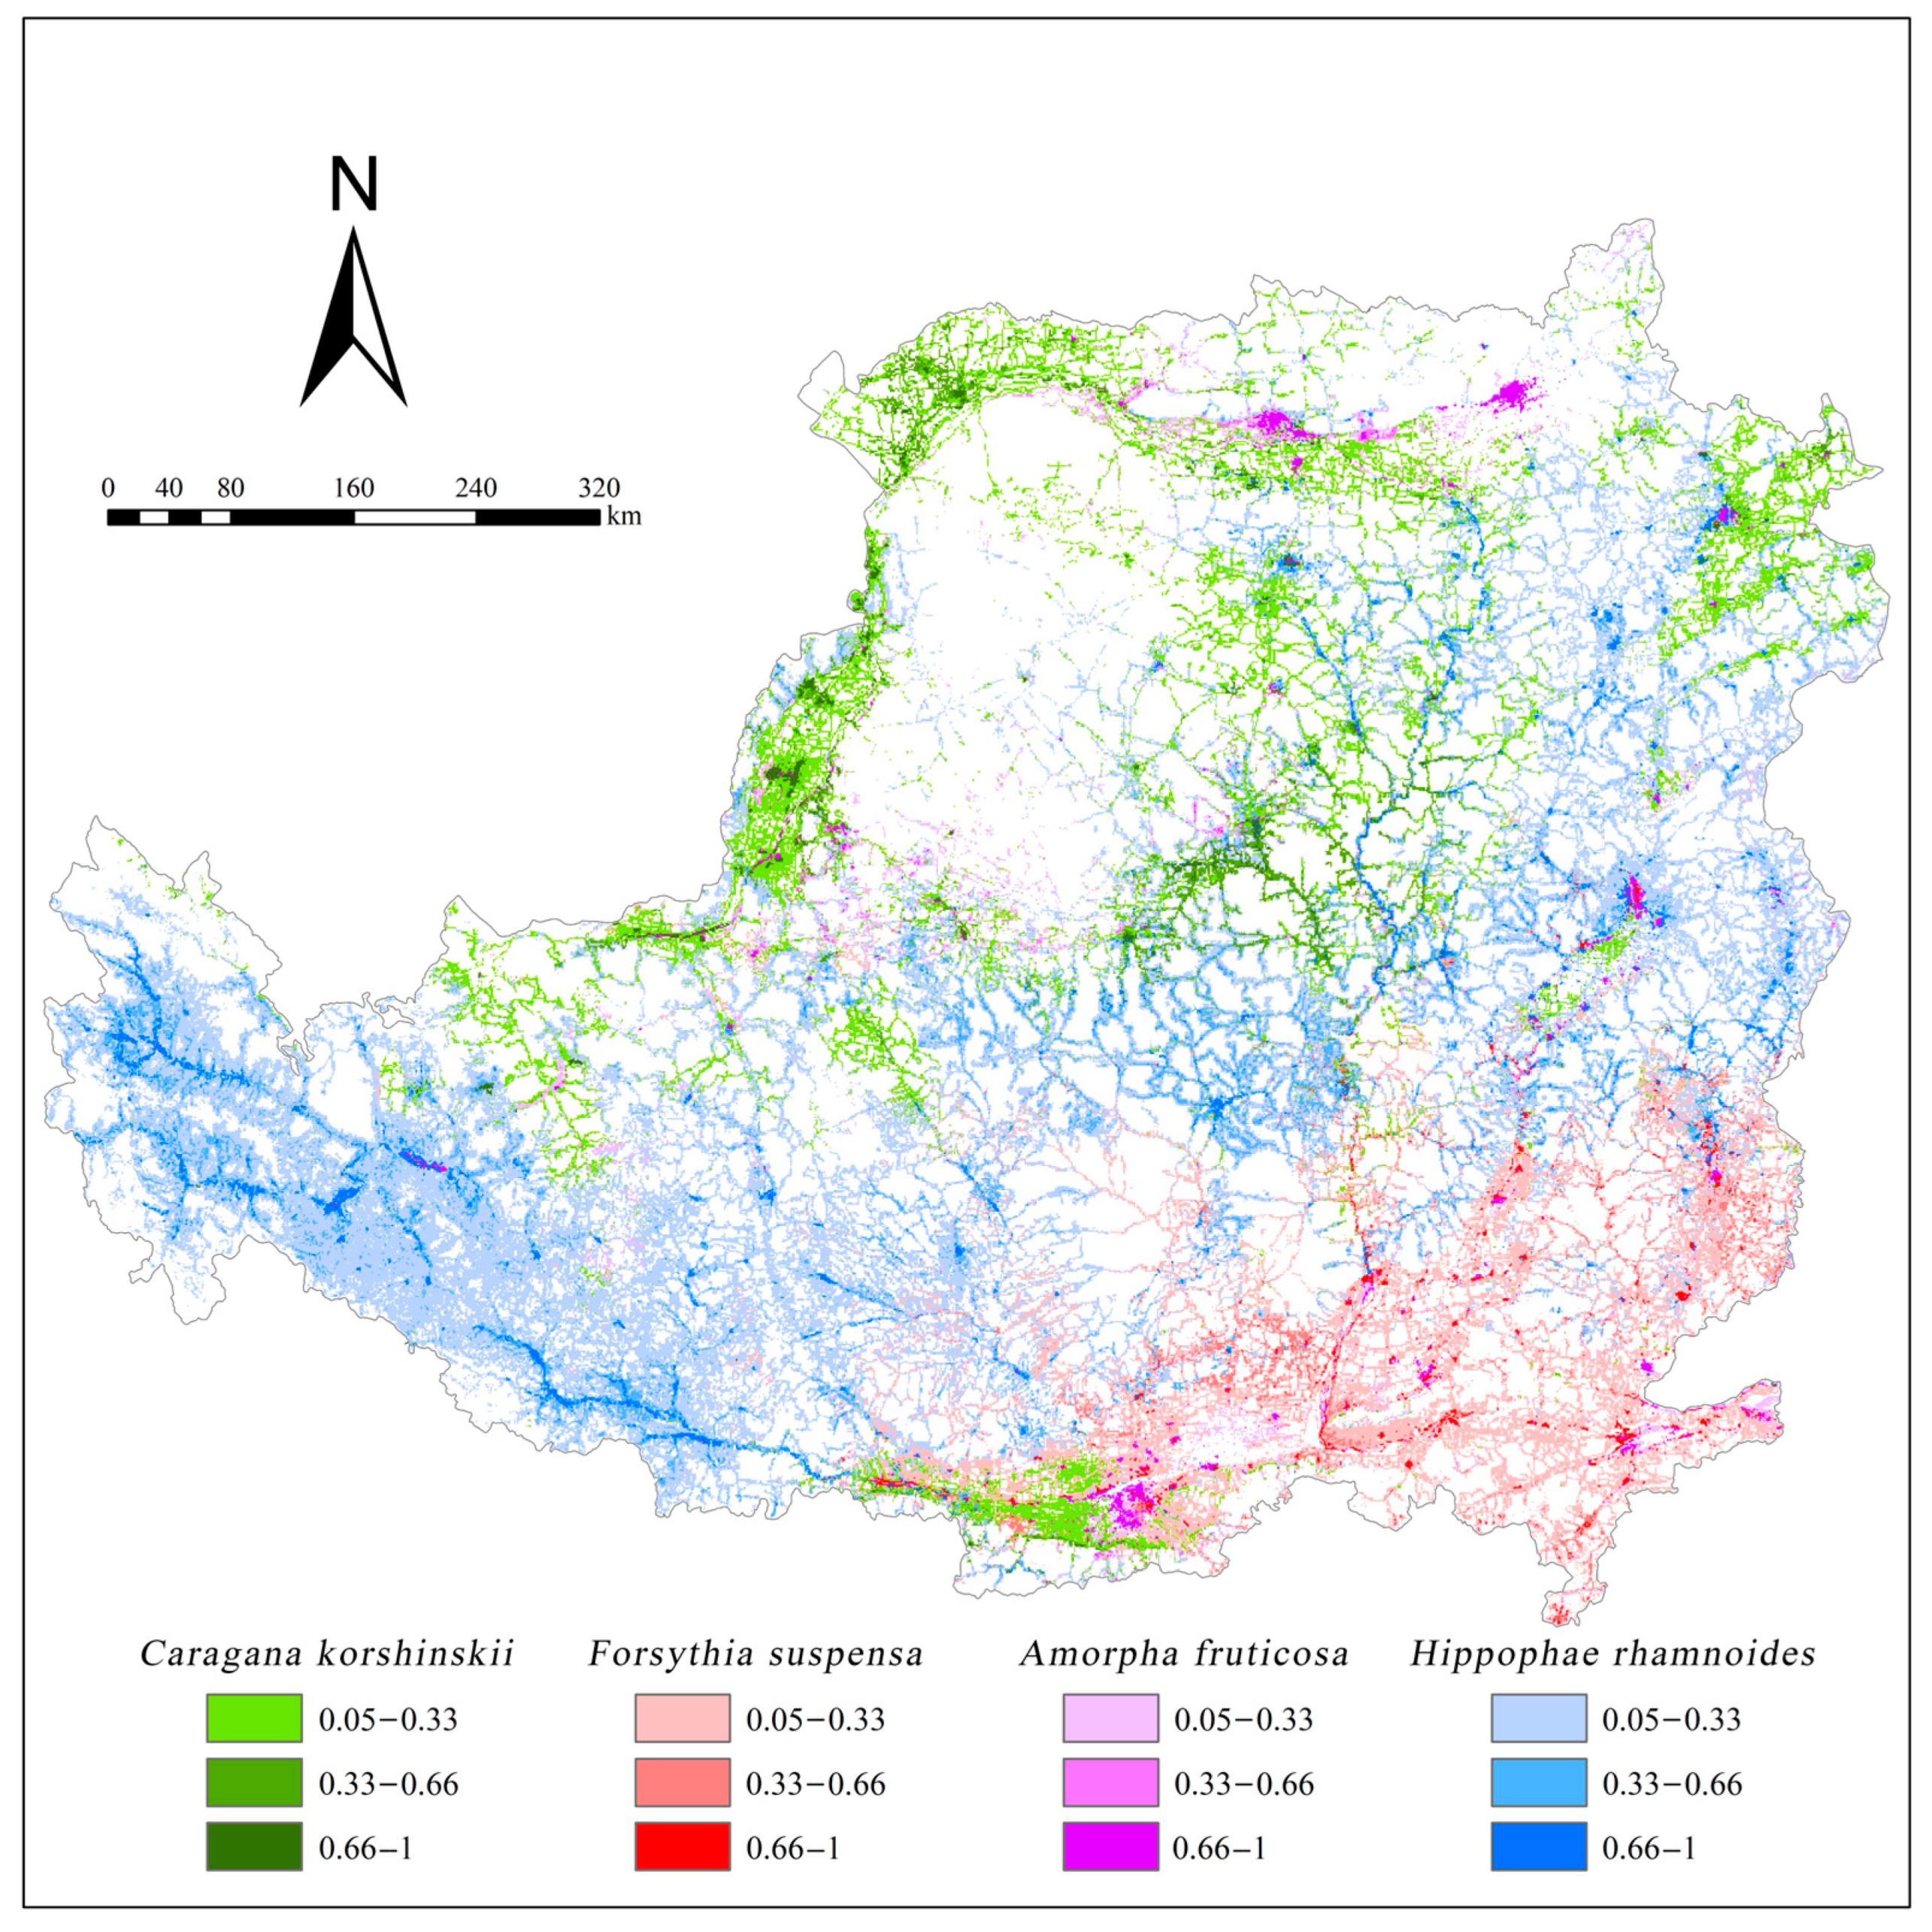
3.1. Potential Distribution and Suitability Class

The pre-predicted omission rates, as well as secondary validation omission rates and the expected omission rates in the study, were close to each other; the predicted ROC curves and the ROC curves of the random distribution model had larger areas under the curves, and the AUC values of the 12 plants were overwhelmingly located in the range of 0.9 or above. The lowest value was also greater than 0.85 (Table 2). The simulation results are excellent according to the AUC evaluation criteria, which indicated that the model was suitable for simulating the potential distribution of multiple species and could more accurately reflect the effects of climate, ecological factors, and human activities on the distribution of plant suitability. To investigate whether human activities significantly affect vegetation restoration, we compared two scenarios: (1) environment and (2) environment + human activities.
Firstly, the suitable and unsuitable growing areas were calculated for each plant in each of the 3 layers. When considering only environmental impacts, the area of suitability of the 12 plants was generally larger relative to the area of suitability when considering the impacts of both environmental + human activities. The results showed that in the tree layer, Pinus tabuliformis had the largest area suitable for planting, while Robinia pseudoacacia had the smallest area suitable for planting; in the shrub layer, Hippophae rhamnoides had the largest area suitable for planting, and Amorpha fruticosa had the smallest area suitable for planting; in the herb layer, Avena sativa had the largest area suitable for planting, and ice grass had the smallest area suitable for planting (Figure 3). In the tree layer, there was no significant difference among the four species in terms of highly suitable planting area, with 7000 km2 for Populus tremula, and 8000 km2 for all the rest; in the shrub layer, Hippophae rhamnoides had the largest highly suitable planting area and Forsythia suspensa had the smallest. As for the herb layer, the largest highly suitable planting area was Avena sativa, and the smallest was Elymus sibiricus. The species with the largest suitable acreage in each layer were Pinus tabuliformis, Hippophae rhamnoides, and Avena sativa, respectively, and the results of the bar graphs indicate that for the species with the largest suitable area in each layer, its highly suitable area was also the largest in each layer.
The total unsuitable cultivation area of the 12 species became significantly larger under the combined influence of the environment and human activities. Except for Avena sativa, the unsuitable planting area was larger than the suitable planting area for the other 11 species. In the tree layer, the unsuitable planting area of Robinia pseudoacacia was the largest, the unsuitable planting area of Pinus tabuliformis was the smallest, and there was no significant difference in the highly suitable area of the four species. In the shrub layer, the largest unsuitable planting area was Amorpha fruticosa, the smallest was Hippophae rhamnoides, the largest highly suitable planting area was Hippophae rhamnoides and the smallest was Forsythia suspensa. For the herb layer, the unsuitable area for Avena sativa was small, and the highly suitable area was large, while there was no significant difference among the other three.
Secondly, the suitability of the land in the Loess Plateau region for 12 major vegetation restoration species could be calculated using the MaxEnt model. Based on the suitability, the potential distribution of each species can be obtained by applying the reclassification tool (Figure 4, Figure 5 and Figure 6). The results showed that the high- and medium-suitability zones were mainly distributed in sparsely populated areas and closer to water sources.

3.2. Optimization of Planting Structure

Under the combined influence of the environment and human activities, there are differences in the suitability of different planting plots, and the heterogeneity at the grid scale is obvious (Figure 7, Figure 8 and Figure 9), suggesting differences in the spatial suitability of different species. Through maximum suitability optimization, multiple planting structures were identified in each layer of the study area. The results showed that the overall spatial distribution of the three layers was relatively consistent. Among them, there were more obvious dominant species in both the shrub and herb layers, namely Hippophae rhamnoides (164,000 km2) and Avena sativa (290,000 km2), which were mainly distributed in the southwest and northeast of the study area. At the same time, there was no significant difference between the four species in the tree layer.
The vertical structure was obtained by superimposing the results of the maximum suitability optimization of the three layers of trees, shrubs, and herbs (Figure 10), which showed that there was a clear structural dominance of trees + shrubs + herbs as well as a single-herb structure in the study area, with the area of the two being 203,000 km2 and 172,000 km2, respectively. The single-herb structure was concentrated in the northeastern part of the study area, while the trees + shrubs + herbs structure was mainly concentrated in the southwestern direction.

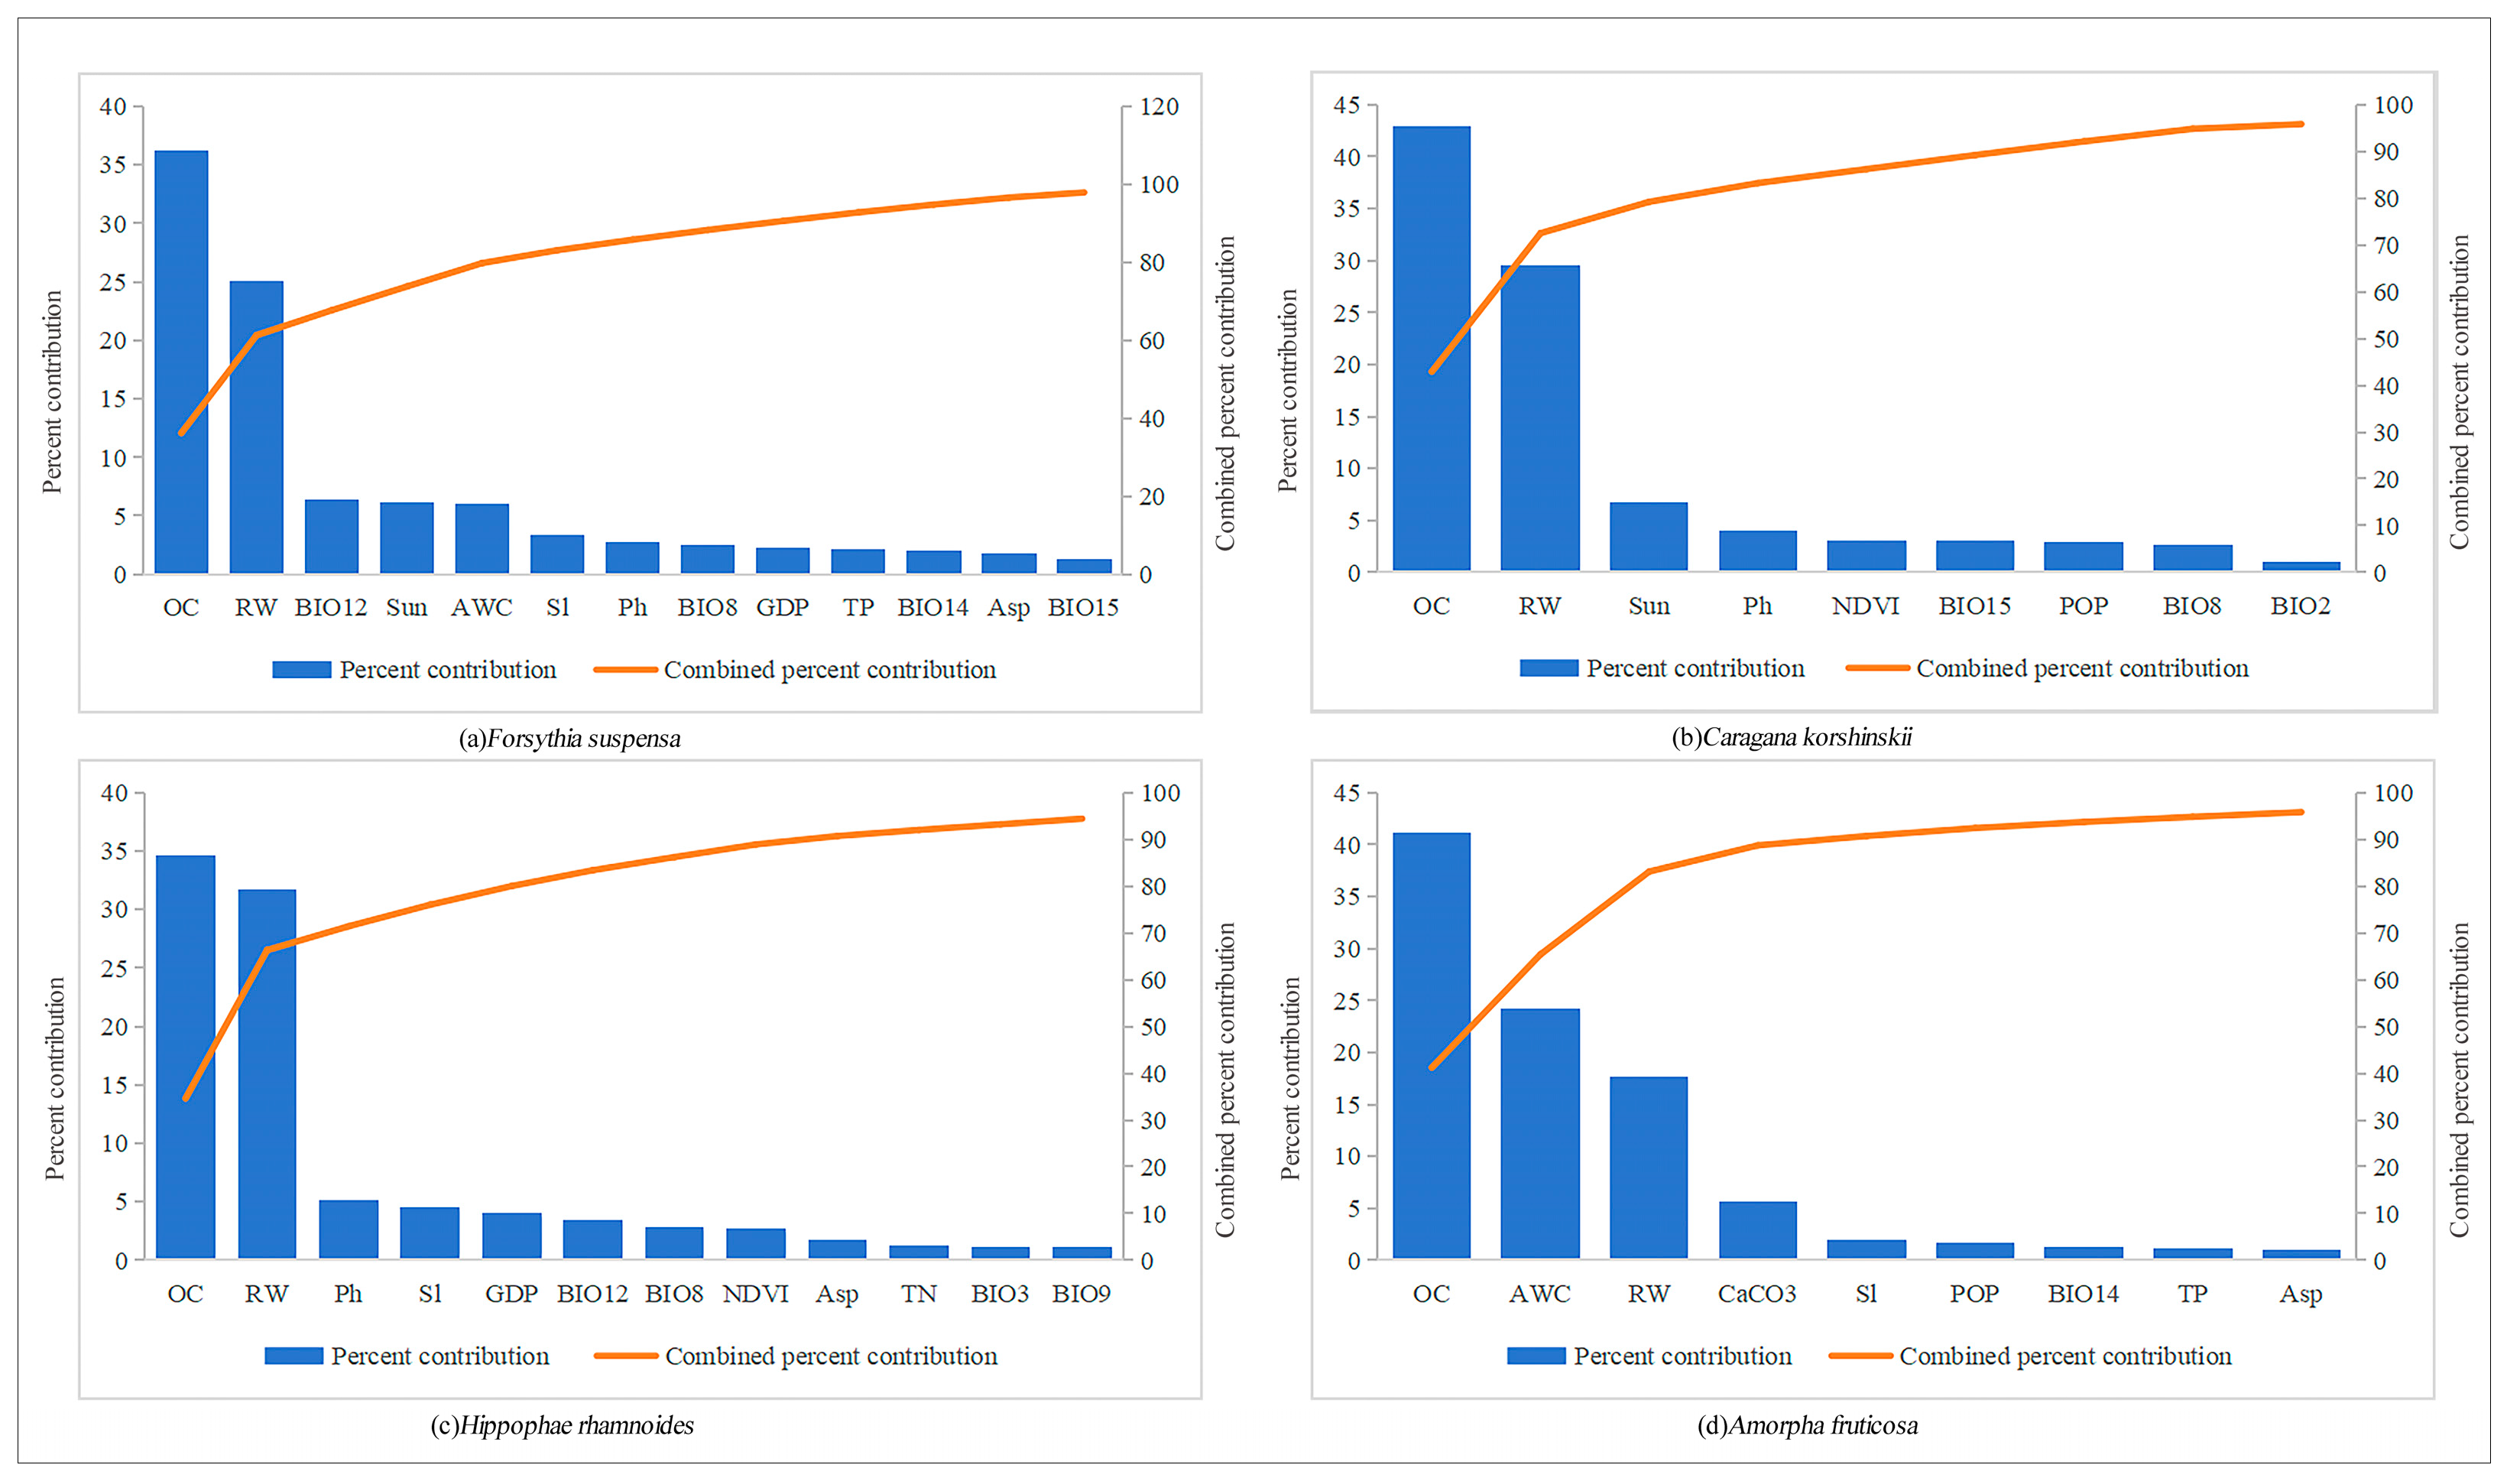
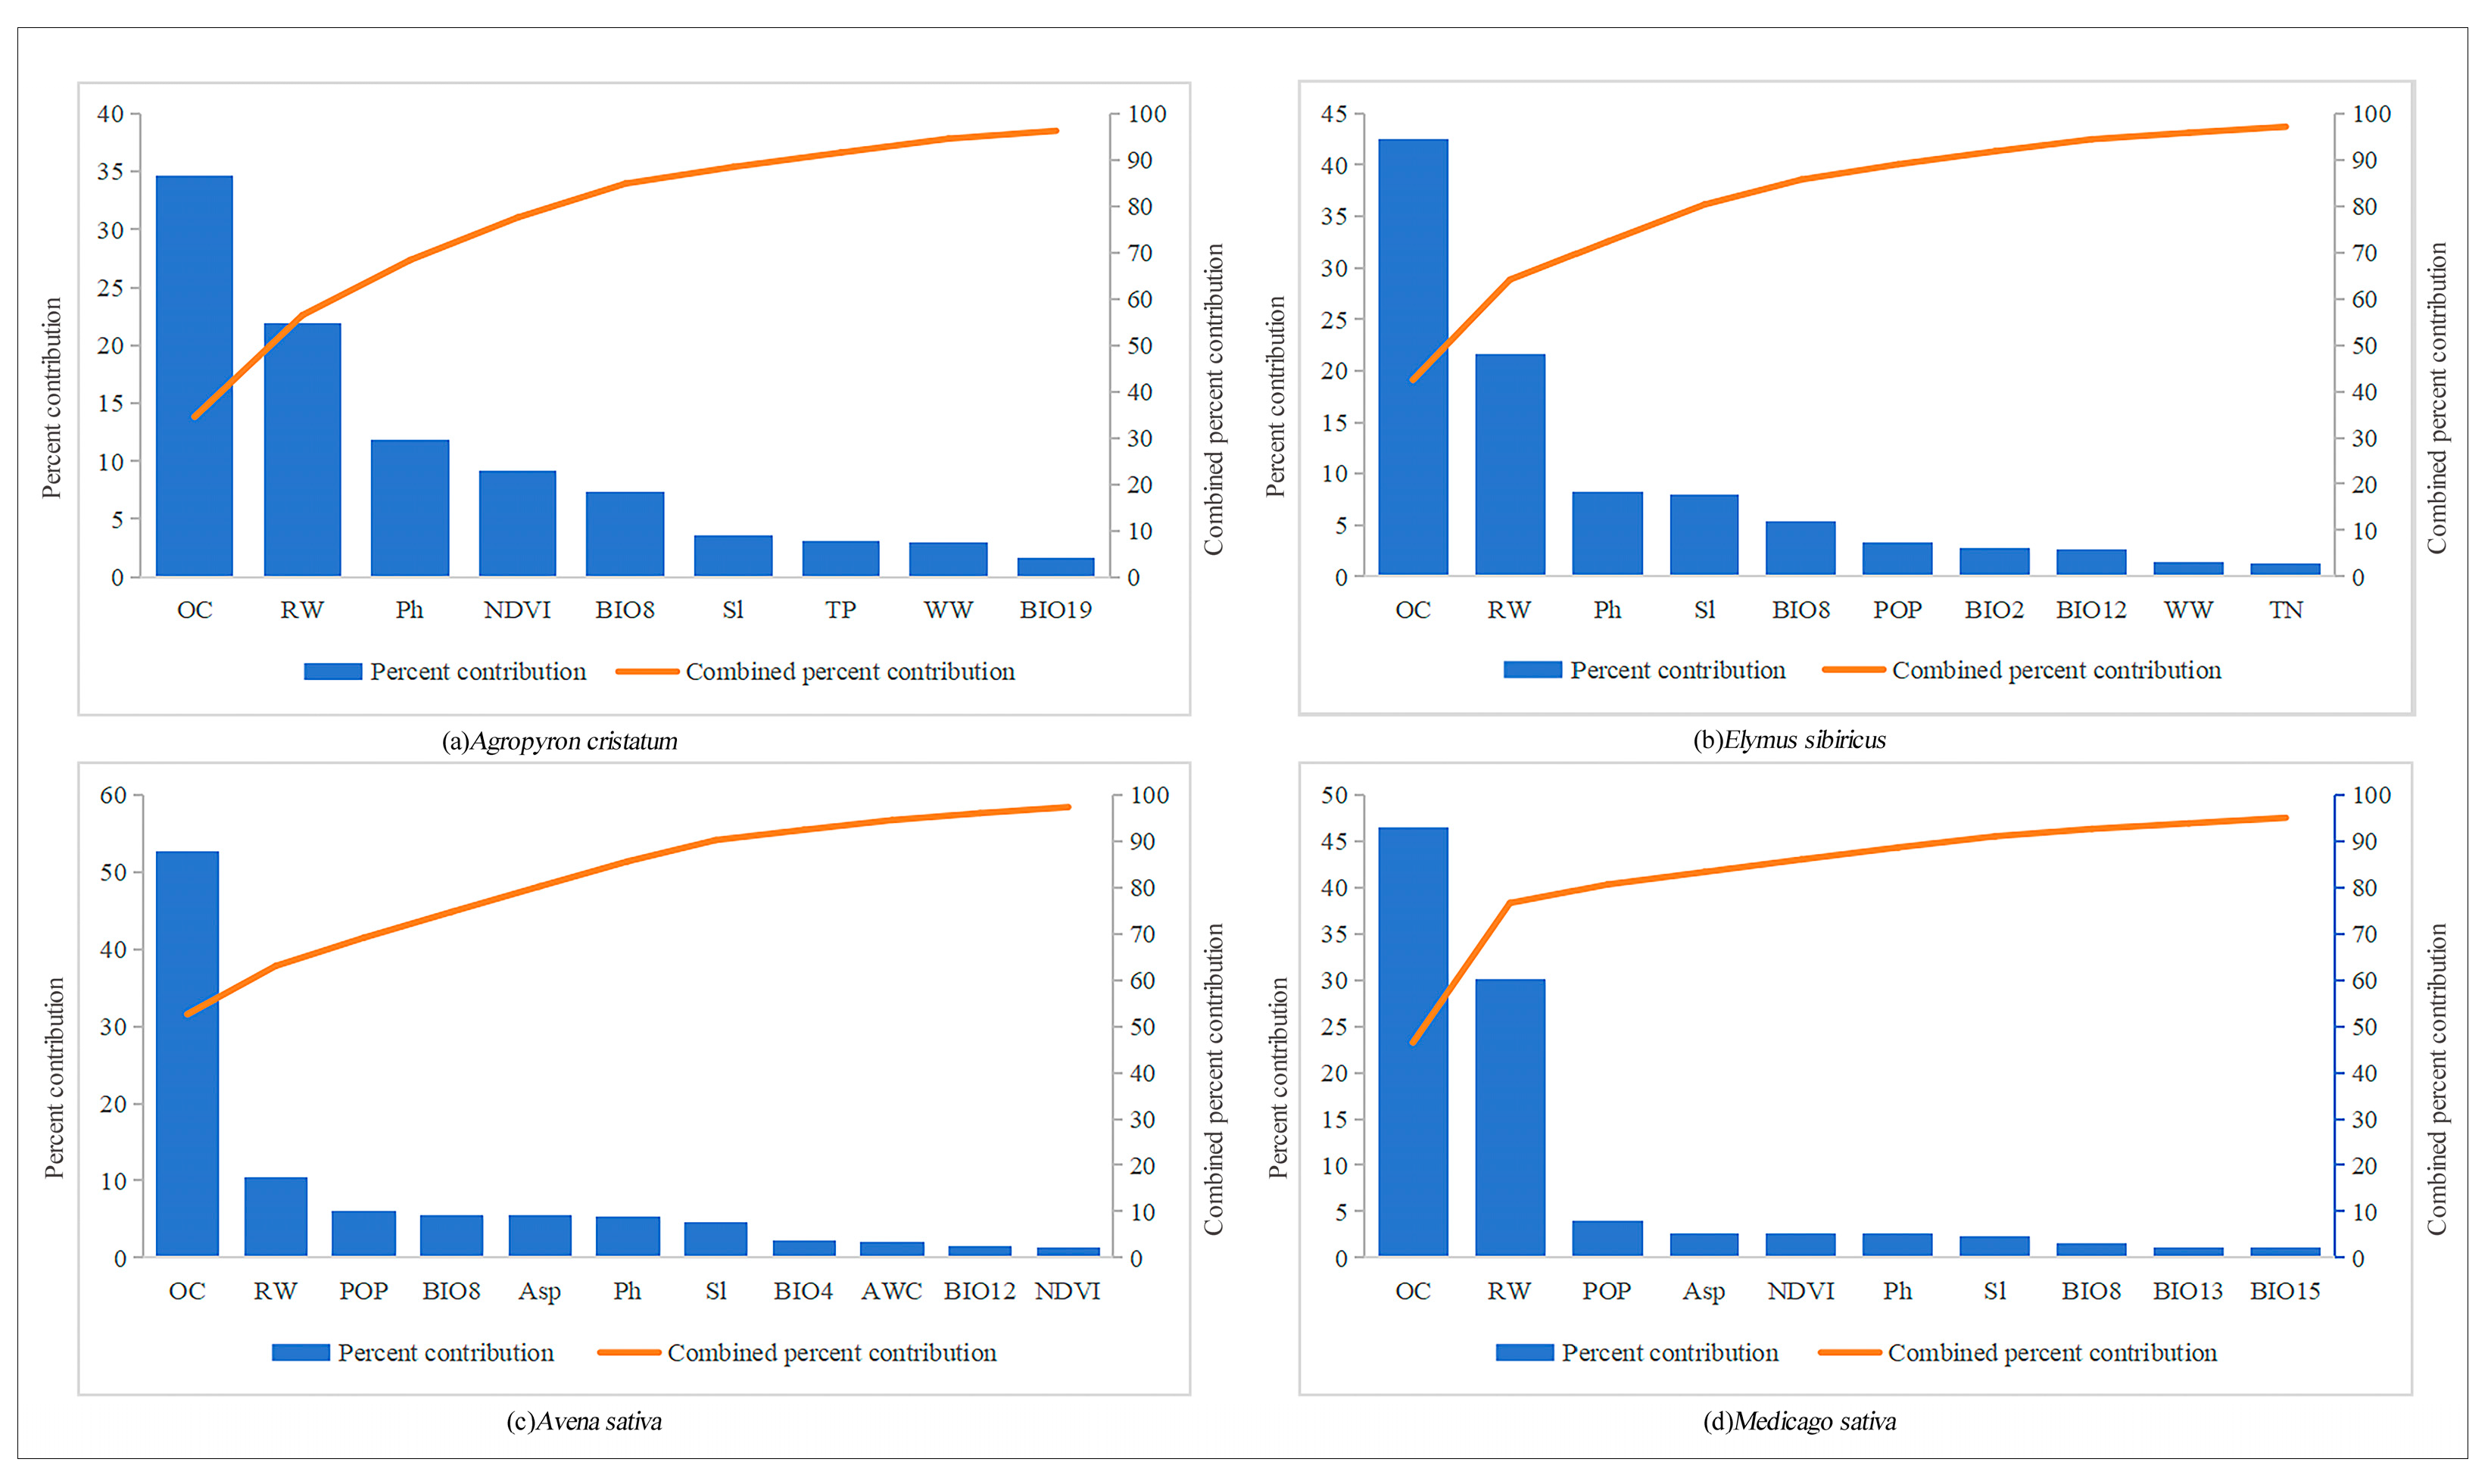
3.3. Identification of Dominant Factors

Under the joint influence of environmental factors and human activities, the percentages of the dominant factors affecting the distribution of 12 plant species in the Loess Plateau and their combined percentage contributions are shown in Figure 11, Figure 12 and Figure 13. Except for Amorpha fruticosa, the two factors with the highest contributions to the other 11 plants were the same. Both of them were OC and RW, and for these 11 plants, the contribution of OC almost reached more than 35%, and its contribution to the growth suitability of Avena sativa even reached more than 50%. Moreover, the combined contribution of these two factors was above 50%, and the highest one even reached 80%. This indicates that the two factors, OC and RW, significantly influence the distribution of the 11 planted restoration species except Amorpha fruticosa. In addition, pH also had a large impact on these 11 crops as their dominant factor, with a contribution of 2.5%–11.9%. For Amorpha fruticosa, the four most influential factors were OC (41.2%), AWC (24.2%), RW (17.7%), and CaCO3 (5.6%), in that order. Together, these factors contributed 88.7% to the growth suitability of Amorpha fruticosa, constituting its main influencing factor.
Among the climatic factors, the mean temperature of the wet quarter (BIO8) affected all three layers but had the most significant effect on the four plants in the herb layer, Agropyron cristatum (7.3%), Elymus sibiricus (5.4%), Avena sativa (5.6%), and Medicago sativa (1.6%), whereas its effect on the plants in the shrub layer and the herb layer was relatively small. In addition, the mean diurnal range (mean of monthly (max temp − min temp), BIO2) and annual precipitation (BIO12) affected the growth suitability of individual plants in the three layers, but the effect was relatively small.
Asp was a contributing factor for all four plants in the tree layer, but the contribution was relatively small (1.2%–3.3%), whereas Asp was not always a contributing factor for plants in the shrub and herb layers. Sl contributed (2.4%–2.8%) to all four plants in the herb layer, whereas it did not always affect the suitability of plant growth in both the tree and shrub layers. GDP and Sun affected one or two plants in the tree and shrub layers and had almost no effect on plant suitability in the herb layer. TK had an effect on Robinia pseudoacacia (1.7%), Salix matsudana (3.6%), and Populus tremula (1.1%) in the tree layer. In contrast, TK had almost no effect on Pinus tabuliformis and the shrub and herb layers.

4. Discussion

4.1. Analysis of Potential Distribution

Comparing the two scenarios of environment and environment + human activities, the unsuitable area increased significantly under the influence of human activities, which may be due to the fact that human activities will lead to the conversion of natural land into construction land, the destruction of vegetation, and the impairment of ecosystem structure and function [44]. In addition, the greenhouse gas emissions due to human activities cause climate change, which may change the water and heat balance of the ecosystem, thus affecting the distribution of plants [45]. Comparing the changes in the plant’s unsuitable areas between the two scenarios, there was a significant increase in the unsuitable regions of Hippophae rhamnoides and Pinus tabuliformis. In contrast, the change in the area of the unsuitable regions of Amorpha fruticosa was not significant. This difference may be related to their ecological niches, growth rates, reproductive strategies, and stress tolerance. For example, Amorpha fruticosa may be able to maintain growth in environments affected by human activities due to its rapid growth [46] and high stress tolerance [47]. In contrast, Hippophae rhamnoides and Pinus tabuliformis may depend more on specific habitat conditions and be more sensitive to environmental changes.
From the perspective of the spatial distribution of suitability, high-suitability areas are mainly located in sparsely populated areas and closer to water sources. This may be because sparsely populated areas often imply lower human disturbance [48], providing more natural conditions for species to recover. At the same time, the proximity of water sources provides the necessary moisture conditions for the ecosystem, which is particularly important for vegetation restoration in this arid region of the Loess Plateau.

4.2. Analysis of Planting Structure Layout

From the perspective of optimizing the layout of the planting structure, the overall spatial distribution of the three layers of trees, shrubs, and herbs is more consistent, perhaps since the species of different plant layers may have overlapping ecological niches [49], i.e., they can make use of similar resources and habitats, which leads to their similar spatial distribution patterns. In addition, interactions between trees, shrubs, and herbs, such as competitive relationships, may have balanced their distributions to some extent [50], resulting in a consistent overall spatial distribution.
Hippophae rhamnoides in the shrub layer and Avena sativa in the herb layer acted as dominant species. At the same time, there was no significant difference between the four species in the tree layer. This may be because Hippophae rhamnoides and Avena sativa may appear as pioneer species in the early stages of vegetation succession. In contrast, species in the tree layer may take longer to establish [51]. In addition, the dominance of the trees + shrubs + herbs structure as well as the single-herb structure suggests that vegetation restoration strategies need to integrate the species composition and spatial configuration of different layers [52] to achieve ecosystem diversity and stability.
Although the study has revealed the suitable distribution areas of trees, shrubs, and herbs, the plant species in the actual vegetation restoration project are much more than the 12 species mentioned in the article, and there are differences in vegetation restoration species in different areas, which limits the wide applicability of the results to a certain extent. At the same time, as this study focuses on the planning level, it does not explore whether the twelve species mentioned in this study can co-exist harmoniously in practice, which needs to be discussed in specific vegetation restoration projects. Despite these shortcomings, this study is the first to apply the MaxEnt method to three layers in a vegetation restoration project, providing a useful approach for vegetation restoration. It provides some guiding value for the spatial structure layout of specific vegetation restoration in the Loess Plateau.

4.3. Selection of Dominant Factors

OC, as the factor with the highest contribution for the 12 plants, had a great influence on the distribution of the plants, especially for Avena sativa, where the contribution of organic matter content was more than 50%, highlighting the importance of soil fertility for crop growth [53]. The second highest contributing factor for the eleven plants except Amorpha fruticosa was RW; for Amorpha fruticosa, it was AWC. A possible explanation is the high water requirement of Amorpha fruticosa [54], which makes AWC a key limiting factor for its growth and distribution. In contrast, the other plants may be less dependent on soil moisture conditions.
Among the climatic factors, BIO8 had a particularly significant effect on herb-layer plants, which may be related to the fact that woody plants can grow deeper in the soil and search for water under local drought conditions, whereas herbaceous plants stay in shallow soils, are more sensitive to the adverse effects of drought conditions [55], and thus are highly dependent on moisture conditions. Although BIO2 and BIO12 had some effect on plant growth, this was relatively small, indicating the limited role of these factors in plant distribution.
Topographic factors such as Sl and Asp affected the suitability distribution of plants in the tree and herb layers. The effect of GDP on plants in the tree and shrub layers suggests that economic activities may indirectly affect the growth and distribution of plants. TK affected some plants in the tree layer but had less effect on other species, suggesting that soil nutrient factors have a selective effect on different plants. This indicates that we need to tailor soil improvement and management to the needs of different plants in our vegetation restoration practices.

4.4. Strategies and Policies

The growth of plants requires specific environmental conditions, and we should select suitable species based on the principle of local conditions [56]. As in this study, the contribution of OC to the suitable planting of all 12 plant species is large, and the environmental factors affecting the distribution of plants in the three-layer slices are not the same. Planners can compare the suitable growing conditions of the pre-selected plants with the local environment to select suitable species for vegetation restoration and adjust and optimize the planting structure and scale of vegetation according to the predicted results of the distribution of plant growth suitability to formulate a plan that conforms to the principle of regional adaptation, thus improving the resource utilization rate and restoration efficiency. It is necessary to avoid situations where the survival rate of species not adapted to the environment is too low or the introduction of unsuitable species will cause a burden on the local environment and society. For example, plants with high water requirements and high water-consuming characteristics are unsuitable for vegetation restoration in water-scarce areas; otherwise, they may not improve the local ecological environment and aggravate the local water shortage. At the same time, for the dominant environmental factors with relatively small contributions, appropriate artificial measures can be taken to supplement or control the growth of plants better and improve the survival rate of plants; for example, TK content in the tree layer of plants (Robinia pseudoacacia, Salix matsudana and the Populus tremula) has an impact on the plant, and we can choose the right fertilizer to artificially add the amount of potassium content required for plant growth.
The study’s results show that the effect of human activities on the distribution of vegetation suitability is significant. However, environmental conditions determine plants’ growing conditions and the areas where they are suitable for planting [57]. Therefore, we must respect the natural environment where plants grow and take active measures to manage the dominant anthropogenic factors affecting the planting structure. Comparing the results of vegetation distribution prediction under the effect of environmental factors only, the unsuitable planting area of 12 plants increased significantly after adding human activity factors, and the highly suitable planting area of 11 plants except Avena sativa decreased, indicating that human activities have a particularly negative impact on vegetation distribution in general. Planners can control the impacts of human activities to the appropriate thresholds according to the thresholds of the effects of the screened human activity factors on the distribution of plants, taking into account the balance and coordinated development among nature, economy, and society in urban planning to minimize the negative impacts of human activities on the restoration of vegetation as much as possible, and at the same time retaining and enhancing their positive impacts. For example, in this study, RW significantly affects the distribution of 12 species. Planners can consider the actual situation and promote vegetation restoration by adjusting the land use layout or optimizing the road layout.

5. Conclusions

The climate–ecology–human activity model based on the MaxEnt model accurately simulated the suitability distribution of a total of 12 plant species in three layers of the Loess Plateau. The following conclusions were drawn: (1) Human activities significantly increased the unsuitable areas for planting, especially Robinia pseudoacacia in the tree layer and Amorpha fruticosa in the shrub layer. (2) Highly and moderately suitable areas were mainly distributed in areas with sparse populations, and the water source was close to the area. (3) The overall spatial distribution of the three layers in the study area was relatively consistent, and the structural dominance of trees + shrubs + herbs and single herbs in the vertical structure was obvious, and these were concentrated in the southwestern and northeastern parts of the study area, respectively. (4) OC and RW were the main factors influencing the distribution of the suitability of species for vegetation restoration, and the anthropogenic factors had an important impact on the distribution of restoration-suitable zones.

Author Contributions

Conceptualization, X.L. and J.L.; methodology, X.L. and J.L.; software, J.L., Y.C. and Y.W.; validation, J.L.; formal analysis, J.L., Y.C. and Y.W.; investigation, J.L., Y.C. and Y.W.; resources, G.X. and M.A.B.; data curation, J.L.; writing—original draft preparation, J.L., Y.C. and Y.W.; writing—review and editing, J.L., Y.C., X.L., M.F.S., M.A.B., G.X. and W.J.; visualization, J.L., Y.C. and Y.W.; supervision, X.L.; project administration, X.L.; funding acquisition, X.L. and M.F.S. All authors have read and agreed to the published version of the manuscript.

Funding

This research was funded by the Researchers Supporting Project, number (RSPD2024R637), King Saud University, Riyadh, Saudi Arabia. This research was also partially funded by the Innovation and Entrepreneurship Training Plan for Chinese College Students (funding number 202402460A9) held by J.L.

Data Availability Statement

The authors will provide the raw data supporting the conclusions of this article upon request, without undue delay.

Conflicts of Interest

The authors declare no conflicts of interest.

Appendix A

Table A1. List of plant species.
LayerSpecies Name
TreeRobinia pseudoacacia
Salix matsudana
Populus tremula
Pinus tabuliformis
ShrubForsythia suspensa
Caragana korshinskii
Hippophae rhamnoides
Amorpha fruticosa
HerbAgropyron cristatum
Elymus sibiricus
Avena sativa
Medicago sativa
Figure A1. Species distribution data for the tree layer.
Forests 15 01528 g0a1
Figure A2. Species distribution data for the shrub layer.
Forests 15 01528 g0a2
Figure A3. Species distribution data for the herb layer.
Forests 15 01528 g0a3
Figure A4. Spatial distribution of factors in Loess Plateau. (a) Digital elevation model (DEM), (b) slope (Sl), (c) normalized difference vegetation index (NDVI), (d) organic content (OC), (e) aspect (Asp), (f) sunshine duration (Sun), (g) total nitrogen (TN), (h) total phosphorus (TP), (i) total potassium (TK), (j) topsoil calcium carbonate (CaCO3), (k) distance from road to woodland (RW), (l) distance from water source to woodland (WW), (m) pH, (n) available water capacity_Class (AWC), (o) gross domestic product (GDP), and (p) population density (POP).
Forests 15 01528 g0a4

References

  1. Wu, Y.; Wu, Y.; Li, C.; Gao, B.; Zheng, K.; Wang, M.; Deng, Y.; Fan, X. Spatial Relationships and Impact Effects between Urbanization and Ecosystem Health in Urban Agglomerations along the Belt and Road: A Case Study of the Guangdong-Hong Kong-Macao Greater Bay Area. Int. J. Environ. Res. Public Health 2022, 19, 16053. [Google Scholar] [CrossRef]
  2. Tian, Y.; Jiang, G.; Zhou, D.; Li, G. Systematically Addressing the Heterogeneity in the Response of Ecosystem Services to Agricultural Modernization, Industrialization and Urbanization in the Qinghai-Tibetan Plateau from 2000 to 2018. J. Clean. Prod. 2021, 285, 125323. [Google Scholar] [CrossRef]
  3. Dou, H.-M.; Zhao, R.-F.; Chen, X.-D.; Shi, J.; Wang, J.-F.; Liu, F.-S. Identifying Priority Areas for Territorial Space Ecological Restoration in Arid Area of Northwest China: A Case Study of Zhangye City in Heihe River Basin. Ying Yong Sheng Tai Xue Bao 2024, 35, 469–479. [Google Scholar] [CrossRef] [PubMed]
  4. Elith, J.; Leathwick, J.R. Species Distribution Models: Ecological Explanation and Prediction Across Space and Time. Annu. Rev. Ecol. Evol. Syst. 2009, 40, 677–697. [Google Scholar] [CrossRef]
  5. Cutler, D.R.; Edwards, T.C.; Beard, K.H.; Cutler, A.; Hess, K.T. Random Forests for Classification in Ecology. Ecology 2007, 88, 2783–2792. [Google Scholar] [CrossRef]
  6. Fewster, R.M.; Buckland, S.T.; Siriwardena, G.M.; Baillie, S.R.; Wilson, J.D. Analysis of Population Trends for Farmland Birds Using Generalized Additive Models. Ecology 2000, 81, 1970–1984. [Google Scholar] [CrossRef]
  7. Phillips, S.J.; Anderson, R.P.; Schapire, R.E. Maximum Entropy Modeling of Species Geographic Distributions. Ecol. Model. 2006, 190, 231–259. [Google Scholar] [CrossRef]
  8. Liao, J.; Wu, Z.; Wang, H.; Xiao, S.; Mo, P.; Cui, X. Projected Effects of Climate Change on Species Range of Pantala flavescens, a Wandering Glider Dragonfly. Biology 2023, 12, 226. [Google Scholar] [CrossRef] [PubMed]
  9. Pearson, R.G.; Raxworthy, C.J.; Nakamura, M.; Peterson, A.T. Predicting Species Distributions from Small Numbers of Occurrence Records: A Test Case Using Cryptic Geckos in Madagascar. J. Biogeogr. 2007, 34, 102–117. [Google Scholar] [CrossRef]
  10. Yang, S.; Wang, H.; Tong, J.; Bai, Y.; Alatalo, J.M.; Liu, G.; Fang, Z.; Zhang, F. Impacts of Environment and Human Activity on Grid-Scale Land Cropping Suitability and Optimization of Planting Structure, Measured Based on the MaxEnt Model. Sci. Total Environ. 2022, 836, 155356. [Google Scholar] [CrossRef]
  11. Kaky, E.; Nolan, V.; Alatawi, A.; Gilbert, F. A Comparison between Ensemble and MaxEnt Species Distribution Modelling Approaches for Conservation: A Case Study with Egyptian Medicinal Plants. Ecol. Inform. 2020, 60, 101150. [Google Scholar] [CrossRef]
  12. Dakhil, M.A.; Halmy, M.W.A.; Hassan, W.A.; El-Keblawy, A.; Pan, K.; Abdelaal, M. Endemic Juniperus Montane Species Facing Extinction Risk under Climate Change in Southwest China: Integrative Approach to Conservation Assessment and Prioritization. Biology 2021, 10, 63. [Google Scholar] [CrossRef]
  13. Zeppel, M.J.B.; Wilks, J.V.; Lewis, J.D. Impacts of Extreme Precipitation and Seasonal Changes in Precipitation on Plants. Biogeosciences 2014, 11, 3083–3093. [Google Scholar] [CrossRef]
  14. Liu, H.; Wang, L.; Yang, J.; Nakagoshi, N.; Liang, C.; Wang, W.; Lv, Y. Predictive Modeling of the Potential Natural Vegetation Pattern in Northeast China. Ecol. Res. 2009, 24, 1313–1321. [Google Scholar] [CrossRef]
  15. Heinze, J.; Sitte, M.; Schindhelm, A.; Wright, J.; Joshi, J. Plant-Soil Feedbacks: A Comparative Study on the Relative Importance of Soil Feedbacks in the Greenhouse versus the Field. Oecologia 2016, 181, 559–569. [Google Scholar] [CrossRef] [PubMed]
  16. Amat, M.E.; Vargas, P.; Gomez, J.M. Effects of Human Activity on the Distribution and Abundance of an Endangered Mediterranean High-Mountain Plant (Erysimum penyalarense). J. Nat. Conserv. 2013, 21, 262–271. [Google Scholar] [CrossRef]
  17. Zhang, K.; Zhang, Y.; Zhou, C.; Meng, J.; Sun, J.; Zhou, T.; Tao, J. Impact of Climate Factors on Future Distributions of Paeonia Ostii across China Estimated by MaxEnt. Ecol. Inform. 2019, 50, 62–67. [Google Scholar] [CrossRef]
  18. Fu, B.; Wang, S.; Liu, Y.; Liu, J.; Liang, W.; Miao, C. Hydrogeomorphic Ecosystem Responses to Natural and Anthropogenic Changes in the Loess Plateau of China. Annu. Rev. Earth Planet. Sci. 2017, 45, 223–243. [Google Scholar] [CrossRef]
  19. Zhang, J.-T. Succession Analysis of Plant Communities in Abandoned Croplands in the Eastern Loess Plateau of China. J. Arid. Environ. 2005, 63, 458–474. [Google Scholar] [CrossRef]
  20. Zhang, J.; Shang, Y.; Liu, J.; Fu, J.; Wei, S.; Tong, L. Causes of Variations in Sediment Yield in the Jinghe River Basin, China. Sci. Rep. 2020, 10, 18054. [Google Scholar] [CrossRef]
  21. Wu, D.; Zou, C.; Cao, W.; Xiao, T.; Gong, G. Ecosystem Services Changes between 2000 and 2015 in the Loess Plateau, China: A Response to Ecological Restoration. PLoS ONE 2019, 14, e0209483. [Google Scholar] [CrossRef] [PubMed]
  22. Han, F.; Ren, L.; Zhang, X.; Li, Z. The WEPP Model Application in a Small Watershed in the Loess Plateau. PLoS ONE 2016, 11, e0148445. [Google Scholar] [CrossRef] [PubMed]
  23. Zeng, Y.; Jing, T.; Xu, B.; Yang, X.; Jian, J.; Zong, R.; Wang, B.; Dai, W.; Deng, L.; Fang, N.; et al. Vectorized Dataset of Silted Land Formed by Check Dams on the Chinese Loess Plateau. Sci. Data 2024, 11, 348. [Google Scholar] [CrossRef] [PubMed]
  24. Zhang, Q.; Fu, S.; Guo, H.; Chen, S.; Li, Z. Climatic Warming-Induced Drought Stress Has Resulted in the Transition of Tree Growth Sensitivity from Temperature to Precipitation in the Loess Plateau of China. Biology 2023, 12, 1275. [Google Scholar] [CrossRef]
  25. Vilar, L.; Gomez, I.; Martinez-Vega, J.; Echavarria, P.; Riano, D.; Martin, P. Multitemporal Modelling of Socio-Economic Wildfire Drivers in Central Spain between the 1980s and the 2000s: Comparing Generalized Linear Models to Machine Learning Algorithms. PLoS ONE 2016, 11, e0161344. [Google Scholar] [CrossRef]
  26. Zhang, Q.; Wang, Y.; Tao, S.; Bilsborrow, R.E.; Qiu, T.; Liu, C.; Sannigrahi, S.; Li, Q.; Song, C. Divergent Socioeconomic-Ecological Outcomes of China’s Conversion of Cropland to Forest Program in the Subtropical Mountainous Area and the Semiarid Loess Plateau. Ecosyst. Serv. 2020, 45, 101167. [Google Scholar] [CrossRef]
  27. Ma, S.; Liu, G.; Wang, L.; Liu, G.; Xu, X. Salix Gordejevii Females Exhibit More Resistance against Wind Erosion than Males under Aeolian Environment. Front. Plant Sci. 2022, 13, 1053741. [Google Scholar] [CrossRef]
  28. Zeng, Y.-F.; Zhang, J.-G.; Duan, A.-G.; Abuduhamiti, B. Genetic Structure of Populus Hybrid Zone along the Irtysh River Provides Insight into Plastid-Nuclear Incompatibility. Sci. Rep. 2016, 6, 28043. [Google Scholar] [CrossRef]
  29. Wang, J.; Gao, J.; Zhang, H.; Tang, M. Changes in Rhizosphere Soil Fungal Communities of Pinus Tabuliformis Plantations at Different Development Stages on the Loess Plateau. Int. J. Mol. Sci. 2022, 23, 6753. [Google Scholar] [CrossRef]
  30. Wang, E.; Lu, Z.; Rohani, E.R.; Ou, J.; Tong, X.; Han, R. Current and Future Distribution of Forsythia Suspensa in China under Climate Change Adopting the MaxEnt Model. Front. Plant Sci. 2024, 15, 1394799. [Google Scholar] [CrossRef]
  31. He, L.-X.; Jia, Z.-Q.; Li, Q.-X.; Feng, L.-L.; Yang, K.-Y. Fine-Root Decomposition Characteristics of Four Typical Shrubs in Sandy Areas of an Arid and Semiarid Alpine Region in Western China. Ecol. Evol. 2019, 9, 5407–5419. [Google Scholar] [CrossRef]
  32. Dhyani, D.; Maikhuri, R.K.; Dhyani, S. Seabuckthorn: An Underutilized Resource for the Nutritional Security and Livelihood Improvement of Rural Communities in Uttarakhand Himalaya. Ecol. Food Nutr. 2011, 50, 168–180. [Google Scholar] [CrossRef] [PubMed]
  33. Li, S.; Liber, K. Influence of Different Revegetation Choices on Plant Community and Soil Development Nine Years after Initial Planting on a Reclaimed Coal Gob Pile in the Shanxi Mining Area, China. Sci. Total Environ. 2018, 618, 1314–1323. [Google Scholar] [CrossRef] [PubMed]
  34. Jin, Z.; Li, X.; Wang, Y.; Wang, Y.; Wang, K.; Cui, B. Comparing Watershed Black Locust Afforestation and Natural Revegetation Impacts on Soil Nitrogen on the Loess Plateau of China. Sci. Rep. 2016, 6, 25048. [Google Scholar] [CrossRef] [PubMed]
  35. Zhang, J.; Xie, W.; Yu, X.; Zhang, Z.; Zhao, Y.; Wang, N.; Wang, Y. Selection of Suitable Reference Genes for RT-qPCR Gene Expression Analysis in Siberian Wild Rye (Elymus sibiricus) under Different Experimental Conditions. Genes 2019, 10, 451. [Google Scholar] [CrossRef] [PubMed]
  36. Li, Y.; Hu, S.; Lang, S.; Pu, Y.; Zhang, S.; Li, T.; Xu, X.; Jia, Y.; Wang, G.; Yuan, D.; et al. Soil Quality and Ecological Benefits Assessment of Alpine Desertified Grassland Following Different Ecological Restoration Measures. Front. Plant Sci. 2023, 14, 1283457. [Google Scholar] [CrossRef]
  37. Shi, S.; Li, Z.; Wang, H.; von Arx, G.; Lu, Y.; Wu, X.; Wang, X.; Liu, G.; Fu, B. Roots of Forbs Sense Climate Fluctuations in the Semi-Arid Loess Plateau: Herb-Chronology Based Analysis. Sci. Rep. 2016, 6, 28435. [Google Scholar] [CrossRef]
  38. Huang, E.; Chen, Y.; Fang, M.; Zheng, Y.; Yu, S. Environmental Drivers of Plant Distributions at Global and Regional Scales. Glob. Ecol. Biogeogr. 2021, 30, 697–709. [Google Scholar] [CrossRef]
  39. Chi, Y.; Wang, E.; Wang, J. Identifying the Anthropogenic Influence on the Spatial Distribution of Plant Diversity in an Estuarine Island through Multiple Gradients. Glob. Ecol. Conserv. 2020, 21, e00833. [Google Scholar] [CrossRef]
  40. Abdelaal, M.; Fois, M.; Fenu, G.; Bacchetta, G. Using MaxEnt Modeling to Predict the Potential Distribution of the Endemic Plant Rosa Arabica Crép. in Egypt. Ecol. Inform. 2019, 50, 68–75. [Google Scholar] [CrossRef]
  41. Lu, L.; Ren, Z.; Yue, Y.; Yu, X.; Lu, S.; Li, G.; Li, H.; Wei, J.; Liu, J.; Mu, Y.; et al. Niche Modeling Predictions of the Potential Distribution of Marmota Himalayana, the Host Animal of Plague in Yushu County of Qinghai. BMC Public Health 2016, 16, 183. [Google Scholar] [CrossRef] [PubMed]
  42. Veloz, S.D. Spatially Autocorrelated Sampling Falsely Inflates Measures of Accuracy for Presence-Only Niche Models. J. Biogeogr. 2009, 36, 2290–2299. [Google Scholar] [CrossRef]
  43. Swets, J.A. Measuring the Accuracy of Diagnostic Systems|Science. Available online: https://www.science.org/doi/10.1126/science.3287615 (accessed on 14 June 2024).
  44. Wu, J.; Li, X.; Luo, Y.; Zhang, D. Spatiotemporal Effects of Urban Sprawl on Habitat Quality in the Pearl River Delta from 1990 to 2018. Sci. Rep. 2021, 11, 13981. [Google Scholar] [CrossRef]
  45. Shu, Y.; Lam, N.S.N.; Reams, M. A New Method for Estimating Carbon Dioxide Emissions from Transportation at Fine Spatial Scales. Environ. Res. Lett. 2010, 5, 044008. [Google Scholar] [CrossRef] [PubMed]
  46. Grabić, J.; Ljevnaić-Mašić, B.; Zhan, A.; Benka, P.; Heilmeier, H. A Review on Invasive False Indigo Bush (Amorpha fruticosa L.): Nuisance Plant with Multiple Benefits. Ecol. Evol. 2022, 12, e9290. [Google Scholar] [CrossRef]
  47. Li, D.; Gu, B.; Huang, C.; Shen, J.; Wang, X.; Guo, J.; Yu, R.; Mou, S.; Guan, Q. Functional Study of Amorpha Fruticosa WRKY20 Gene in Response to Drought Stress. Int. J. Mol. Sci. 2023, 24, 12231. [Google Scholar] [CrossRef]
  48. McNicol, I.M.; Ryan, C.M.; Dexter, K.G.; Ball, S.M.J.; Williams, M. Aboveground Carbon Storage and Its Links to Stand Structure, Tree Diversity and Floristic Composition in Southeastern Tanzania. Ecosystems 2018, 21, 740–754. [Google Scholar] [CrossRef]
  49. Zeng, Y.; Zhao, C.; Kundzewicz, Z.W.; Lv, G. Distribution Pattern of Tugai Forests Species Diversity and Their Relationship to Environmental Factors in an Arid Area of China. PLoS ONE 2020, 15, e0232907. [Google Scholar] [CrossRef]
  50. Nieto-Lugilde, D.; Lenoir, J.; Abdulhak, S.; Aeschimann, D.; Dullinger, S.; Gegout, J.-C.; Guisan, A.; Pauli, H.; Renaud, J.; Theurillat, J.-P.; et al. Tree Cover at Fine and Coarse Spatial Grains Interacts with Shade Tolerance to Shape Plant Species Distributions across the Alps. Ecography 2015, 38, 578–589. [Google Scholar] [CrossRef]
  51. Fan, B.; McHugh, A.D.; Guo, S.; Ma, Q.; Zhang, J.; Zhang, X.; Zhang, W.; Du, J.; Yu, Q.; Zhao, C. Factors Influencing the Natural Regeneration of the Pioneering Shrub Calligonum Mongolicum in Sand Dune Stabilization Plantations in Arid Deserts of Northwest China. Ecol. Evol. 2018, 8, 2975–2984. [Google Scholar] [CrossRef]
  52. Rutten, G.; Ensslin, A.; Hemp, A.; Fischer, M. Vertical and Horizontal Vegetation Structure across Natural and Modified Habitat Types at Mount Kilimanjaro. PLoS ONE 2015, 10, e0138822. [Google Scholar] [CrossRef] [PubMed]
  53. Zheng, X.; Yu, Z.; Yu, F.; Shi, Y. Grain-Filling Characteristics and Yield Formation of Wheat in Two Different Soil Fertility Fields in the Huang-Huai-Hai Plain. Front. Plant Sci. 2022, 13, 932821. [Google Scholar] [CrossRef]
  54. Dai, T.; Wang, L.; Li, T.; Qiu, P.; Wang, J.; Wang, Z. Study on Characteristics of Soil and Nutrient Losses in Sunjiagou Small Watershed in Cold Black Soil Area. PLoS ONE 2023, 18, e0289479. [Google Scholar] [CrossRef] [PubMed]
  55. Xu, H.; Wang, S.; Tang, L.; Wang, Y.; Li, Z.; Wang, W. Differential Influence of Cortex and Stele Components on Root Tip Diameter in Different Types of Tropical Climbing Plants. Front. Plant Sci. 2022, 13, 961214. [Google Scholar] [CrossRef]
  56. Zheng, H.; Li, H. Spatial-Temporal Evolution Characteristics of Land Use and Habitat Quality in Shandong Province, China. Sci. Rep. 2022, 12, 15422. [Google Scholar] [CrossRef]
  57. Rurinda, J.; Zingore, S.; Jibrin, J.M.; Balemi, T.; Masuki, K.; Andersson, J.A.; Pampolino, M.F.; Mohammed, I.; Mutegi, J.; Kamara, A.Y.; et al. Science-Based Decision Support for Formulating Crop Fertilizer Recommendations in Sub-Saharan Africa. Agric. Syst. 2020, 180, 102790. [Google Scholar] [CrossRef] [PubMed]
Figure 1. Overview of the study area. (a) Geographic location of the Loess Plateau, (b) precipitation, (c) temperature, (d) soil type, (e) land use type.
Forests 15 01528 g001
Figure 2. Research framework.
Forests 15 01528 g002
Figure 3. Unsuitable/suitable area for 12 species in two cases.
Forests 15 01528 g003
Figure 4. Distribution of potential planting suitability zones for the four plant species in the tree layer.
Forests 15 01528 g004
Figure 5. Distribution of potential planting suitability zones for the four plant species in the shrub layer.
Forests 15 01528 g005
Figure 6. Distribution of potential planting suitability zones for the four plant species in the herb layer.
Forests 15 01528 g006
Figure 7. Distribution of optimal suitability of species in the tree layer of the Loess Plateau.
Forests 15 01528 g007
Figure 8. Distribution of optimal suitability of species in the shrub layer of the Loess Plateau.
Forests 15 01528 g008
Figure 9. Distribution of optimal suitability of species in the herb layer of the Loess Plateau.
Forests 15 01528 g009
Figure 10. Vertical structure of species in vegetation restoration on the Loess Plateau.
Forests 15 01528 g010
Figure 11. Contributions of factors influencing the distribution of four plant species in the tree layer.
Forests 15 01528 g011
Figure 12. Contributions of factors influencing the distribution of four plant species in the shrub layer.
Forests 15 01528 g012
Figure 13. Contributions of factors influencing the distribution of four plant species in the herb layer.
Forests 15 01528 g013
Table 1. Factor indicator system.
TypeFactorsAbbreviationData SourcesYearResolution Ratio
Climatic factorsAnnual Mean TemperatureBIO1WorldClim: Global Climate Data Version 2.0 (https://worldclim.org, accessed on 2 June 2024)20201 km × 1 km
Mean Diurnal Range (mean of monthly (max temp − min temp))BIO2
Isothermality (BIO2/BIO7) (×100)BIO3
Temperature Seasonality (standard deviation × 100)BIO4
Max Temperature of Warmest MonthBIO5
Min Temperature of Coldest MonthBIO6
Temperature Annual Range (BIO5-BIO6)BIO7
Mean Temperature of Wettest QuarterBIO8
Mean Temperature of Driest QuarterBIO9
Mean Temperature of Warmest QuarterBIO10
Mean Temperature of Coldest QuarterBIO11
Annual PrecipitationBIO12
Precipitation of Wettest MonthBIO13
Precipitation of Driest MonthBIO14
Precipitation Seasonality (Coefficient of Variation)BIO15
Precipitation of Wettest QuarterBIO16
Precipitation of Driest QuarterBIO17
Precipitation of Warmest QuarterBIO18
Precipitation of Coldest QuarterBIO19
Ecological
factors
Digital elevation modelDEMResource and Environmental Science Data Platform (https://www.resdc.cn/Default.aspx, accessed on 2 June 2024)20001 km × 1 km
SlopeSl
AspectAsp
Sunshine durationSunGlobal Resources Data Cloud (http://www.gis5g.com/data/qxsj?id=185, accessed on 3 June 2024)20201 km × 1 km
Normalized difference vegetation indexNDVIResource and Environmental Science Data
Platform (https://www.resdc.cn/Default.aspx, accessed on 1 June 2024)
20191 km × 1 km
Organic contentOCFood and Agriculture Organization of the United Nations (https://www.fao.org/soils-portal/data-hub/soil-maps-and-databases, accessed on 3 June 2024)20131 km × 1 km
Topsoil calcium carbonate (CaCO3)CaCO3
pHpH
Available water capacity_ClassAWC
Total nitrogenTNA Big Earth Data Platform for Three Poles (https://poles.tpdc.ac.cn, accessed on 3 June 2024)2010–20181 km × 1 km
Total phosphorusTP
Total potassiumTK
Human activitiesDistance from water source to woodlandWWUsing Euclidean distance to calculate the distance between woodland and road, and woodland and water source, respectively, in arcgis10.8.120211 km × 1 km
Distance from road to woodlandRW
Population densityPOPResource and Environmental Science Data Platform (https://www.resdc.cn/Default.aspx, accessed on 2 June 2024)20201 km × 1 km
Gross domestic productGDP
Table 2. AUC values of the 12 species in two cases.
PlantEnvironmentEnvironment and Human Activity
TreesRobinia pseudoacacia0.9390.973
Salix matsudana0.9370.970
Populus tremula0.9360.961
Pinus tabuliformis0.9160.952
ShrubsForsythia suspensa0.9480.967
Caragana korshinskii0.9570.975
Hippophae rhamnoides0.8980.945
Amorpha fruticosa0.9670.984
HerbsAgropyron cristatum0.9300.954
Elymus sibiricus0.9150.941
Avena sativa0.8980.912
Medicago sativa0.9150.958
Disclaimer/Publisher’s Note: The statements, opinions and data contained in all publications are solely those of the individual author(s) and contributor(s) and not of MDPI and/or the editor(s). MDPI and/or the editor(s) disclaim responsibility for any injury to people or property resulting from any ideas, methods, instructions or products referred to in the content.

