Article

Error Analysis and Accuracy Improvement in Forest Canopy Height Estimation Based on GEDI L2A Product: A Case Study in the United States

1
School of Geoscience and Info-Physics, Central South University, Changsha 410083, China
2
Information & Network Center, Central South University, Changsha 410083, China
*
Author to whom correspondence should be addressed.
Forests 2024, 15(9), 1536; https://doi.org/10.3390/f15091536 (registering DOI)
Submission received: 11 June 2024 / Revised: 20 August 2024 / Accepted: 23 August 2024 / Published: 31 August 2024

Abstract

:
Various error factors influence the inversion of forest canopy height using GEDI full-waveform LiDAR data, and the interaction of these factors impacts the accuracy of forest canopy height estimation. From an error perspective, there is still a lack of methods to fully correct the impact of various error factors on the retrieval of forest canopy height from GEDI. From the modeling perspective, establishing clear coupling models between various environments, collection parameters, and GEDI forest canopy height errors is challenging. Understanding the comprehensive impact of various environments and collection parameters on the accuracy of GEDI data is crucial for extracting high-quality and precise forest canopy heights. First, we quantitatively assessed the accuracy of GEDI L2A data in forest canopy height inversion and conducted an error analysis. A GEDI forest canopy height error correction model has been developed, taking into account both forest density and terrain effects. This study elucidated the influence of forest density and terrain on the error in forest canopy height estimation, ultimately leading to an improvement in the accuracy of forest canopy height inversion. In light of the identified error patterns, quality control criteria for GEDI footprints are formulated, and a correction model for GEDI forest canopy height is established to achieve high-precision inversion. We selected 19 forest areas located in the United States with high-accuracy Digital Terrain Models (DTMs) and Canopy Height Models (CHMs) to analyze the error factors of GEDI forest canopy heights and assess the proposed accuracy improvement for GEDI forest canopy heights. The findings reveal a decrease in the corrected RMSE value of forest canopy height from 5.60 m to 4.19 m, indicating a 25.18% improvement in accuracy.

1. Introduction

Forest canopy height, as the most crucial forest structural parameter, serves as the basis for estimating carbon sequestration and has become a significant aspect of forest monitoring. Spaceborne LiDAR plays a crucial role in forest parameter retrieval due to its extensive coverage and ability to acquire vertical structural information of forests. The Global Ecosystem Dynamics Investigation (GEDI), an on-orbit full waveform LiDAR, is the primary instrument for this purpose. Full waveform LiDAR records continuous waveform signals changing over time, of which the most typical systems are ICESat/GLAS and GEDI. Compared with airborne LiDAR, GEDI can invert forest height on a national scale and even globally. In addition, this waveform LiDAR can visually display the vertical structure of the forest, unlike photon cloud data. For full waveform LiDAR, the height difference between the starting position of the signal and the corresponding position of the last peak [1,2] or the stronger of the last two peaks [3,4] is usually considered as the maximum forest canopy height within the footprint.
Numerous researchers have confirmed the accuracy of GEDI products. For example, Adam et al. evaluated the accuracy of ground elevation and canopy height estimates of the GEDI V1 product in two temperate regions in Thuringia, Germany, using airborne LiDAR data. They reported mean absolute errors (MAE) of 2.55 m for terrain and 3.10 m for canopy height [5]. Guerra et al. evaluated forest dynamics in Spain using ALS data and GEDI V1 product and assessed the accuracy of GEDI-derived terrain with a root mean square error (RMSE) of 4.48 m [6]. Fayad et al. used the inventory data to assess the stand-scale dominant heights of Eucalyptus plantations in Brazil. They also compared the accuracy differences between the stand-scale dominant heights obtained by different models [7]. Dorado-Roda et al. evaluated the accuracy of GEDI forest height estimates in the Mediterranean forest area [8]. They classified the tree species in this area and assessed the difference in accuracy between different tree species [8]. Quirós et al. compared the RH100 derived from GEDI products to reference forest heights generated from the ALS LiDAR in Spain. Ten zones showed that the RH100 achieved an RMSE of 3.56 m [9]. Liu et al. evaluated the accuracy of ground elevation and canopy height estimates of GEDI V2 product in the United States using airborne LiDAR data from the National Ecological Observatory Network (NEON), showing that the RMSE of ground elevation was 4.03 m in mid-latitude regions [10]. Their study also analyzed the error factors of the GEDI V2 canopy height product, showing that the accuracy was affected by numerous error factors. In addition, Wang et al. comprehensively evaluated the effects of various error factors on GEDI forest height products and gave the important indicators of these error factors [11]. In complex terrain areas, ground signal waveforms would be extended, causing an overlap between the canopy signal and ground signal, impacting the accuracy of forest canopy height extraction. Additionally, as canopy coverage increases, ground signals weaken, and the probability of multiple scattering increases, which poses greater challenges to extracting forest canopy height. Although the above existing studies explored the error factors of GEDI forest height, most of them were only verified in a small-scale area. In addition, the above existing studies focused on the effects of environmental error factors such as slope, vegetation coverage, and vegetation type on GEDI forest height. Some error factors related to the data processing algorithm and the instrument itself are not quantitatively analyzed. Exploring the influence of more comprehensive error factors on GEDI forest height inversion and quantitatively analyzing the importance of these error factors is crucial for the subsequent improvement in GEDI forest height accuracy.
To address the two main error effects mentioned above, researchers can refer to previous methods used for decomposing GLAS waveforms. Various techniques have been suggested to enhance the precision of forest canopy height estimation using full-waveform LiDAR data. These techniques fall into two main categories: statistical regression models and physical geometric models. Statistical regression methods can be divided into Digital Elevation Model (DEM)-assisted approaches and waveform feature-assisted approaches. The Digital Elevation Model (DEM)-assisted methods [12,13] typically utilize global DEM products to mitigate terrain effects. The waveform feature-assisted methods [14,15] extract waveform characteristics related to terrain, such as waveform length, distance of peaks, leading edge, and trailing edge of the waveform, and train the model with field data to correct forest canopy height. These methods can typically reduce the impact of terrain on forest canopy height accuracy, but they are suitable for small areas and cannot be widely implemented. To overcome the limitations of statistical regression methods, scholars have proposed physical geometric-based models. They explored the influence of factors such as terrain slope, aspect, footprint size, footprint shape, orientation, and laser pointing angle on forest canopy height based on geometric optics and radiative transfer models [16,17,18,19,20,21]. For example, Lee et al. introduced a terrain correction method to quantify the influence of terrain and laser footprint size on the retrieval of forest canopy height [16]. Subsequently, Allouis et al. proposed a refined forest height retrieval method based on GLAS waveform modeling and slope effect correction, which can weaken the influence of terrain on forest canopy height [17]. Nie et al. considered that the actual shape of the laser spot on the ground is elliptical, so the accuracy of the inversion of the understory terrain will be affected by factors such as the shape of the laser spot, the orientation, and the aspect of the terrain [18]. Therefore, a new error correction method that considers the influence of slope, the actual shape of the laser spot, aspect, and orientation were proposed to estimate forest canopy height [18]. Wang et al. designed a novel idea of a geometric physical model, which simulated the ground echo through the auxiliary data as new waveform features to reduce the impact of slope on forest parameter inversion [21].
The above physical geometric-based models can quantitatively express the influence of certain factors, making them suitable for large-scale forest canopy height retrieval. These methods provide a good research basis for the subsequent forest height refinement based on GEDI. However, the above existing methods mainly solved the slope error factor when retrieving forest height from waveform data. The GEDI waveform is affected by various factors, such as terrain, land cover type, canopy cover, and so on. Under different conditions, the accuracy of the GEDI forest height product is highly uncertain. The influence of these error factors on GEDI forest height is nonlinear. It is difficult to express the relationship between these error factors and GEDI forest height through a determined mathematical model. Establishing a clear relationship between these variables and GEDI forest canopy height is challenging.
The purpose of this paper is to refine the existing GEDI forest height products and improve the accuracy of existing forest height products. We are facing two key issues: (1) what factors are related to GEDI forest height importantly? (2) What model can we use to establish the relationship between the error of GEDI forest height and various factors? In this paper, we attempt to explore GEDI performance for forest canopy height estimation, analyze the influence of various factors on forest canopy height retrieval, and establish a correction model by introducing machine learning algorithms. First, the accuracy performance of GEDI L2A forest canopy height is analyzed for overall and each site, respectively. Then, we assess the influence of various environments and acquisition parameters on the accuracy of GEDI L2A forest height products and establish criteria for footprint data filtering. On this basis, an error correction model is constructed using the random forest algorithm to obtain high-precision forest canopy heights.

2. Materials

2.1. Study Area

As shown in Figure 1, we selected 19 forest areas located in various regions of the United States to conduct this research. The study areas are 19 sites of the NEON (National Ecological Observatory Network), spanning from 29° N to 46°N and from 71° W to 122° W, covering a total area of approximately 3010 km2. The elevation ranges from 29 m to 3042 m, exhibiting significant terrain variations, with average slopes ranging from 3.5° to 19.7°. The climate in these study areas varies greatly, with annual average temperatures ranging from 0.30 °C to 22.50 °C and annual average precipitation ranging from 509 mm to 2530 mm [11]. Due to the coverage of various climate zones and vegetation types, significant differences exist in canopy structure. The diversity of study areas enhances the variability and facilitates the investigation of the accuracy of GEDI forest canopy height under different conditions. Some high-precision reference data provided by NEON sites were usually used for large-scale verification [10,11].

2.2. GDEI L2A Data

The GEDI LiDAR system was launched by the National Aeronautics and Space Administration (NASA) in December 2018 on board the International Space Station (ISS) [22]. The system comprises three lasers, one of which is split into two beams (Coverage Beam), while the other two lasers remain at full power (Full Beam), resulting in 4 beams at one time. Each of the beams is dithered every other shot, generating 8 tracks on the Earth’s surface, separated by about 600 m across the track. Each footprint has a diameter of approximately 25 m and is separated by 60 m along the track [22,23]. NASA produces different levels of GEDI products, including L1, L2, L3, and L4. The L1 product is the raw and geolocated waveforms. The L2 product is processed to identify ground elevation and relative height (RH) metrics of the vertical profile, which includes two types of products: L2A and L2B. The L2A product involving longitude, latitude, elevation, and RH indicators from the growing seasons of 2019 to 2022 were downloaded for consistency with validation data (https://e4ftl01.cr.usgs.gov/GEDI/GEDI02_A.002/, accessed on 10 March 2023).

2.3. NEON LiDAR Data

We evaluated the accuracy of forest canopy height using the Canopy Height Model (CHM) generated by airborne LiDAR data obtained from the National Ecological Observatory Network (NEON), with a spatial resolution of 1 m (https://data.neonscience.org/data-products/explore, accessed on 12 April 2023). The NEON LiDAR data were collected using the Riegl LMS-Q780 laser scanning sensor, operating at a wavelength of 1064 nm, with a pulse repetition frequency ranging from 100 to 400 kHz [24]. NEON LiDAR data were acquired in the peak greenness of growing seasons, with maximum horizontal and vertical accuracies of less than 0.4 m and 0.36 m, respectively [24]. The CHM products used for this study were mainly collected in 2021, with missing data replaced by data from adjacent years. Specific information about the 19 NEON sites used in this study is provided in Table 1.

2.4. Ancillary Data

We introduced the land cover type data from the National Land Cover Database (NLCD) to extract forest areas, which is released by the United States Geological Survey (USGS). The latest version of the 30 m NLCD dataset provides land cover information for the United States in 2019 and defines 20 land cover classifications (https://www.mrlc.gov/data, accessed on 22 March 2023). Using the nearest neighbor method, we interpolated the land cover data to 1 m as the NEON LiDAR data and determined the land cover type within the GEDI footprint by majority. Our study only focused on the forest areas; therefore, only data from forest areas were retained, specifically classified as deciduous, evergreen, and mixed forests.
NEON DTM product was used to calculate the slope. Information on canopy cover comes from the Global Forest Cover Change Dataset 2015 (GFCC), which has a spatial resolution of 30 m. This product was obtained from the Google Earth Engine (GEE).

3. Accuracy Assessment

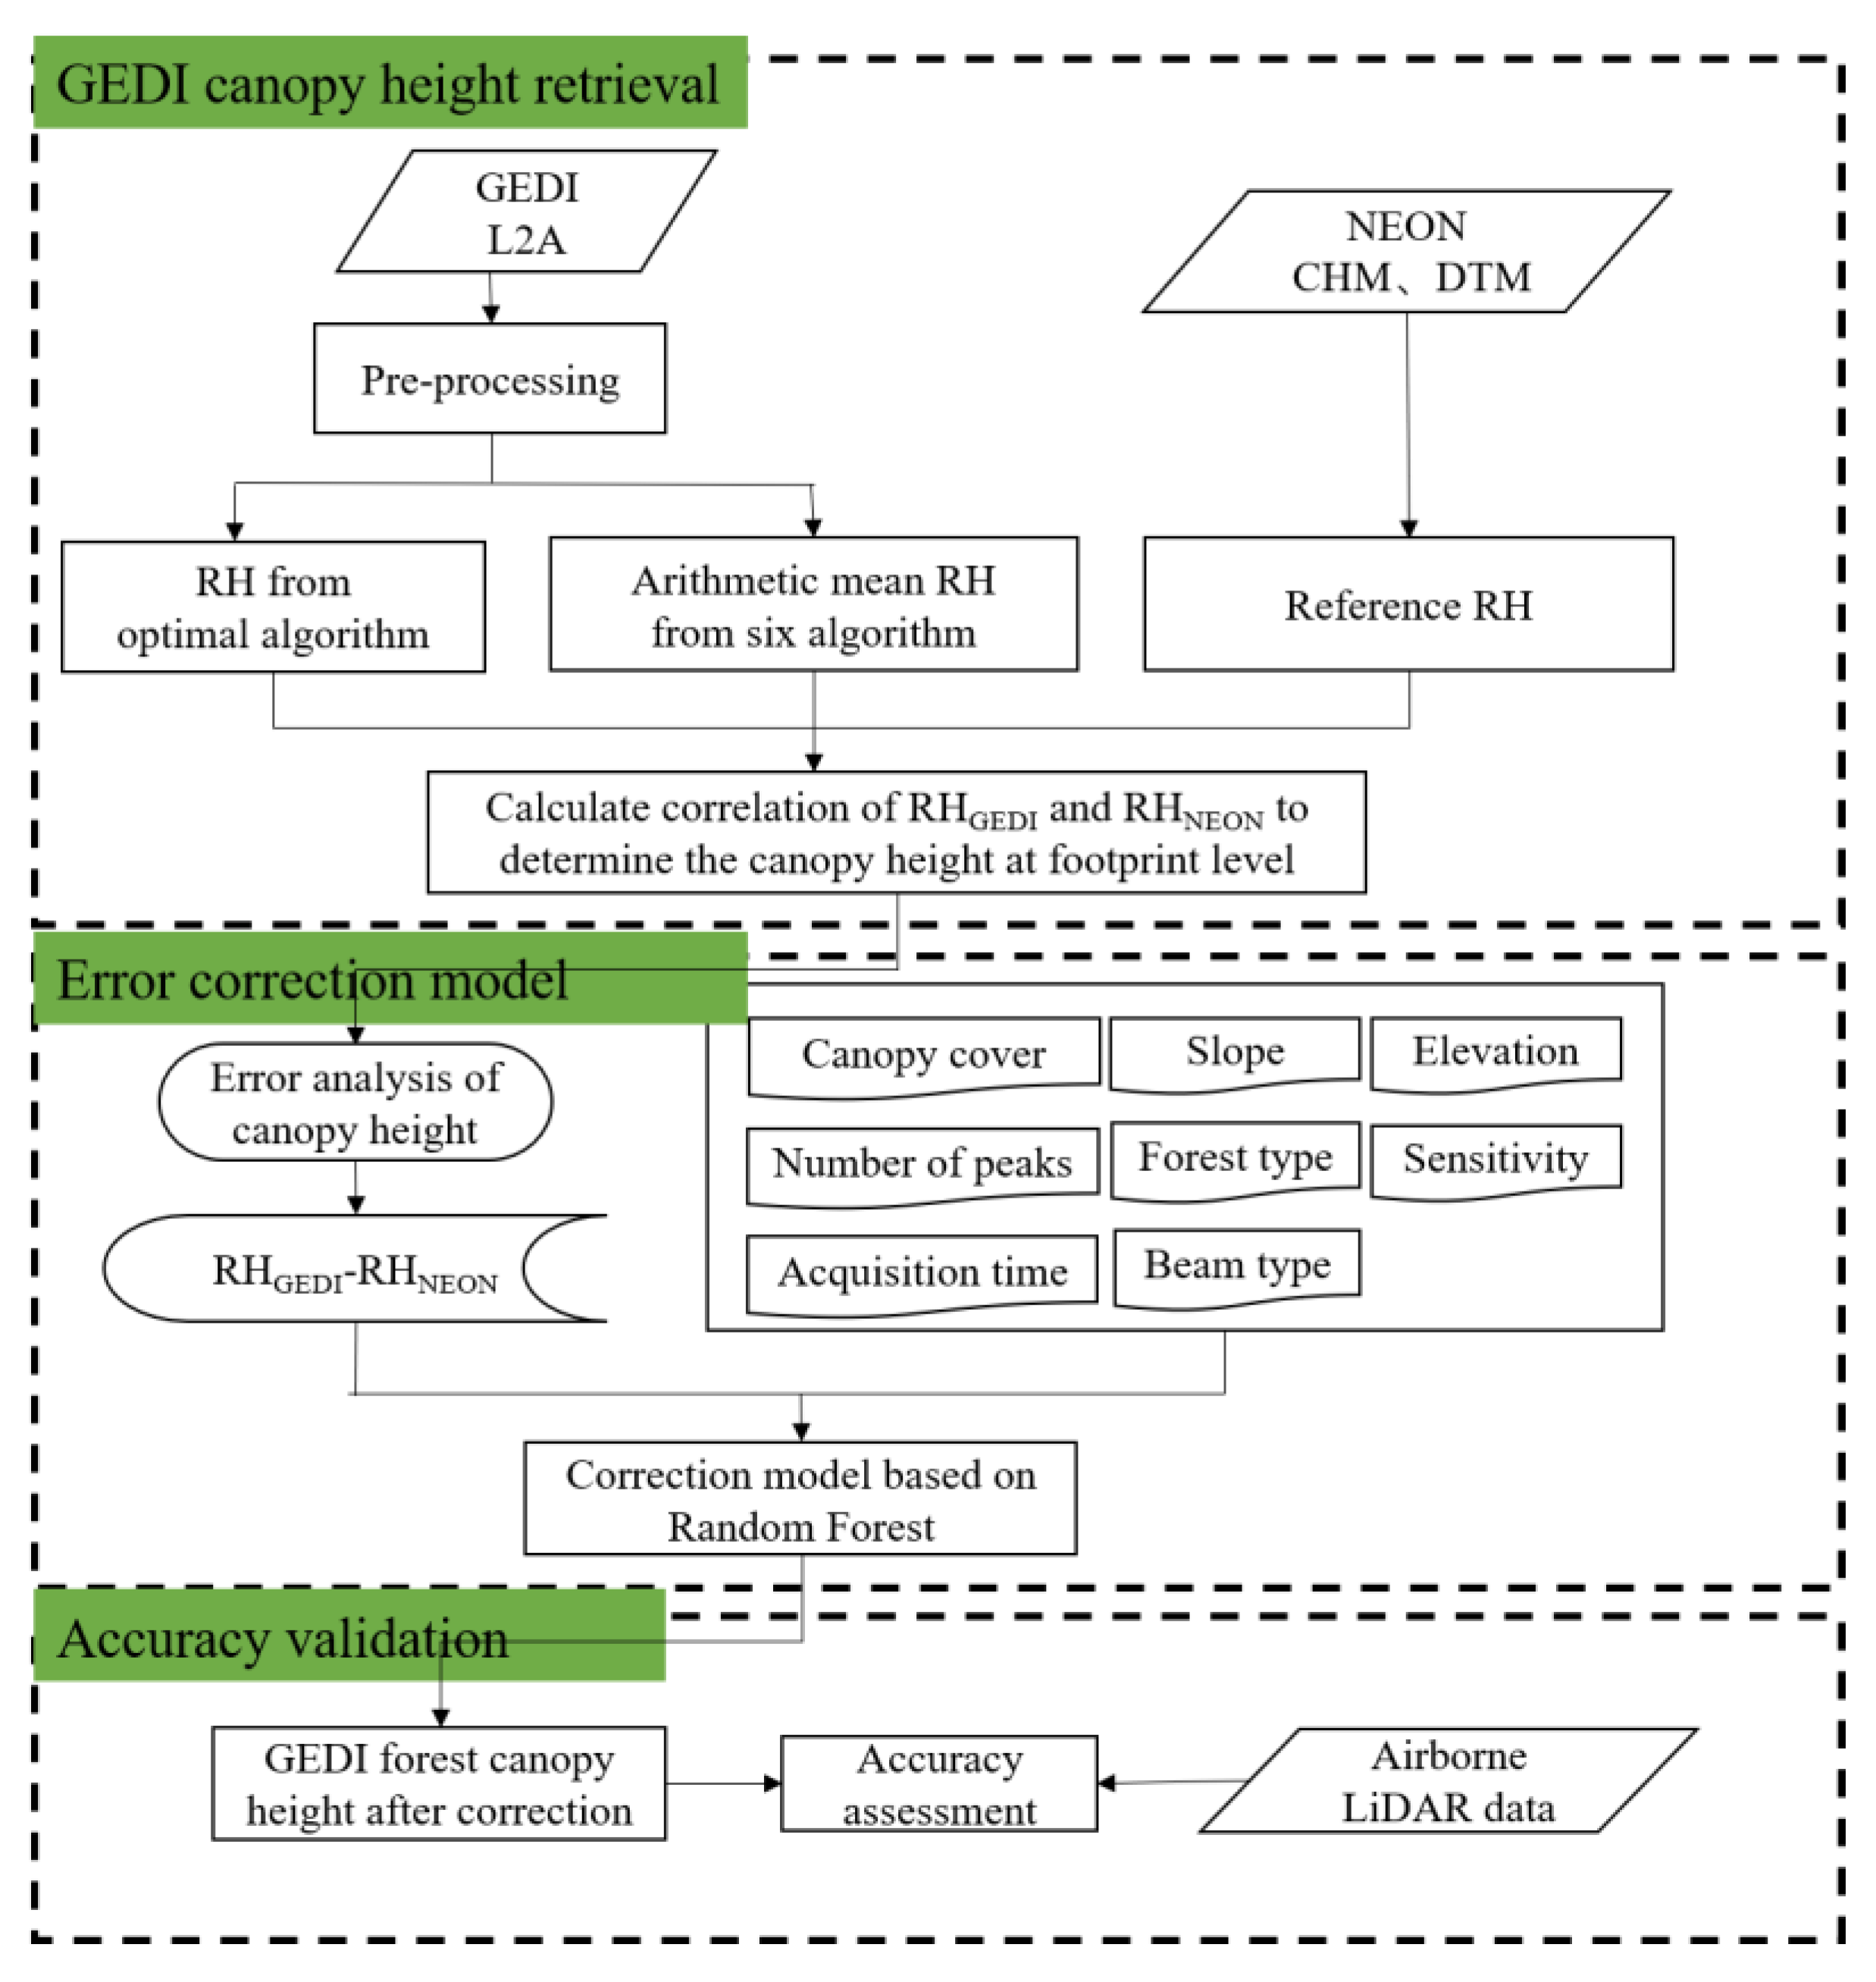
3.1. Pre-Processing of GEDI L2A Data

A filtering process was employed to achieve high-quality GEDI data utilizing the quality metrics within the GEDI L2A product. The steps are delineated as follows [11,25]:
(1)
Footprint data meeting the following criteria were retained: quality_flag = 1; drade_flag = 0; rx_algrunflag = 1; and sensitivity > 0.9. The quality_flag, degrade_flag, rx-algrun_flag, and sensitivity are parameter fields from GEDI L2A data, which are important indicators to measure the quality of the GEDI spot. The quality_flag with a value of 1 represents a selection of the most useful data. The drade_flag with non-zero values indicates the shot occurred during a degraded period. The rx_algrunflag with a value of 1 indicates the GEDI laser signal was received, and the signal process algorithm ran successfully. The sensitivity larger than 0.9 indicates that the maximum canopy cover can be penetrated, considering the SNR of the waveform;
(2)
To mitigate the influence of cloud cover, the ground elevation (elev_lowestmode) of the footprint was extracted alongside the corresponding elevation from the TanDEM-X and SRTM DEM products. Footprints exhibiting a discrepancy exceeding 50 m between the GEDI ground elevation and the TanDEM-X or SRTM DEM elevation were systematically excluded;
(3)
Footprints satisfying either of the following conditions were preserved: leaf_off_flag = 0| pft_class = 1 or 2, where leaf_off_flag and pft_class are parameter fields from GEDI L2A data. The leaf_off_flag and pft_class represent the type of ground object where the laser spot is located. The forest area is the object of this research, so we chose the GEDI spot located in the vegetation area. This criterion ensures that the remainings pertain to evergreen forests or align with the forest growth period, thereby ensuring phenological consistency with airborne LiDAR data. Figure 2 shows the flowchart of the Pre-processing of GEDI L2A.
Forest canopy height derived from full-waveform LiDAR is typically determined by calculating the relative height (RH), which represents the difference between the elevations of the detected ground signal and the n% accumulated waveform energy, where n varies from 1 to 100 (e.g., RH95, RH100, etc.). For the GEDI L2A product, six values corresponding to the RH parameter are generated by distinct algorithms that use different thresholds for waveform smoothness and detecting the start and end of the signal; meanwhile, the product provides an optimal algorithm [26,27]. We extracted RH values, such as RH80, RH85, RH90, RH95, RH96, RH97, RH98, RH99, and RH100, generated by the six algorithms. By removing the maximum and minimum values of the six algorithms, the arithmetic mean of the remaining was computed to yield the corresponding RH, denoted as Trimean_RH80, Trimean_RH85, Trimean_RH90, Trimean_RH95, Trimean_RH96, Trimean_RH97, Trimean_RH98, Trimean_RH99, and Trimean_RH100. Concurrently, the recommended optimal algorithm values were extracted and designated as Optimum_RH80, Optimum_RH85, Optimum_RH90, Optimum_RH95, Optimum_RH96, Optimum_RH97, Optimum_RH98, Optimum_RH99, and Optimum_RH100. The reference CHM data were resampled to 25 m, and the percentile height from the 25 m × 25 m grid was extracted as the reference RH. Correlation analysis was conducted between GEDI RH and the reference RH. The RH value showing the highest correlation was chosen as the forest canopy height within the GEDI footprint. As a result, 69,036 GEDI footprint data were extracted from the forest regions. Statistics of GEDI footprint data for each NEON site are provided in Table 2.

3.2. Performance Analysis

3.2.1. Accuracy Metrics

NEON LiDAR CHM data were employed to assess the accuracy of GEDI L2A forest canopy height. Performance analysis was conducted by calculating the six metrics, including R M S E , R 2 , B i a s , M A E , % B i a s and % R M S E . The formula for each metric is delineated as follows:
R M S E = i = 1 n ( x i y i ) 2 n
R 2 = 1 i = 1 n ( x i y i ) 2 i = 1 n ( y i y ¯ ) 2
B i a s = i = 1 n ( x i y i ) n
M A E = i = 1 n | x i y i | n
% B i a s = B i a s y ¯ 100 %
% R M S E = R M S E y ¯ 100 %
where x i is the canopy height obtained from GEDI; y i is the reference canopy height derived from NEON LiDAR data, and y ¯ is the average of the reference values.

3.2.2. Error Factors

To assess the influence of potential factors on the accuracy of GEDI forest canopy height, we selected several characteristics of beam, terrain, and canopy structure for analysis. The error factors are outlined in Table 3.
To determine the primary factors influencing the accuracy of GEDI forest canopy height and provide guidance for high-quality footprint selection and the development of error correction models, we utilized the Random Forest (RF) algorithm [28] to evaluate the significance of these potential factors. The RF algorithm assesses the significance of each factor by measuring the percentage increase in mean square error (% IncMSE). A higher % IncMSE value indicates greater importance of the variable. Subsequently, the impact of various factors on the GEDI forest canopy height was comprehensively examined based on the importance analysis.

3.3. Results and Discussion of GEDI Forest Height

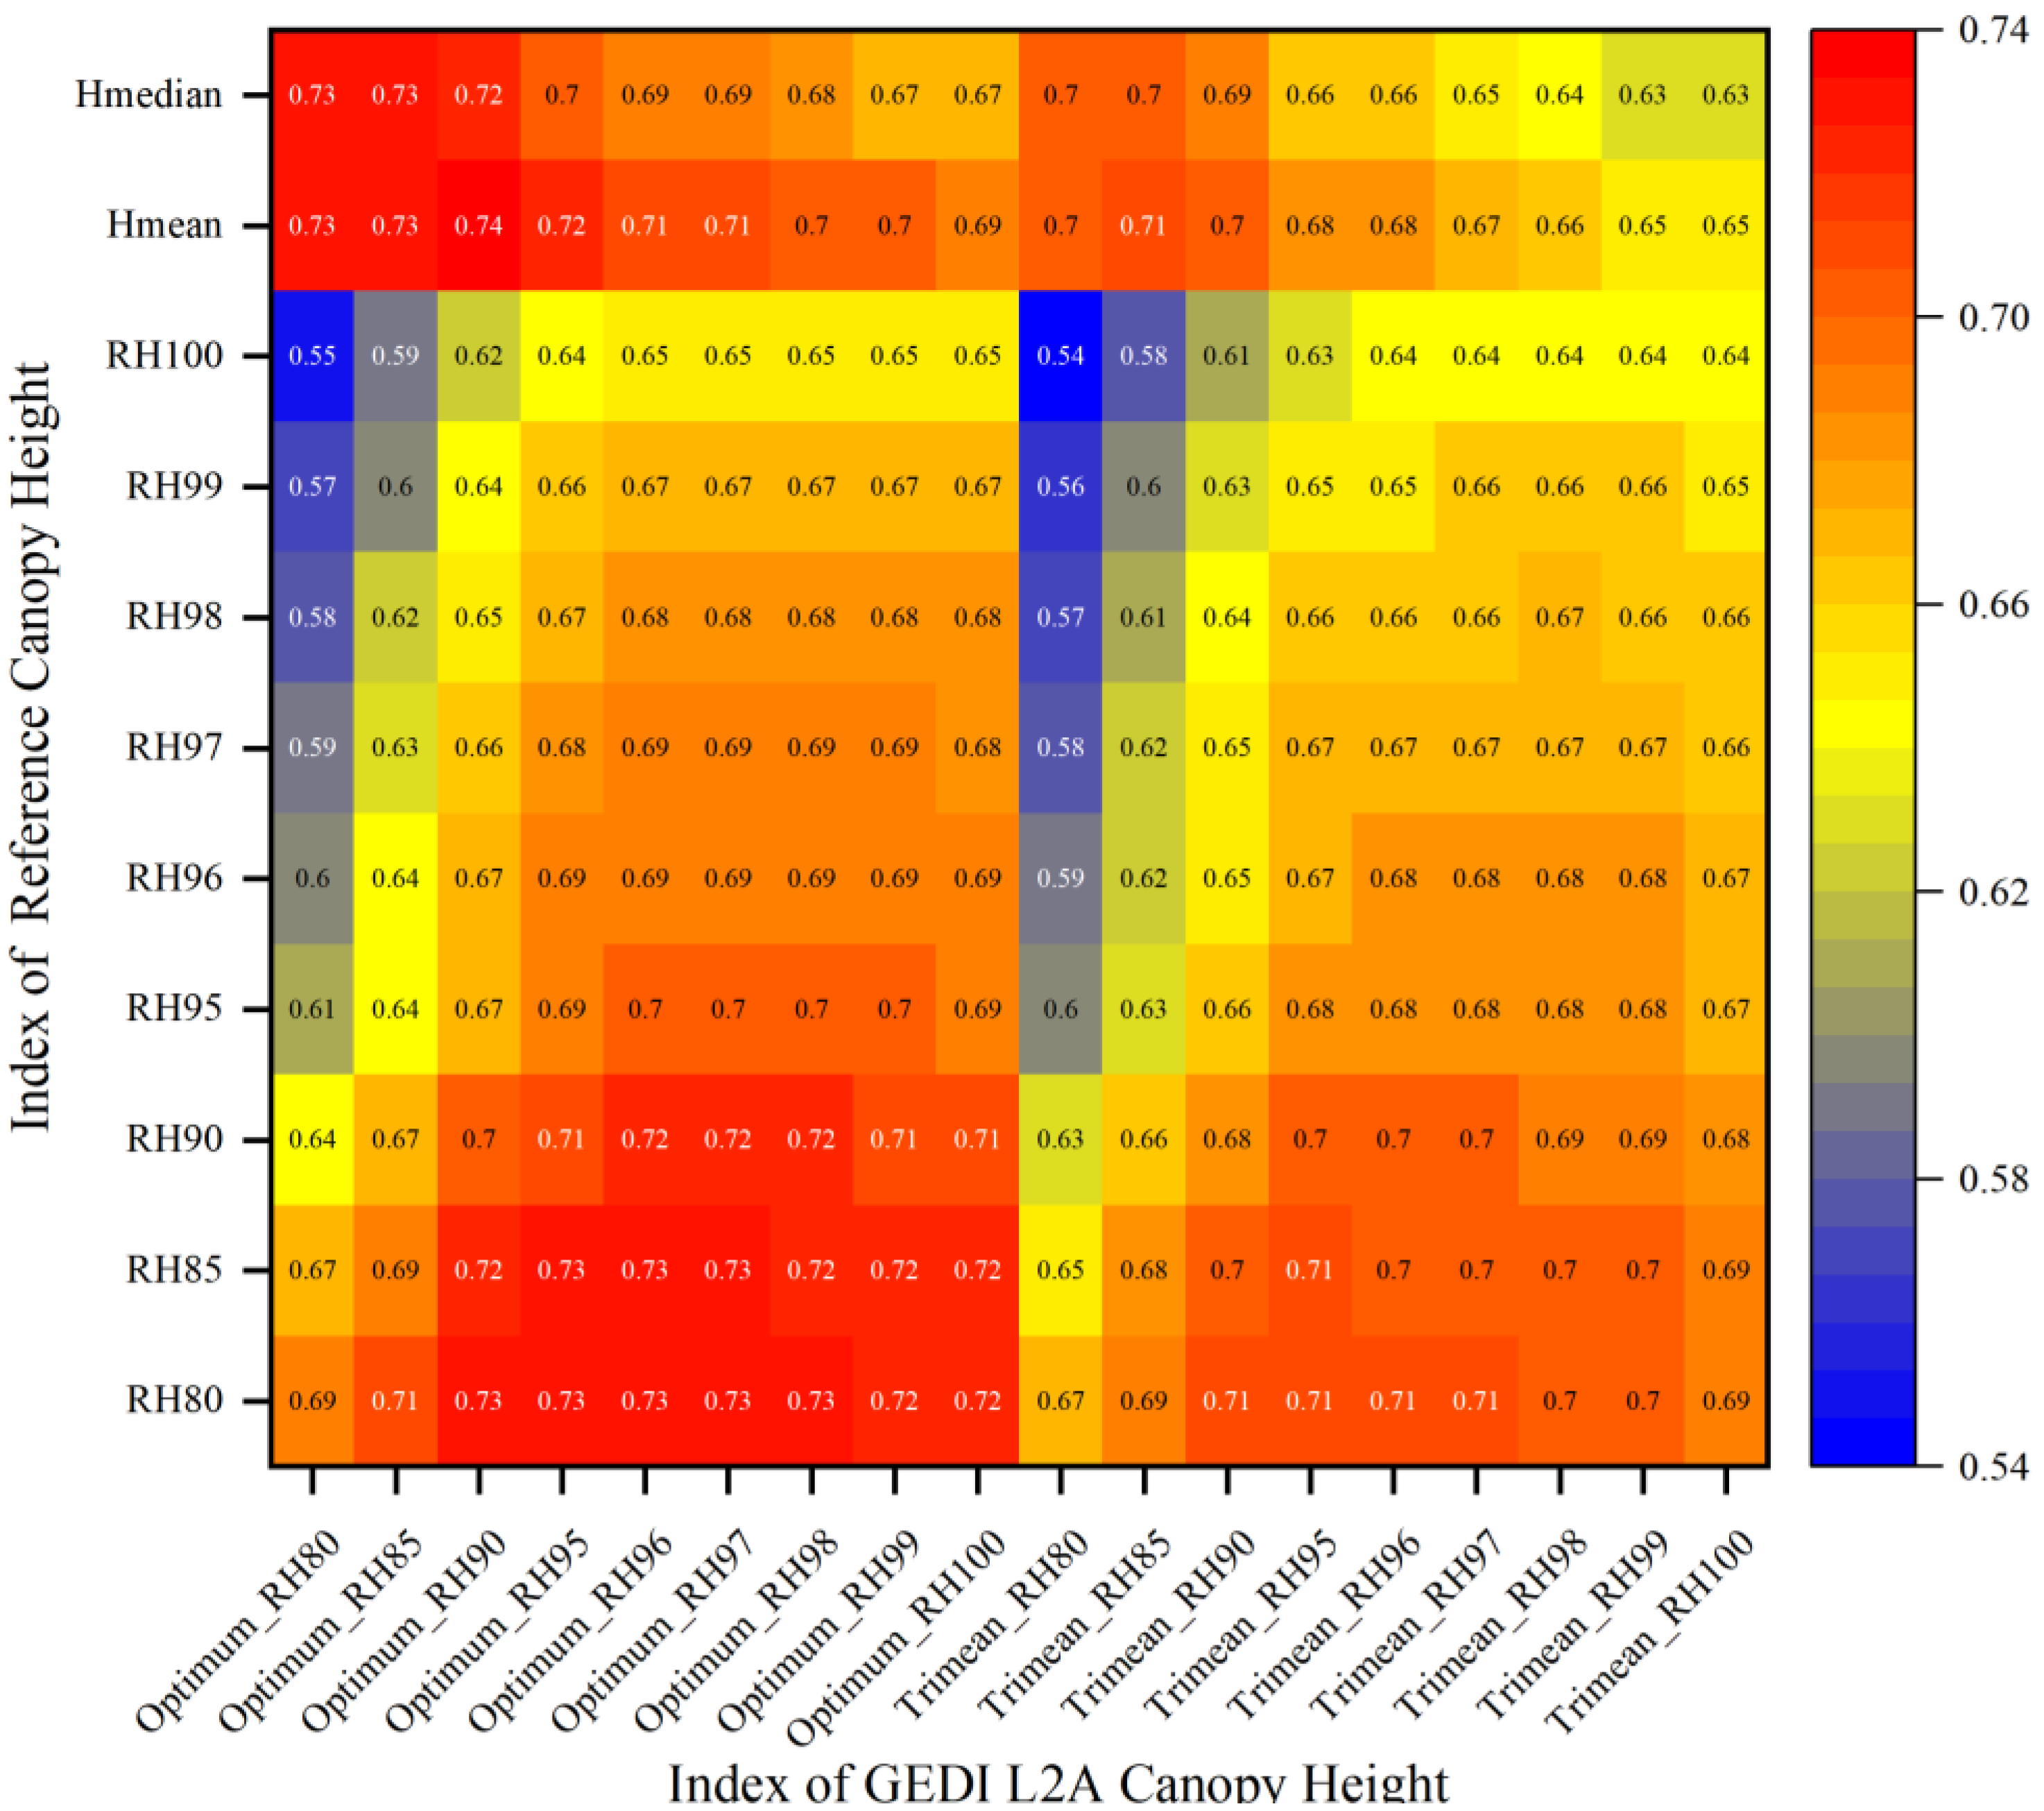
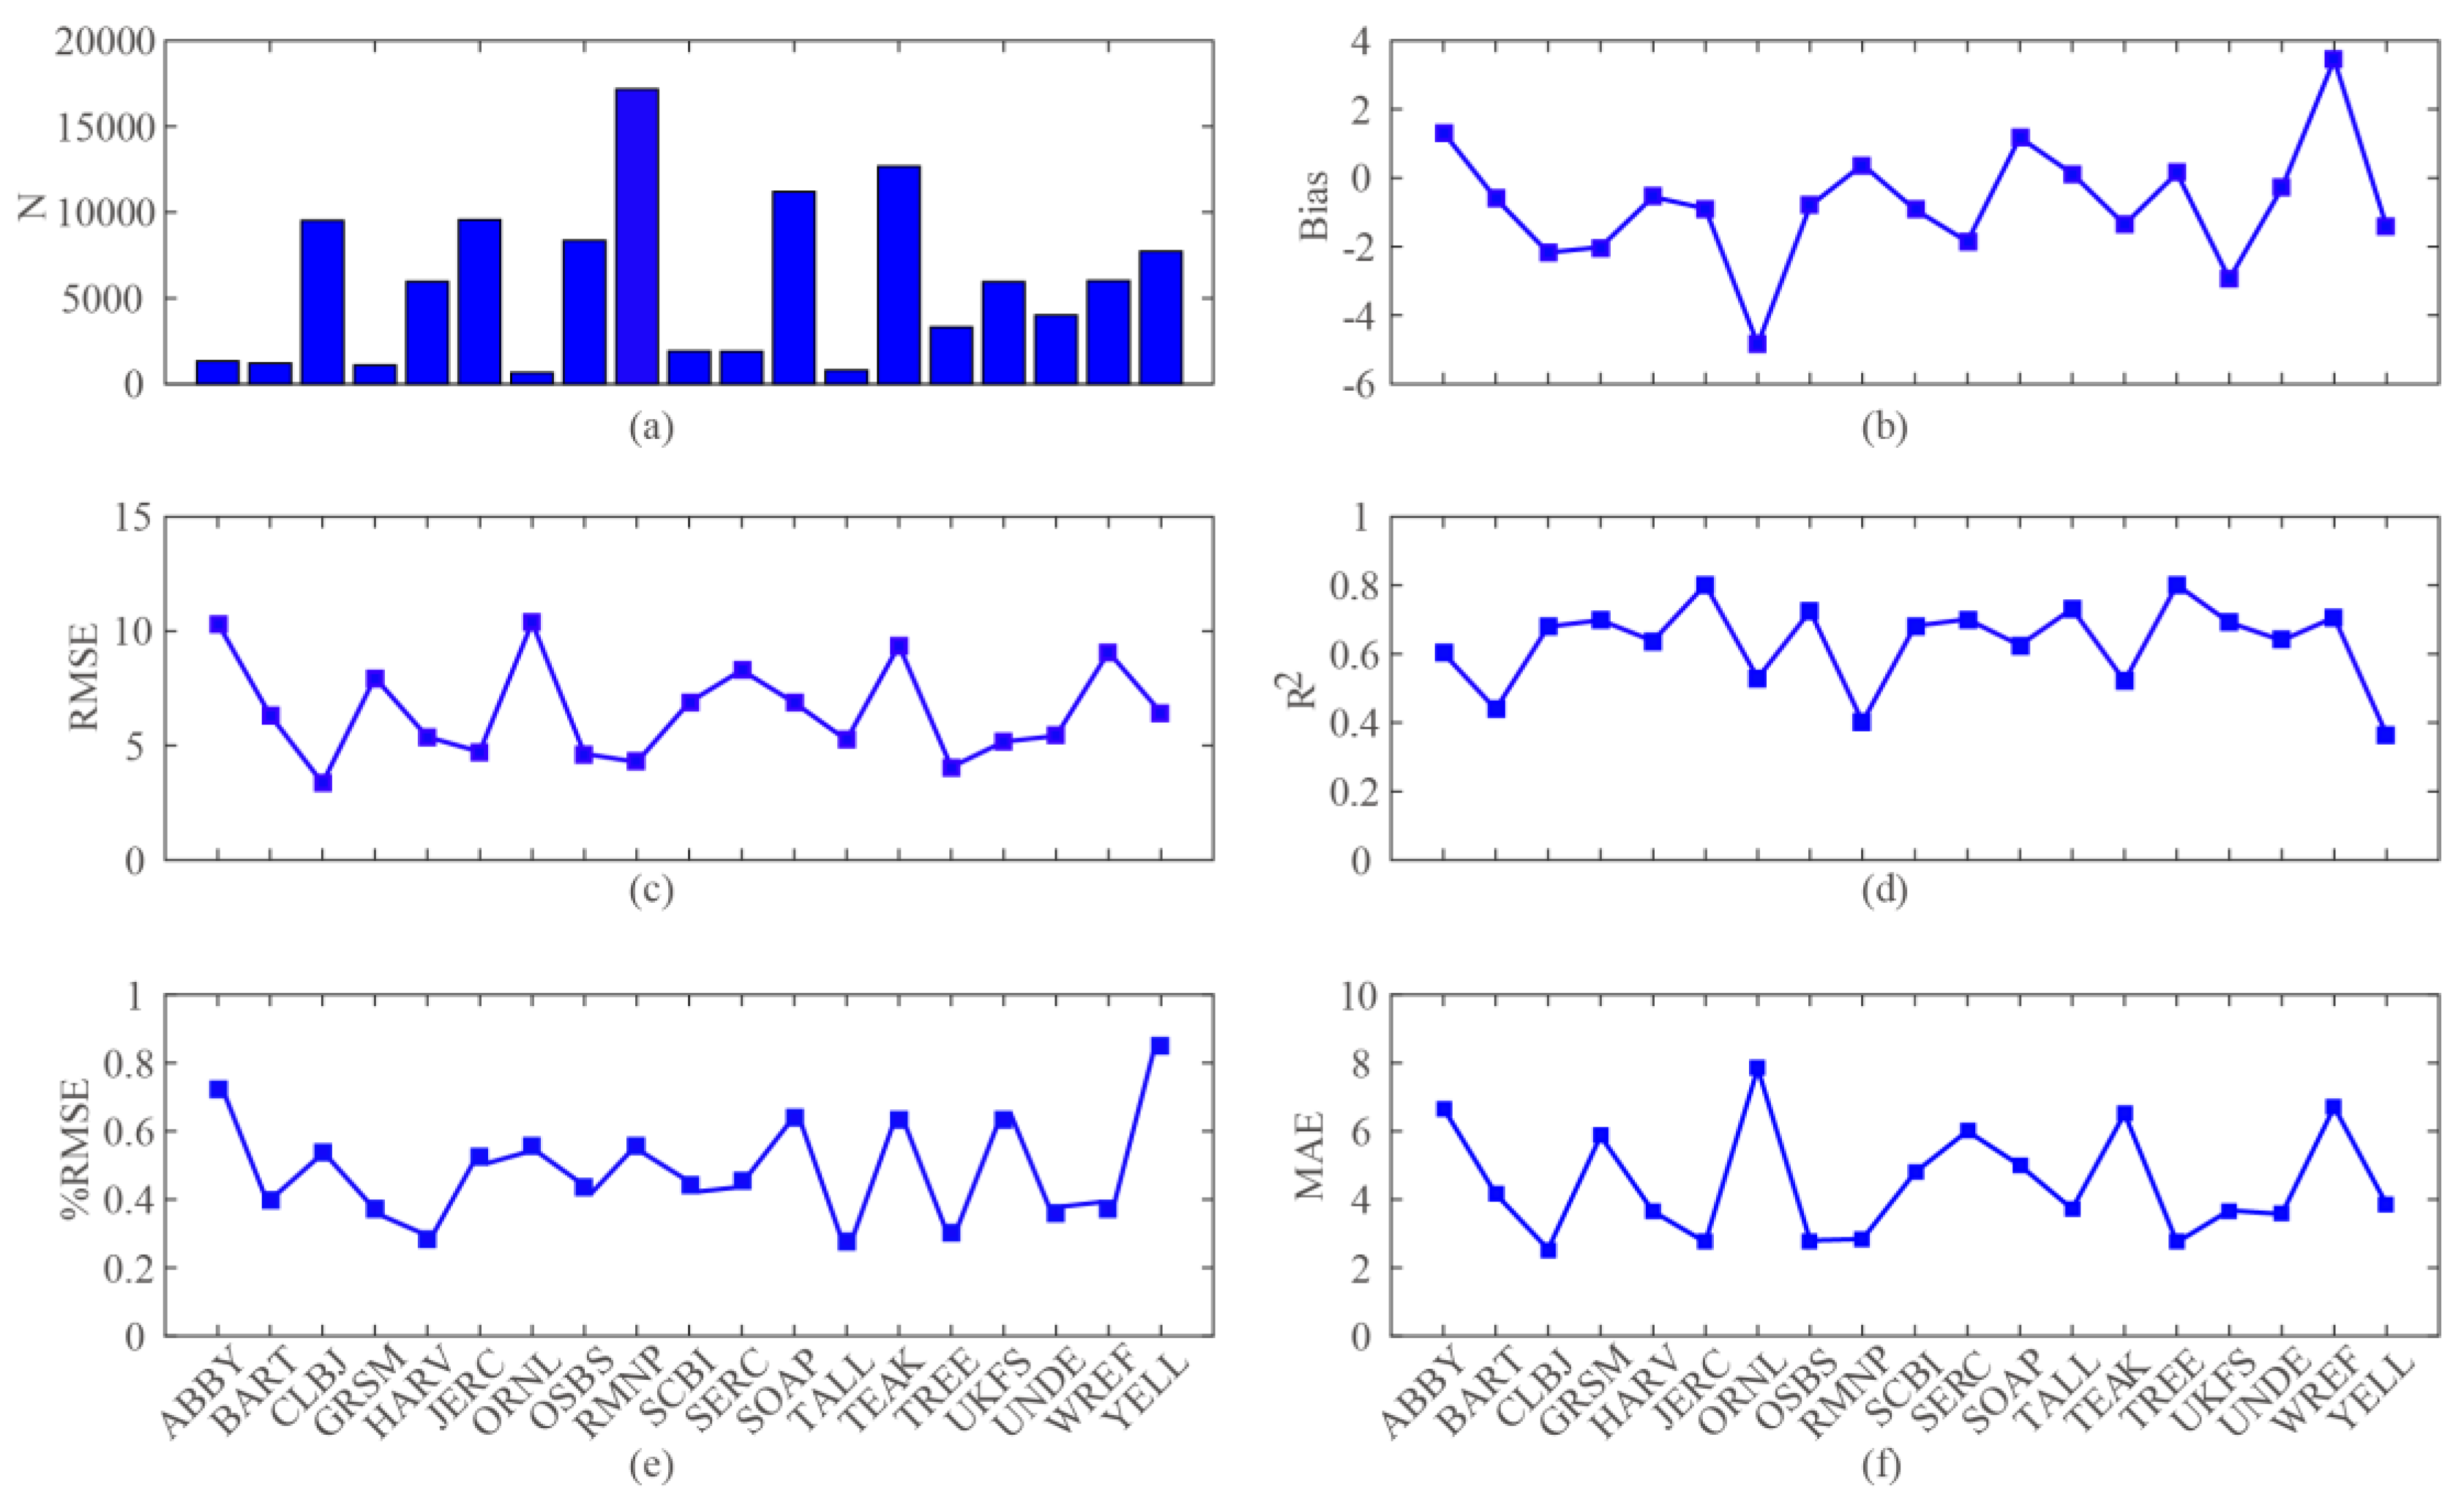
3.3.1. Performance of GEDI Forest Canopy Height

We analyzed the correlation between relative height metrics extracted from the GEDI L2A product and the corresponding reference RH metrics from NEON LiDAR data, as shown in Figure 3. Overall, there is a relatively high correlation between them, and from RH80 to RH100, exhibit an increasing trend followed by decreasing, with the correlation of RH metrics from the optimal algorithm generally higher than that of the truncated mean of six different algorithms. It can be observed that the RH90 of the optimal algorithm has the highest correlation with the airborne average canopy height, denoted as Hmean. Therefore, these two RH values are selected as the footprint forest canopy height of GEDI and the airborne reference values, respectively.
Figure 4a shows the scatter plot for the overall performance of GEDI forest canopy height, which includes all GEDI footprints in forest areas acquired under different conditions. The results demonstrate a relatively high correlation between the GEDI forest canopy height estimation and the reference values, with an R2 value of 0.74 and an RMSE of 6.49 m. Combined with Figure 4b, which depicts the statistical distribution of differences between GEDI forest canopy heights and the reference forest canopy heights, it is apparent that there is an overestimation of forest canopy height extracted by GEDI, which may be attributed to multiple scattering of signal in forest areas.
Performance statistics were conducted for each NEON site, as shown in Figure 5. It can be seen that there is significant variability in the accuracy among different sites, with RMSE values ranging from 3.36 m to 10.37 m. Among these, the sites CLBJ, TREE, RMNP, OSBS, and JERC exhibit relatively low RMSE values, with values of 3.36 m, 4.06 m, 4.28 m, 4.64 m, and 4.73 m respectively. Their commonality is that the terrain is relatively flat, with average slopes not exceeding 6°. Additionally, the overall RMSE values for the sites ABBY, ORNL, TEAK, WREF, and GRSM, show significant terrain variations with average slopes exceeding 15°, all exceeding 8 m. Among these, ABBY and TEAK have relatively sparse vegetation cover, while WREF and ORNL have denser vegetation cover. Sparse vegetation reduces the probability of laser beam covering the top of the forest and limits the ability to retrieve precise forest canopy height, whereas, in densely vegetated areas, the detection ability of ground elevation is limited, thus affecting the accuracy of forest canopy height retrieval. This suggests that the accuracy of GEDI forest canopy height is highly dependent on terrain and vegetation characteristics. The overall trend of RMSE and %RMSE values across sites is similar. However, for sites YELL, CLBJ, and RMNP, although the RMSE values are low, the %RMSE values exceed 50%. These sites have relatively low, sparse vegetation, predominantly composed of coniferous forests, indicating the limited capability of GEDI L2A products to extract forest canopy height in areas with low, sparse vegetation.

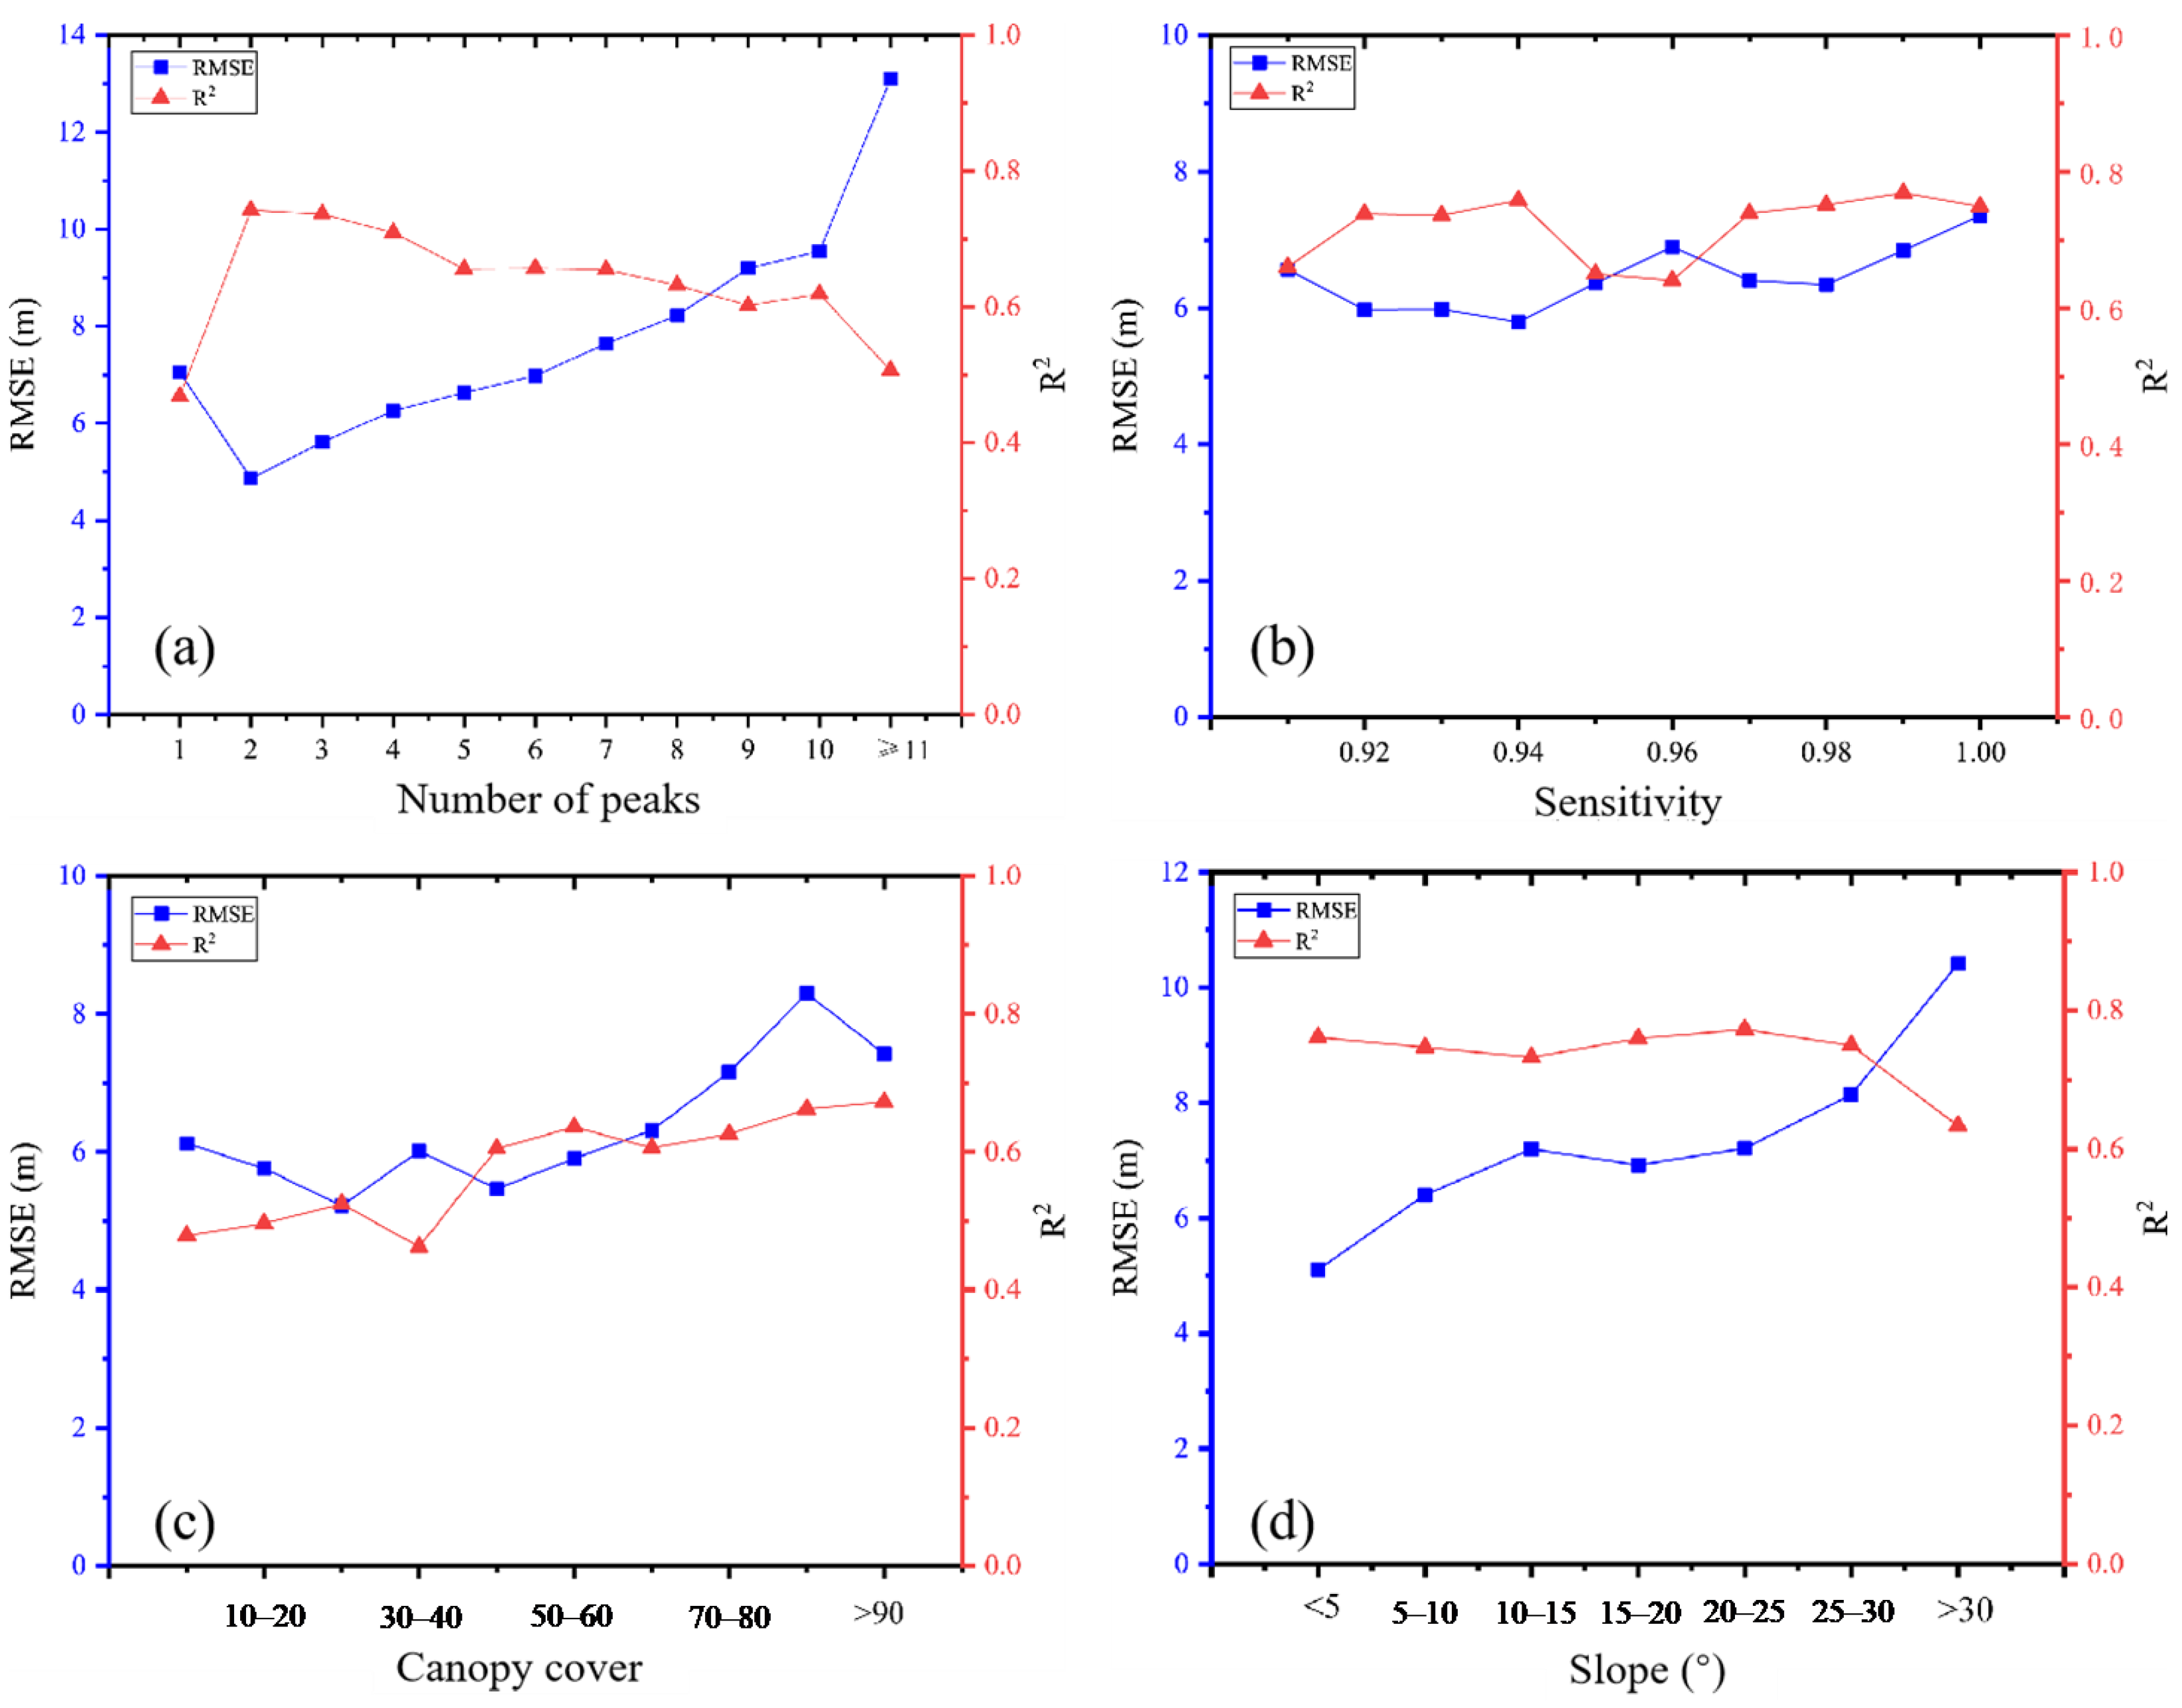
3.3.2. Analysis of Factors Affecting GEDI Performance

Figure 6 illustrates the accuracy of GEDI forest canopy height under different beam types and acquisition time. The RMSE for full power beams and coverage beams are 6.40 m and 6.61 m, respectively, with R2 of 0.76 and 0.71. Both have similar accuracy, but full-power beams exhibit slightly higher accuracy. The reason may be that full-power beams are more likely to penetrate through the canopy and reach the ground, resulting in higher precision in ground elevation extraction and, consequently, higher accuracy in forest canopy height estimation.
Table 4 presents the accuracy statistics of forest canopy height under different conditions of beam types and acquisition time. Data collected during the day generally exhibit lower accuracy compared to data collected at night. Among them, data collected during the day using coverage beams show the lowest accuracy, with an RMSE of 7.35 m. However, there is no significant difference in accuracy for data collected at night, and the beam type does not play a decisive role. The accuracy of data collected at night using coverage beams is slightly higher than that collected using full-power beams, with RMSE values of 5.96 m and 6.13 m, respectively. To ensure quality, GEDI data collected during the day under the coverage beam were subsequently removed.
GEDI footprint data are divided into 11 groups based on the number of peaks: 1; 2; 3; 4; 5; 6; 7; 8; 9; 10; and ≥11. Figure 7a displays the accuracy of forest canopy height estimation under different numbers of peaks. When the number is 2, the retrieval forest canopy height exhibits the highest accuracy, with an RMSE of 4.86 m. As the number exceeds 2, the error in forest canopy height estimation gradually increases. When the number exceeds 11, there is a significant increase in RMSE value. This may be attributed to the complexity of the vertical canopy structure reflected by the number of peaks. The peak number greater than 2 indicates that the laser has penetrated multiple layers of vegetation before reflection. With an increasing peak number, the vertical canopy structure becomes more complex, and reflection interference makes it difficult to determine the exact layer where vegetation height lies, leading to an increased error in forest canopy height estimation. It is worth noting that when the peak number is 1, the RMSE is 7.05 m. Compared to the peak number of 2, the error shows an increasing trend. This may be related to vegetation coverage and terrain complexity. The peak number of 1 indicates that there is only one reflection peak in the waveform, suggesting that the vegetation coverage in that area is low or the forest canopy height is too low to distinguish the canopy signal from the ground signal, both of which could lead to an increase in estimation error. Overall, there is a strong correlation, and R2 shows a trend of increasing followed by decreasing. Therefore, to ensure the accuracy of forest canopy height estimation, subsequent selection of GEDI footprint data with the number of peaks between 2 and 11 is recommended.
The sensitivity of the beam refers to the maximum canopy cover that a beam can penetrate, considering the signal-to-noise ratio of the waveform. It is a measure related to canopy cover and signal-to-noise ratio, indicating whether the waveform has sufficient energy to penetrate the canopy and reach the ground. During pre-processing, only footprints with a sensitivity greater than 0.9 are retained. Therefore, based on sensitivity values, the data are divided into 10 groups with intervals of 0.01, ranging from [0.90, 0.91) to [0.99, 1.00]. The error of forest canopy height estimation for each group was analyzed. As shown in Figure 7b, there is a strong correlation overall. With an increase in sensitivity value, the RMSE exhibits a fluctuating upward trend, suggesting that higher sensitivity does not always result in greater accuracy. This may be because sensitivity is positively correlated with penetration, increasing the probability of multiple scattering and thereby reducing accuracy;
Canopy cover is divided into 10 groups with intervals of 10%. Figure 7c illustrates the accuracy under different canopy covers. Overall, as canopy cover increases, the RMSE shows a trend of initially decreasing and then increasing, albeit with slight fluctuations. When the canopy cover is between 20% and 30%, the RMSE reaches its minimum value of 5.22 m. In areas with lower vegetation cover, laser beams may potentially miss the top of the canopy, leading to estimation error. Conversely, in areas with higher vegetation cover, laser beams are more likely to be obstructed by the canopy, making it difficult to penetrate through to the ground; terrain complexity is a crucial factor affecting the retrieval of forest canopy height. Terrain slope values are divided into seven groups with intervals of 5°. The RMSE values are calculated for each group, as shown in Figure 7d. In general, regions with flat terrain exhibit higher accuracy in forest canopy height estimation. Initially, the RMSE shows a slow increase with slope increase, which is consistent with findings from previous studies [10]. However, when the slope exceeds 30°, there is a significant increase in RMSE values. In steep terrain areas, ground signals may broaden, leading to overlap with canopy signals, which can impact the accuracy of canopy height estimation. Furthermore, the geographic positioning error of the GEDI footprint has a more pronounced impact in regions with steeper slopes, resulting in heightened errors in forest canopy height estimation;
Table 5 presents the accuracy of forest canopy height estimation across different forest types. There is no significant difference in accuracy between deciduous forests and mixed forests, with RMSE of 5.69 m and 5.75 m, respectively. However, the accuracy of evergreen forests is significantly lower than that of the other two types (RMSE = 7.33 m). In evergreen forests, the laser beam may be reflected and scattered multiple times due to the dense distribution of tree leaves and branches, which may lead to signal attenuation and distortion, ultimately increasing the estimation errors. In contrast, the distribution of leaves in deciduous and mixed forests is relatively sparse, allowing for more laser energy to penetrate the canopy and reach the ground.

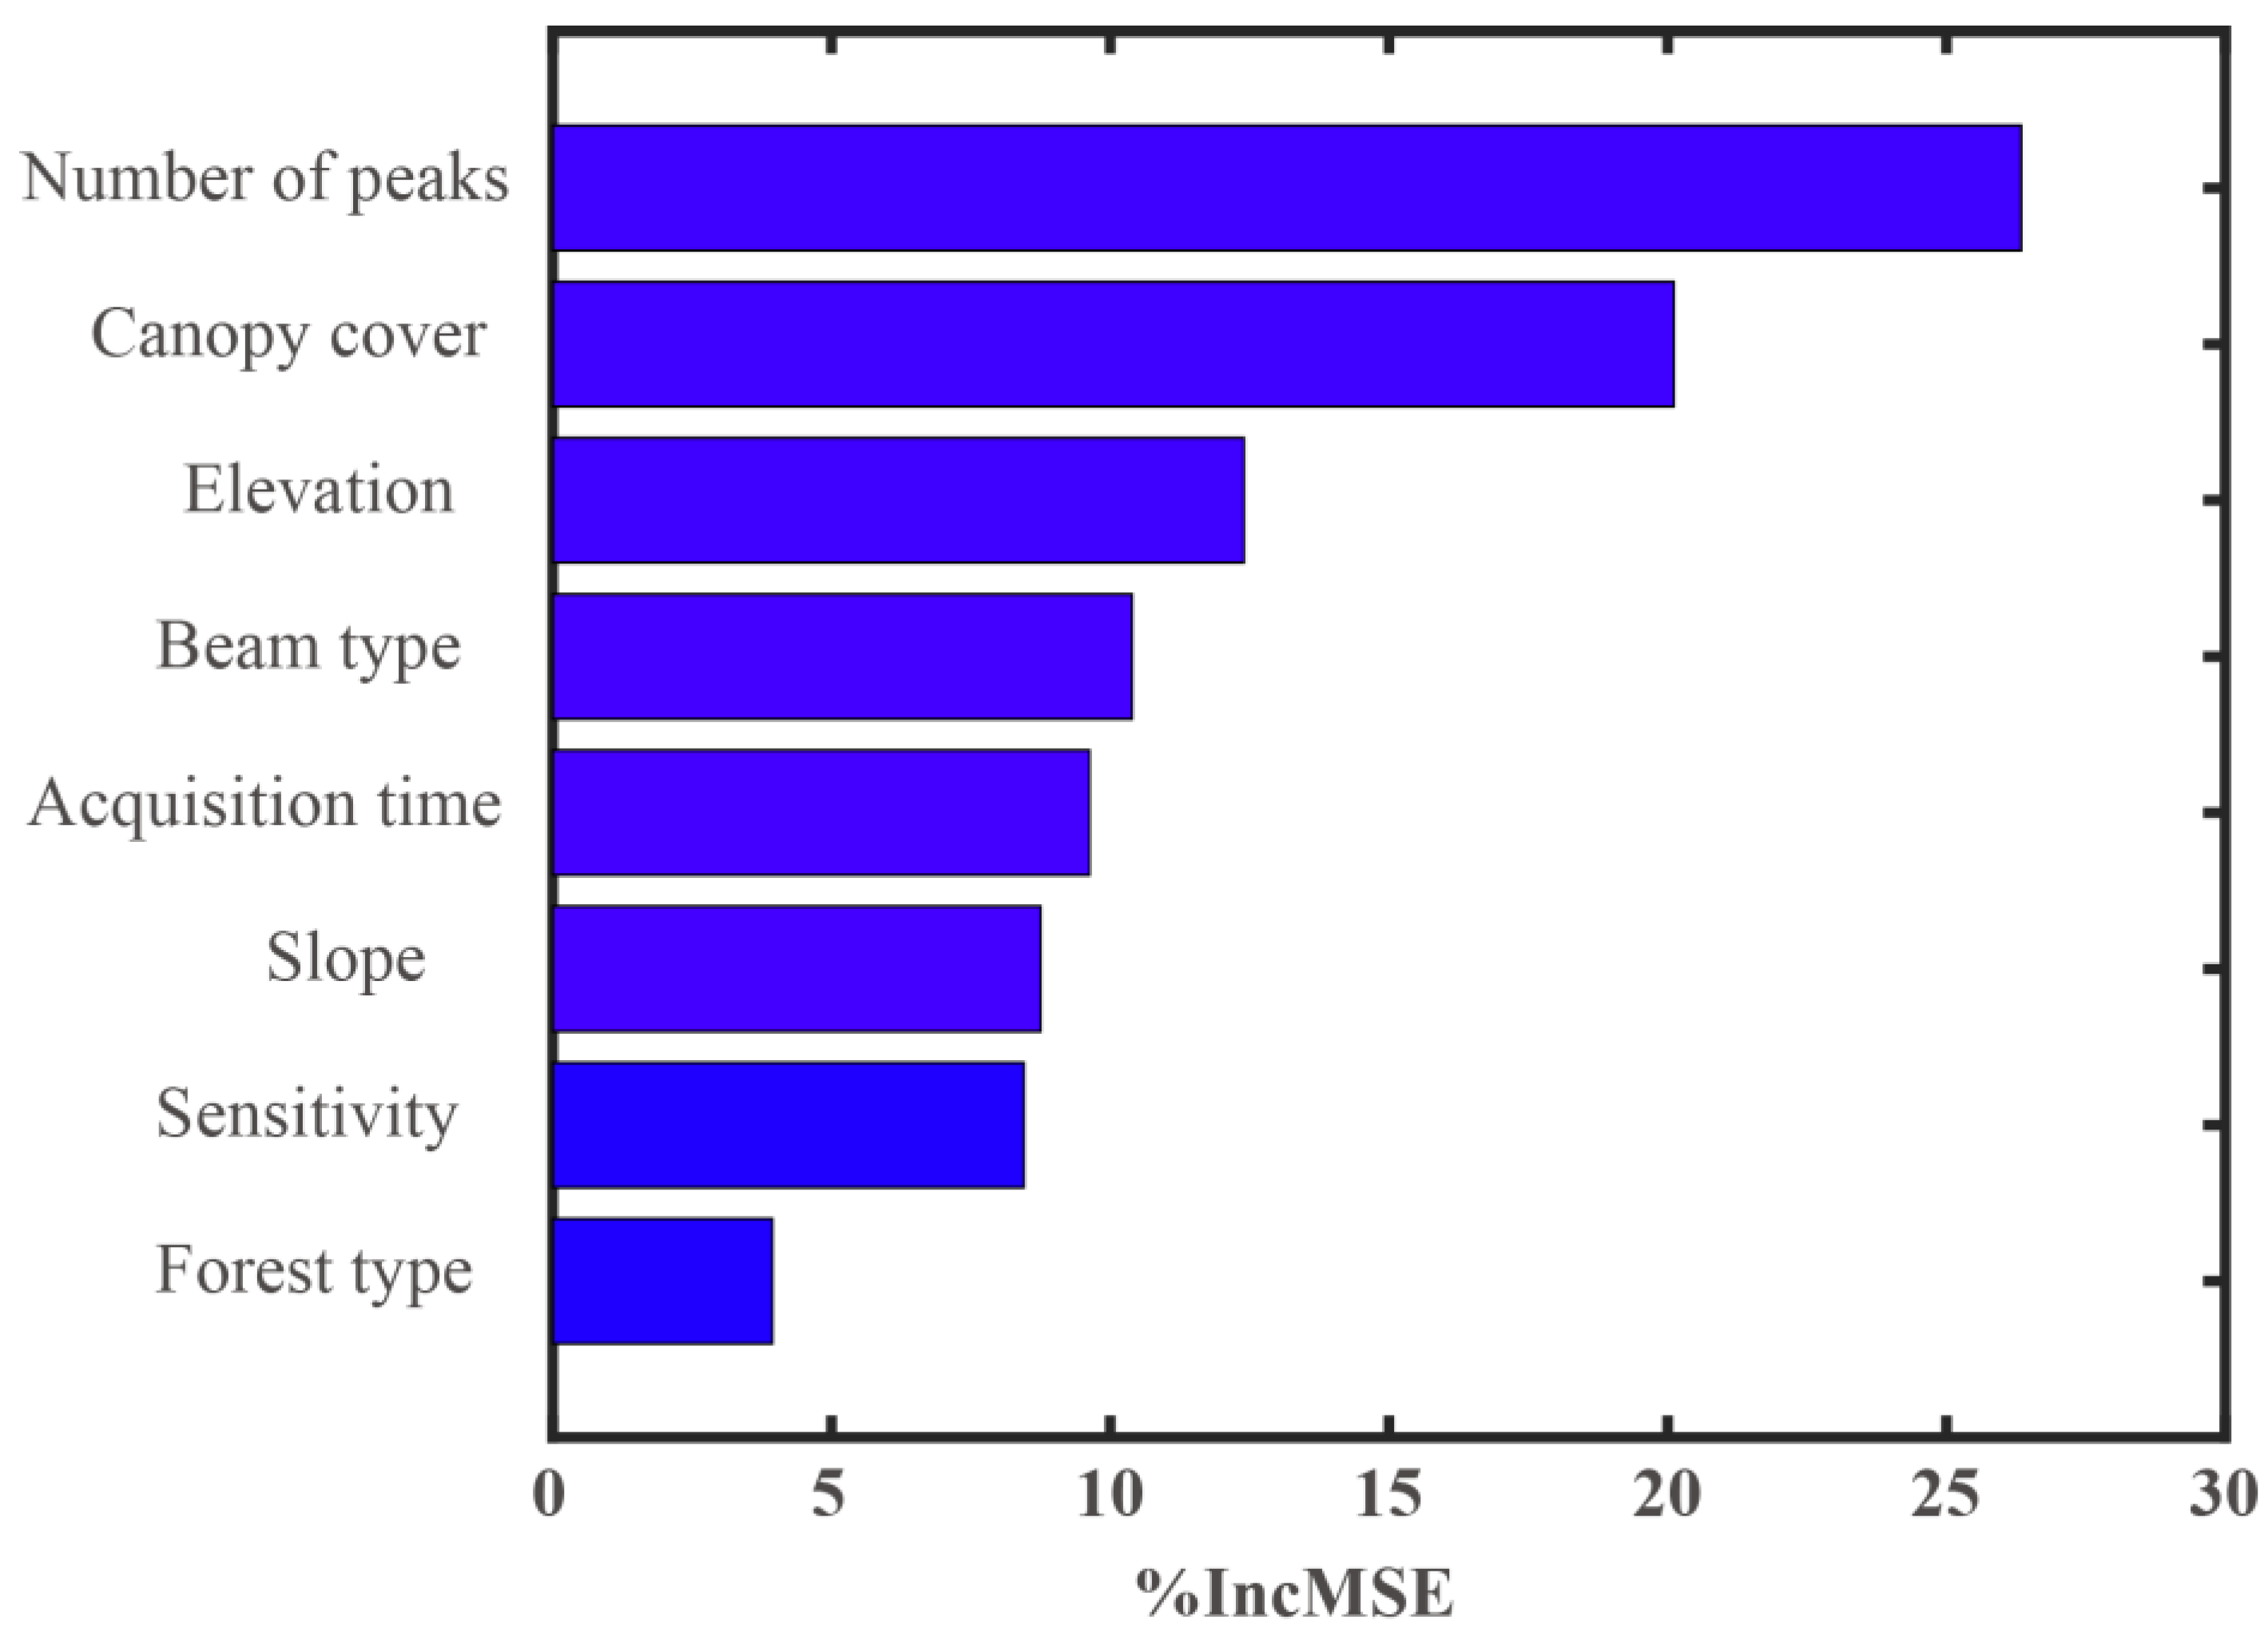
3.3.3. Importance of Error Factors

Figure 8 illustrates the importance of error factors affecting the accuracy. Among them, the factors with the highest ranking are the number of peaks and canopy cover, significantly higher than the others, explaining 46% of the difference between GEDI and the reference forest canopy height. These two factors reflect the vertical canopy structure, indicating that the complexity of the canopy structure is the most important factor influencing the accuracy of forest canopy height retrieval. Beam type, sensitivity, elevation, and acquisition time are similar and important. Compared to large-footprint LiDAR, the impact of terrain on forest canopy height estimation accuracy is relatively reduced. Wang et al. also found that the slope has little effect on the accuracy of GEDI forest heights [11]. Forest type is the least influential factor.

4. Accuracy Improvement

4.1. Methodology

4.1.1. Criteria for Selecting High-Quality GEDI Footprints

To select high-quality GEDI footprints and improve the accuracy of forest canopy height estimation, combinations of influencing factors were used for footprint selection. The importance analysis indicates that the number of peaks has a significant impact, which is consistent with Wang et al. [11]. When it exceeds 11, the accuracy of forest canopy height estimation significantly decreases. Therefore, only footprints with a peak number less than or equal to 10 were retained. Although beam type and acquisition time do not play a decisive role in forest canopy height retrieval, the accuracy is lower for coverage beams collected during the daytime. Therefore, to ensure data accuracy, footprints collected under these conditions would be removed. Figure 9 and Table 6 show the accuracy comparisons before and after filtering. Through footprint filtering, the number of GEDI footprints has been reduced to 43,377, representing a decrease of 37.17%. The difference in R2 is not significant, with the RMSE decreasing from 6.49 m to 5.60 m, resulting in an improvement in accuracy of 0.89 m. It can be observed from Figure 9 that there are many underestimated forest heights before we select high-quality GEDI footprints, which is consistent with Liu et al. [10]. These underestimated forest heights may be caused by steep topography. After we selected high-quality GEDI footprints, many underestimated forest heights were removed.

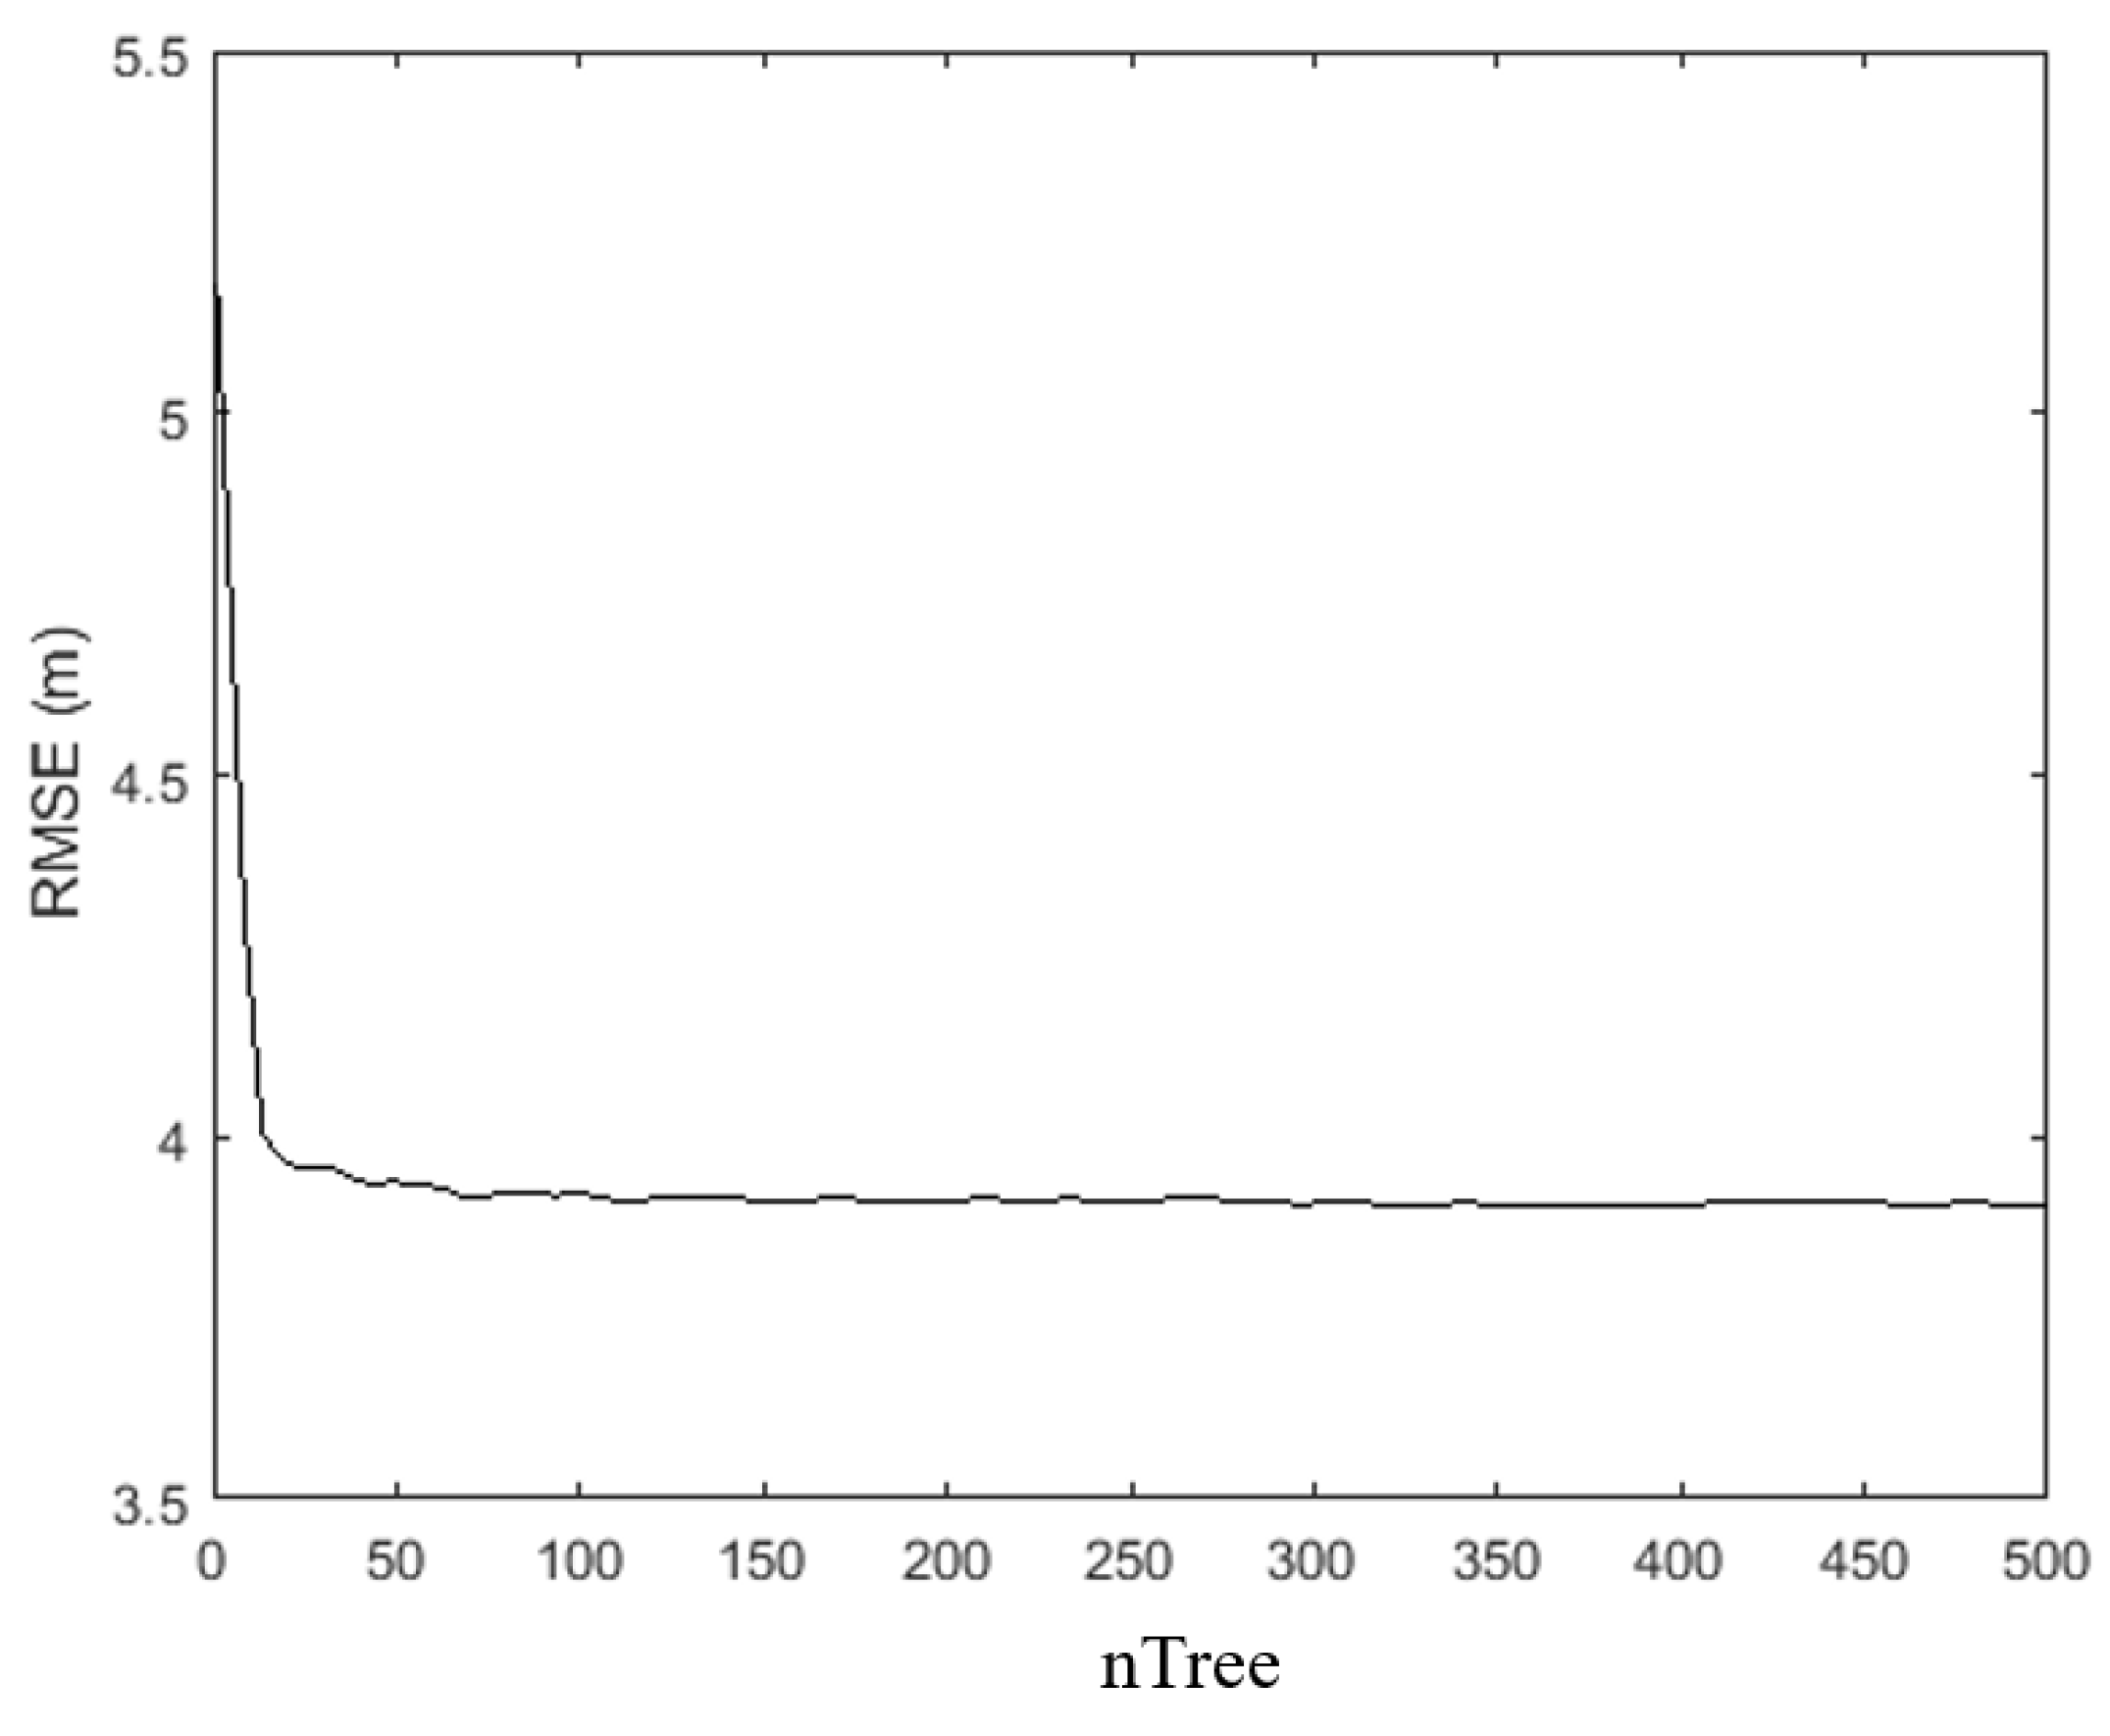
4.1.2. Error Correction Model Based on Random Forest

The interaction between GEDI signals and canopy and ground is quite complex. Although high-quality footprints are selected in the previous step, some errors still exist in the retrieval of forest canopy height in GEDI L2A products. Some research has made progress in improving the accuracy of LiDAR-derived forest canopy height. Correction methods based on machine learning have overcome the limitations of physical geometric models and statistical regression models. Machine learning methods can establish robust error correction models that are adaptable to relationships between various factors that are difficult to define clearly. Therefore, we chose the RF algorithm, which is easy to use, highly nonlinear, and robust to outliers in training data, to establish a forest canopy height error prediction model [28]. The core idea of the RF algorithm is to create an ensemble of decision trees, each trained on a random subset of the dataset. By aggregating the predictions of multiple trees, random forest can reduce overfitting, improve prediction accuracy, and ultimately achieve high-precision forest canopy height estimation. Based on the importance analysis of each factor, the top 80% of factors were selected as the initial feature parameters for model training. The RF algorithm captures complex relationships between predictor variables and response variables by generating a large number of decision trees to improve prediction accuracy and control overfitting. During the training process, two main parameters need to be adjusted: the number of decision trees and the tree depth. More trees generally lead to better performance because they reduce overfitting by averaging out the predictions from all trees. However, too many trees can lead to longer training times and increased computational costs. By adjusting the number of decision trees, we can determine the optimal number of trees that minimize the model error. The tree depth, which represents the maximum number of variables considered when building the optimal random forest decision tree model, controls the maximum depth of each tree. This parameter is usually set to the square root of the number of available features. The difference between GEDI forest canopy height and the corresponding NEON canopy height is used as the response variable, while the selected factors are used as the prediction variables to train the optimal error prediction model. Figure 10 displays the flowchart of the method.

4.2. Results and Discussion

Figure 11 illustrates the model error variation with the change in the number of decision trees. It can be observed that when the number of decision trees is small, the model error varies greatly. When the number of decision trees exceeds 25, the error decreases, and when it surpasses 100, the error tends to stabilize. To ensure model accuracy while improving computational efficiency, the number of decision trees was set to 100, and the tree depth was set to the square root of the number of available factors.
Figure 12 and Table 7 display scatter plots and accuracy statistics before and after correction. Before correction, the RMSE is 5.60 m, with an R2 of 0.75. After correction, the error in forest canopy height is significantly reduced, with R2 improving to 0.91 and RMSE decreasing to 4.19 m. The accuracy improves by 25.18%, and the mean absolute error decreases from 3.83 m to 3.18 m. It can be seen that both the overestimation and underestimation have been corrected to a certain extent. Overall, the error correction model based on the RF algorithm can effectively reduce the influence of error factors on forest canopy height retrieval, resulting in good consistency between the model calibration results and validation data.
To verify whether the error correction model is overfitted to specific training areas, NEON site data were retained as validation data each time, while the others were used for model training, resulting in the training of 19 random forest models. Figure 13 shows the accuracy validation results of each model. The RMSE in each validation area is reduced to some degree. The overall RMSE decreased from 6.54 m to 4.52 m, with an accuracy improvement of 30.88%. Additionally, the R2 increased from 0.63 to 0.77. The result indicates that the correction model constructed by the RF algorithm did not overfit specific training areas, exhibiting good robustness and generalization ability.

5. Conclusions

High-accuracy forest height is important essential data for forest management and carbon sequestration research. The GEDI can provide a large number of forest height and vertical structure parameters for global forest management and forest carbon sink research. The accuracy of forest canopy height estimation from GEDI is influenced by various factors. In this study, we evaluated the accuracy of the GEDI L2A forest canopy height product and explored the mechanisms of various factors affecting its accuracy. Based on this, a comprehensive error correction model considering multiple error factors was constructed using the random forest algorithm. We found the following:
(1)
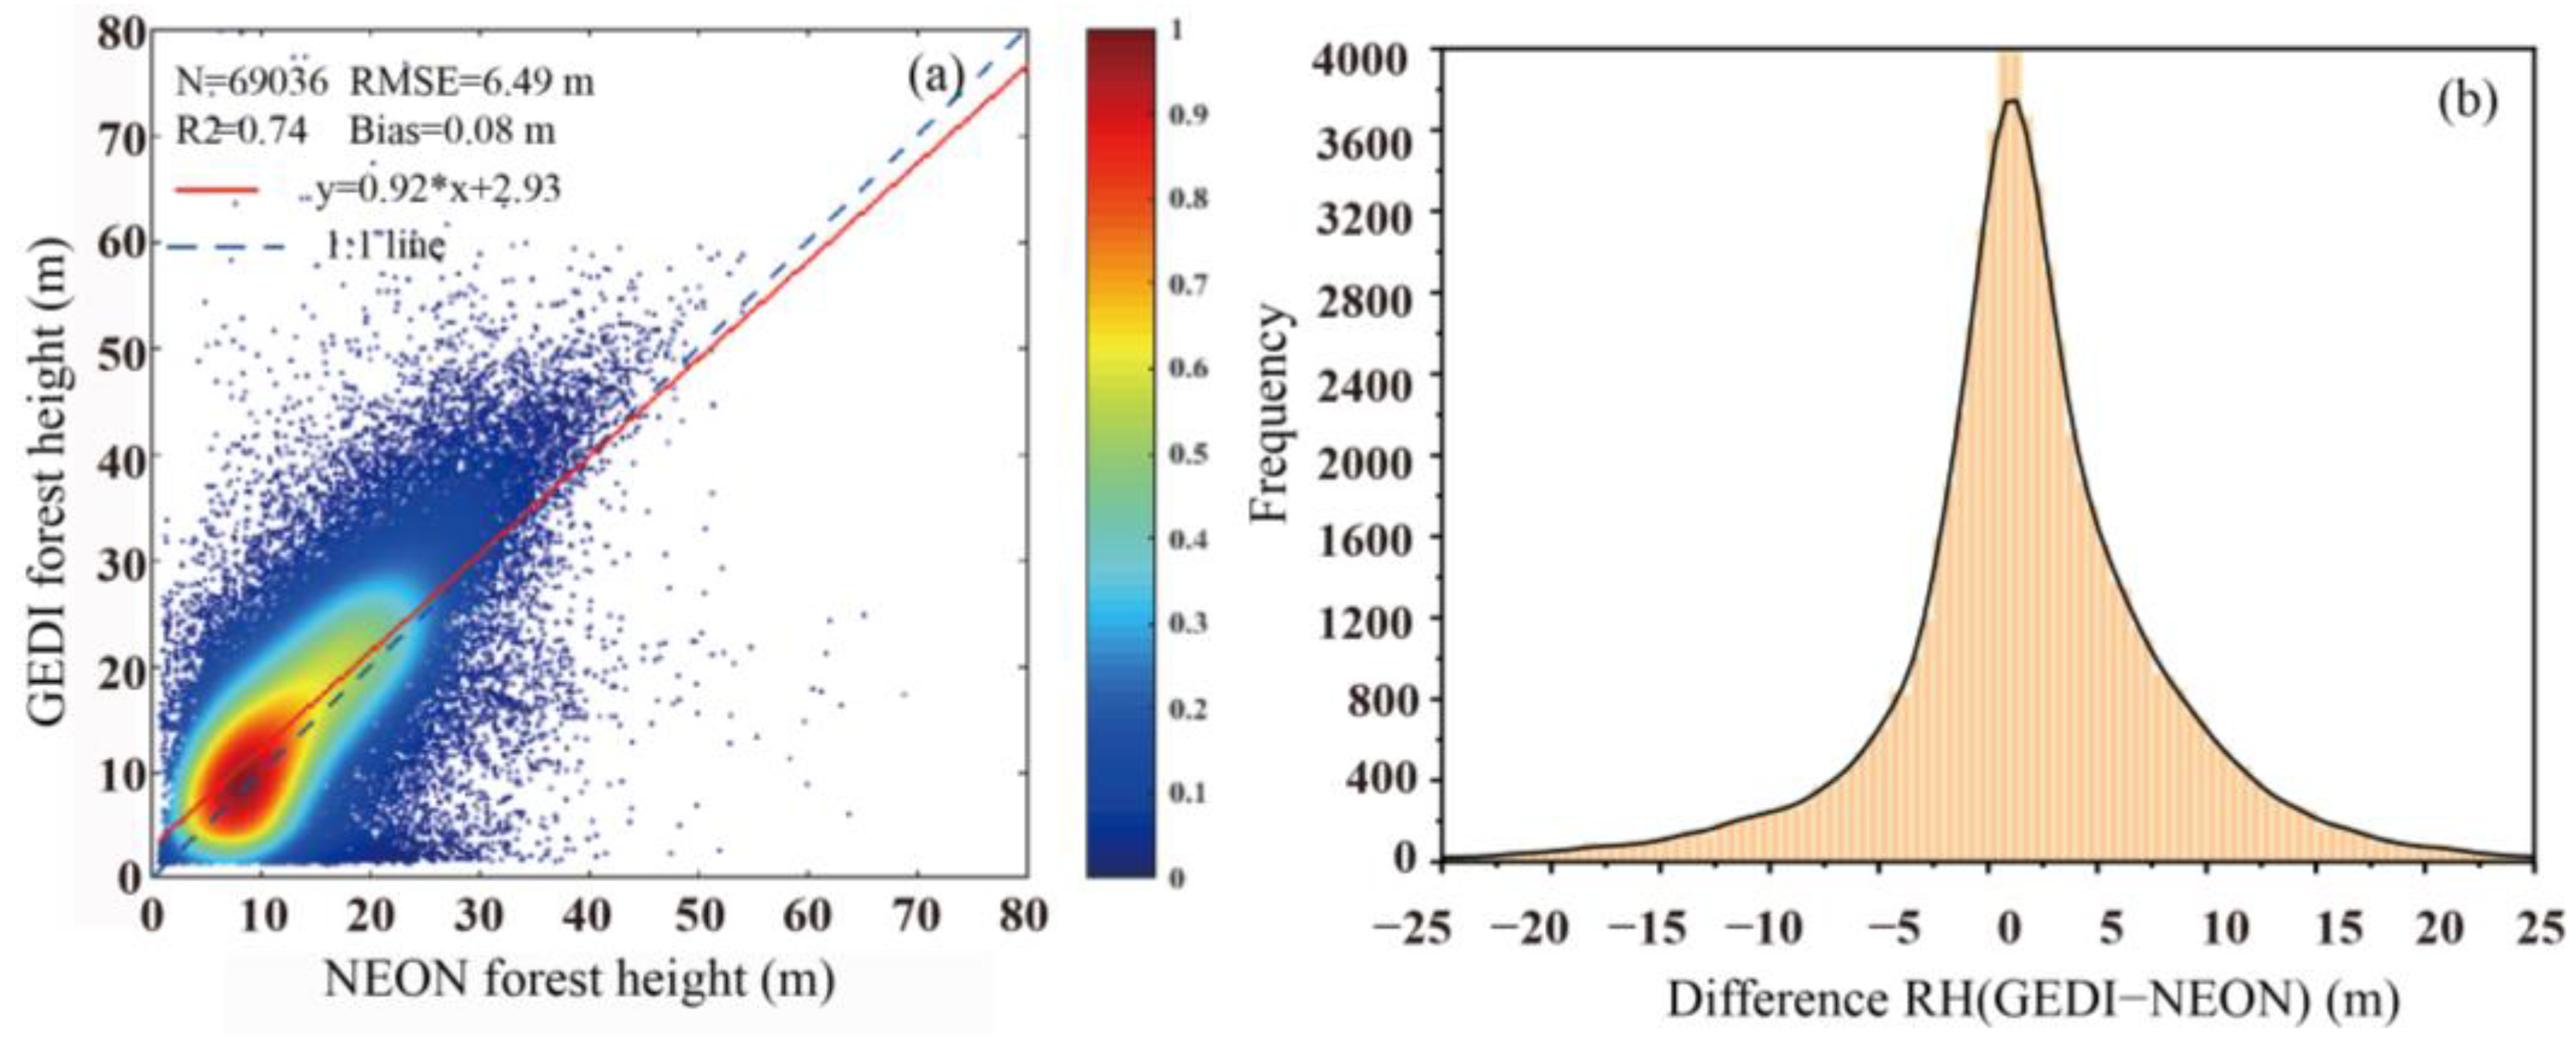
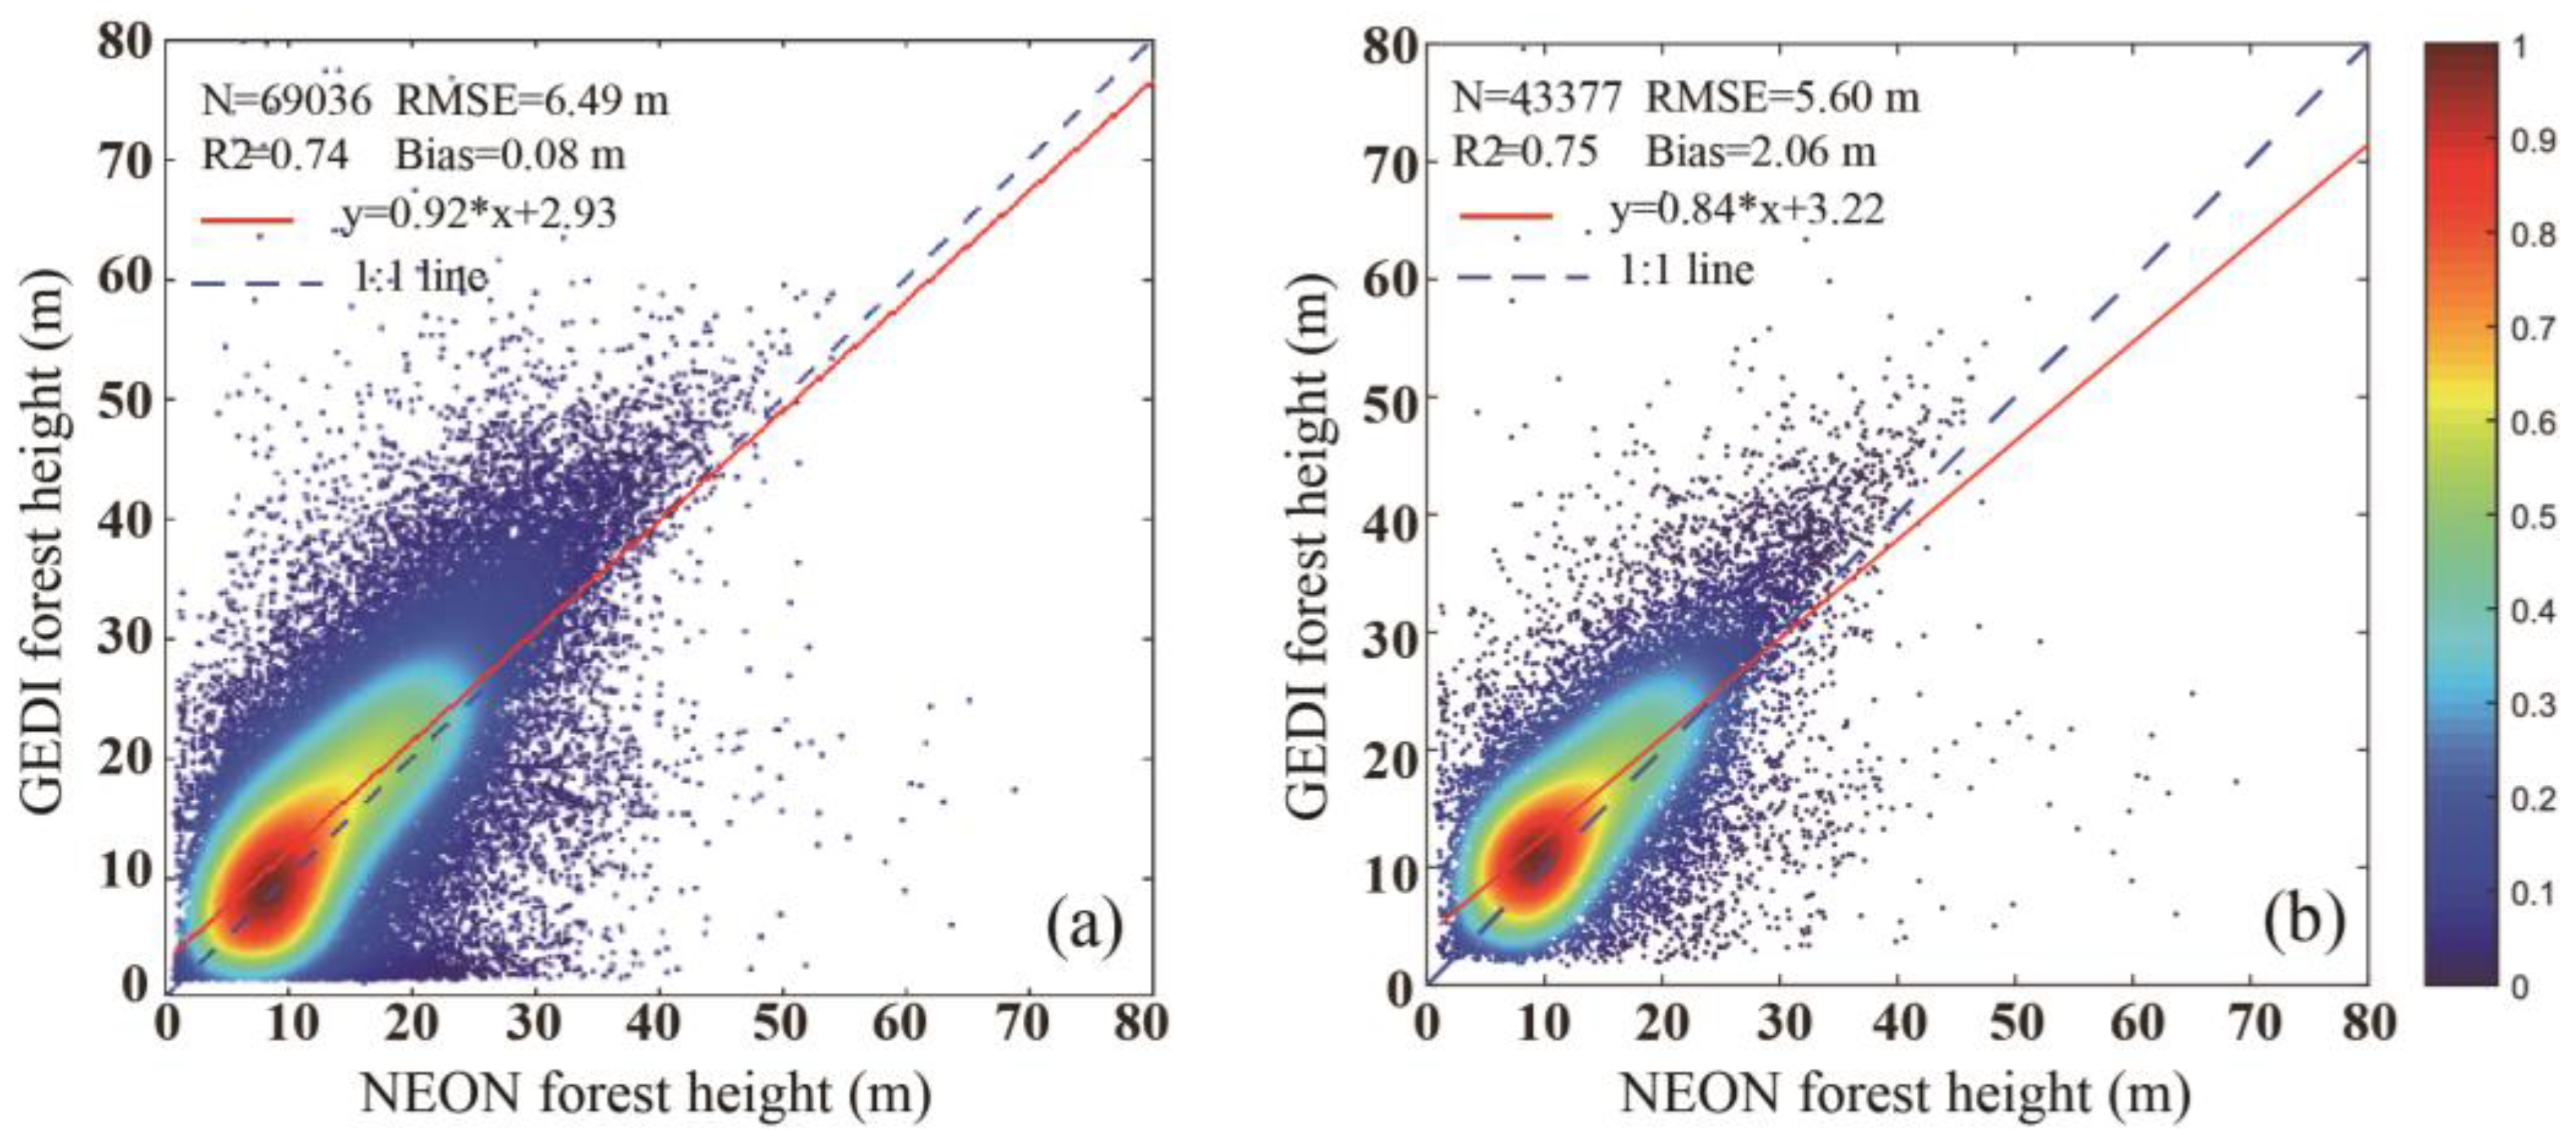
A relatively high correlation was found between the GEDI forest canopy height estimation and the reference CHM, with an R2 value of 0.74 and an RMSE of 6.49 m;
(2)
The potential error factors with the highest importance are the number of peaks and canopy cover, significantly higher than the others, explaining 46% of the difference between GEDI and the reference forest canopy height;
(3)
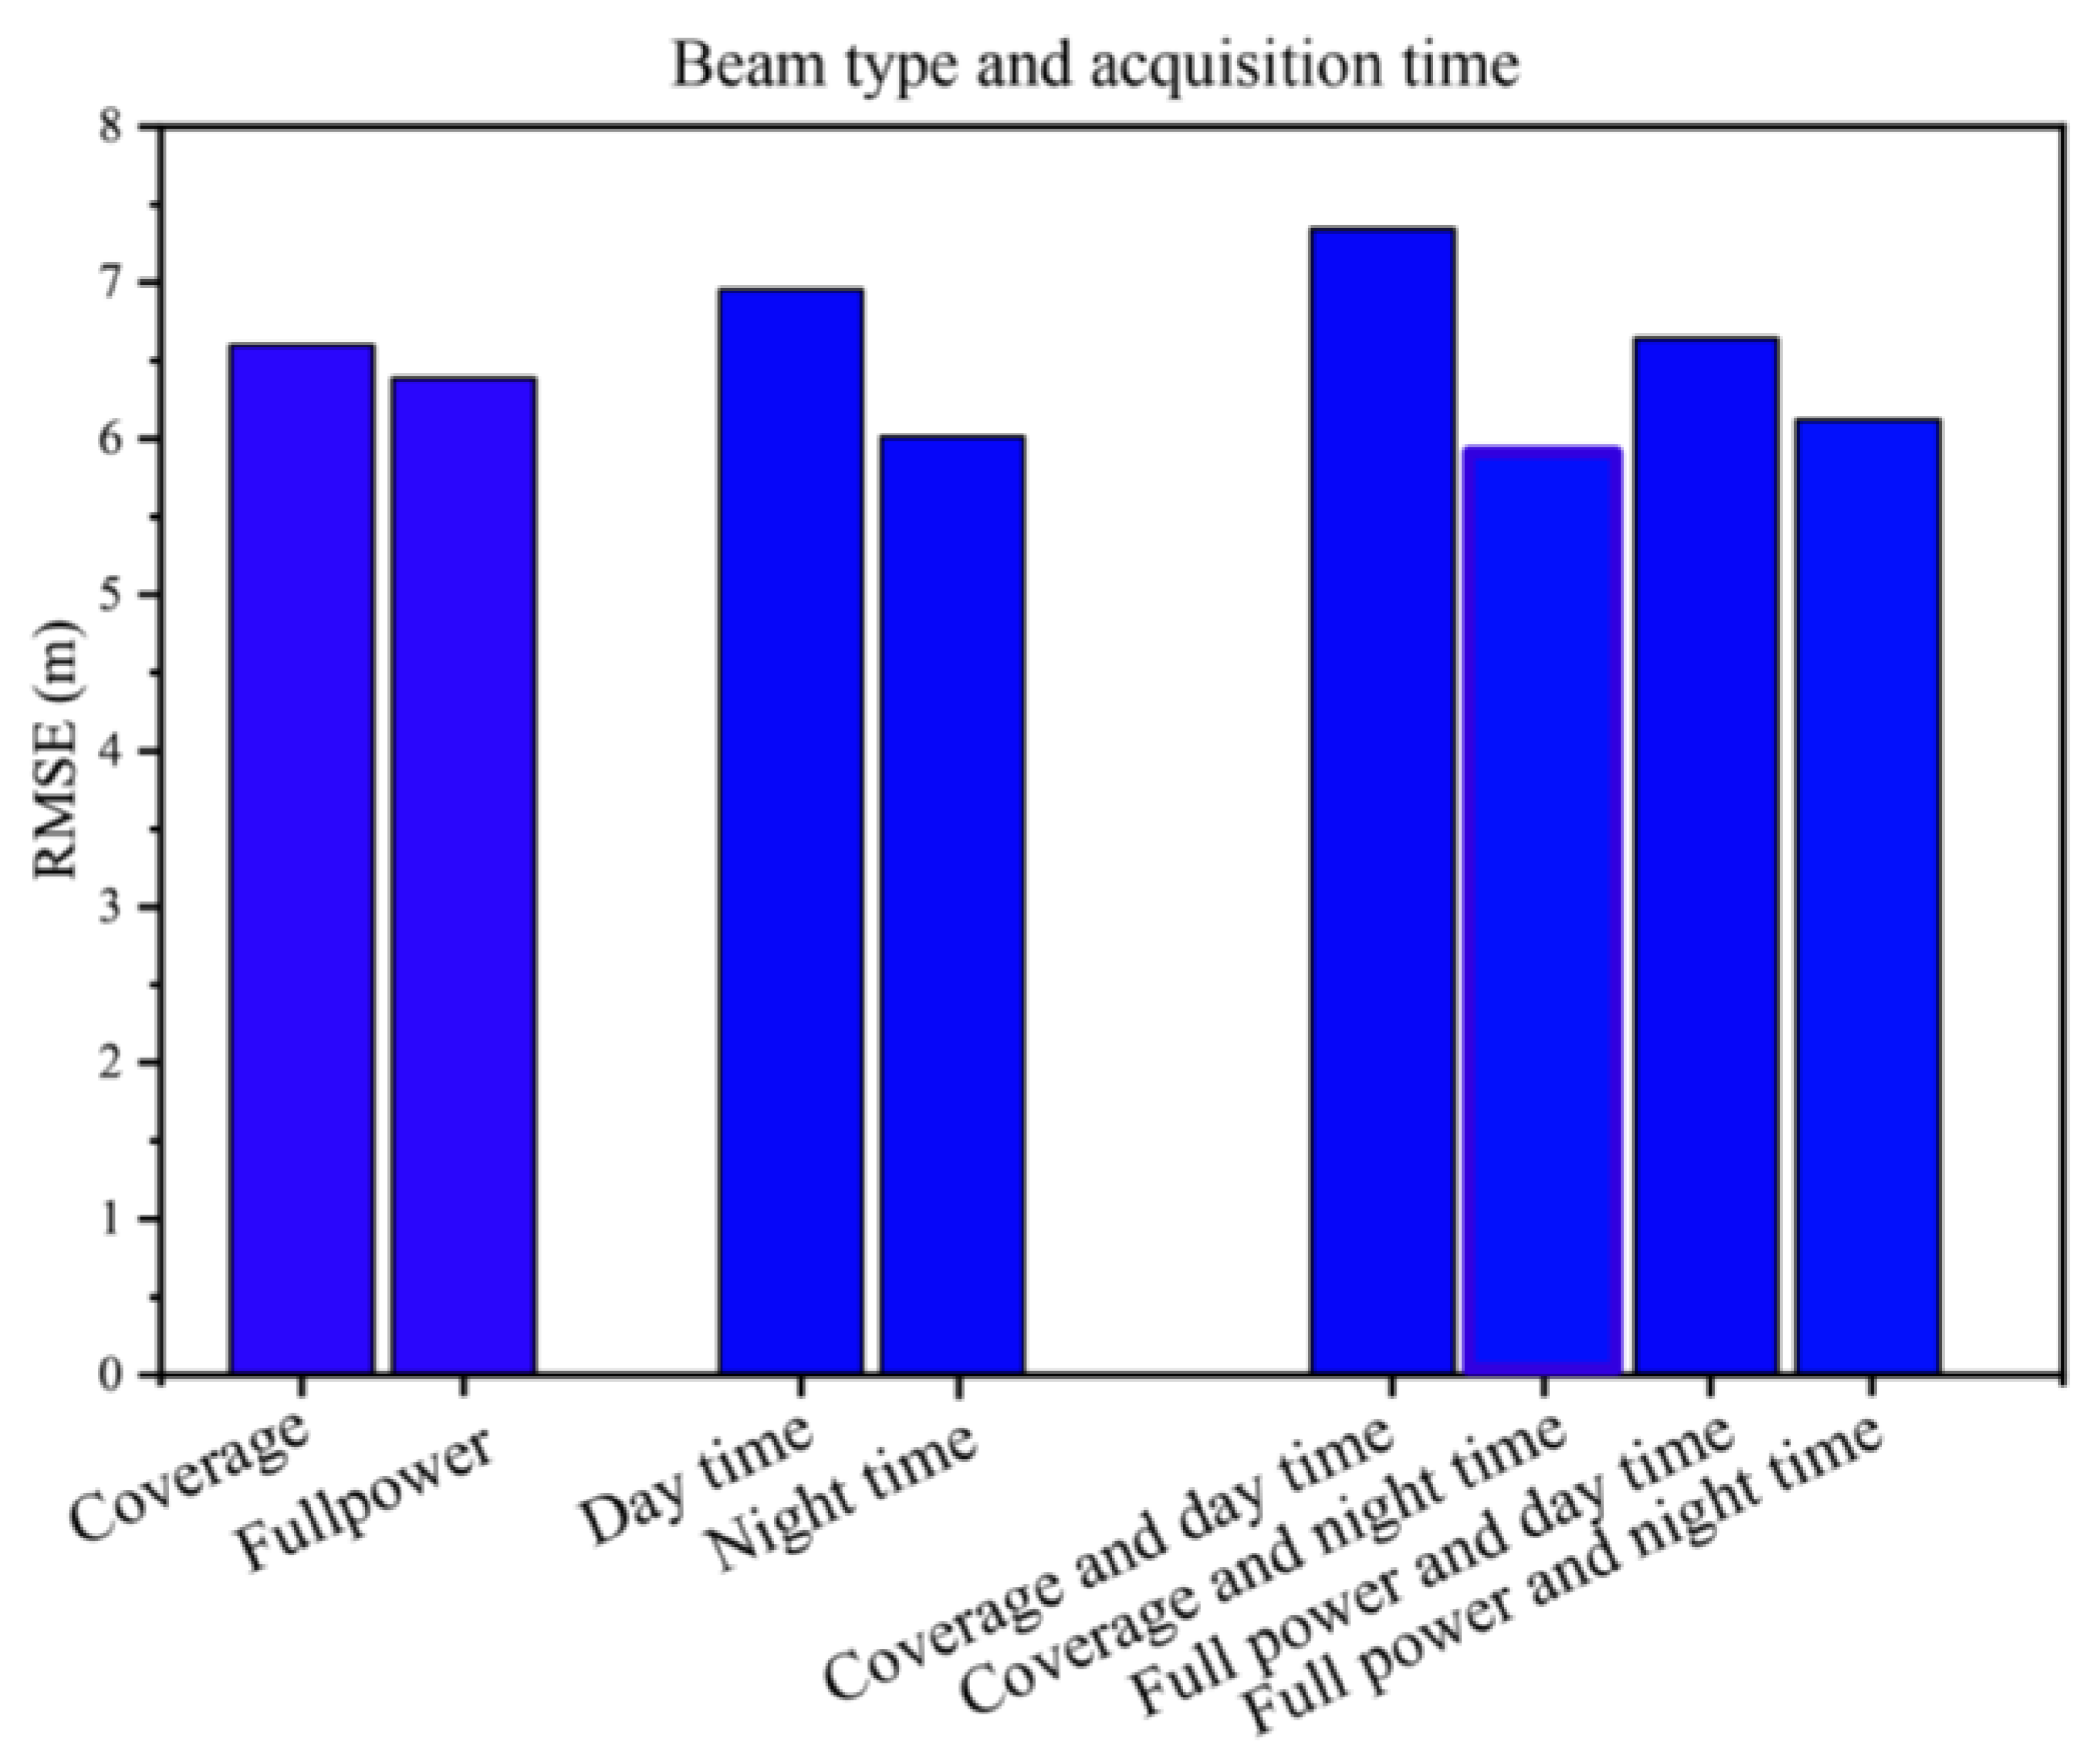
GEDI footprints with a peak number less than or equal to 10 obtained by full power beam during nighttime are recommended when retrieving forest canopy height;
(4)
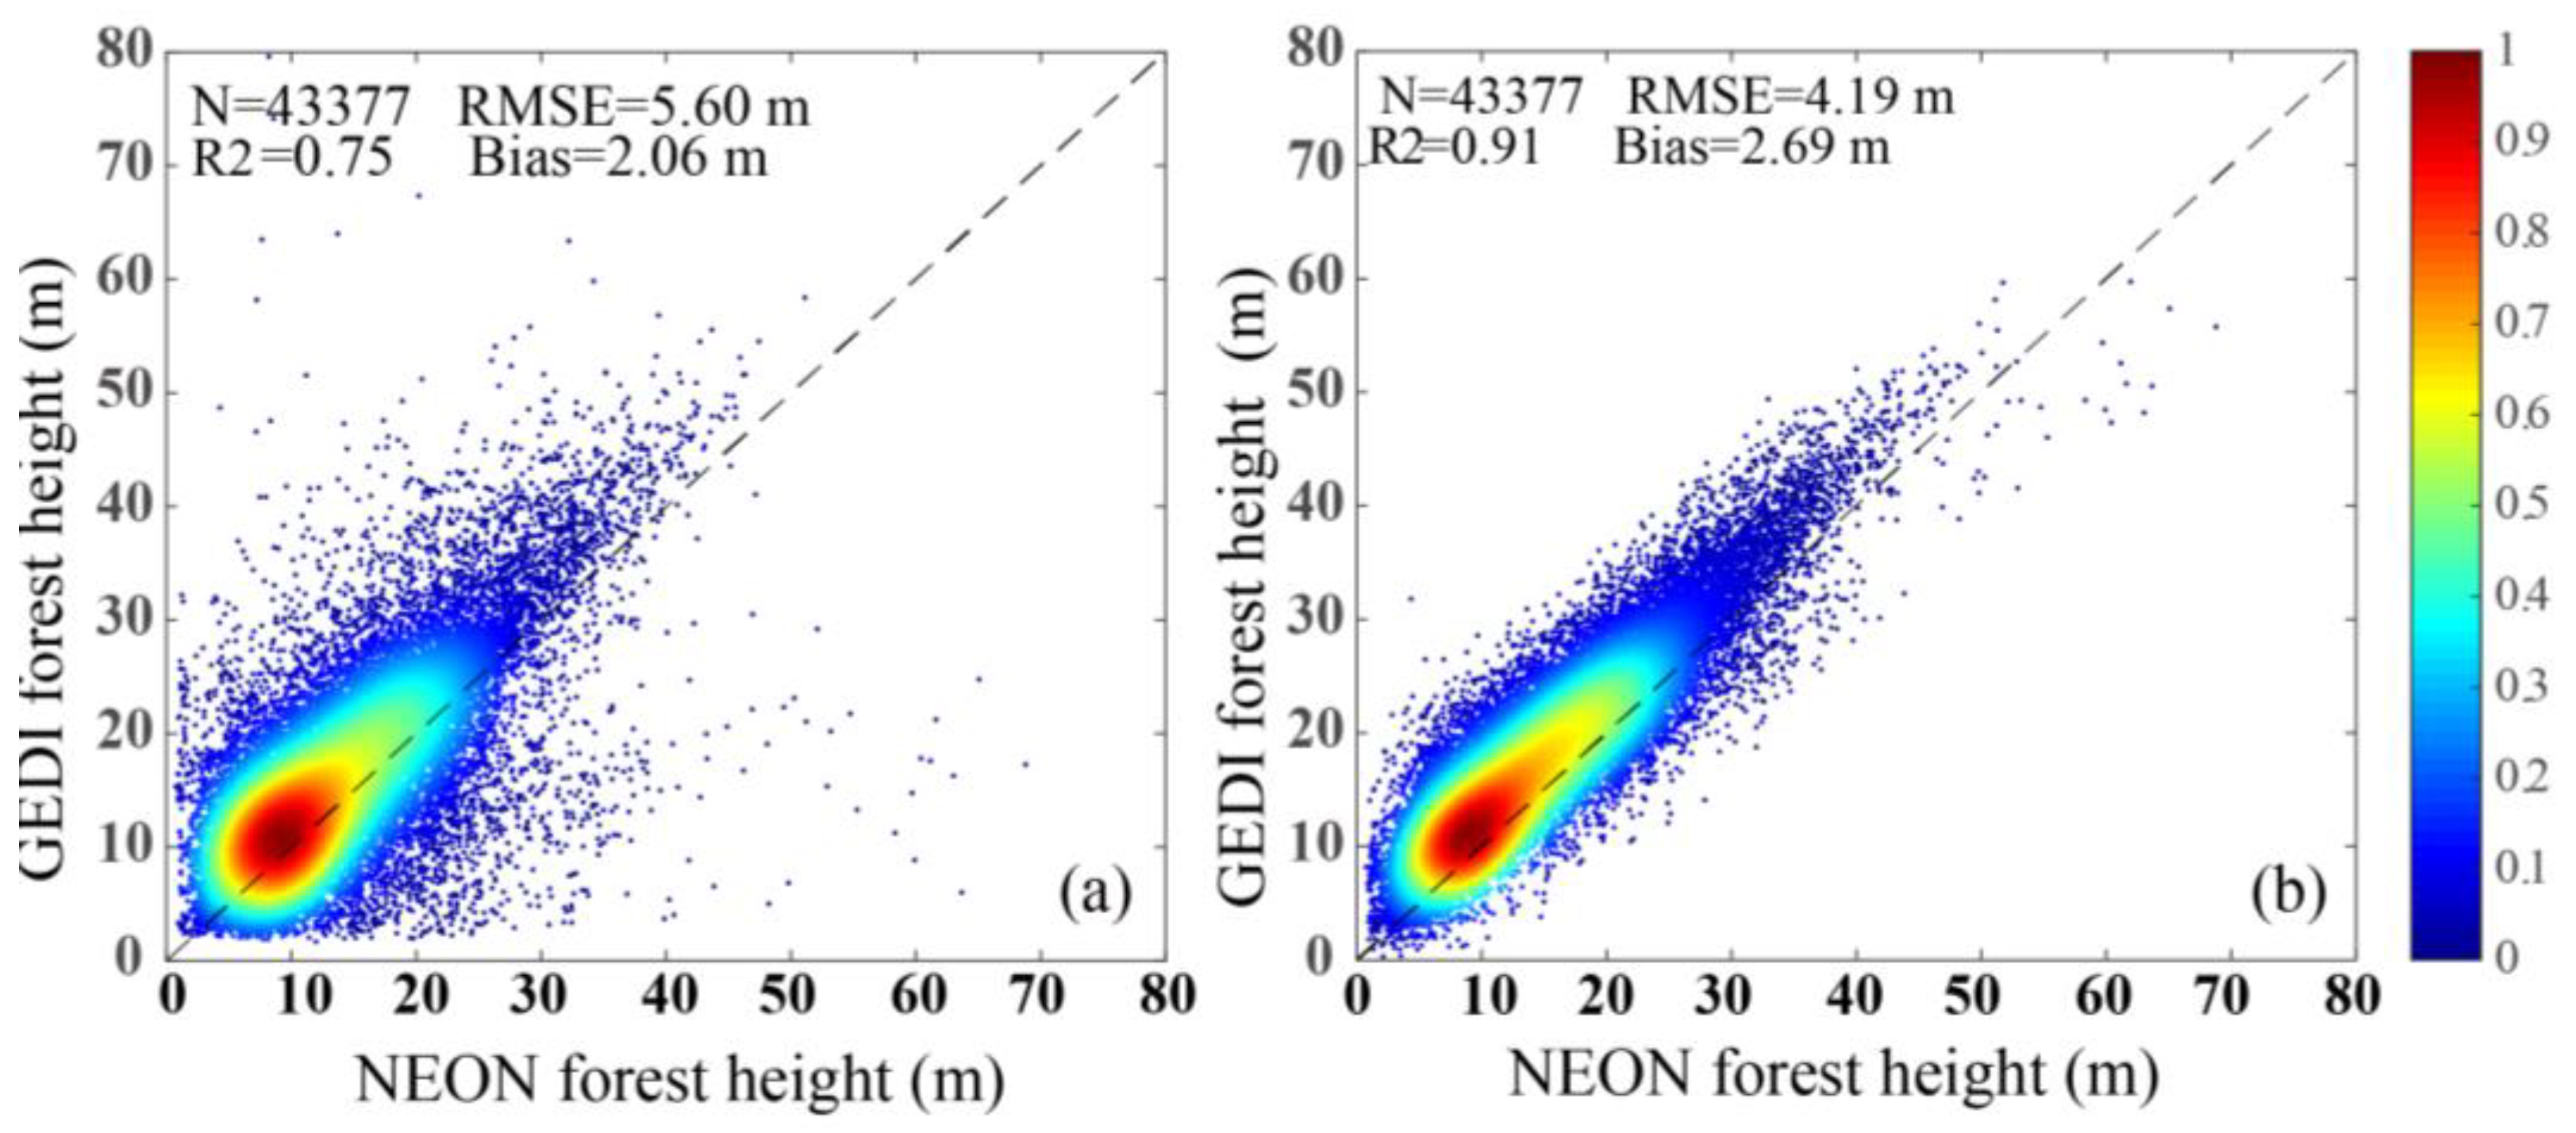
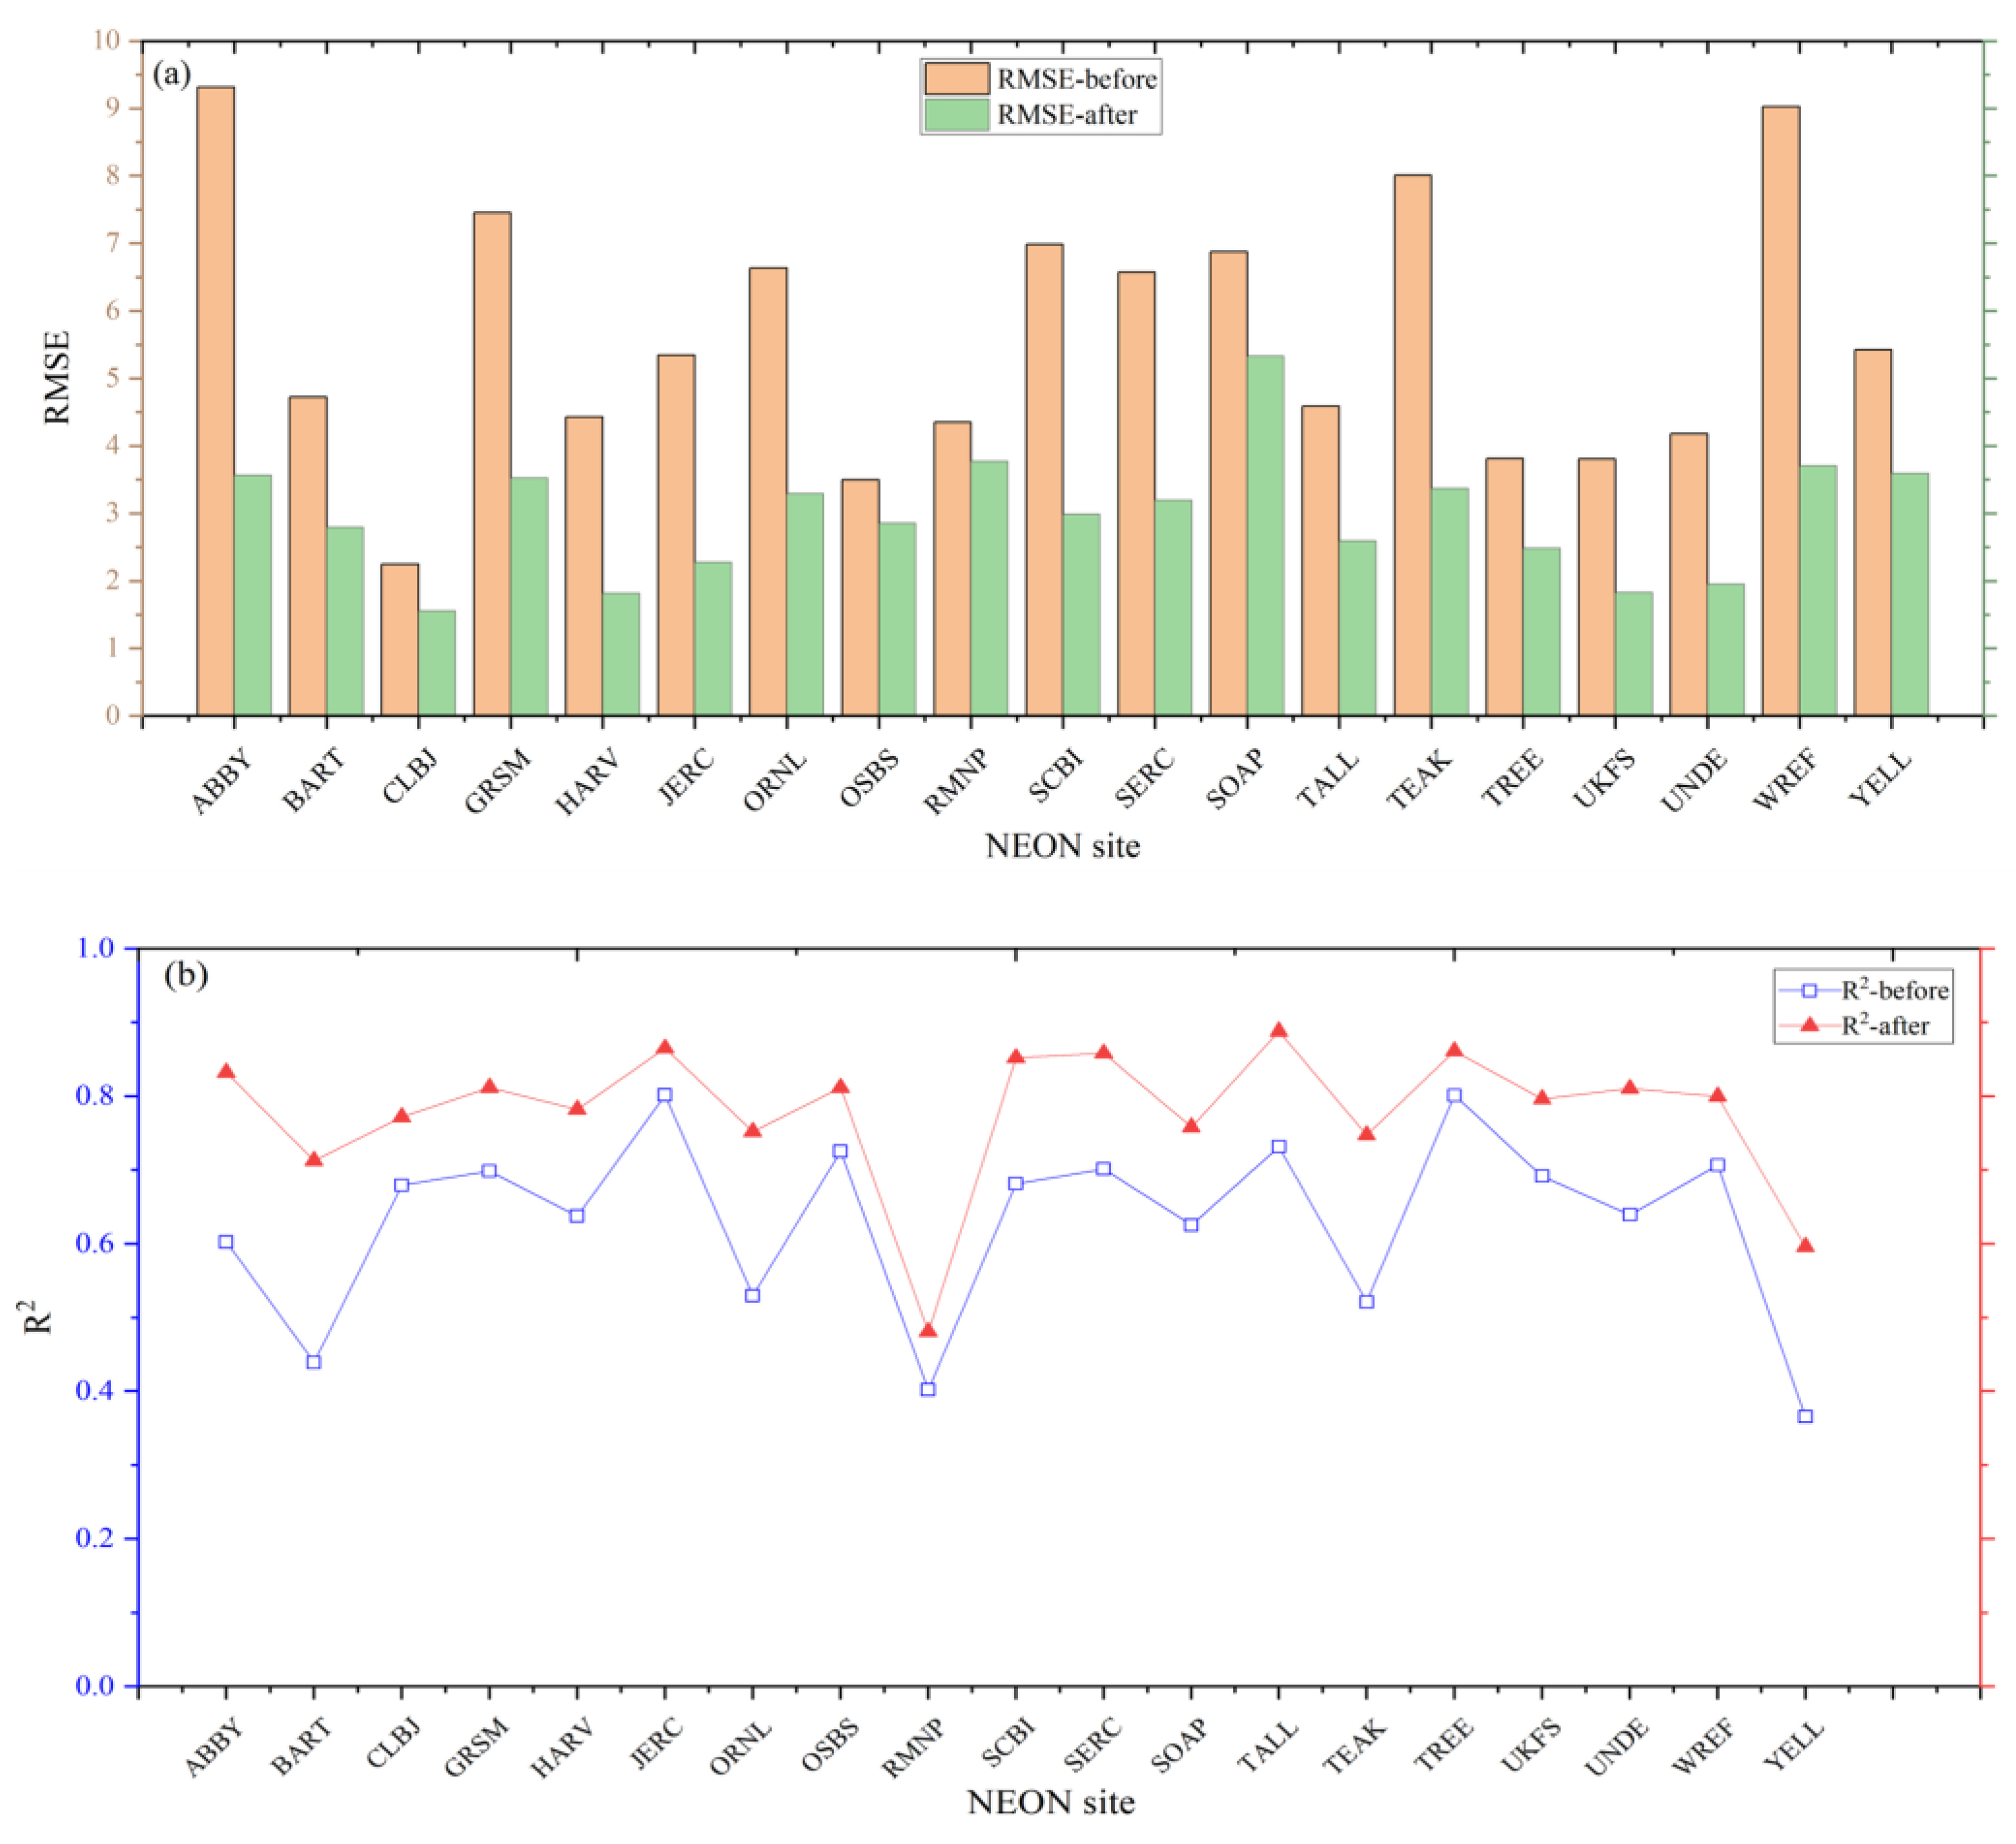
The error correction model based on the RF algorithm can effectively reduce the influence of error factors on forest canopy height retrieval, with RMSE decreasing from 5.60 m to 4.19 m, improving accuracy by 25.18%, and the model demonstrates good geographical generalization ability.
These findings are expected to provide practical guidance on the use of GEDI for forest structure estimations. Using the proposed method in this study, we will improve the accuracy of GEDI forest height data on a global scale and provide important data support for subsequent forest biomass mapping and forest carbon sink research.

Author Contributions

Conceptualization, Y.L. and S.G.; methodology, Y.L.; software, S.G.; validation, S.G., H.F., and J.Z.; formal analysis, S.G., and H.F.; investigation, S.G., and J.Z.; resources, S.G., H.F., and J.Z.; data curation, Q.H., H.F., and J.Z.; writing—original draft preparation, Y.L. and Q.H.; writing—review and editing, H.F., J.Z., D.Z., and Y.W.; visualization, D.Z.; supervision, J.Z.; project administration, S.G., H.F., and J.Z.; funding acquisition, S.G., H.F., and J.Z. All authors have read and agreed to the published version of the manuscript.

Funding

This research was supported in part by the National Natural Science Foundation of China (Grant No. 62207032, 42030112, and 165990104) and the Research Foundation of the Department of Natural Resources of Hunan Province (Grant No. HBZ20240101).

Data Availability Statement

All remote sensing data used in this study are openly and freely available. GEDI L2A data can be downloaded at https://e4ftl01.cr.usgs.gov/GEDI/ (accessed on 10 March 2023). NEON LiDAR products can be downloaded at https://data.neonscience.org/data-products/explore (accessed on 12 April 2023). NLCD data can be downloaded at https://www.mrlc.gov/data (accessed on 22 March 2023). GFCC data can be accessed on the GEE platform (accessed on 11 April 2023).

Acknowledgments

The National Ecological Observatory Network is a program sponsored by the National Science Foundation and operated under a cooperative agreement by Battelle. This material is based in part upon work supported by the National Science Foundation through the NEON Program. The authors sincerely thank NASA and NEON for providing the ICESat-2 and reference data. The authors would also like to thank the anonymous reviewers and editors for their constructive suggestions.

Conflicts of Interest

The authors declare no conflicts of interest.

References

  1. Popescu, S.C.; Zhao, K.; Neuenschwander, A.; Lin, C.S. Satellite lidar vs. small footprint airborne lidar: Comparing the accuracy of aboveground biomass estimates and forest structure metrics at footprint level. Remote Sens. Environ. 2011, 115, 2786–2797. [Google Scholar] [CrossRef]
  2. Goetz, S.J.; Sun, M.; Baccini, A.; Beck, P.S.A. Synergistic use of spaceborne lidar and optical imagery for assessing forest disturbance: An Alaska case study. J. Geophy. Res. 2010, 115, G00E07. [Google Scholar] [CrossRef]
  3. Chen, Q. Retrieving vegetation height of forests and woodlands over mountainous areas in the Pacific Coast region using satellite laser altimetry. Remote Sens. Environ. 2010, 114, 1610–1627. [Google Scholar] [CrossRef]
  4. Rosette, J.A.B.; North, P.R.J.; Suarez, J.C.; Los, S.O. Uncertainty within satellite LiDAR estimations of vegetation and topography. Remote Sens. Environ. 2010, 31, 1325–1342. [Google Scholar] [CrossRef]
  5. Adam, M.; Urbazaev, M.; Dubois, C.; Schmullius, C. Accuracy Assessment of GEDI Terrain Elevation and Canopy Height Estimates in European Temperate Forests: Influence of Environmental and Acquisition Parameters. Remote Sens. 2020, 12, 3948. [Google Scholar] [CrossRef]
  6. Guerra-hernández, J.; Pascual, A. Using GEDI lidar data and airborne laser scanning to assess height growth dynamics in fast-growing species: A showcase in Spain. For. Ecosyst. 2021, 8, 14. [Google Scholar] [CrossRef]
  7. Fayad, I.; Baghdadi, N.N.; Alvares, C.A.; Stape, J.L.; Bailly, J.S.; Scolforo, H.F.; Zribi, M.; Le Maire, G. Assessment of GEDI’s LiDAR data for the estimation of canopy heights and wood volume of eucalyptus plantations in Brazil. IEEE J. Sel. Top. Appl. Earth Obs. Remote Sens. 2021, 14, 7095–7110. [Google Scholar] [CrossRef]
  8. Dorado-Roda, I.; Pascual, A.; Godinho, S.; Silva, C.A.; Botequim, B.; Rodríguez-Gonzálvez, P.; Guerra-Hernández, J. Assessing the Accuracy of GEDI Data for Canopy Height and Aboveground Biomass Estimates in Mediterranean Forests. Remote Sens. 2021, 13, 2279. [Google Scholar] [CrossRef]
  9. Quiros, E.; Polo, M.E.; Fragoso-Campon, L. GEDI Elevation accuracy assessment: A case study of southwest Spain. IEEE J. Sel. Top. Appl. Earth Obs. Remote Sens. 2021, 14, 5285–5299. [Google Scholar] [CrossRef]
  10. Liu, A.; Cheng, X.; Chen, Z. Performance evaluation of GEDI and ICESat-2 laser altimeter data for terrain and canopy height retrievals. Remote Sens. Environ. 2021, 264, 112571. [Google Scholar] [CrossRef]
  11. Wang, C. Accuracy Analysis and Improvement Methods for Forest Structure and Functioning Parameters of GEDI Products. Ph.D. Thesis, China University of Mining & Technology, Xuzhou, China, 2023. [Google Scholar]
  12. Lefsky, M.A.; Keller, M.; Pang, Y.; de Camargo, P.B.; Hunter, M.O. Revised method for forest canopy height estimation from Geoscience Laser Altimeter System waveforms. J. Appl. Remote Sens. 2007, 1, 013537. [Google Scholar]
  13. Rosette, J.A.B.; North, P.R.J.; Suárez, J.C. Vegetation height estimates for a mixed temperate forest using satellite laser altimetry. Int. J. Remote Sens. 2008, 29, 1475–1493. [Google Scholar] [CrossRef]
  14. Pang, Y.; Lefsky, M.; Andersen, H.E.; Miller, M.E.; Sherrill, K. Validation of the ICESat vegetation product using crown-area-weighted mean height derived using crown delineation with discrete return lidar data. Can. J. Remote Sens. 2008, 34, S471–S484. [Google Scholar] [CrossRef]
  15. Duncanson, L.I.; Niemann, K.O.; Wulder, M.A. Estimating forest canopy height and terrain relief from GLAS waveform metrics. Remote Sens. Environ. 2010, 114, 138–154. [Google Scholar] [CrossRef]
  16. Lee, S.; Ni-meister, W.; Yang, W.; Chen, Q. Physically based vertical vegetation structure retrieval from ICESat data: Validation using LVIS in White Mountain National Forest, New Hampshire, USA. Remote Sens. Environ. 2011, 115, 2776–2785. [Google Scholar] [CrossRef]
  17. Allouis, T. A New Method for Incorporating Hillslope Effects to Improve Canopy-Height Estimates From Large-Footprint LIDAR Waveforms. IEEE Geosci. Remote Sens. Lett. 2012, 9, 730–734. [Google Scholar] [CrossRef]
  18. Nie, S.; Wang, C.; Xi, X.; Li, G.; Luo, S.; Yang, X.; Wang, P.; Zhu, X. Exploring the Influence of Various Factors on Slope Estimation Using Large-Footprint LiDAR Data. IEEE Trans. Geosci. Remote Sens. 2018, 5, 6611–6621. [Google Scholar] [CrossRef]
  19. Wu, J.; Wang, X.; Zhang, H.; Lu, F.; Jiao, H. Development of a forest canopy height estimation model using GLAS full waveform data over sloping terrain. Int. J. Remote Sens. 2018, 39, 9073–9091. [Google Scholar] [CrossRef]
  20. Yang, W.; Wenge, N.; Lee, S. Assessment of the impacts of surface topography, off-nadir pointing and vegetation structure on vegetation lidar waveforms using an extended geometric optical and radiative transfer model. Remote Sens. Environ. 2011, 115, 2810–2822. [Google Scholar] [CrossRef]
  21. Wang, Y.; Ni, W.; Sun, G.; Chi, H.; Zhang, Z.; Guo, Z. Slope-adaptive waveform metrics of large footprint lidar for estimation of forest aboveground biomass. Remote Sens. Environ. 2020, 224, 386–400. [Google Scholar] [CrossRef]
  22. Dubayah, R.; Blair, J.B.; Goetz, S.; Fatoyinbo, L.; Hansen, M.; Healey, S.; Hofton, M.; Hurtt, G.; Kellner, J.; Luthcke, S.; et al. The Global Ecosystem Dynamics Investigation: High-resolution laser ranging of the Earth’s forests and topography. Sci. Remote Sens. 2020, 1, 100002. [Google Scholar] [CrossRef]
  23. Luthcke, S.; Rebold, T.; Thomas, T.; Pennington, T. Algorithm Theoretical Basis Document (ATBD) for GEDI Waveform Geolocation for L1 and L2 Products. In Algorithm Theoretical Basis Document; NASA: Washington, DC, USA, 2019; pp. 1–62. [Google Scholar]
  24. Kampe, T.U. NEON: The first continental-scale ecological observa tory with airborne remote sensing of vegetation canopy biochemistry and structure. J. Appl. Remote Sens. 2010, 4, 043510. [Google Scholar] [CrossRef]
  25. Wang, C.; Elmore, A.J.; Numata, I.; Cochrane, M.A.; Shaogang, L.; Huang, J.; Zhao, Y.; Li, Y. Factors affecting relative height and ground elevation estimations of GEDI among forest types across the conterminous USA. GISci. Remote Sens. 2022, 59, 975–999. [Google Scholar] [CrossRef]
  26. Fayad, I.; Baghdadi, N.; Alcarde Alvares, C.; Stape, J.L.; Bailly, J.S.; Scolforo, H.F.; Cegatta, I.R.; Zribi, M.; Le Maire, G. Terrain Slope Effect on Forest Height and Wood Volume Estimation from GEDI Data. Remote Sens. 2021, 13, 2136. [Google Scholar] [CrossRef]
  27. Beck, J.; Wirt, B.; Armston, J.; Hofton, M.; Luthcke, S.; Tang, H. GLOBAL Ecosystem Dynamics Investigation (GEDI) Level 2 User Guide; University of Maryland: Washington, DC, USA, 2021. [Google Scholar]
  28. Breiman, L. Random forests. Mach. Learn. 2001, 45, 5–32. [Google Scholar] [CrossRef]
Figure 1. Overview of the study area and distribution of each site.
Forests 15 01536 g001
Figure 2. The flowchart of the pre-processing.
Forests 15 01536 g002
Figure 3. Correlation coefficients between GEDI forest canopy height and the reference value.
Forests 15 01536 g003
Figure 4. Scatter plot and difference statistics of forest canopy height estimation of GEDI. (a) Scatter plot between GEDI forest heights and NEON forest heights. (b) The frequency of difference statistics of forest canopy height estimation of GEDI.
Forests 15 01536 g004
Figure 5. Performance statistics of forest canopy height for each site. (a) Numbers. (b) Bais. (c) RMSE. (d) R2. (e) %RMSE. (f) MAE.
Forests 15 01536 g005
Figure 6. Effects of beam type and acquisition time on the accuracy of GEDI forest canopy height.
Forests 15 01536 g006
Figure 7. The impact of error factors on GEDI forest canopy height estimation. (a) number of peaks; (b) sensitivity; (c) canopy cover; (d) slope.
Forests 15 01536 g007
Figure 8. Importance of error factors.
Forests 15 01536 g008
Figure 9. Comparison of scatter plots before and after filtering. (a) before; (b) after.
Forests 15 01536 g009
Figure 10. Flowchart of forest canopy height correction.
Forests 15 01536 g010
Figure 11. Variation in model error with the number of decision trees.
Forests 15 01536 g011
Figure 12. Comparison of validation results before and after correction. (a) before; (b) after.
Forests 15 01536 g012
Figure 13. Accuracy comparison before and after correction for each NEON site. (a) RMSE; (b) R2.
Forests 15 01536 g013
Table 1. Detailed information for each NEON site.
SiteLatitudeLongitudeArea (km2)Mean
Elevation (m)
Mean Slope (°)Mean Forest Height (m)Mean
Canopy Cover
Dominant Plant
ABBY45.76−122.3372.6036315.00340.80Pseudotsuga menziesii
BART44.06−71.29115.9023215.60230.95Fagus grandifolia|Tsuga canadensis|Acer rubrum
CLBJ33.38−97.78156.602745.20130.41Quercus stellata|Quercus marilandica
GRSM35.69−83.5032.7057525.96300.94Liriodendron tulipifera|Acer rubrum
HARV42.54−72.17303.803517.50260.88Quercus rubra|Tsuga cadensis
JERC31.19−84.47320.30443.50270.40Quercus falcata|Pinus palustris
ORNL35.96−84.2857.4034434.07280.70Acer rubrum|Nyssa sylvatica|Quercus monta
OSBS29.69−81.99226.70454.50230.57Quercus laevis|Pinus palustris
RMNP40.28−105.5546.50274217.21190.68Pinus contorta|Abies lasiocarpa|Pseudotsuga menziesii
SCBI38.89−78.14112.9036113.20160.85Liriodendron tulipifera|Fraxinus americana
SERC38.89−76.56111.90156.50380.55Liriodendron tulipifera|Fagus grandifolia|Liquidambar styraciflua
SOAP37.03−119.26170.40116017.80320.68Quercus chrysolepis
TALL32.95−87.39134.8013512.20250.86Quercus montana|Liriodendron tulipifera|Cornus florida
TEAK37.01−119.01185.40214716.40350.59Abies magnifica|Abies concolor|Pinus contorta
TREE45.51−89.59231.404816.30200.82Acer saccharum|Acer rubrum |Alnus incana
UKFS39.04−95.19135.103355.20190.40Fraxinus americana|Celtis occidentalis
UNDE46.23−89.54172.805185.90240.85Acer saccharum|Abies balsamea|Acer rubrum
WREF45.82−121.95183.4040719.70500.96Psuedotsuga menziesii|Tsuga heterophylla
YELL44.95−110.54239.40211613.20140.65Pseudotsuga menziesii|Pinus contortas
Table 2. Statistics of GEDI data by each NEON site.
SiteNumber of SamplesPercentage of Slope (%)Percentage of Canopy Cover (%)
<10°10–20(°)20–30(°)>30(°)<0.30.3–0.50.5–0.7>0.7
ABBY91731.5252.5612.873.058.943.493.2784.30
BART108820.1340.5334.285.061.471.101.8495.59
CLBJ358681.8714.003.960.1751.0317.3516.6514.97
GRSM7998.7623.1533.1734.921.750.381.5096.37
HARV465773.5024.032.080.392.230.881.5595.34
JERC369999.650.350.000.0026.8227.8222.6522.71
ORNL4190.000.001.6798.337.641.433.1087.83
OSBS392299.130.840.030.0027.879.549.5653.03
RMNP1535423.5443.9126.885.6732.3030.9415.1921.57
SCBI120428.7457.3112.541.414.491.162.1692.19
SERC90468.3629.761.880.0010.623.544.7681.08
SOAP988019.3445.2028.377.095.3613.7321.7021.74
TALL70435.3758.386.110.142.701.992.5692.76
TEAK970426.3848.7519.515.3620.729.308.3561.63
TREE160965.8231.762.420.003.732.053.2390.99
UKFS152756.3240.603.080.0031.2411.0013.1044.66
UNDE182271.3527.281.370.000.930.711.8796.49
WREF546126.0030.0124.7219.260.260.370.6098.77
YELL178027.2535.9625.0611.7436.5236.5213.9313.03
Table 3. Potential factors affecting the accuracy of GEDI data.
IDVariableData SourceResolution (m)Variable Type
1SensitivityGEDI L2A beam characteristic
2Beam typeGEDI L2A beam characteristic
3Acquisition timeGEDI L2A beam characteristic
4Number of peaksGEDI L2A beam characteristic
5Forest typeNational Land Cover Database30canopy characteristic
6Canopy coverLandsat30canopy characteristic
7ElevationNEON DTM1terrain characteristic
8SlopeNEON DTM1terrain characteristic
Table 4. Accuracy statistics under different beam types and acquisition time.
Condition of CollectionRMSE (m)R2BiasMAE%Bias%RMSE
Full beam and day6.710.750.494.523.43%47.08%
Coverage beam and day7.350.69−1.175.14−7.77%48.64%
Full beam and night6.130.780.754.035.46%44.79%
Coverage beam and night5.960.74−0.184.06−1.30%42.99%
Table 5. Accuracy of forest canopy height estimation for different forest types.
Forest TypeMean Forest Height (m)RMSE (m)R2Bias (m)MAE (m)%RMSE
Deciduous forest15.495.690.77−0.433.8236.73
Evergreen forest13.467.330.742.405.0654.43
Mix forest17.855.750.631.104.0232.27
Table 6. Comparison of accuracy before and after filtering.
NRMSE (m)R2Bias (m)MAE (m)%RMSE%Bias
Before690366.490.740.084.3845.890.55
After433775.600.752.063.8341.3915.22
Table 7. Accuracy Comparison of GEDI forest canopy height before and after correction.
R2Bias (m)MAE (m)RMSE (m)%Bias%RMSE
Before0.752.063.835.6015.2341.39
After0.912.693.184.1919.8830.97
Disclaimer/Publisher’s Note: The statements, opinions and data contained in all publications are solely those of the individual author(s) and contributor(s) and not of MDPI and/or the editor(s). MDPI and/or the editor(s) disclaim responsibility for any injury to people or property resulting from any ideas, methods, instructions or products referred to in the content.

