Article

Environmental Driving Mechanism and Response of Soil’s Fungal Functional Structure to Near-Naturalization in a Warm Temperate Plantation

College of Forestry Engineering, Shandong Agriculture and Engineering University, Jinan 250100, China
*
Author to whom correspondence should be addressed.
Forests 2024, 15(9), 1540; https://doi.org/10.3390/f15091540 (registering DOI)
Submission received: 8 July 2024 / Revised: 18 August 2024 / Accepted: 26 August 2024 / Published: 1 September 2024
(This article belongs to the Special Issue Forest Plant, Soil, Microorganisms and Their Interactions)

Abstract

:
In this study, the near-naturalization process of Pinus tabulaeformis plantations in Baxianshan National Nature Reserve was divided into three stages depending on the proportion of P. tabulaeformis present, resulting in the following categories: the P. tabulaeformis forest stage, the mixed forest stage, and the near-natural forest stage. Natural secondary forests were selected as a control. We assessed alterations in the soil’s fungal functional structures from three aspects: functional mode, vegetative mode, and growth mode, and their responses to vegetation and soil factors were also explored. The results showed that ectomycorrhizal, saprophytic, and plant pathogen types were dominant in the functional mode, and plant pathogens were most abundant in the P. tabulaeformis forest stage. Meanwhile, ectomycorrhizal fungi were the least abundant in the near-natural forest stage. In the vegetative mode, saprophytic, pathophysiological, and symbiotic types were dominant, and pathophysiological types were the most abundant in the P. tabulaeformis forest stage. In the growth mode, microfungi dominated, and the abundance of clavarioid decreased with near-naturalization. The degree of variation in functional structure in the three dimensions increased with near-naturalization, but the structure of natural secondary forests converged. The species composition of tree layer obviously affected the abundance and functional structure of fungi in the three modes, among which Quercus mongolia and Carpinus hornbeam were the most significant. The soil’s pH and nitrate content significantly affected the structure of the functional mode, and the soil’s dry matter content and C/N ratio significantly affected the structure of the vegetative mode. In this study, we explored the interaction between the plant community and soil ecological system during the near-naturalization process of plantations in terms of soil fungi functions, further clarifying the role of soil functions in the succession of plant communities and providing a new perspective on the in-depth exploration of ecosystem interactions during the succession of plantations.

1. Introduction

The forest ecosystem is the most complex and diverse terrestrial ecosystem; it has important ecological functions such as primary productivity, nutrient biogeochemistry, carbon fixation, oxygen release, and soil and water conservation [1]. Plantations are an important type of forest ecosystem, and their characteristic large-scale planting can satisfy demands for wood and effectively promote the carbon cycle [2]. However, due to plantations’ single-tree species and simple structure, they can suffer from a lack of diversity, which gives them a fragile structure and causes limited functioning [3]. The goal of plantation management and care is to promote their development into a healthy and stable community, and the ideal state is one in which both vegetation and soil ecosystems have a structure and function close to, or even consistent with, those of regional original ecosystems. This includes active processes achieved through human participation in management and natural development processes achieved through the interaction of planted forests with natural tree species in the inner regions of the community [4].
Fungi are important components of soil ecosystems, and their composition and structure respond to changes in tree species during the development of the forest, and further influence the development of soil nutrients and the above-ground community structure [5,6]. During secondary succession, the composition and yield of vegetation change greatly, which leads to changes in microbial communities within a short period of time [7]. However, natural succession has more utility than secondary succession in predicting the long-term development of ecological succession [8,9]. The species and composition of soil fungi are usually strongly correlated with the type of plant community and plant species, which means that tree species act as important mediators in shaping the structure of a soil fungal community. Studies have also shown that the composition, content, and diversity of fungi are significantly correlated with habitat [10,11,12]. These previous studies were only based on the similarity of the taxonomic composition of fungi. The authors have previously discussed the characteristic responses exhibited by soil micro-organisms during forest succession, focusing on their habitat-specialization adaptations [13]. However, functional structures that positively respond to ecological factors have rarely been reported [14,15]. Different functional groups of fungi are closely related to plant nutrient absorption, decomposition of organic matter, and the alleviation of plant diseases [16]. For example, mycorrhizal fungi can form mycorrhizas with plant roots in exchange for C, N, P, and other resources obtained from the soil [17] to promote the absorption of nutrients into plants [18]. Studies have shown that mycorrhiza provides nearly half of the organic nitrogen of trees and most of the new carbon in soil [19], while ectomycorrhiza fungi and arbuscular mycorrhiza (mycorrhiza groups) input varying levels of nitrogen and phosphorus to their hosts [20]. They also vary in their contribution of carbon to soil [21]. Saprotrophic fungi play a vital role in decomposing soil organic matter [22], and their biochemical process affects the element cycling rate [23]. Previous studies have found that fungal-driven ecosystem processes differ among different stand types [24]. Changes in soil properties and tree species composition can lead to changes in the diversity and functional structure of soil fungal communities [10,11]. Therefore, exploring the effects of forest community succession on fungal community structure and diversity from a functional perspective is the aim of this study, and we anticipate that it will more comprehensively show the interaction between the forest plant community and soil ecosystem. The FUNGuild package in R programs [25,26,27] has the advantage of directly analyzing and manipulating taxon data instead of genetic loci, and can divide sequenced OTUs data into groups using three dimensions: functional mode, vegetative mode, and growth mode. This makes it easier to explore responses to ecological factors in terms of fungal functional structure.
Baxianshan National Nature Reserve is rich in natural species, and its diversity ranks among the highest in the world among areas at the same latitude. However, its forest ecosystem has historically been severely damaged, and only regional vegetation has been preserved in the core area. In the 1950s, a large-scale Pinus tabulaeformis plantation was established in the sparsely occupied area of the reserve, and the forest was closed. In interacting with regional deciduous broad-leaved tree species over the past 70 years, P. tabulaeformis plantations have gradually developed the characteristics of regional natural forests and have formed mixed forests of P. tabulaeformis and a variety of regional deciduous broad-leaved tree species [28]. This process fully reflects the ecological effects of the interaction between artificial forests and regional tree species during near-natural development. In this study, we hope to reveal changes in the functional abundance and functional structure of soil fungi (in three dimensions) during near-naturalization, and explain their driving mechanisms. We predict that (1) the degree of variation in functional structure will increase as near-naturalization progresses; (2) changes in the composition of dominant tree species in the plant community are the influences on the abundance and structure of functional fungal groups in the process of near-naturalization; and (3) changes in soil physicochemical properties also affect the abundance and structure of functional groups to a certain extent. Our study will provide a new perspective on the interaction between the plant community and soil ecosystem during the establishment of plantations; we will also provide a scientific basis for the healthy development and sustainable management of stands.

2. Materials and Methods

2.1. Description of Research Area and Setup of Quadrats

Baxianshan National Nature Reserve is located in the North China, at the eastern foot of the Yanshan Mountains. Its original deciduous broad-leaved natural forests have been well preserved since the Tertiary and Cenozoic periods. By the decline of the Qing Dynasty, large numbers of primary forests were severely damaged. At the core of the reserve, a large number of deciduous broad-leaved tree species were preserved, and the felled communities began secondary succession and recovery, forming the existing natural secondary forest. In 1954, a large-scale P. tabulaeformis plantation was established in a sparsely vegetated area, and the mountain was closed for cultivation. During its interaction with the original deciduous broad-leaved tree species, the P. tabulaeformis plantation’s natural characteristics were restored, forming a sequence of naturalized plantations. Therefore, the succession stands in this study represent a successful restoration project; the naturalized plantation recovered after around 70 years, and natural secondary forests began to recover after 110 years. In this study, the restoration of P. tabulaeformis plantations was divided into three distinct stages according to the proportion of P. tabulaefomis occupying a tree layer within the community. The P. tabulaeformis forest stage was defined by the coverage of P. tabulaeformis within the tree layer exceeding 90%, whereas the mixed forest stage had a coverage ranging from 40% to 60%, and the near-natural forest stage featured less than 20% coverage. For comparison, natural secondary forests were also chosen. Due to the rapid growth of broad-leaved trees in the process of near-naturalization and their superiority in competition, the area still occupied by the P. tabulaeformins forest stage is limited. Therefore, we selected 3 quadrats from the P. tabulaeformis forest stage, 4 from the mixed forest stage, 6 from the near-natural forest stage, and 14 from the natural secondary forest stage for control. The area of a single quadrat was 600 m2 with 20 × 30 m, and the aspect of the quadrats was mainly to the south (Table S1).

2.2. Analysis of Plant Community Structure and Diversity

The species name, DBH (diameter at beast height), and height of all trees with DBH ≥ 3 cm were recorded. DBH was measured using a tree gauge, and tree height was calculated using a laser compass combined with trigonometric function.

2.2.1. Calculation of Importance Values

The importance value (IV) of each species was calculated with the following equation [29].
I V = n i i = 1 s n i 100 + a i i = 1 s a i 100 + f i i = 1 s f i 100 3
where ni represents the number of individuals of the ith species; ai represents DBH; fi represents number of quadrats in which the ith species existed; and s represents the total number of species.

2.2.2. Biomass Calculation

Felling is prohibited in the protected area, and obtaining an allometry equation of biomass by means of standard wood analysis is not advisable. Therefore, in this study, we carried out biomass estimation using the allometry equation of biomass outlined in other studies on nearby mountains (Table 1).
In the above formula, D is the chest height area, H is the tree height, and Y is the biomass (see table).

2.2.3. α-Diversity Calculation

Based on the importance of each species in the quadrat, the richness index, Shannon–Winner diversity index [30], Simpson diversity index [31], Shannon evenness index, Simpson evenness index, and Pielou evenness index (J) were calculated [32]. The richness index indicates the number of species in the quadrat, and the remaining indicators are calculated as follows:
S h a n n o n W i n n e r   i n d e x = i = 1 m P i × l n P i
P i e l o u   e v e n e s s   i n d e x = i = 1 m P i l o g P i l o g m
S i m p s o n   i n d e x = 1 i = 1 m P i ( P i 1 ) N ( N 1 )
S h a n n o n   e v e n e s s   i n d e x = S h a n n o n W i n n e r   i n d e x l o g ( m )
S i m p s o n   e v e n e s s   i n d e x = S i m p s o n i n d e x l o g ( m )
In the above formula, m signifies the count of species in the quadrat, N signifies the total number of individuals of all species, and Pi signifies the importance value of the ith species in the quadrat.

2.3. Determination of Soil Physicochemical Properties

2.3.1. Soil Sampling

Topsoil within a depth range of 0–10 cm was gathered using the five-point sampling method, with the sampling locations positioned at the center point and the four corners of each quadrat. The samples were gathered from the five locations within each quadrat, blended thoroughly, and subsequently partitioned into two separate portions. This resulted in a total of 54 soil samples. Half of the samples were preserved in liquid nitrogen for subsequent molecular biological extraction and analysis, and the other half were kept at ambient temperature and promptly transported back to the laboratory for physicochemical evaluations.

2.3.2. Determination of Soil Indices

Soil pH was measured via the KCl dissolution electrode method, which is based on the conversion of electromotive force values to obtain pH values; it is highly accurate and suitable for soils of different pH ranges. A CN analyzer was employed to measure total nitrogen and total carbon content (Perkin-Elmer Optima8300), and the organic carbon content (SOC) was determined via the potassium dichromate oxidation method [33]. Various ionic forms of nitrogen—including ammonia nitrogen (AN) and nitrate nitrogen (NAN)—were determined using the KCl leaching spectrophotometric method [34,35]. Total phosphorus (TP) was determined via microwave digestion spectrophotometry and available phosphorus (AP) by NH4F-HCl leaching spectrophotometry [36]. The soil’s dry matter content was measured via the water content–gravimetric method [37]. Metrics of soil enzymatic activity, including cellulase (CA), urease (UA), β-glucosidase (GA), dehydrogenase (DHA), and acid phosphatase (ACP) were measured using the method of Lin et al. [38].

2.4. Soil Microbial Sequencing and Annotation

DNA extraction, amplification and purification: Briefly, 0.5 g of each soil sample was used to extract genomic DNA with the reagent kits (Manufacturer: Tiagen Biochemical Technology Co., Ltd., (Beijing, China) model: DP812), and then fungal ITS sequences (primer ITS1F: 5’-CTTGGTCATTTAGAGGAAGTAA-3; ITS2: 5’-GCTGCGTTCTTCATCGATGC-3’) were amplified [39]. The PCR products were purified and tested for purity and quantification. A unique barcode was used to separate each sample to prevent cross-contamination. The PCR system was as follows: 25 μL of Taq enzyme, 1 μL each of double-ended primers (10 mM), and 3 μL of template DNA (20 ng · μL−1) supplemented with ddH2O to 50 μL. The reaction conditions were as follows: pre-denaturation at 95 °C for 5 min, denaturation at 95 °C for 30 s, annealing at 50 °C for 30 s (extended to 72 °C for 40 s), and a total of 25 cycles. Finally, the reaction was extended to 72 °C for 7 min.
Sequencing and data processing (1) Filtering of raw data: Trimmomatic [40] was applied to filter dual-end sequencing files. For example, for a 50 bp window, if the average mass within the window was less than 20, the back-end base was truncated from the window. (2) Identification and removal of primer sequences: Cutadapt (Version 1.9.1) was utilized to identify primer sequences based on the specified parameters [41], which tolerated a maximum error rate of 20% and required a minimum coverage of 80%. (3) Splicing of double-ended reads: USEARCH (Version 10) [42] was employed for stitching double-ended reads from samples, adhering to a minimum overlap length of 10 bp, allowing a minimum similarity of 90% within the overlapping region, and tolerating a maximum of 5 bp error bases. (4) Removal of chimera: The chimera criteria split the query sequence into non-overlapping chunks, and compared these with the database. The best match for each block in the database was selected, and finally the two best parental sequences were selected. The sequence to be detected was compared with two parents. If the similarity between the parent sequence and the query sequence was greater than 80%, the query was judged to be a chimera. Chimeras were removed using UCHIME [43]. Each sample was separated using a unique barcode to prevent cross-contamination.
OTU clustering and species annotation: Cluster analysis was executed utilizing UPARSE with a 97% similarity threshold, followed by the application of the usearch command to eliminate redundant sequences and standalone operational taxonomic units (OTUs) during the process. Each clustered OTU was annotated into seven taxonomic classes of boundary, phylum, order, family, genus, and species by utilizing the sine method, referencing either the 16S rRNA Silva database or the ITS database in Unite. Consequently, community abundance tables were generated for each taxonomic rank.

2.5. Prediction of Fungal Function

FUNGuild (Fungi Functional Guild) within the R program was used to conduct functional analysis of fungal communities with OUT abundance > 1%, and the running results were downloaded and screened. In order to improve the reliability of our predictions of fungal functional groups, only two grades of confidence (“highly probable” and “probable”) were retained [25].

2.6. Data Processing and Analysis

An ANOVA test conducted via the Scheffe method was used to analyze the differences between the plant diversity index, soil physicochemical properties, and abundance of soil microbial functional groups in three dimensions among different stands. The significance level was defined as 0.05. This analysis was implemented in the multicomp package of the R program. The “corr.test” function within the vegan package in R language was used to calculate the correlation coefficient (i.e., the Pearson coefficient) between the species composition of the plant community, diversity index, soil physicochemical properties, soil enzyme activity, and functional abundance of each dimension. The “Pheatmap” function was used to draw heatmaps. The RDA redundancy function within the vegan package of R software 4.2.2. was used to interpret the effect of species composition, diversity index, soil physicochemical properties, and enzyme activity on the functional structure of the fungal community. The Monte Carlo permutation test was used to analyze the significance of factors influencing each explanatory variable in the RDA model, and it was performed by means of the “anova.cca” function with 999 permutations. The correlation degree R2 and significance degree P of each factor’s contribution to the model were calculated using the “envfit” function, and the graph was completed in the R language ggplot2 package.

3. Results and Analysis

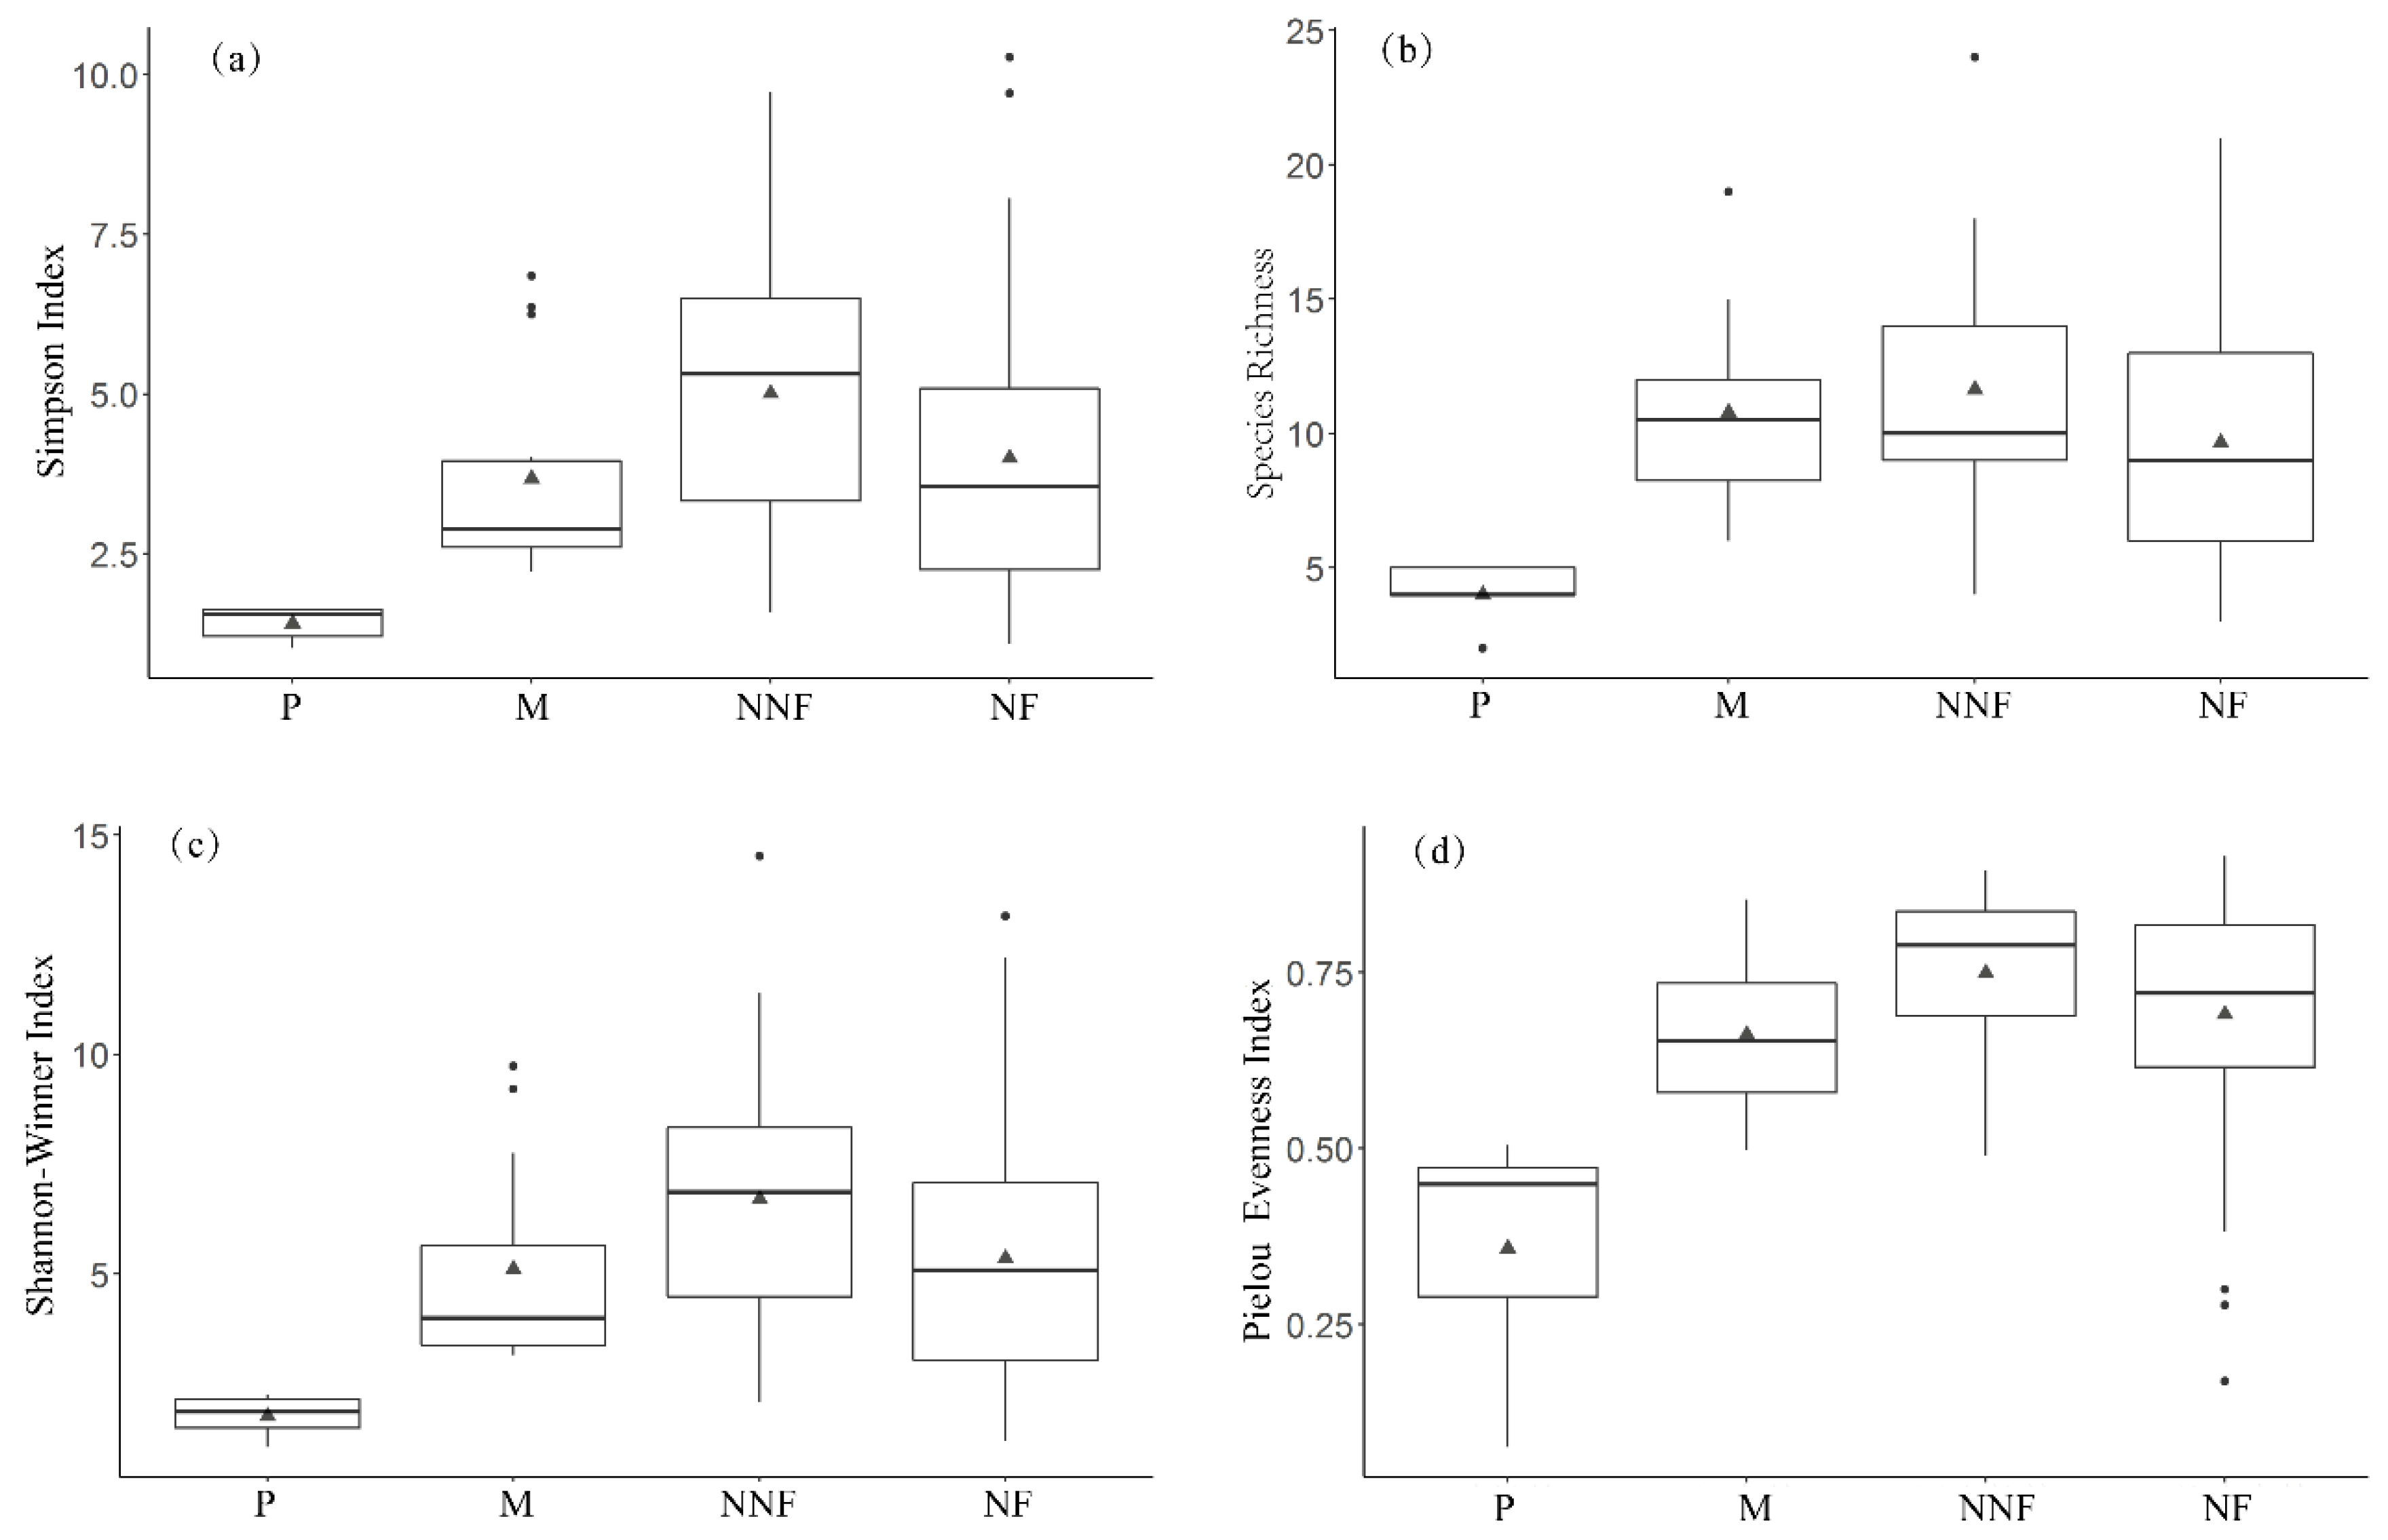
3.1. Changes in Plant Community Structure and Soil Properties

The results showed that, during the naturalization of the Pinus tabulaeformis plantation, the composition of the dominant species in the community tended to be stable, and the plantation gradually developed into a mixed community of plantation and natural forest with Quercus mongolica, Q. variabilis, and Juglans mandshurica as the dominant species. The diversity of tree layer increased, exceeding that of the natural secondary forest in the near-natural forest stage (Figure 1a–d). Soil pH value, dry matter content, and cellulase and urease activities showed an increasing trend. The organic carbon, ammonia nitrogen content, and acid phosphatase activity decreased. Total carbon, total nitrogen, total phosphorus, available phosphorus content, β-glucosidase, and dehydrogenase activity decreased first and then increased. The total organic carbon content and carbon–nitrogen ratio increased first and then decreased (Table 2).

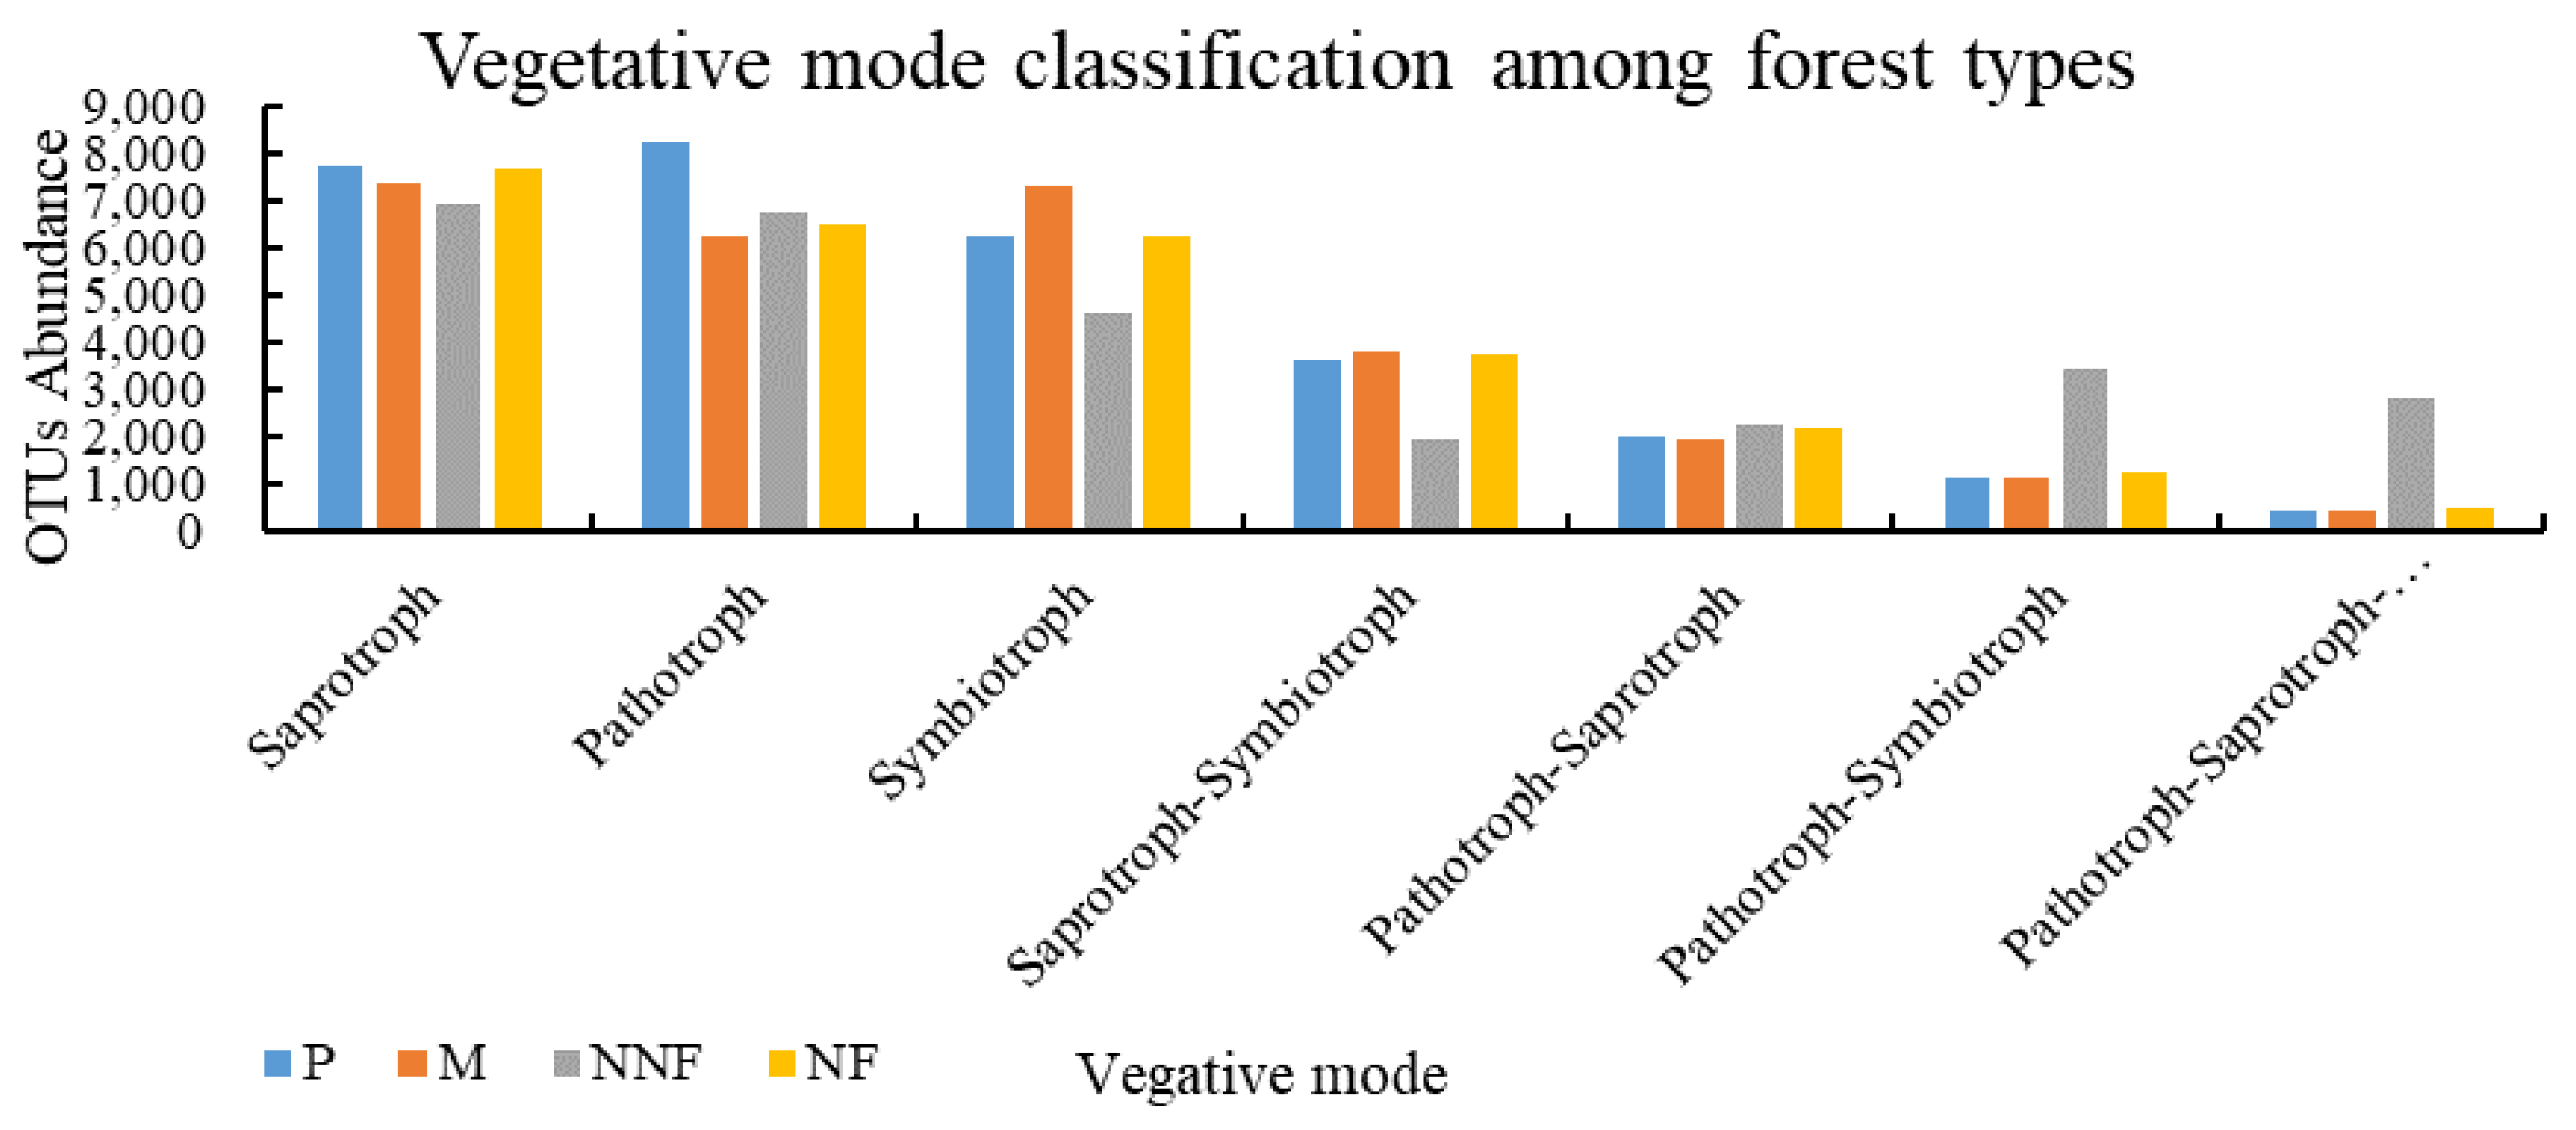
3.2. Influence of Near-Naturalization on the Abundance of Fungal Functional Groups

The results showed that the abundance of ectomycorrhizal fungi, saprophytic fungi, and plant pathogens dominated in the functional mode groups. The abundance of plant pathogens in the P. tabulaeformis forest stage was significantly higher than in other stages, and the abundance of ectomycorrhizal fungi in the near-natural forest stage was significantly lower than in other stages (Figure 2). The abundance of saprophytic, pathophysiological, and symbiotic nutrition dominated in the vegetative mode group. The abundance of pathotrophic fungi in the P. tabulaeformis forest stage was significantly higher than that in other stages, which was consistent with the highest abundance in functional mode. The abundance of symbiotroph in the near-natural forest stage was significantly lower than in other stages, which was also consistent with the ectomycorrhizal fungi in the functional mode group (Figure 3). The abundance of microfungi accounted for 53.06% of the growth mode group, which was the dominant group. The abundance of clavarioid decreased with the naturalization process (Figure 4).

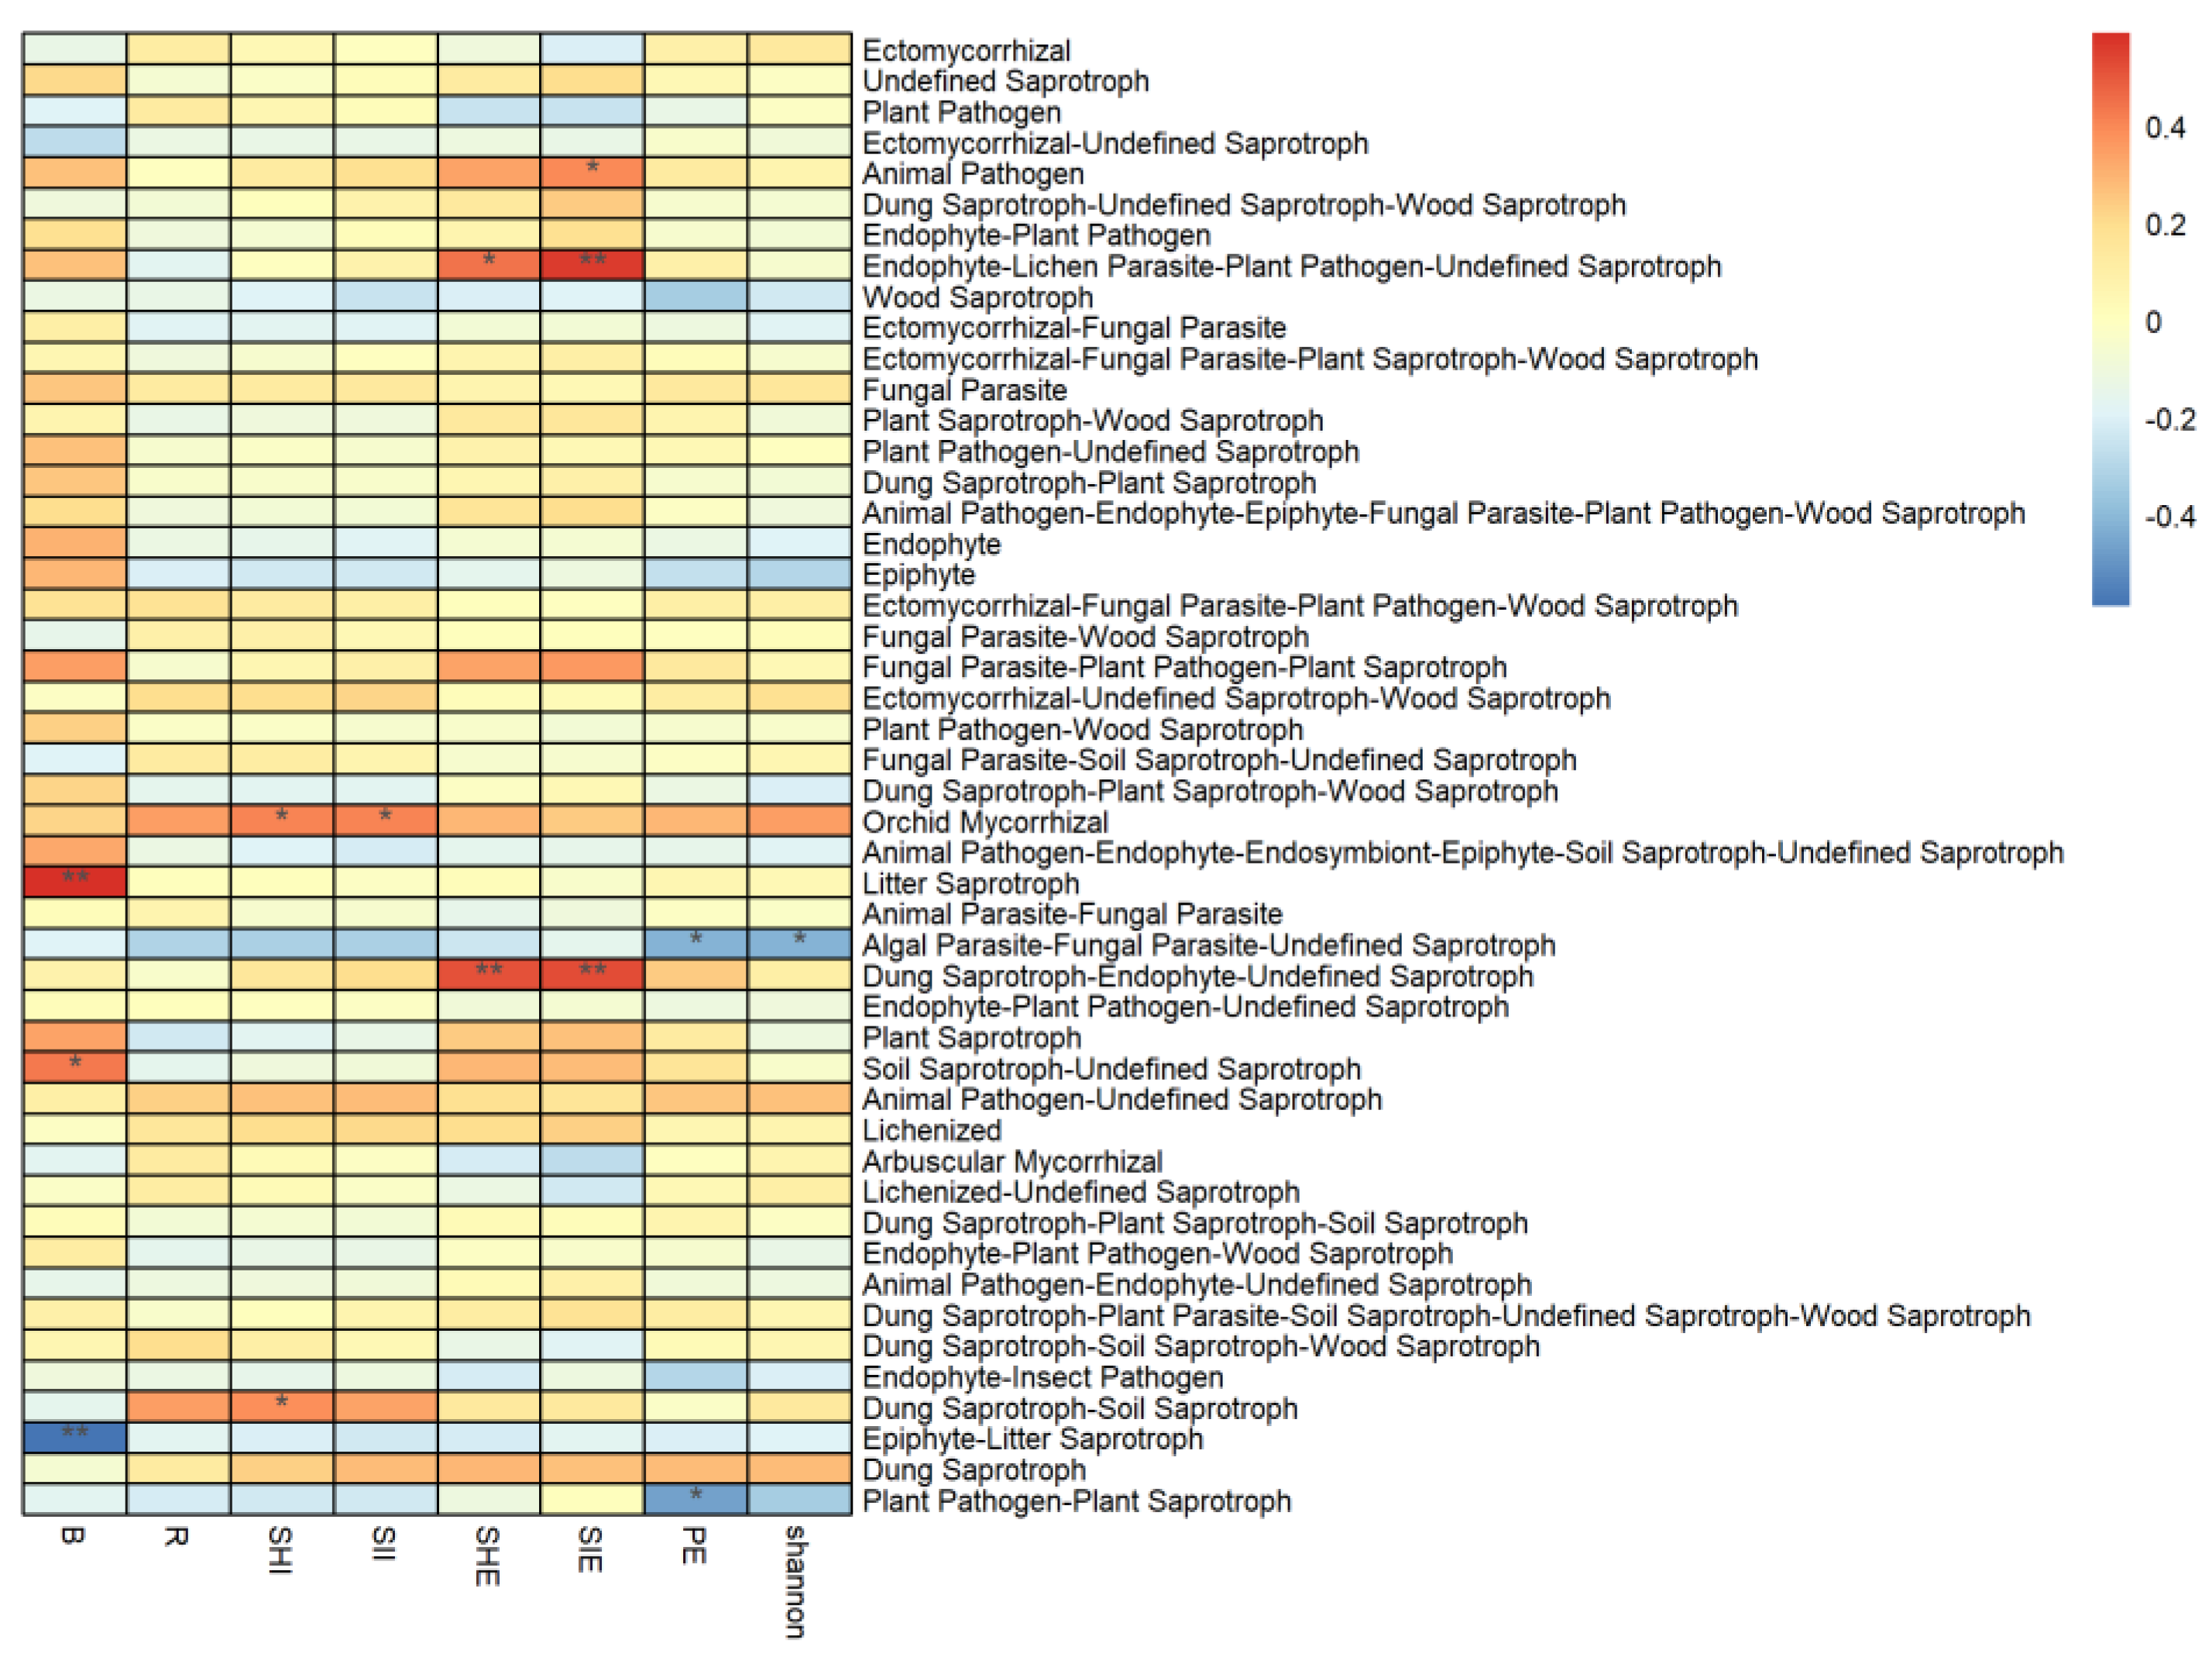
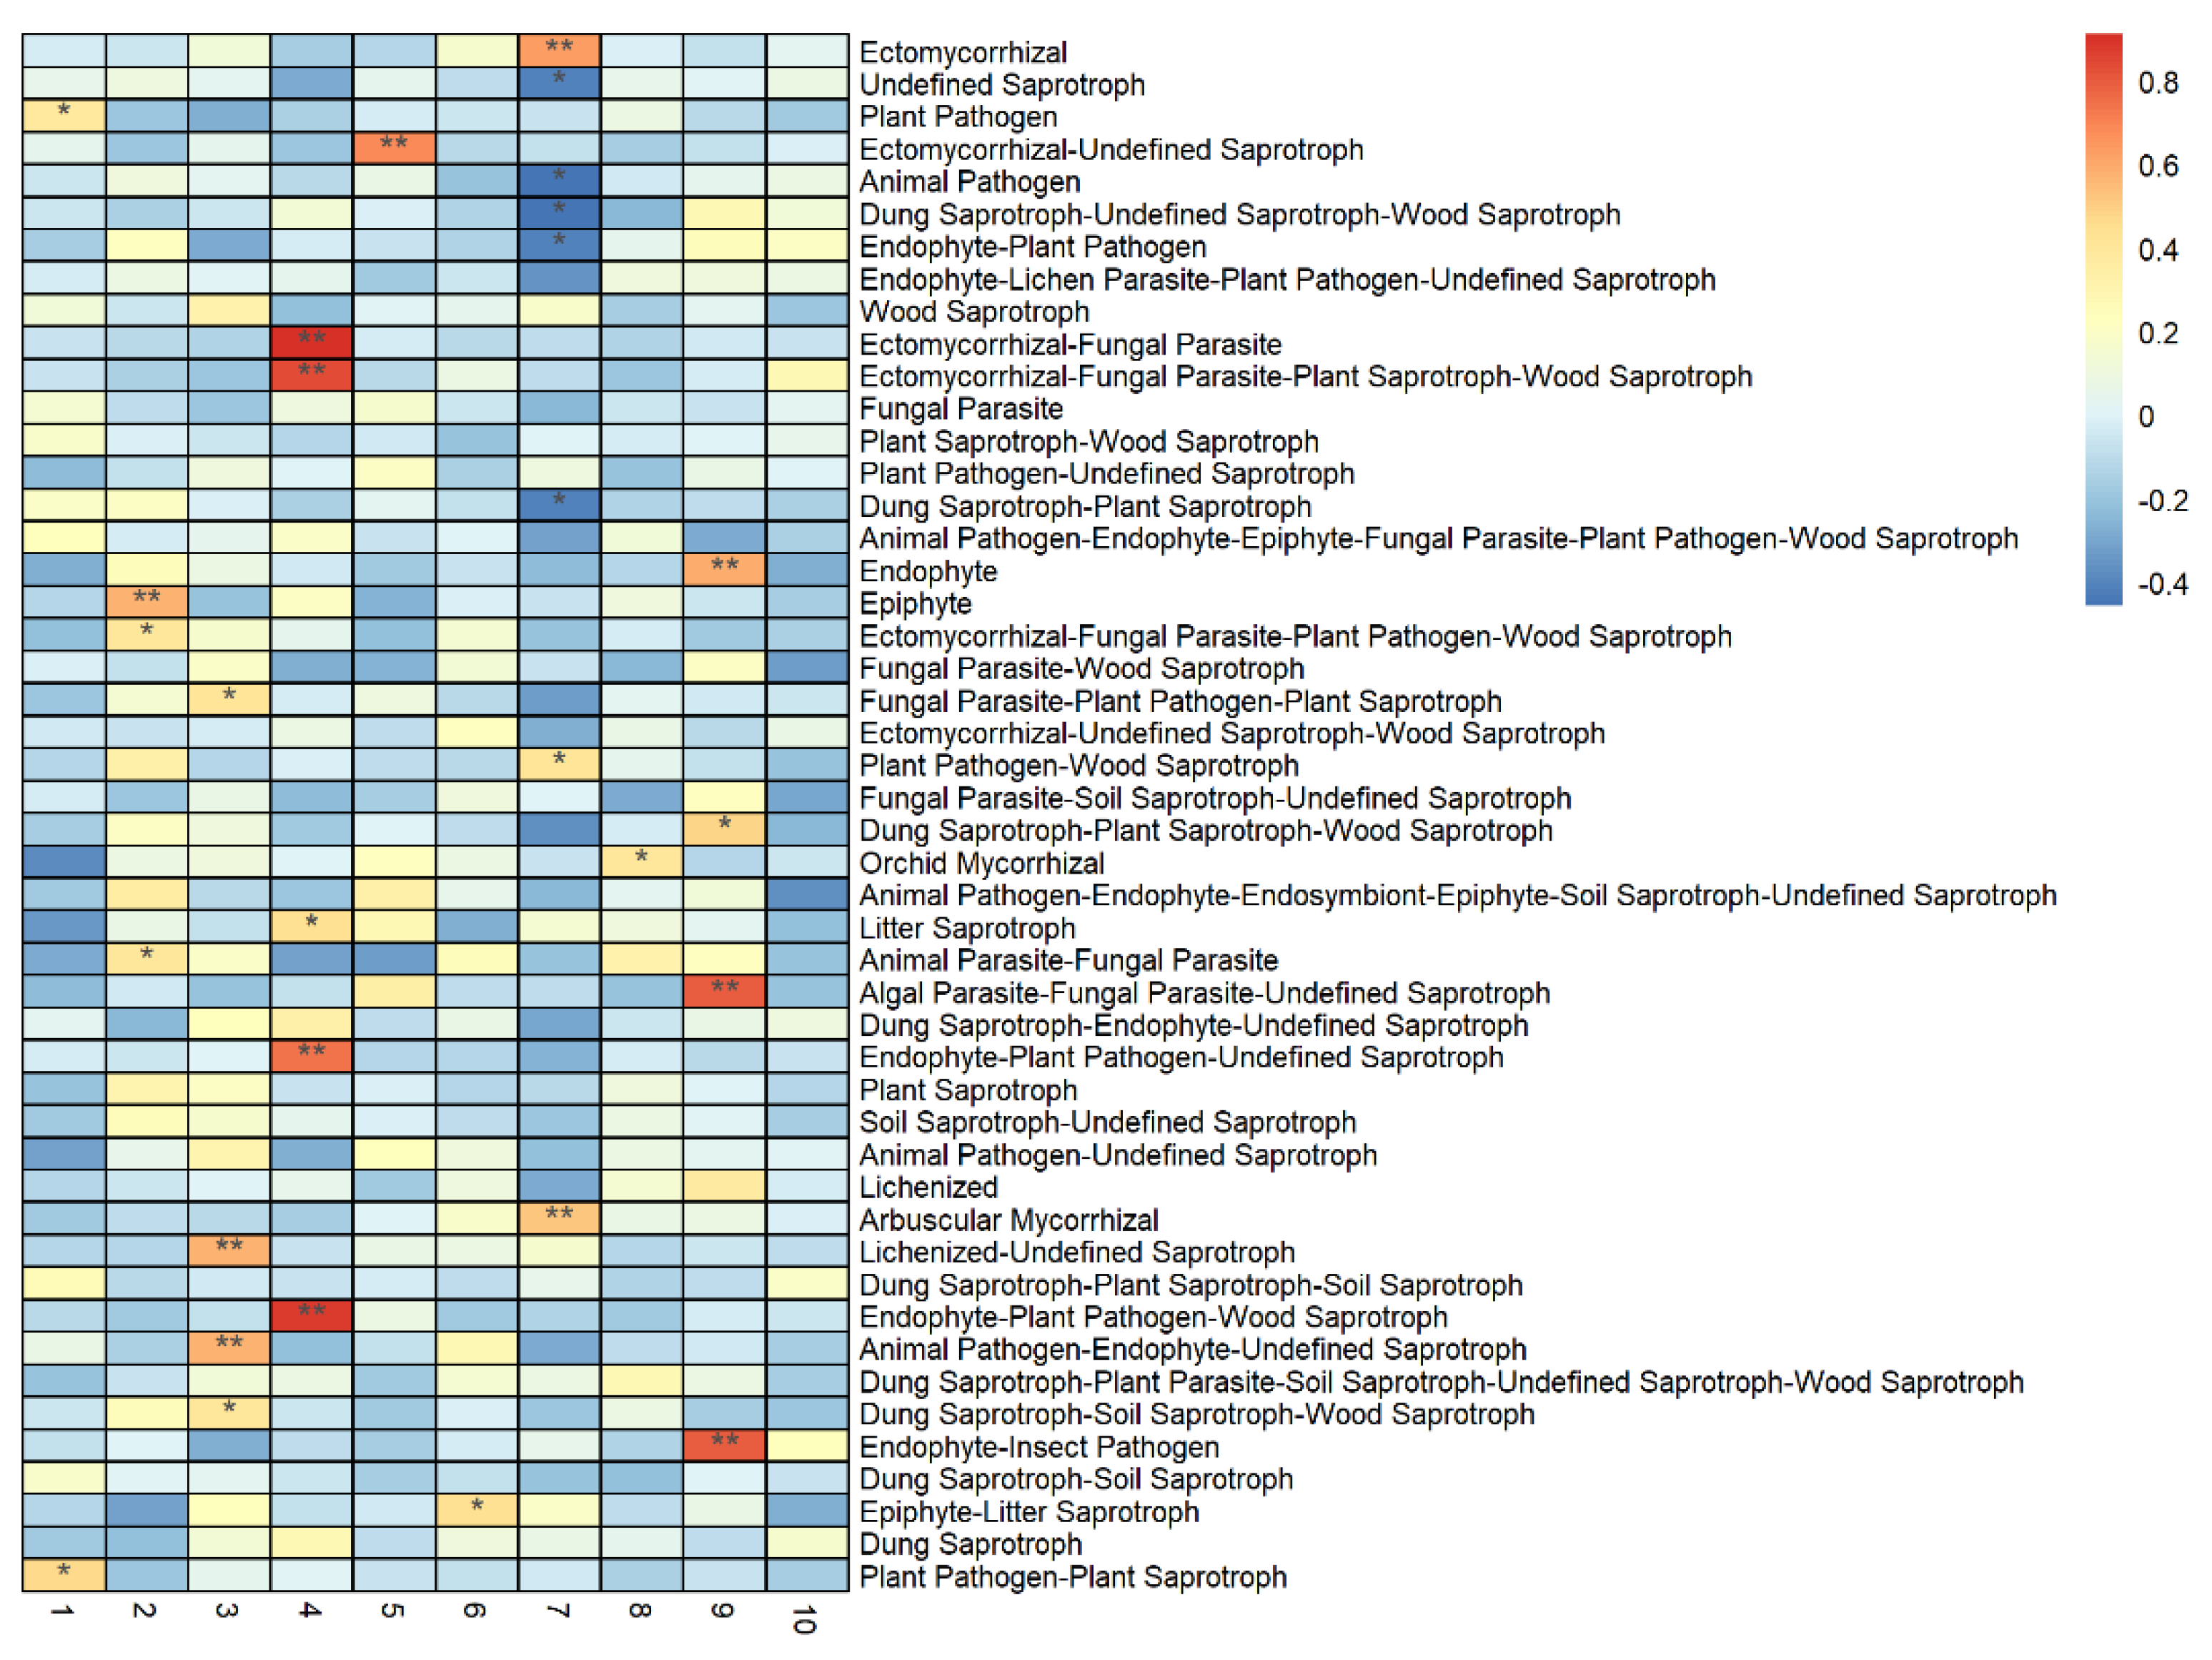
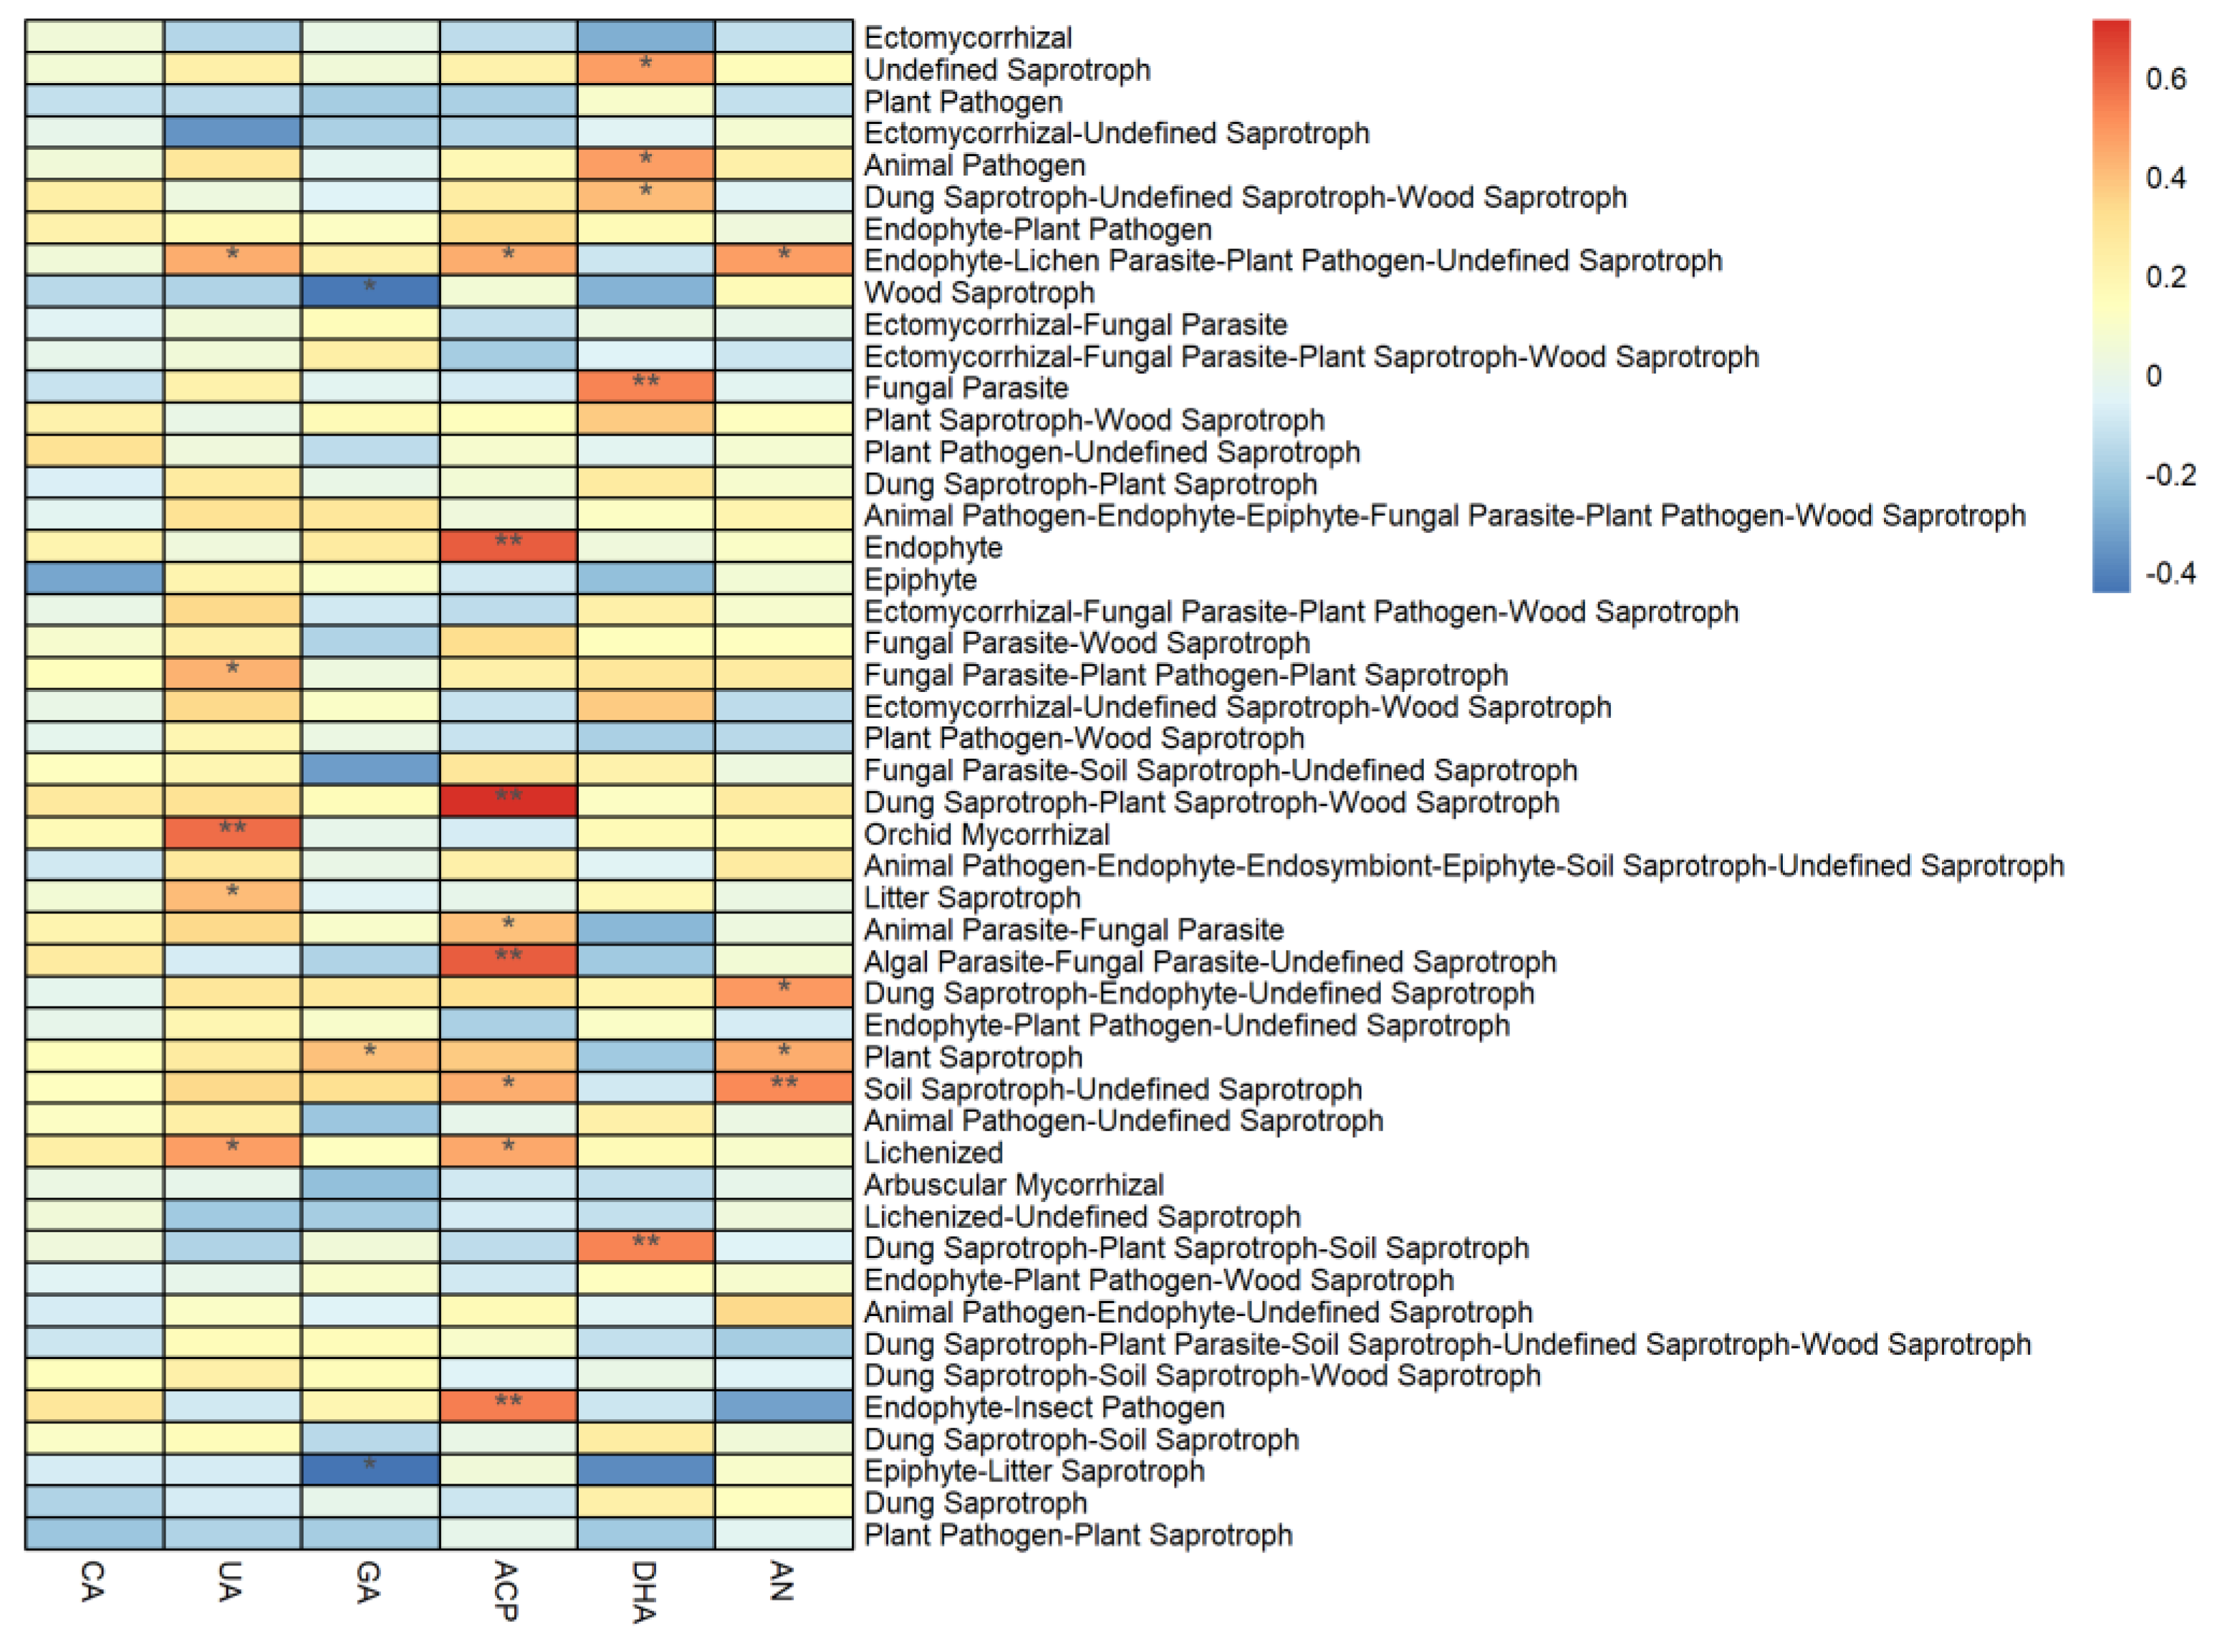
3.3. Correlation between Vegetation and Soil Properties, and the Abundance of Soil Fungal Functional Groups

The diversity of the tree layer rarely correlated with the abundance of functional groups in the three groups. In the functional mode, the biomass of tree layer was significantly positively correlated with litter saprotroph and soil saprotroph, but significantly negatively correlated with the abundance of epiphyte–litter saprotroph (Figure 5). In the vegetative mode, the highest positive correlation coefficient was found in the biomass and the abundance pathotroph–saprotroph groups (Figure S1). In the growth mode, only the Shannon evenness index and Simpson evenness index showed a significant positive correlation with the abundance of yeast-type fungi (Figure S2).
The composition of tree species has been shown to correlate significantly with the abundance of functional groups in the three dimensions. In the functional mode, the importance value of Carpinus turczaninowii showed a significant positive correlation with the ectomycorrhizal group, but a negative relationship with most other functional mode groups. The importance value of Q. mongolica was also significantly correlated with the abundance of various functional mode groups, and in some, the correlation coefficient exceeded 0.8. The importance value of Tilia amurensis significantly correlated with the ectomycorrhizal–unknown and saprophytic fungi (Figure 6). In the vegetative mode, the importance values of most tree species were negatively correlated with the most abundant types (e.g., the saprophytic and pathophysiological). The importance of C. turczaninowii was positively correlated with the abundance of symbiotroph, Tilia amurensis with saprotroph–symbiotroph, and Q. mongolica with pathotroph–symbiotroph and pathotroph–saprotroph–symbiotroph. (Figure S3). In the growth mode, no significant relationship could be found between the tree species composition and the most abundant types of growth mode (Figure S4).
Soil physicochemical properties showed a strong correlation with the abundance of functional and growth mode types, but a weak correlation with the abundance of vegetative mode. In the functional mode, ectomycorrhizal fungi with the highest abundance showed no significant correlation with soil physicochemical properties. Soil pH correlated positively with the abundance of orchid mycorrhizal and litter saprotroph. Soil organic carbon negatively correlated with plant pathogens and ectomycorrhizal–saprotroph–wood saprotroph, but correlated positively with wood saprotroph. Total nitrogen correlated positively with ectomycorrhizal–fungal–parasite–plant groups, pathogen–wood saprotroph bacteria, epiphytes, and plant pathogen–wood saprotroph. Soil ammonium nitrogen correlated positively with soil saprotroph–undefined saprotroph. All of the above relationships were significant (Figure 7). In the vegetative mode, the nitrate nitrogen content was significantly positively correlated with saprotroph, which was the most abundant type. Soil organic carbon content was negatively correlated with pathotroph, and a similar negative relationship was found between pathotroph–saprotroph and soil dry matter content (Figure S5). In the growth mode, available phosphorus content was significantly negatively correlated with the abundance of microfungus and agaricoid–corticioid–gasteroid–secotioid, but positively correlated with the abundance of clavarioid. In addition, the soil organic carbon, total phosphorus, total nitrogen content, pH, dry matter content, and carbon–nitrogen ratio were also strongly correlated with the abundance of the growth mode group (Figure S6).
Metrics of soil enzyme activity such as soil urease, acid phosphatase, and dehydrogenase were strongly correlated with functional mode groups, but cellulase showed no significant correlation. Dehydrogenase activity significantly positively correlated with the abundance of saprotroph (Figure 8). In the vegetative mode, no significant correlation was found between soil enzyme activity and highly abundant types (Figure S7). Among the growth mode groups, urease activity was significantly negatively correlated with the abundance of the agaricoid–corticioid–gasteroid–secotioid type (Figure S8).

3.4. Effects of Near-Naturalization on the Functional Structure of Fungal Community of Soil Fungi

The results showed that the variation in community structure in the functional mode group and vegetative mode group in the first two axes of PcoA was 64.05% and 70.73%, respectively. With near-naturalization, the distribution of the co-ordinate points of the two modes on the PcoA axis 2 diverged, indicating that the degree of variation increased. On the contrary, the co-ordinate points of natural secondary forests were concentrated, indicating convergence of community structure. This indicated that the distribution of the functional mode and vegetative mode of soil fungi in areas without afforestation and restored near-naturalization was relatively stable. In the process of near-naturalization, the changes in the dominant plant species caused changes in soil nutrients and enzyme activity, which led to the recombination and distribution of soil fungi in functional and vegetative dimensions. The variation in the growth mode’s group structure in the first two axes of PcoA reached 70.73%, and the community structure of the near-naturalized forest stages showed a tendency to diverge on both axes 1 and 2, while the growth mode group structure of the natural secondary forest still showed convergence (Figure 9).

3.5. Factors Influencing the Near-Naturalization of the Soil Fungi Community’s Functional Structure

The Monte Carlo test was used to explore the effects of the diversity and species composition of the tree layer, soil physicochemical properties, and enzyme activity on the functional structure of the fungal community. The results indicated a non-significant correlation (Table 3).

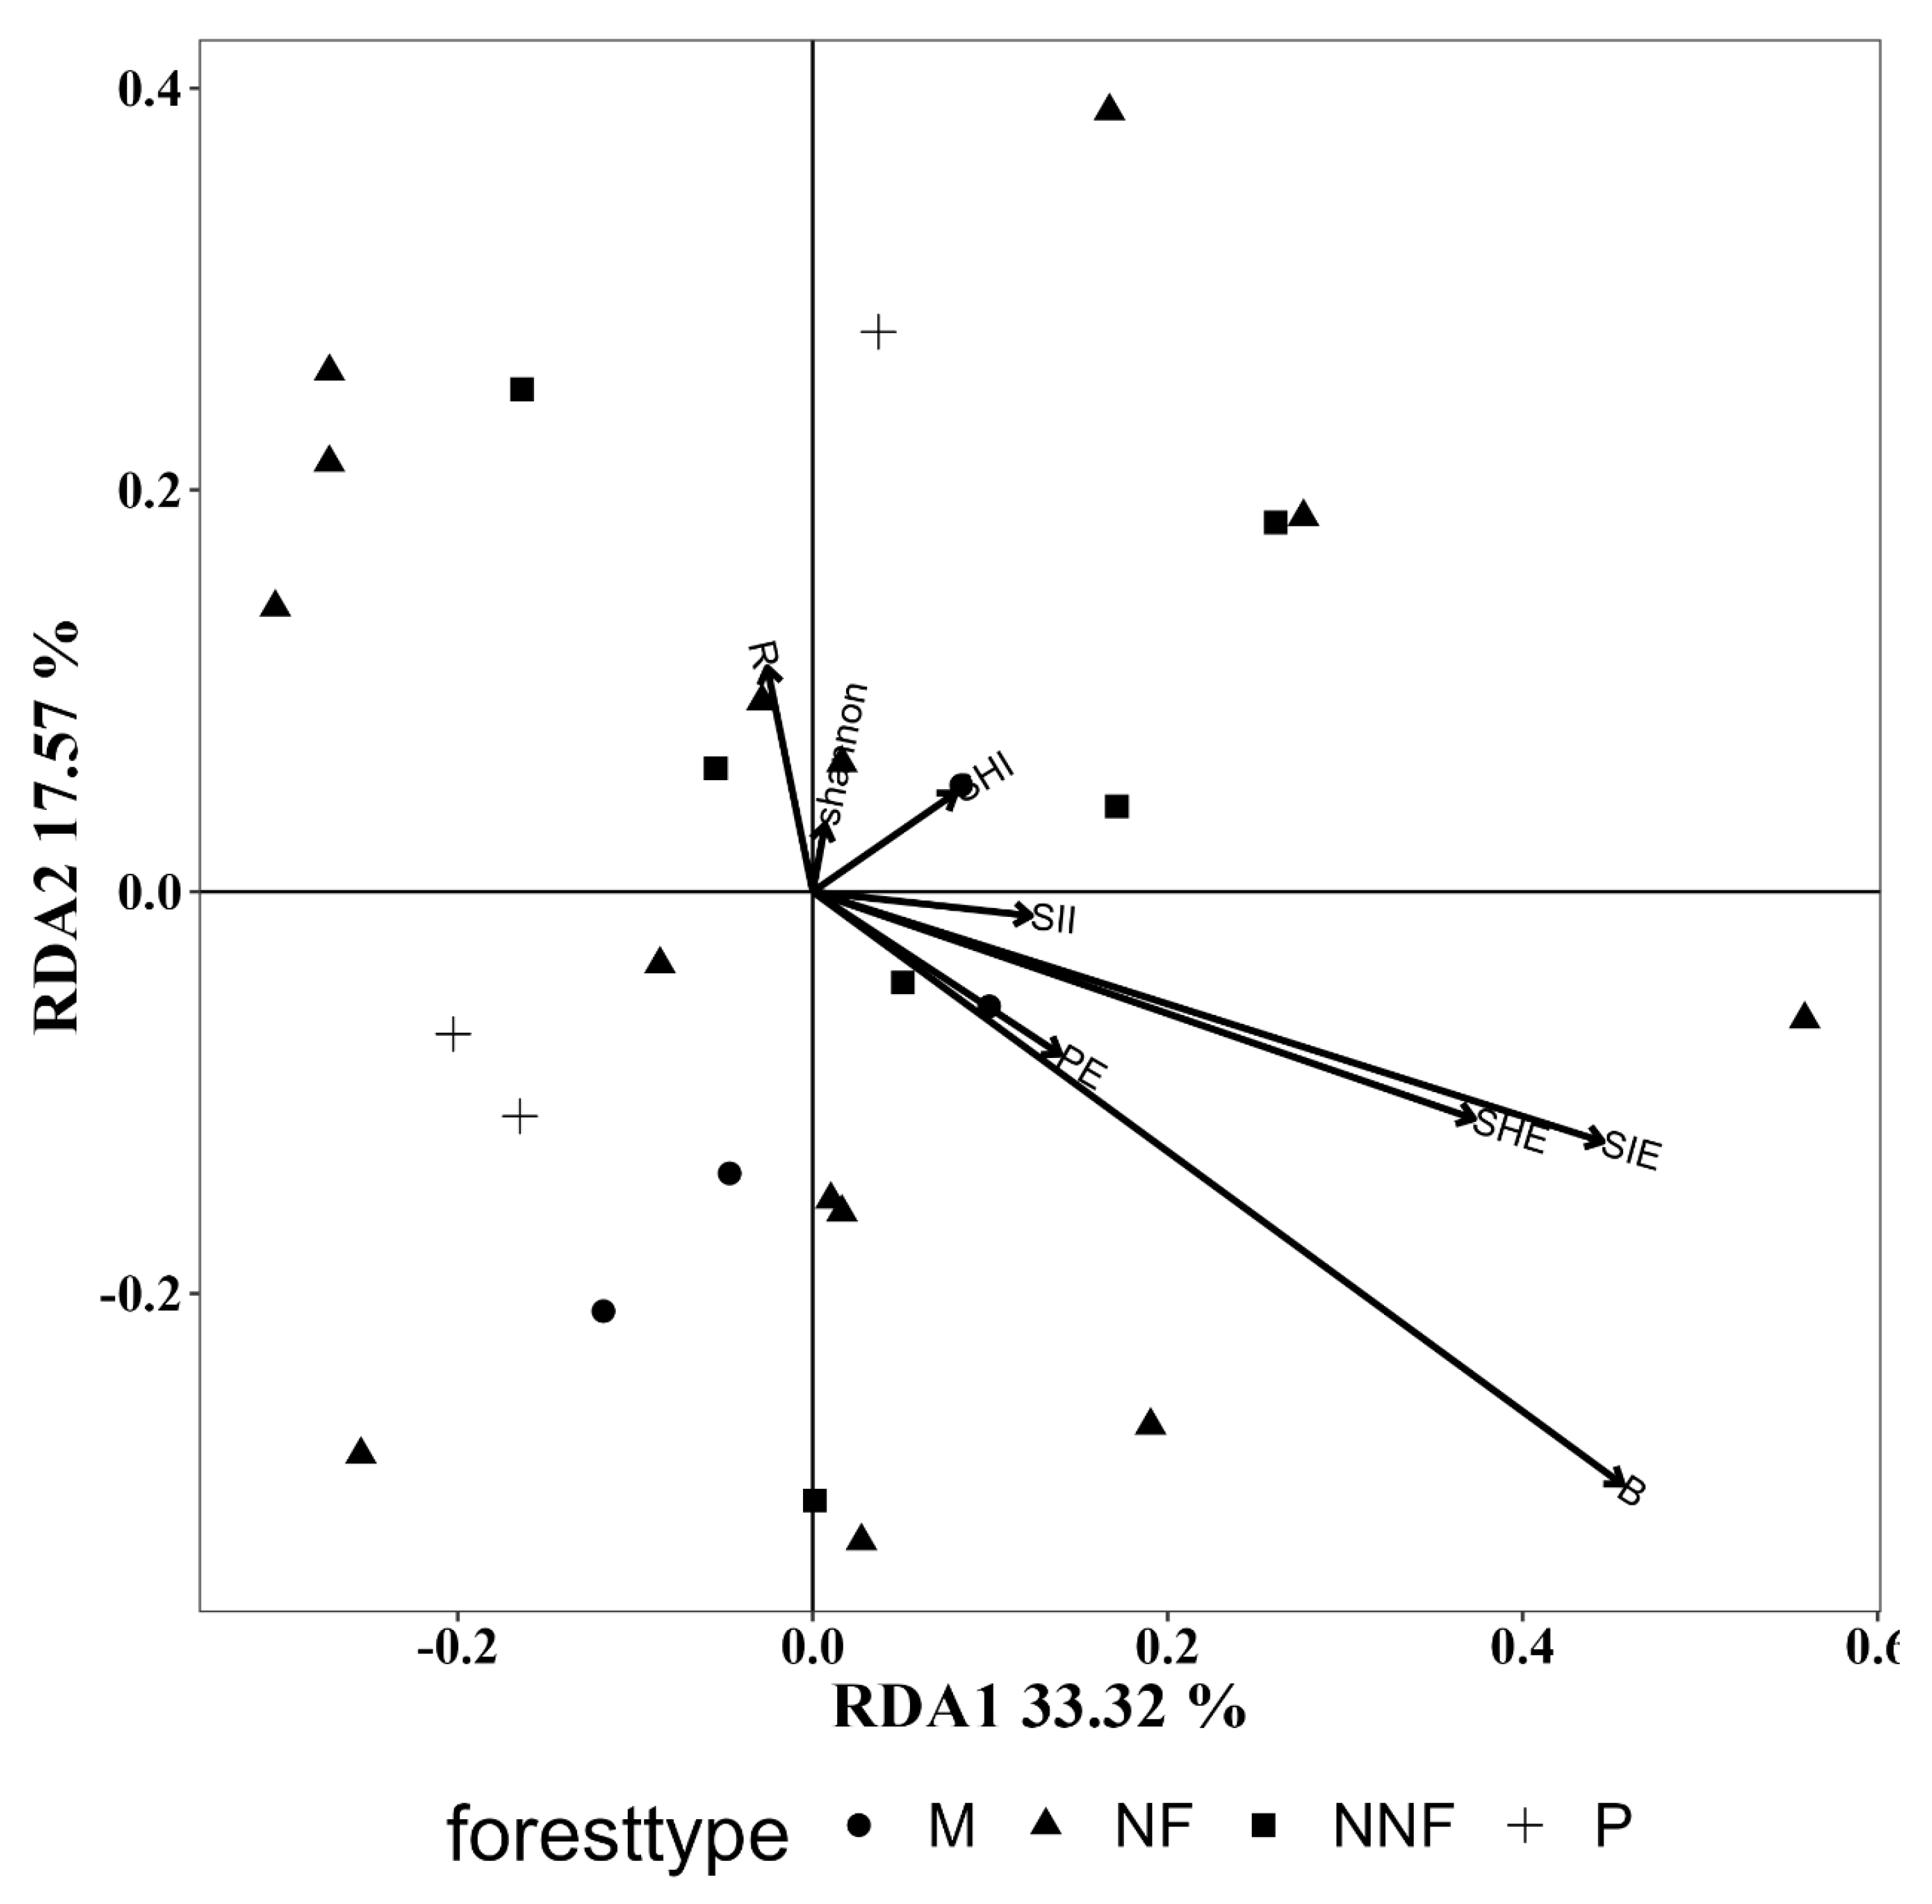
3.5.1. Influence of Tree Layer Diversity

The Monte Carlo test of RDA analysis showed that the indices of diversity had no significant effect on the functional structure of the three dimensions (Table 4). The two-dimensional RDA map showed that the diversity of the first two axes of the RDA model in functional mode, vegetative mode, and growth mode reached 50.89%, 79.33%, and 61.17%, respectively. For the functional mode, the biomass and evenness index correlated most strongly with structural changes in functional mode groups, especially the P. tabulaeformis forest stage and the mixed forest stage (Figure 10). For the vegetative mode, the evenness index also showed a strong correlation with structural changes, and the Shannon diversity index and biomass had a strong correlation with structural changes in natural secondary forests (Figure S9). For the growth mode, the community structure had the most significant response to the evenness index, which was consistent with the change between the P. tabulaeformis forest stage and the mixed forest stage. Meanwhile, the change in community structure from the mixed forest stage to the near-natural forest stage showed obvious consistency with both the Pielou evenness index and the Shannon diversity index (Figure S10).

3.5.2. Influence of Vegetation Composition

The Monte Carlo test results of RDA analysis showed that the changes in tree layer composition during near-naturalization had significant effects on soil fungal structure in three dimensions, among which the abundance of Quercus mongolica and Carpinus turczaninowii were the most significantly correlated (Table 5). RDA analysis revealed that the interpretation rates of species composition in the structure of functional, vegetative, and growth modes of soil fungi were 40.16%, 75.4%, and 48.25%, respectively. The changes in the functional and growth modes of the fungi community structure during near-naturalization responded positively to the increase in the importance of Quercus mongolica and Carpinus turczaninowii within the community (Figure 11 and Figure S11). The changes in the structure of fungal vegetative mode mainly correlated positively with the changes in the importance value of Carpinus turczaninowii (Figure S12).

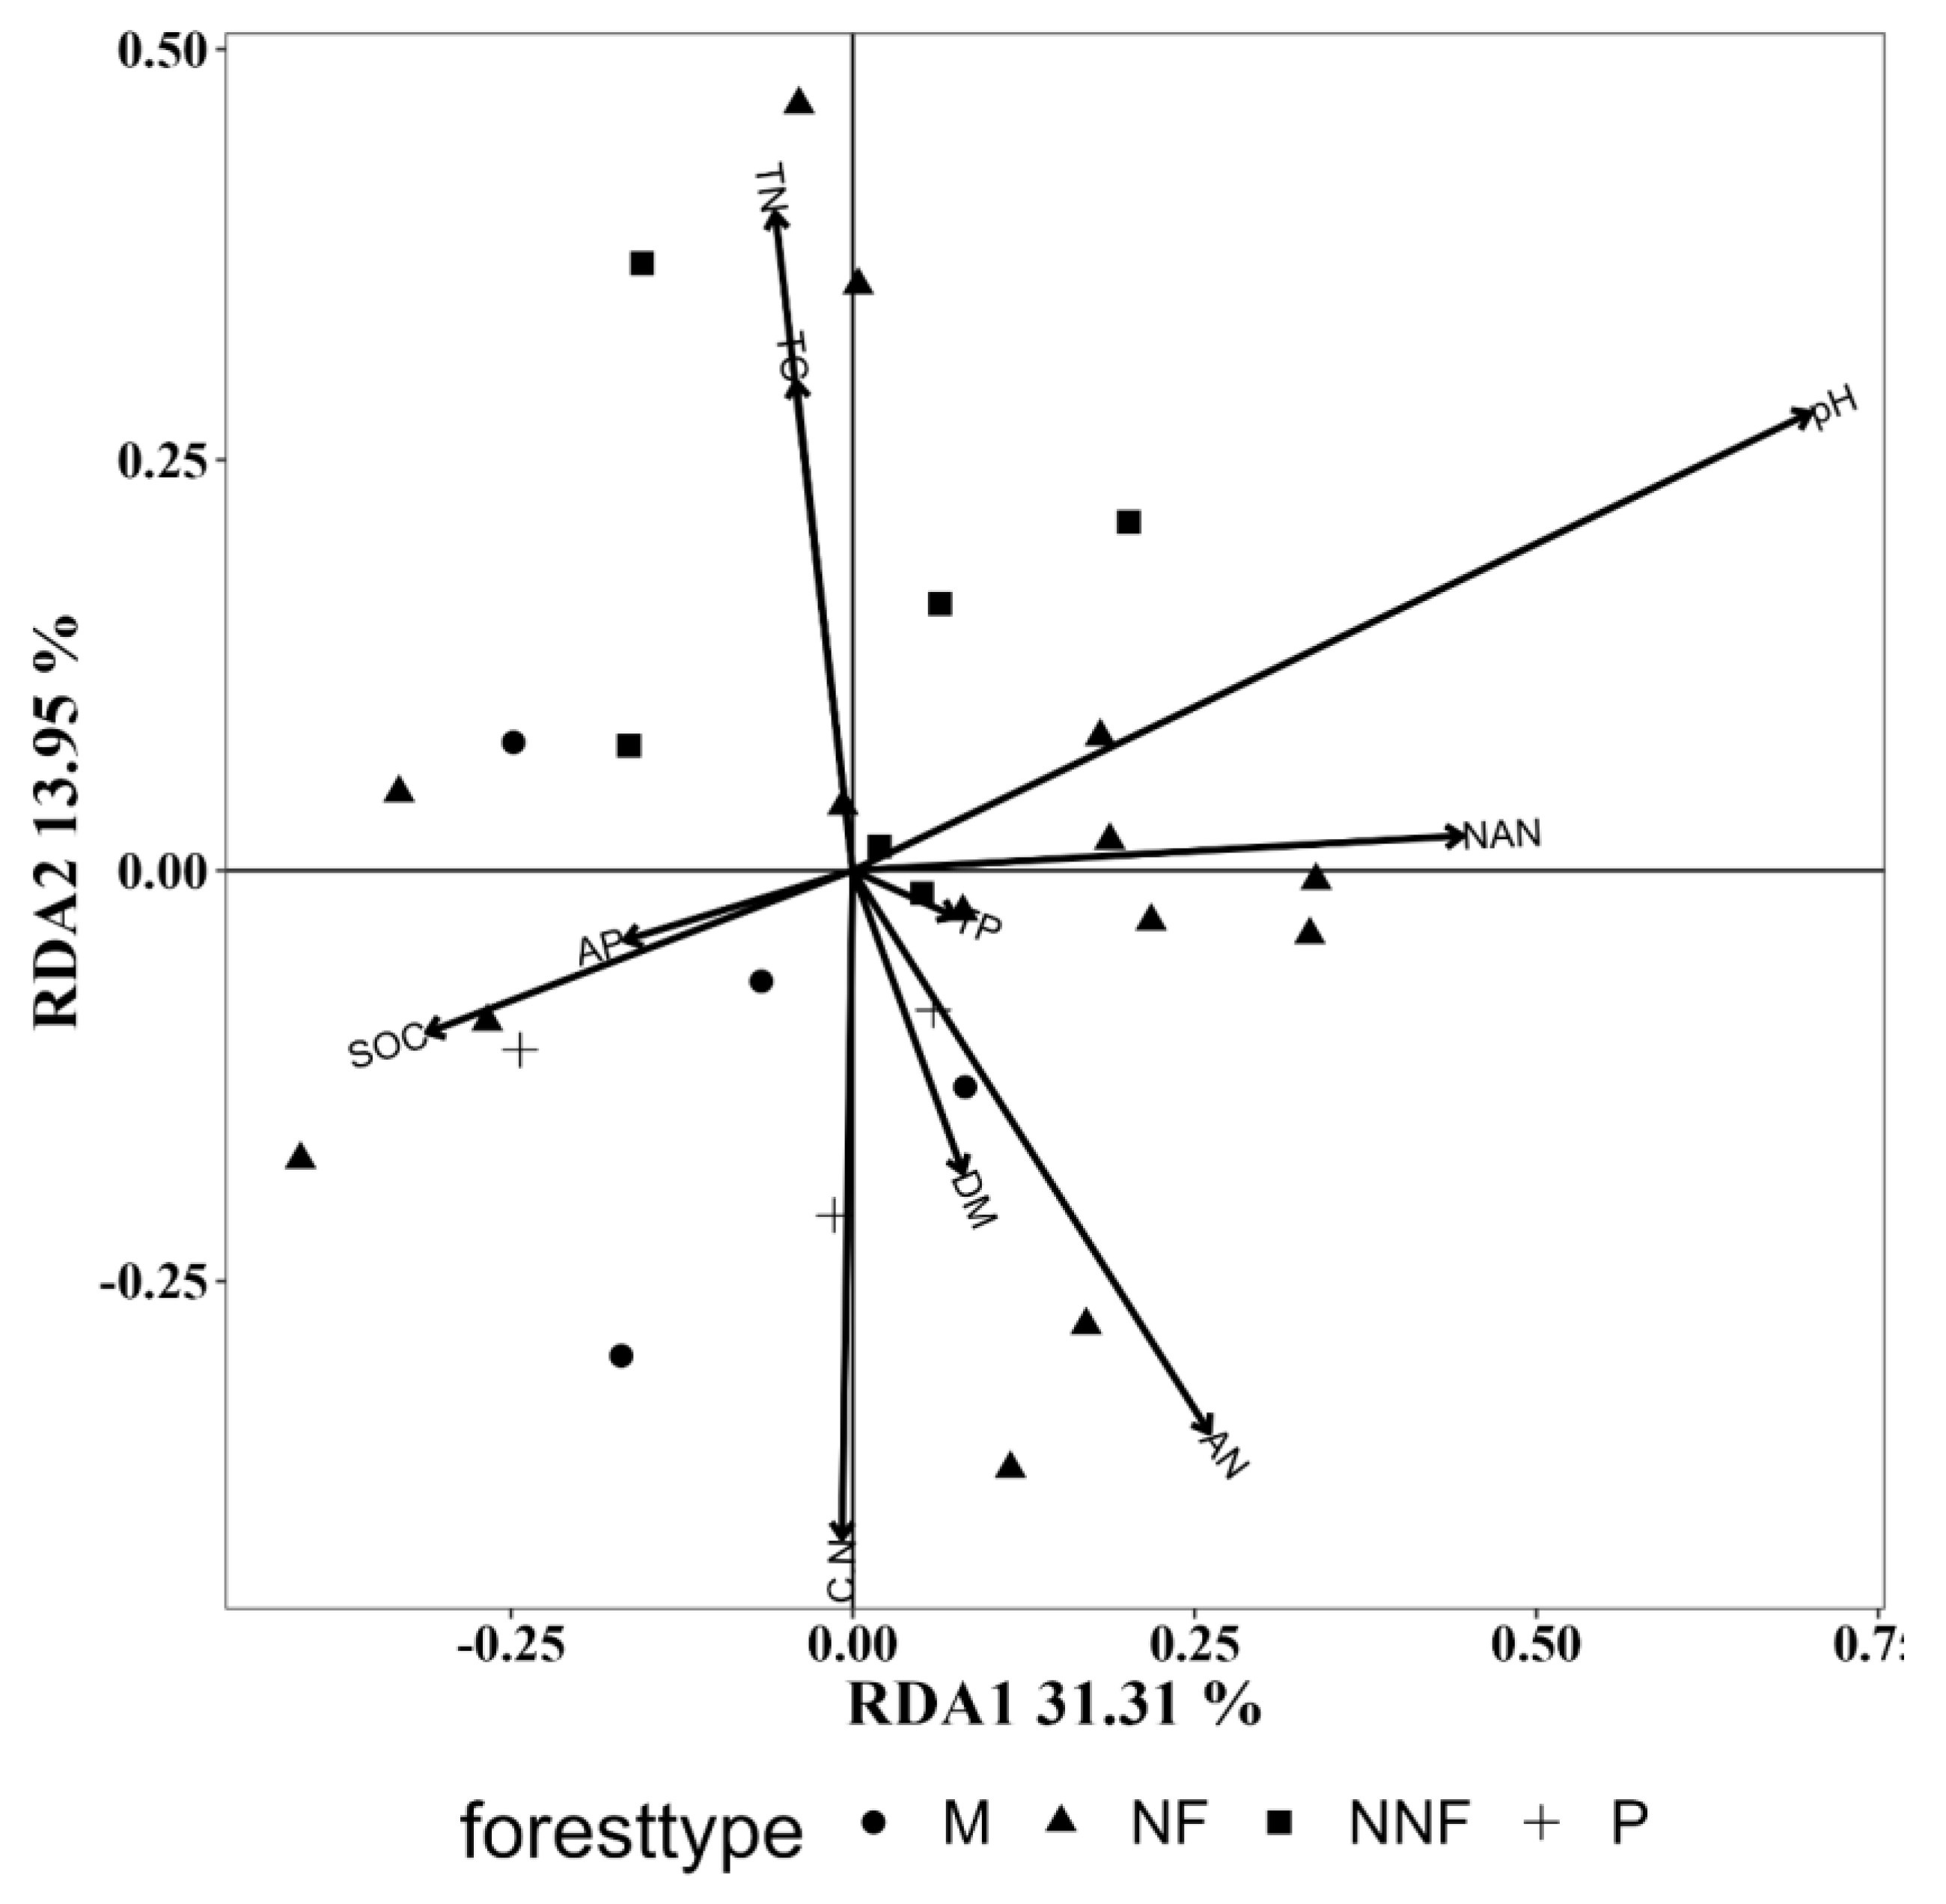
3.5.3. Influence of Soil Physicochemical Properties

The Monte Carlo test results of RDA analysis showed that soil pH significantly affected the structure of the functional mode, while pH, organic carbon content, and soil water content significantly affected the structure of the vegetative mode. Soil organic carbon, total nitrogen content, and carbon to nitrogen ratio significantly affected the structure of the growth mode (Table 6). The RDA analysis showed that the model’s interpretation of soil properties in the functional, vegetative, and growth modes returned values of 45.26%, 70.16%, and 51.52%, respectively. The functional mode of the community structure responded positively to the changes in soil pH during near-naturalization and showed a strong correlation with nitrate nitrogen content, however, it had an opposing relationship with changes in available phosphorus and organic carbon content (Figure 12). The variation in vegetative mode was most consistent with changes in dry matter content and C–N ratio during near-naturalization (Figure S13). Soil properties did not show significant effects on the structure of the growth mode during near-naturalization (Figure S14).

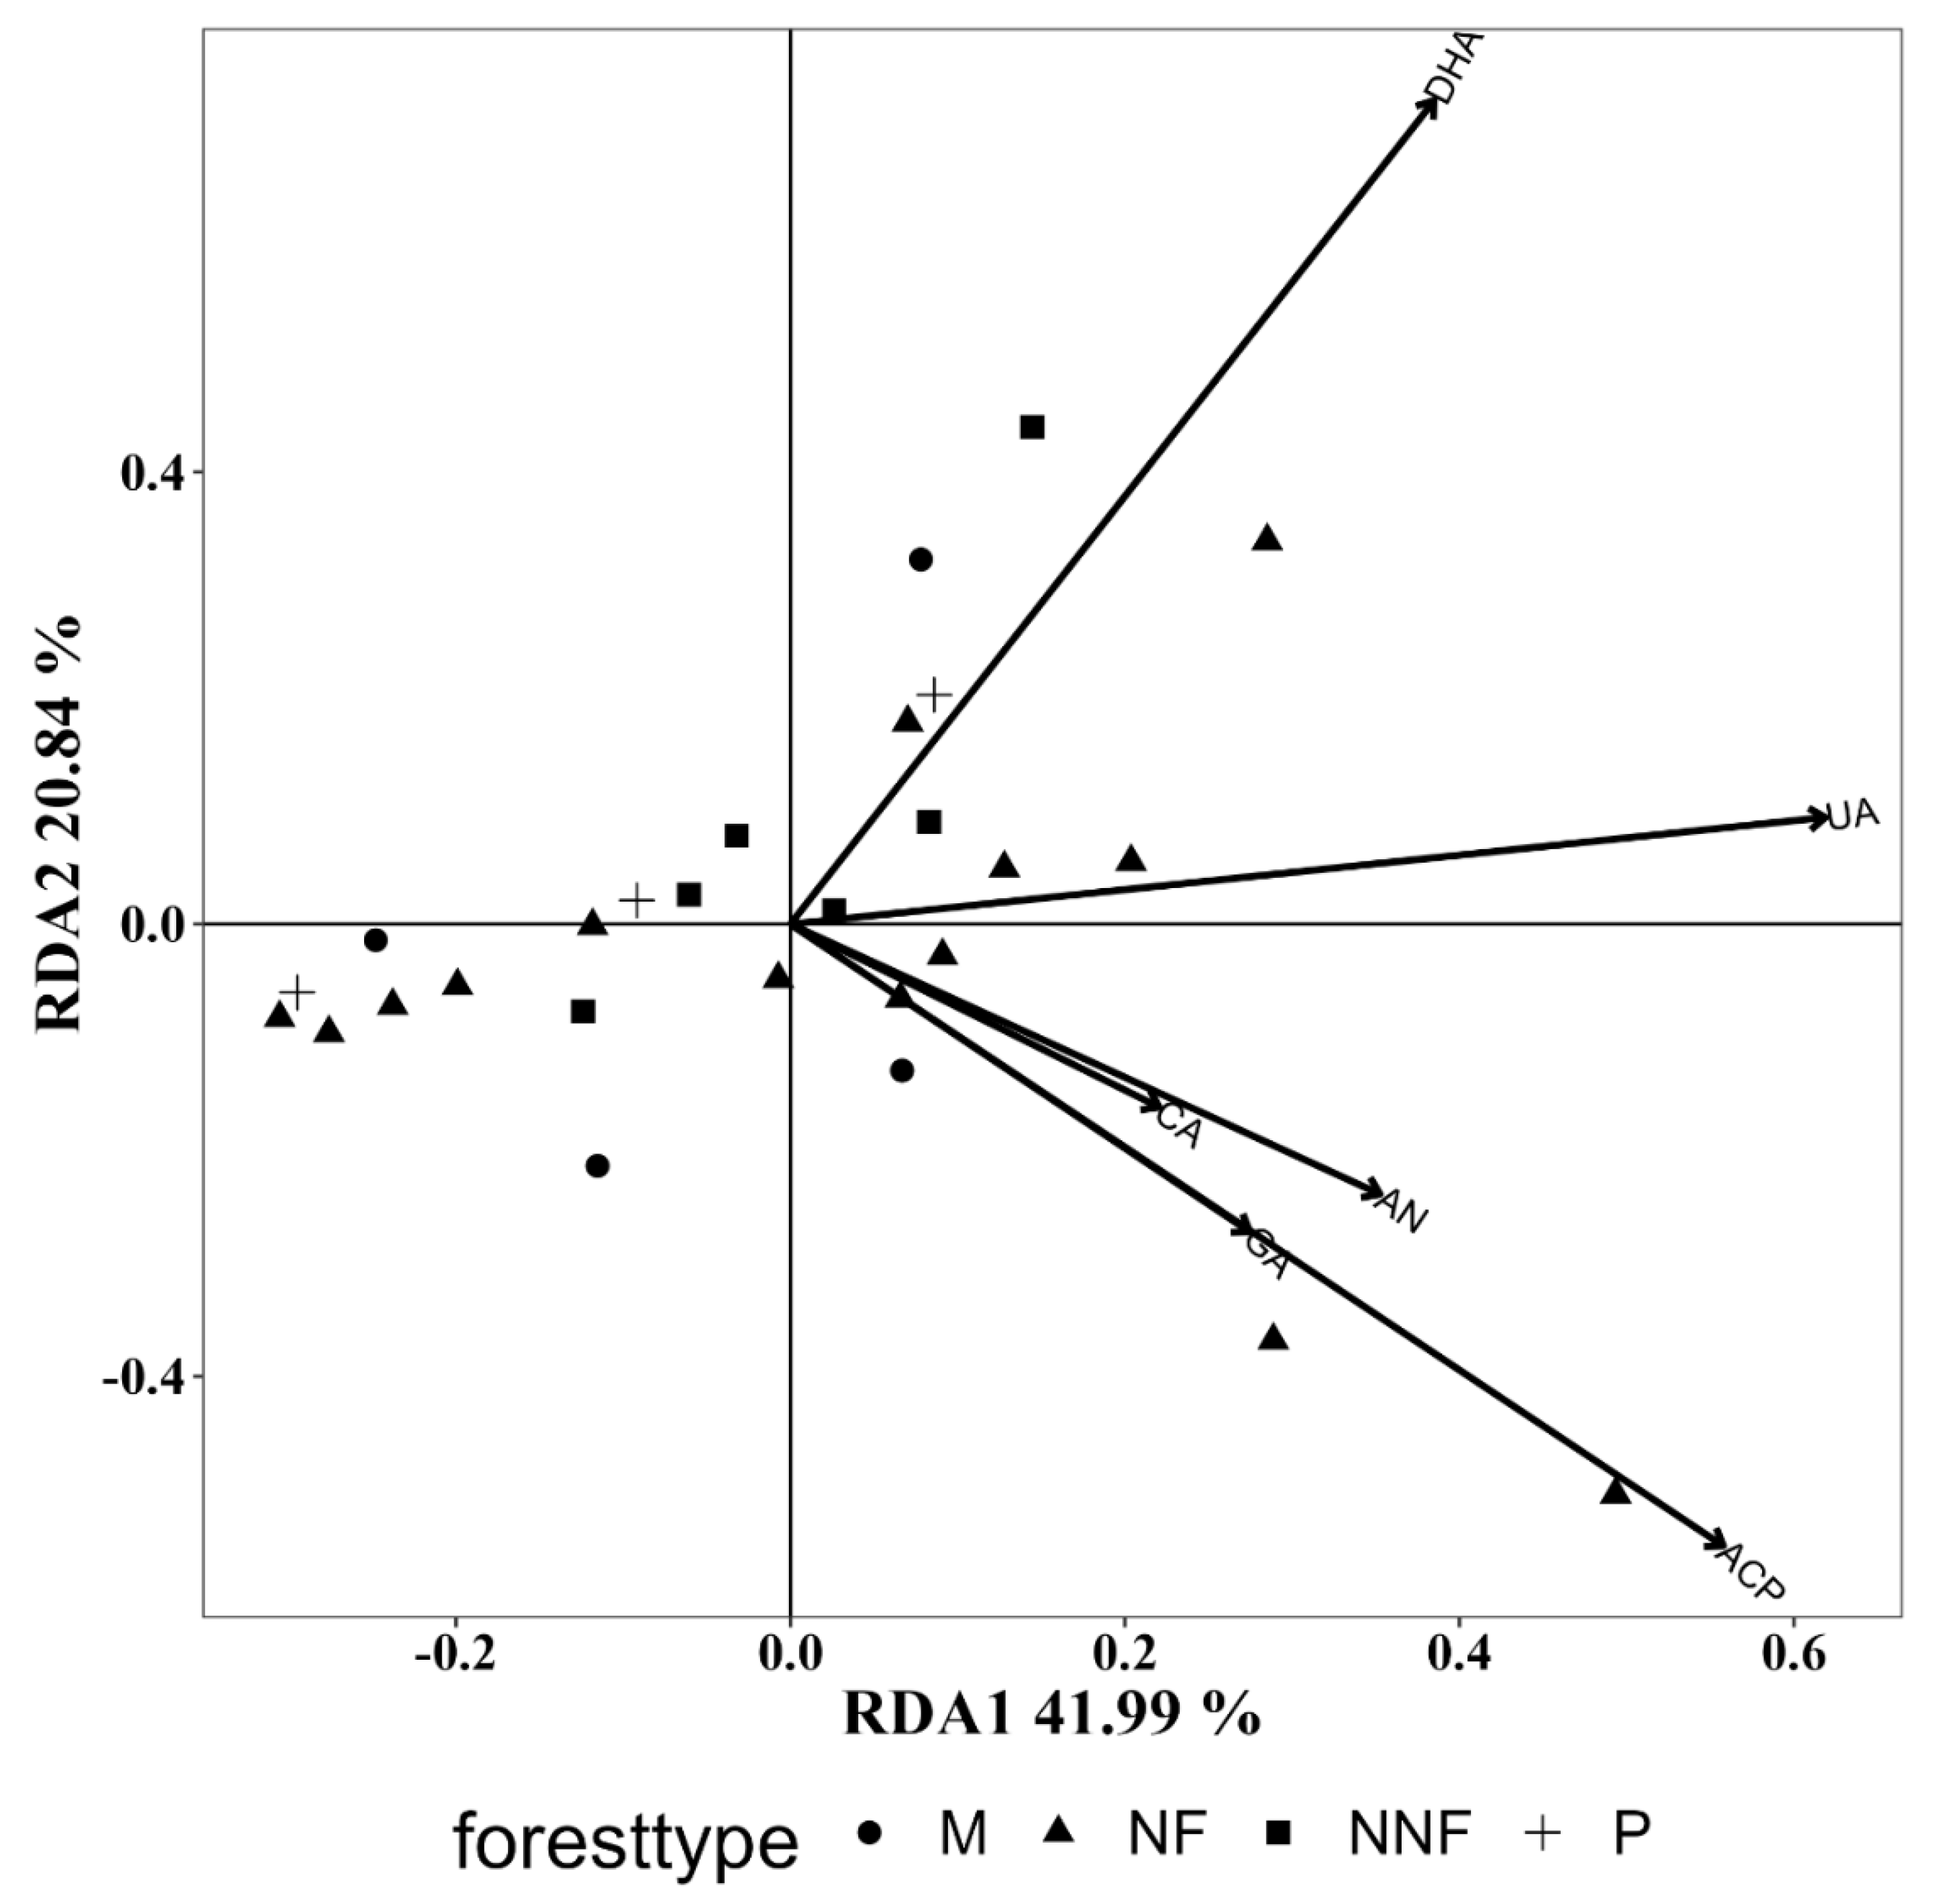
3.5.4. Influence of Soil Enzyme Activity

The Monte Carlo results of the RDA analysis showed that soil enzyme activities had significant effects on both the functional mode and growth mode, among which the activities of UA, ACP, and DHA significantly affected the former, and the activities of UA and GA significantly affected the latter (Table 7). The RDA analysis showed that the structural variation of functional mode was consistent with change in ACP activity during the progression from the P. tabulaeformis forest stage to the mixed forest stage. The community structure of the functional mode in the near-natural forest stage and the natural secondary forests was convergent on the RDA2 axis and was not significantly affected by soil enzyme activity (Figure 13). The structure of the soil fungal vegetative mode in the P. tabulaeformis forest stage and mixed forest stage was not significantly affected by soil enzyme activity but clearly changed in the near-natural forest stage, which was consistent with the change in soil GA activity (Figure S15). The community structure of the growth mode of soil fungi showed a tendency to converge gradually under the influence of enzyme activity during near-naturalization (Figure S16).

4. Discussion

This study shows that the functional abundance and structure of soil fungal communities exhibit pronounced changes during the process of near-natural succession. Among them, the abundance of pathogenic fungi in the functional mode and that of pathophysiological fungi in the nutritional mode are highest in P. tabuliformis forests. The process of near-natural succession accelerates the variation in the functional structure of fungi, while natural secondary forests tend to be stable. This change is consistent with the increase in the complexity of plant communities during succession, and this study indicates that functional structure is significantly influenced by species composition and soil properties.

4.1. Effects of Near-Naturalization on the Abundance of Fungal Functional Groups

Our results revealed that ectomycorrhizal fungi, saprophytic fungi, and plant pathogens exhibited the highest abundance ratio in the functional mode. Similarly, for the vegetative mode, saprophytic, pathologic, and symbiotic nutrients accounted for the highest abundance ratio, and such results are consistent with other research findings on boreal coniferous forests, global forests, and forests in eastern China [20,44,45,46]. Our study demonstrated that the abundance of ectomycorrhizal fungi is significantly lower in natural secondary forests than in near-naturalization succession stages, which can be linked to a decrease in soil pH [47]. Previous studies have shown that the relative abundance of soil ectomycorrhiza increased during the progression of boreal coniferous forests [44], which aligns with the progression we observed from P. tabulaeformis forests to mixed forests. Additional studies have indicated that soil rich in ECM fungi tends to be more acidic, and a low soil pH value can prevent the decline of the ECM system. This could explain the decline in the relative abundance of EMC fungi from the mixed forest stage to the near-natural forest stage [48]. Soil with a high abundance of ectomycorrhizal fungi is conducive to enhancing overall ecological functions [49,50], particularly improving nutrients and water absorption by plants. Larger networks of EM fungi can directly degrade and acquire organic forms of nitrogen and are expected to dominate ‘slow’ nitrogen-cycling ecosystems with low levels of inorganic nutrients [51,52,53]. The fluctuation of EM fungi observed in succession in our study may indicate a change in the nitrogen cycle. This study showed that the abundance of saprophytic fungi in both functional and vegetative modes decreased with near-naturalization and was lower than that in natural secondary forests. Saprophytic fungi, as important decomposers in soil, play a crucial role in nutrient cycling [54], and also serve to enhance plant water absorption [55]. This may suggest that the function and nutrient structure of soil micro-organisms during near-naturalization are, to some extent, unfavorable for the decomposition of nutrients. The decline in the abundance of pathogenic fungi is consistent with Jiang’s study [44] and may be attributed to nutrient competition between mycorrhizal fungi and free micro-organisms, during which EM fungi can secrete enzymes to degrade organic matter. Therefore, the nitrogen utilization path is more concise than the traditional nitrogen mineralization path [21]. Such concision intensifies the nitrogen restriction of free micro-organisms and inhibits the process of decomposing organic matter that they undertake [56]. Our research is also supported by findings indicating that increases in species diversity and richness are negatively correlated with the abundance of soil pathogens [57]. The decrease in the abundance of clavarioid during near-naturalization in the growth mode may be related to changes in soil factors and competition among species.

4.2. Effects of Environmental Factors on the Abundance of Functional Groups of Fungi

The results of this study showed that the biomass of the tree layer was significantly correlated with the abundance of saprophytic fungi groups during near-naturalization. This may due to increased biomass and biodiversity, which enhance litter input to the soil, providing suitable resources for fungi. Relevant studies confirm that plant diversity significantly drives changes in fungal composition [44]. Our study also revealed that species composition is an influential factor, with Carpinus turczaninowii’s importance positively correlating with the abundance of ectomycorrhizal fungi, as supported by their tree-host specificity [58] and role in symbiotic relationships [59]. Soil pH, organic carbon, and soil nitrogen contents significantly affect functional dimensions, as soil quality is closely linked to litter changes caused by species shifts, leading to microbial community recombination [60]. Thus, changes in tree species, rather than soil nutrients, at different successional stages may cause fungal changes. pH positively correlates with the abundance of litter saprophytes, which have been confirmed as a main factor affecting fungal functional modes during forest conversion in Southeast Asia [47]. Soil enzyme activities such as urease, acid phosphatase, and dehydrogenase correlate with functional mode groups, with fungi being more sensitive to these changes than other microbial groups [61]. Some studies have shown that saprophytic fungi are most closely related to higher soil nutrient levels. This study shows that variation in dehydrogenase activity aligns with the abundance of saprophytic fungi, possibly due to higher nutrient levels in certain soils [12].

4.3. Effects of Near-Naturalization on the Functional Structure of the Fungal Community

This study demonstrated that, during near-naturalization, the co-ordinate points representing the fungal community’s functional, vegetative, and growth mode structures exhibited a tendency to diverge. This divergence likely stems from the functional structure of the fungal community adapting to the transformations occurring within these three dimensions during the near-naturalization process [62]. The functional characteristics of the fungal community remained relatively stable in the Pinus tabulaeformis forest stage and the natural secondary forests that had not undergone near-naturalization. This stability can be attributed to the consistent quality and quantity of litter returned to the soil by plants, mirroring the long-term adaptability of species composition and soil environmental stability. No significant differences were observed in the functional structure of fungal community across the three stages of near-naturalization, as assessed along these three dimensions, suggesting that changes in soil fungal functional structure are not solely driven by alterations in above-ground species, but are also influenced by multiple complex factors.

4.4. Effects of Environmental Factors on the Functional Structure of the Soil Fungal Community

With respect to the influence of environmental factors on fungal community functional structure, our analysis indicates that, while vegetative composition, plant diversity, soil properties, and soil enzyme activity do not show an overarching significant effect on the structure of fungal functional groups, notable effects can be identified within each of these categories. Prior research underscores the ability of tree species composition to modulate soil’s abiotic attributes, such as pH and nutrient availability [63], which serve as pivotal links between plant vitality and soil microbial community dynamics [64,65]. Quercus Mongolica and Carpinus turczaninowii emerged as highly influential across multiple functional dimensions. This observation may stem from the distinct role played by Quercu mongolica in altering community composition during near-naturalization, and the rapid regeneration of Carpinus turczaninowii under forest conditions. In terms of soil nutrients’ effects on the fungal community’s functional structure, soil pH, total nitrogen content, and organic carbon are well-established and critical determinants of fungal community composition and function [66,67].

5. Conclusions

This study focused on variation in the functional structure of the soil fungal community and the role of environmental drivers during the near-naturalization of coniferous plantations in the North Warm Temperate Zone. Our results showed that variation in fungal functional structure intensifies as near-naturalization progresses, and is significantly influenced by changes in species composition, particularly Quercus mongolica and Carpinus turczaninowii. Additionally, soil pH, dry matter content, carbon-to-nitrogen ratio, and nitrate content also significantly affect the functional structure of fungi. This study provides a new perspective that will help to develop our collective understanding of the functional adaptation of soil fungi to forest succession, and the interaction of above- and below-ground mechanisms in artificial forest ecosystems.

Supplementary Materials

The following supporting information can be downloaded at: https://www.mdpi.com/article/10.3390/f15091540/s1, Figure S1: Correlation between tree layer diversity index and the abundance of soil fungal vegetative mode. Note: B Biomass; R Richness index; SHI Shannon-Winner index; SII Simpson index; SHE Shannon-Winner evenness index; SIE: Simpson evenness index; PE Pielou evenness index; Figure S2: Correlation between tree layer diversity index and the abundance of soil fungal growth mode Note: B Biomass; R Richness index; SHI Shannon-Winner index; SII Simpson index; SHE Shannon-Winner evenness index; SIE: Simpson evenness index; PE Pielou evenness index; Figure S3: Correlation between tree composition in the tree layer and the abundance of soil fungal vegetative mode Note: 1 Pinus tabulaeformis; 2 Quercus variabilis; 3. Juglans mandshuruca; 4. Quercus mogolica; 5. Tilia amurensis; 6. Fraxinus chinensis; 7. Carpinus turczaninowii; 8. Quercus aliena; 9. Quercus dentata; 10. Tetradium daniellii; Figure S4: Correlation between species composition in the tree layer and the abundance of soil fungal growth mode Note: 1 Pinus tabulaeformis; 2 Quercus variabilis; 3. Juglans mandshuruca; 4. Quercus mogolica; 5. Tilia amurensis; 6. Fraxinus chinensis; 7. Carpinus turczaninowii; 8. Quercus aliena; 9. Quercus dentata; 10 Tetradium daniellii; Figure S5: Correlation between soil properties and the abundance of soil fungal vegetative mode Notes: SOC Soil organic carbon; AP Available phosphorus; TP Total phosphorus; NAN Nitrate nitrogen; DM Dry matter content; 89TC Total carban; C.N Carbon nitrogen ratio; TN Total nitrogen; AN Ammonia nitrogen; Figure S6: Correlation between soil properties and the abundance of soil fungal growth mode Notes: SOC: Soil organic carbon; AP Available phosphorus; TP Total phosphorus; NAN Nitrate nitrogen; DM Dry matter content; TC Total carbon; C.N Carbon nitrogen ratio; TN Total nitrogen; AN Ammonia nitrogen; Figure S7: Correlation between soil enzyme activity and the abundance of soil fungal trophic mode groups Notes: CA Cellulase; UA Urease; GA β-Glucosidase; ACP Acid phosphatase; DHA Dehydrogenase; Figure S8:Correlation between soil enzyme activity and the abundance of soil fungal growth mode Notes: CA Cellulase; UA Urease; GA β-Glucosidase; ACP Acid phosphatase; DHA Dehydrogenase; Figure S9: RDA analysis results of plant diversity on functional structure of soil fungal community in vegetative mode; Note: P P. tabulaeformis forest stage, M mixed forest stage, NNF near-natural forest stage; NF natural secondary forests; B Biomass; R Richness index; SHI Shannon-Winner index; SII Simpson index; SHE Shannon-Winner evenness index; SIE Simpson evenness index; PE Pielou evenness index; Figure S10: RDA analysis results of plant diversity on functional structure of soil fungal community in growth mode; Note: P P. tabulaeformis forest stage, M mixed forest stage, NNF near-natural forest stage; NF natural secondary forests; B Biomass; R Richness index; SHI Shannon-Winner index; SII Simpson index; SHE Shannon-Winner evenness index; SIE Simpson evenness index; PE Pielou evenness index; Figure S11: RDA analysis results of plant species composition on functional structure of soil fungal community in growth mode; Note P: P. tabulaeformis forest stage; M mixed forest stage; NNF near-natural forest stage; NF: natural secondary forests; 1 Pinus tabu-laeformis; 2 Quercus variabilis; 3. Juglans mandshuruca; 4. Quercus mogolica; 5. Tilia amurensis; 6. Fraxinus chinensis; 7. Carpinus turcza-ninowii; 8. Quercus aliena; 9. Quercus dentata; 10 Tetradium daniellii; Figure S12: RDA analysis results of plant species composition on functional structure of soil fungal community in vegetative mode; Note P: P. tabulaeformis forest stage; M mixed forest stage; NNF near-natural forest stage; NF: natural secondary forests; 1 Pinus tabulaeformis; 2 Quercus variabilis; 3. Juglans mandshuruca; 4. Quercus mogolica; 5. Tilia amurensis; 6. Fraxinus chinensis; 7. Carpinus turczaninowii; 8. Quercus aliena; 9. Quercus dentata; 10 Tetradium daniellii; Figure S13: RDA analysis results of soil physicochemical properties on functional structure of soil fungal community in vegetative mode; Note: P P. tabulaeformis forest stage, M mixed forest stage, NNF near-natural forest stage; NF natural secondary forests; SOC Soil organic carbon AP Available phosphorus TP Total phosphorus; NAN Nitrate nitrogen; DM Dry matter content; TC Total carban; C.N Carbon nitrogen ratio; TN Total nitrogen; AN Ammonia nitrogen; Figure S14: RDA analysis results of soil physicochemical properties on functional structure of soil fungal community in growth mode; Note: P P. tabulaeformis forest stage, M mixed forest stage, NNF near-natural forest stage; NF natural secondary forests; SOC Soil organic carbon AP Available phosphorus TP Total phosphorus; NAN Nitrate nitrogen; DM Dry matter content; TC Total carban; C.N Carbon nitrogen ratio; TN Total nitrogen; AN Ammonia nitrogen; Figure S15: RDA analysis results of soil enzyme activity on functional structure of soil fungal community in vegetative mode; Note: P P. tabulaeformis forest stage; M mixed forest stage; NNF near-natural forest stage; NF natural secondary forests; CA Cellulase; UA Urease; GA β-Glucosidase; ACP Acid phosphatase; DHA Dehydrogenase; Figure S16: RDA analysis results of soil enzyme activity on functional structure of soil fungal community in growth mode; Note: P P. tabulaeformis forest stage; M mixed forest stage; NNF near-natural forest stage; NF natural secondary forests; CA Cellulase; UA Urease; GA β-Glucosidase; ACP Acid phosphatase; DHA Dehydrogenase; Table S1. Basic information of the community quadrats.

Author Contributions

Methodology, C.C.; Investigation, Z.Q., H.L., C.C. and C.L.; Data curation, Z.Q. and H.L.; Writing—original draft, Z.Q.; Writing—review & editing, Z.Q., C.C., C.L. and J.S.; Funding acquisition, J.S. All authors have read and agreed to the published version of the manuscript.

Funding

This research received no external funding.

Data Availability Statement

The raw data supporting the conclusions of this article will be made available by the authors on request.

Conflicts of Interest

The authors declare no conflict of interest.

References

  1. Sasmito, S.-D.; Kuzyakov, Y.; Lubis, A.-A.; Murdiyarso, D.; Hutley, L.-B.; BAchri, S.; Friess, D.-A.; Martius, C.; Borchard, N. Organic carbon burial and sources in soils of coastal mudflat and mangrove ecosystems. Catena 2020, 187, 104414. [Google Scholar] [CrossRef]
  2. Li, X.-J.; Li, X.-R.; Wang, X.-P.; Yang, H.-T. Changes in soil organic carbon fractions after afforestation with xerophytic shrubs in the Tengger Desert, northern China. Eur. J. Soil. Sci. 2016, 67, 184–195. [Google Scholar] [CrossRef]
  3. Zhou, Q.-Q.; Li, F.; Cai, X.-A.; Rao, X.-Q.; Zhou, L.-X.; Liu, Z.-F.; Lin, Y.-B.; Fu, S.-L. Survivorship of plant species from soil seedbank after translocation from subtropical natural forests to plantation forests. For. Ecol. Manag. 2019, 432, 741–747. [Google Scholar] [CrossRef]
  4. Chen, G.-P.; Gao, Z.-Y.; Zu, L.-H.; Tang, L.-L.; Yang, T.; Feng, X.-M.; Zhao, T.-J.; Shi, F.-C. Soil aggregate characteristics and stability of soil carbon stocks in a Pinus tabulaeformis plantation. New For. 2017, 48, 837–853. [Google Scholar] [CrossRef]
  5. Peay, K.-G.; Baraloto, C.; Fine, P.-V.-A. Strong coupling of plant and fungal community structure across western Amazonian rainforests. ISME J. 2013, 7, 1852–1861. [Google Scholar] [CrossRef]
  6. Bahram, M.; Plme, S.; Kljalg, U.; Zarre, S.; Tedersoo, L. Regional and local patterns of ectomycorrhizal fungal diversity and community structure along an altitudinal gradient in the Hyrcanian forests of northern Iran. New Phytol. 2015, 193, 465–473. [Google Scholar] [CrossRef] [PubMed]
  7. Holtkamp, R.; van der Wal, A.; Kardol, P.; van der Putten, W.-H.; de Ruiter, P.-C.; Dekker, S.-C. Modelling C and N mineralisation in soil food webs during secondary succession on ex-arable land. Soil Biol. Biochem. 2021, 43, 251–260. [Google Scholar] [CrossRef]
  8. Kardol, P.; Todd, D.-E.; Hanson, P.-J.; Mulholland, P.-J. Long-term successional forest dynamics: Species and community responses to climatic variability. J. Veg. Sci. 2021, 21, 627–642. [Google Scholar] [CrossRef]
  9. Sun, C.; Liu, G.; Xue, S. Natural succession of grassland on the Loess Plateau of China affects multifractal characteristics of soil particle-size distribution and soil nutrients. Ecol. Res. 2016, 31, 891–902. [Google Scholar] [CrossRef]
  10. Jaroslav, Š.; Petra, D.; Michaela, U.; Mirka, P.; Tomáš, C.; Jan, F.; Petr, B. Dominant trees affect microbial community composition and activity in post-mining afforested soils. Soil Biol. Biochem. 2013, 56, 105–115. [Google Scholar] [CrossRef]
  11. Tedersoo, L.; Bahram, M.; Polme, S.; Kõljalg, U.; Yorou, N.S.; Wijesundera, R.; Ruiz, L.V.; Vasco-Palacios, A.M.; Thu, P.Q.; Suija, A.; et al. Global diversity and geography of soil fungi. Science 2014, 346, 1078. [Google Scholar] [CrossRef]
  12. Wu, D.; Zhang, M.-M.; Peng, M.; Sui, X.-H.; Li, W.; Sun, G.-Y. Variations in soil functional fungal community structure associated with pure and mixed plantations in Typical Temperate forests of China. Front. Microbiol. 2019, 10, 1636. [Google Scholar] [CrossRef] [PubMed]
  13. Qiu, Z.-L.; Shi, C.; Zhang, M.; Shi, F.-C. Effects of close-to-nature management of plantation on the structure and ecological functions of soil microorganisms with different habitat specialization. Plant Soil 2022, 482, 347–367. [Google Scholar] [CrossRef]
  14. Flores-Rentería, D.; Rincón, A.; Valladares, F.; Yuste, J. Agricultural matrix affects differently the alpha and beta structural and functional diversity of soil microbial communities in a fragmented mediterranean holm oak forest. Soil Biol. Biochem. 2016, 92, 79–90. [Google Scholar] [CrossRef]
  15. Žifčáková, L.; Vetrovsky, T.; Howe, A.; Baldrian, P. Microbial activity in forest soil reflects the changes in ecosystem properties between summer and winter. Environ. Microbiol. 2016, 18, 288–301. [Google Scholar] [CrossRef] [PubMed]
  16. Frᶏc, M.; Hannula, S.-E.; Bełka, M.; Jędryczka, M. Fungal biodiversity and their role in soil health. Front. Microbiol. 2018, 9, 707. [Google Scholar] [CrossRef] [PubMed]
  17. Genre, A.; Lanfranco, L.; Perotto, S.; Bonfante, P. Unique and common traits in mycorrhizal symbioses. Nat. Rev. Microbiol. 2020, 18, 649–660. [Google Scholar] [CrossRef]
  18. Tomer, A.; Singh, R.; Singh, S.-K.; Dwivedi, S.-A.; Reddy, C.-U.; Ram, M.; Keloth, A.; Rachel, R. Role of fungi in bioremediation and environmental sustainability. In Fungal Biology; Springer: Cham, Switzerland, 2021; pp. 187–200. [Google Scholar] [CrossRef]
  19. Zhang, Z.; Yuan, Y.; Liu, Q.; Yin, H. Plant nitrogen acquisition from inorganic and organic sources via root and mycelia pathways in ecto mycorrhizal alpine forests. Soil Biol. Biochem. 2019, 136, 107517. [Google Scholar] [CrossRef]
  20. Teste, F.-P.; Jones, M.-D.; Dickie, I.-A. Dual-mycorrhizal plants: Their ecology and relevance. New Phytol. 2020, 225, 1835–1851. [Google Scholar] [CrossRef]
  21. Averill, C.; Turner, B.L.; Finzi, A.C. Mycorrhiza-mediated competition between plants and decomposers drives soil carbon storage. Nature 2014, 505, 543–545. [Google Scholar] [CrossRef]
  22. Li, X.-L.; Qu, Z.-L.; Zhang, Y.-M.; Ge, Y.; Sun, H. Soil fungal community and potential function in different forest ecosystems. Diversity 2022, 14, 520. [Google Scholar] [CrossRef]
  23. Frey, S.-D. Mycorrhizal Fungi as Mediators of Soil Organic Matter Dynamics. Annu. Rev. Ecol. Evol. Syst. 2019, 50, 237–259. [Google Scholar] [CrossRef]
  24. Chen, L.; Xiang, W.-H.; Wu, H.-L.; Ouyang, S.; Lei, P.-F.; Hu, Y.-J.; Ge, T.-D.; Ye, J.; Kuzyakov, Y. Contrasting patterns and drivers of soil fungal communities in subtropical deciduous and evergreen broadleaved forests. Appl. Microbiol. Biotechnol. 2019, 103, 5421–5433. [Google Scholar] [CrossRef]
  25. Nguyen, N.-H.; Song, Z.-W.; Bates, S.-T.; Branco, S.; Tedersoo, L.; Menke, J.; Schilling, J.-S.; Kennedy, P.-G. FUNGuild: An open annotation tool for parsing fungal community datasets by ecological guild. Fungal Ecol. 2016, 20, 241–248. [Google Scholar] [CrossRef]
  26. Bello, A.; Wang, B.; Zhao, Y.; Yang, W.; Ogundeji, A.; Deng, L.; Egbeagu, U.-U.; Yu, S.; Zhao, L.-Y.; Li, D.-T.; et al. Composted biochar affects structural dynamics, function and co-occurrence network patterns of fungi community. Sci. Total Environ. 2021, 775, 145672. [Google Scholar] [CrossRef]
  27. Põlme, S.; Abarenkov, K.; Nisson, R.-H.; Lindahl, B.D.; Clemmensen, K.E.; Kauserud, H.; Nguyen, N.; Kjøller, R.; Bates, S.T.; Baldrian, P.; et al. FungalTraits: A user-friendly traits database of fungi and fungus-like stramenopiles. Fungal Divers. 2020, 105, 1–16. [Google Scholar] [CrossRef]
  28. Qiu, Z.-L.; Zhang, M.; Wang, K.-F.; Shi, F.-C. Vegetation community dynamics during naturalized developmental restoration of Pinus tabulaeformis plantation in North warm temperate zone. J. Plant Ecol. 2023, 16, rtac102. [Google Scholar] [CrossRef]
  29. Feroz, S.-M.; Hagihara, Y.-A.; Hagihara, A. Stand stratification and woody species diversity of a subtropical forest in limestone habitat in the northern part of Okinawa Island. J. Plant Res. 2008, 121, 329–337. [Google Scholar] [CrossRef]
  30. Shannon, C.-E.; Weaver, W. The Mathematical Theory of Communication; University of Illinois Press: Urbana, IL, USA, 1949. [Google Scholar]
  31. Simpson, E.-H. Measurement of diversity. Nature 1949, 163, 688. [Google Scholar] [CrossRef]
  32. Pielou, E.-C. An Introduction to mathematical ecology. BioScience 2011, 24, 7–12. [Google Scholar]
  33. HJ615–2011b; Soil Determination of Orgaic Carbon-Potassium Dichromate Oxidation Spectrophotometric Method. Ministry of Environmental Protection, PRC: Beijing, China, 2011. (In Chinese)
  34. HJ634–2012; Soil-Determination of Ammonium, Nitrite and Nitrate by Extraction with Potassium Chloride Solution-Spectrophotometric Methods. Ministry of Environmental Protection, PRC: Beijing, China, 2012. (In Chinese)
  35. GB/T 32737–2016; Determination of Nitrate Nitrogen in Soil-Ultraviolet Spectrophotometry Method. Standardization Administration of China: Beijing, China, 2016. (In Chinese)
  36. NY/T 1121.7–2014; Soil Testing-Method for Determination of Available Phosphorus in Soil. Ministry of Agriculture, PRC: Beijing, China, 2012. (In Chinese)
  37. HJ613–2011a; Soil-Determination of Dry Matter and Water Content-Gravimetric Method. Ministry of Environmental Protection, PRC: Beijing, China, 2011. (In Chinese)
  38. Lin, X.-G. Principles and Methods of Soil Microbiology Research; High Education Press: Beijing, China, 2010. (In Chinese) [Google Scholar]
  39. White, T.-J.; Bruns, T.; Lee, S.; Taylor, J. Amplification and direct sequencing of fungal ribosomal RNA genes for phylogenetics. In PCR Protocols: A Guide to Methods and Applications; Academic Press: Cambridge, MA, USA, 1990; Volume 18, pp. 315–322. [Google Scholar]
  40. Bolger, A.-M.; Lohse, M.; Usadel, B. Trimmomatic: A flexible trimmer for Illumina sequence data. Bioinformatics 2014, 30, 2114–2120. [Google Scholar] [CrossRef] [PubMed]
  41. Martin, M. Cutadapt removes adapter sequences from high-throughput sequencing reads. EMBnet J. 2011, 17, 10–12. [Google Scholar] [CrossRef]
  42. Edgar, R.-C. UPARSE: Highly accurate OTU sequences from microbial amplicon reads. Nat. Methods 2013, 10, 996–998. [Google Scholar] [CrossRef]
  43. Edgar, R.-C.; Haas, B.-J.; Clemente, J.-C.; Quince, C.; Knight, R. UCHIME improves sensitivity and speed of chimera detection. Bioinformatic 2011, 27, 2194–2200. [Google Scholar] [CrossRef] [PubMed]
  44. Jiang, S.; Xing, Y.-J.; Liu, G.-C.; Hu, C.-Y.; Wang, X.-C.; Yan, G.-Y.; Wang, Q.-G. Changes in soil bacterial and fungal community composition and functional groups during the succession of boreal forests. Soil Biol. Biochem. 2021, 161, 108393. [Google Scholar] [CrossRef]
  45. Liu, S.-E.; Wang, H.; Tian, P.; Yao, X.; Sun, H.; Wang, Q.-K.; Baqueizo, M.-D. Decoupled diversity patterns in bacteria and fungi across continental forest ecosystems. Soil Biol. Biochem. 2020, 144, 107763. [Google Scholar] [CrossRef]
  46. Sheng, Y.-Y.; Cong, W.; Yang, L.-S.; Liu, Q.; Zhang, Y.-G. Forest soil fungal community elevational distribution pattern and their ecological assembly processes. Front. Microbiol. 2019, 10, 02226. [Google Scholar] [CrossRef] [PubMed]
  47. Monkai, J.; Purahong, W.; Nawaz, A.; Wubet, T.; Hyde, K.-D.; Goldberg, S.-D.; Mortimer, P.-E.; Xu, J.-C.; Harrison, R.-D. Conversion of rainforest to rubber plantations impacts the rhizosphere soil mycobiome and alters soil biological activity. Land Degrad. Dev. 2022, 33, 3411–3426. [Google Scholar] [CrossRef]
  48. Ceci, A.; Pinzari, F.; Russo, F.; Persiani, A.-M.; Gadd, G.-M. Roles of saprotrophic fungi in biodegradation or transformation of organic and inorganic pollutants in co-contaminated sites. Appl. Microbiol. Biotechnol. 2019, 103, 53–68. [Google Scholar] [CrossRef]
  49. Al-Yahya’ei, M.N.; Oehl, F.; Vallino, M.; Lumini, E.; Redecker, D.; Wiemken, A.; Bonfante, P. Unique arbuscular mycorrhizal fungal communities uncovered in date palm plantations and surrounding desert habitats of Southern Arabia. Mycorrhiza 2021, 21, 195–209. [Google Scholar] [CrossRef]
  50. Wilson, H.; Johnson, R.-R.; Bohannan, B.; Pfeifer-Meister, L.; Mueller, R.; Bridgham, S.-D. Experimental warming decreases arbuscular mycorrhizal fungal colonization in prairie plants along a Mediterranean climate gradient. PeerJ 2016, 4, e2083. [Google Scholar] [CrossRef] [PubMed]
  51. Phillips, R.-P.; Brzostek, E.; Midgley, M.-G. The mycorrhizal-associated nutrient economy: A new framework for predicting carbon-nutrient couplings in temperate forests. New Phytol. 2013, 199, 41–51. [Google Scholar] [CrossRef] [PubMed]
  52. Lindahl, B.-D.; Tunlid, A. Ectomycorrhizal fungi-potential organic matter decomposers, yet not saprotrophs. New Phytol. 2015, 205, 1443–1447. [Google Scholar] [CrossRef] [PubMed]
  53. Crowther, T.-W.; van den Hoogen, J.; Wan, J.; Mayes, M.-A.; Keiser, A.-D.; Mo, L.; Averill, C.; Maynard, D.-S. The global soil community and its influence on biogeochemistry. Science 2019, 365, eaav0550. [Google Scholar] [CrossRef]
  54. Nie, S.-A.; Lei, S.-M.; Zhao, L.-X.; Brookes, P.-C.; Wang, F.; Chen, C.-R.; Yang, W.-H.; Xing, S.-H. Fungal communities and functions response to long-term fertilization in paddy soils. Appl. Soil Ecol. 2018, 130, 251–258. [Google Scholar] [CrossRef]
  55. Gilmartin, E.-C.; Jusino, M.-A.; Pyne, E.-J.; Banik, M.-T.; Lindner, D.-L.; Boddy, L. Fungal endophytes and origins of decay in beech (Fagus sylvatica) sapwood. Fungal Ecol. 2022, 59, 101161. [Google Scholar] [CrossRef]
  56. Averill, C. Slowed decomposition in ectomycorrhizal ecosystems is independent of plant chemistry. Soil Biol. Biochem. 2016, 102, 52–54. [Google Scholar] [CrossRef]
  57. Liang, M.-X.; Liu, X.-B.; Parker, I.-M.; Johnson, D.; Zheng, Y.; Luo, S.; Gilbert, G.-S.; Yu, S.-X. Soil microbes drive phylogenetic diversity-productivity relationships in a subtropical forest. Sci. Adv. 2019, 5, eaax5088. [Google Scholar] [CrossRef]
  58. Lang, C.; Seven, J.; Polle, A. Host preferences and differential contributions of deciduous tree species shape mycorrhizal species richness in a mixed Central European forest. Mycorrhiza 2011, 21, 297–308. [Google Scholar] [CrossRef]
  59. Uroz, S.; Buee, M.; Deveau, A.; Mieszkin, S.; Martin, F. Ecology of the forest microbiome: Highlights of temperate and boreal ecosystems. Soil Biol. Biochem. 2016, 103, 471–488. [Google Scholar] [CrossRef]
  60. Shao, P.-S.; Liang, C.; Rubert-Nason, K.; Li, X.-Z.; Xie, H.-T.; Bao, X.L. Secondary successional forests undergo tightly-coupled changes in soil microbial community structure and soil organic matter. Soil Biol. Biochem. 2019, 128, 56–65. [Google Scholar] [CrossRef]
  61. Stursova, M.; Barta, J.; Santruckova, H.; Baldrian, P. Small-scale spatial heterogeneity of ecosystem properties, microbial community composition and microbial activities in a temperate mountain forest soil. Fems Microbiol. Ecol. 2016, 92, fiw185. [Google Scholar] [CrossRef] [PubMed]
  62. Francioli, D.; van Rijssel, S.-Q.; van Ruijven, J.; Termorshuizen, A.-J.; Cotton, T.; Dumbrell, A.-J.; Raaijmakers, J.-M.; Weigelt, A.; Mommer, L. Plant functional group drives the community structure of saprophytic fungi in a grassland biodiversity experiment. Plant Soil 2021, 461, 91–105. [Google Scholar] [CrossRef]
  63. Xu, J.; Liu, B.; Qu, Z.-L.; Ma, Y.; Sun, H. Age and species of Eucalyptus plantations affect soil microbial biomass and enzymatic activities. Microorgianisms 2020, 8, 811. [Google Scholar] [CrossRef]
  64. Bannert, A.; Kleineidam, K.; Wissing, L.; Mueller-Niggemann, C.; Vogelsang, V.; Welzl, G.; Cao, Z.; Schloter, M. Changes in diversity and functional gene abundances of microbial communities involved in nitrogen fixation, nitrification, and denitrification in a tidal wetland versus paddy soils cultivated for different time periods. Appl. Environ. Microbiol. 2011, 77, 6109–6116. [Google Scholar] [CrossRef] [PubMed]
  65. Prescott, C.-E.; Grayston, S.-J. Tree species influence on microbial com munities in litter and soil: Current knowledge and research needs. Forest Ecol. Manag. 2013, 309, 19–27. [Google Scholar] [CrossRef]
  66. Ding, J.; Jiang, X.; Guan, D.; Zhao, B.; Ma, M.; Zhou, B.; Cao, F.; Yang, X.; Li, L.; Li, J. Influence of inorganic fertilizer and organic manure application on fungal communities in a long-term field experiment of Chinese Mollisols. Appl. Soil. Ecol. 2017, 111, 114–122. [Google Scholar] [CrossRef]
  67. Liu, J.; Sui, Y.; Yu, Z.; Shi, Y.; Chu, H.; Jin, J.; Liu, X.; Wang, G. Soil carbon content drives the biogeographical distribution of fungal communities in the black soil zone of northeast China. Soil Biol. Biochem. 2015, 83, 29–39. [Google Scholar] [CrossRef]
Figure 1. Characteristics of α-diversity indices in different forest stands. (a) Simpson index; (b) species richness; (c) Shannon–Winner index; (d) Pielou evenness index. Note: P represents pure Pinus tabulaeformis forests, M represents mixed forests, NNF represents near-natural forests, and NF represents natural forests.
Forests 15 01540 g001
Figure 2. Changes in the abundance of functional mode of soil fungi during near-naturalization. Notes: P, Pinus tabulaeformis forest stage; M, mixed forest stage; NNF, near-natural forest stage; NF, natural secondary forest.
Forests 15 01540 g002
Figure 3. Changes in the abundance of soil fungal nutrient mode in near-naturalization P, Pinus tabulaeformis forest stage; M, mixed forest stage; NNF, near-natural forest stage; NF, natural secondary forest.
Forests 15 01540 g003
Figure 4. Changes in the abundance of soil fungal growth mode during near-naturalization. P, P. tabulaeformis forest stage; M, mixed forest stage; NNF, near-natural forest stage; NF, natural secondary forest.
Forests 15 01540 g004
Figure 5. Correlation between tree layer diversity index and the abundance of soil fungi functional mode groups. B, biomass; R, richness index; SHI, Shannon−Wiener index; SII, Simpson index; SHE, Shannon−Wiener evenness index; SIE, Simpson evenness index; PE, Pielou evenness index. * means the significance level p < 0.05, ** means the significance level p < 0.01.
Forests 15 01540 g005
Figure 6. Correlation between species composition in the tree layer and the abundance of soil fungi functional mode groups. 1. Pinus tabulaeformis; 2. Quercus variabilis; 3. Juglans mandshuruca; 4. Quercus mongolica; 5. Tilia amurensis; 6. Fraxinus chinensis; 7. Carpinus turczaninowii; 8. Quercus aliena; 9. Quercus dentata; 10 Tetradium daniellii. * means the significance level p < 0.05, ** means the significance level p < 0.01.
Forests 15 01540 g006
Figure 7. Correlation between soil properties and the abundance of fungal functional mode groups in soil. SOC, soil organic carbon; AP, available phosphorus; TP, total phosphorus; NAN, nitrate nitrogen; DM, dry matter content; TC, total carbon; C.N, carbon–nitrogen ratio; TN, total nitrogen; AN, ammonia nitrogen. * means the significance level p < 0.05, ** means the significance level p < 0.01.
Forests 15 01540 g007
Figure 8. Correlation between soil enzyme activity and the abundance of soil fungi functional mode groups. CA, cellulase; UA, urease; GA, β-glucosidase; ACP, acid phosphatase; DHA, dehydrogenase. * means the significance level p < 0.05, ** means the significance level p < 0.01.
Forests 15 01540 g008
Figure 9. Differences in the functional structure of soil fungal communities at different stages of naturalization: (a) functional mode; (b) vegetative mode; (c) growth mode. P: P. tabulaeformis forest stage; M: mixed forest stage; NNF: near-natural forest stage; NF: natural secondary forest.
Forests 15 01540 g009
Figure 10. RDA analysis results of plant diversity on functional structure of soil fungal community in functional mode. Note: P: P. tabulaeformis forest stage; M: mixed forest stage; NNF: near-natural forest stage; NF: natural secondary forests; B: biomass; R: richness index; SHI: Shannon–Wiener index; SII: Simpson index; SHE: Shannon–Wiener evenness index; SIE: Simpson evenness index; PE Pielou evenness index.
Forests 15 01540 g010
Figure 11. RDA analysis of the influence of plant species composition on the functional structure of the soil fungal community in functional mode. P, P. tabulaeformis forest stage; M, mixed forest stage; NNF, near-natural forest stage; NF, natural secondary forests; 1. Pinus tabulaeformis; 2. Quercus variabilis; 3. Juglans mandshuruca; 4. Quercus mongolica; 5. Tilia amurensis; 6. Fraxinus chinensis; 7. Carpinus turczaninowii; 8. Quercus aliena; 9. Quercus dentata; 10. Tetradium daniellii.
Forests 15 01540 g011
Figure 12. RDA analysis of the influence of soil physicochemical properties on the functional structure of the soil fungal community in functional mode. P, P. tabulaeformis forest stage; M, mixed forest stage; NNF, near-natural forest stage; NF, natural secondary forests; SOC, soil organic carbon; AP, available phosphorus; TP, total phosphorus; NAN, nitrate nitrogen; DM, dry matter content; TC, total carbon; CN, carbon nitrogen ratio; TN, total nitrogen; AN, ammonia nitrogen.
Forests 15 01540 g012
Figure 13. RDA analysis of the influence of soil enzyme activity on the functional structure of the soil fungal community in functional mode. P, P. tabulaeformis forest stage; M, mixed forest stage; NNF, near-natural forest stage; NF, natural secondary forests; CA, cellulase; UA, urease; GA, β-glucosidase; ACP, acid phosphatase; DHA, dehydrogenase.
Forests 15 01540 g013
Table 1. Allometry equation for calculating the biomass of each tree species in the tree layer.
SpeciesBiomass Allometry Equation
Pinus tabulaeformisY = e−1.41+6.92/T × D1.03 × H1.08 + 13.41 Y: (t), D: (m2), H: (m)
Quercus variabilisY = 0.022337662(D2H)0.993056421 + 0.006221667(D2H)1.008154429 +
0.001179057(D2H)1.298105392 + 0.018493229(D2H)0.671232912 +
0.014665102(D2H)0.950577264 Y: (kg), D: (cm2), H: (m)
Robinia pseudoacaciaY = 0.020(D2H) + 1.974 Y: (kg), D: (cm2), H: (m)
Juglans mandshuricalnY = −2.471 + 2.667 × ln(D)
Quercus mongolicalnY = −3.453 + 1.004 × ln(D2 + H)
Tilia amurensislnY = −3.771 + 1.013 × ln(D2 + H)
Other specieslnY = −2.560 + 2.308 × ln(DBH) + 0.341 × lnH Y: (g), D: (cm2), H: (m)
Table 2. Soil chemical properties and enzyme activities of near-naturalized stand and natural secondary forest (SOC, soil organic carbon; AP, available phosphorus; TP, total phosphorus; TC, total carbon; TN, total nitrogen; C/N, carbon–nitrogen ratio; DW, dry matter content; CA, cellulase; UA, urease; GA, β-glucosidase; DHA, dehydrogenase; ACP, acid phosphatase).
Soil IndicatorPMNNFNF
SOC (mg·kg−1)79.40 ± 14.0295.88 ± 13.1879.94 ± 17.85105.41 ± 21.03
AP (mg·kg−1)38.58 ± 32.3533.89 ± 43.0645.40 ± 10.9940.28 ± 33.67
TP (mg·kg−1)545.80 ± 159.6472.02 ± 88.10563.10 ± 193.3532.09 ± 159.4
NO3N (mg·kg−1)13.32 ± 2.269.97 ± 3.5515.42 ± 3.7321.17 ± 8.00
NH4+-N (mg·kg−1)8.10 ± 0.728.72 ± 7.464.84 ± 3.0510.50 ± 3.98
pH4.79 ± 0.194.64 ± 0.345.85 ± 0.385.74 ± 0.88
DW (%)95.71 ± 1.1997.11 ± 0.9796.73 ± 3.2795.89 ± 1.90
TC (%)7.18 ± 3.555.16 ± 0.377.15 ± 1.167.55 ± 2.78
TN (%)0.52 ± 0.260.36 ± 0.040.56 ± 0.120.61 ± 0.06
C/N13.87 ± 1.2614.55 ± 0.7112.97 ± 0.7712.35 ± 0.86
CA (μg·g−1·min−1)0.10 ± 0.090.18 ± 0.050.20 ± 0.100.21 ± 0.06
UA (μg·g−1·h−1)5.23 ± 1.635.24 ± 1.819.61 ± 1.348.98 ± 2.78
GA (μg·g−1·h−1)0.83 ± 0.781.24 ± 0.981.01 ± 0.510.59 ± 0.54
DHA (μg·g−1·h−1)0.39 ± 0.350.61 ± 0.540.46 ± 0.370.33 ± 0.38
ACP (μg·g−1·min−1)5.83 ± 1.105.29 ± 1.294.36 ± 1.526.85 ± 3.73
Table 3. Results of the Monte Carlo test used to evaluate the influence of plant and soil environmental factors on three dimensions of the fungal community’s functional structure.
Soil Physicochemical PropertiesPlant DiversityPlant CompositionEnzyme Activity
Functional modeR = 0.021
p = 0.417
R = −0.130
p = 0.983
R = 0.098
p = 0.229
R = −0.099
p = 0.794
Vegetative modeR = 0.048
p = 0.302
R = −0.128
p = 0.892
R = 0.055
p = 0.343
R = −0.107
p = 0.798
Growth modeR = 0.053
p = 0.333
R = −0.151
p = 0.929
R = 0.111
p = 0.195
R = −0.114
p = 0.859
Table 4. Monte Carlo test results of the RDA model and the influence of plant diversity factors on the functional structure of the soil fungal community in three dimensions. B, biomass; R, richness index; SHI, Shannon–Wiener index; SII, Simpson index; SHE, Shannon–Wiener evenness index; SIE, Simpson evenness index; PE, Pielou evenness index.
Functional ModeVegetative ModeGrowth Mode
R2pR2pR2p
B0.1970.0750.0880.3310.0210.788
R0.0100.8580.0390.5520.0130.855
SHI0.0060.9360.0150.8090.0050.934
SII0.0090.9050.0060.9380.0170.801
SHE0.0950.2910.0310.7100.0500.548
SIE0.1340.1760.0750.3870.1130.265
PE0.0170.8020.0150.8440.0630.442
Shannon0.0010.9990.0420.5880.0310.662
Table 5. Monte Carlo test of the RDA model and plant species composition factors influencing the functional structure of the soil fungal community in three dimensions. 1. Pinus tabulaeformis; 2. Quercus variabilis; 3. Juglans mandshuruca; 4. Quercus mongolica; 5. Tilia amurensis; 6. Fraxinus chinensis; 7. Carpinus turczaninowii; 8. Quercus aliena; 9. Quercus dentata; 10. Tetradium daniellii. Bold indicates a significance level ≤ 0.05.
Functional ModeVegetative ModeGrowth Mode
R2pR2pR2p
10.0250.6960.0500.4730.0520.487
20.0460.5290.0110.8990.1100.241
30.0210.7390.0580.4140.0190.781
40.8320.0010.8670.0020.7540.001
50.0040.8870.1160.1340.0340.530
60.0190.6880.0500.3780.0260.676
70.3490.0430.4100.0280.3030.050
80.0010.9840.0150.8390.0000.998
90.1450.1250.0000.9840.0200.574
100.0180.7610.0160.8340.0870.316
Table 6. Monte Carlo test of the RDA model and the influence of soil physicochemical properties on the functional structure of the soil fungal community in three dimensions. SOC, soil organic carbon; AP, available phosphorus; TP, total phosphorus; NAN, nitrate nitrogen; DM, dry matter content; TC, total carbon; CN, carbon–nitrogen ratio; TN, total nitrogen; AN, ammonia nitrogen. Bold indicates a significance level ≤ 0.05.
Functional ModeVegetative ModeGrowth Mode
R2pR2pR2p
SOC0.0730.4080.2580.0370.2310.037
AP0.0200.8150.1280.2030.1000.291
TP0.0040.9490.0140.8450.0810.350
NAN0.1300.2070.1850.0800.0890.315
pH0.3940.0020.2320.0430.1800.092
DM0.0320.6790.2420.0310.0360.648
TC0.0740.3900.0270.7390.1380.161
CN0.1380.1650.0680.4110.2700.019
TN0.1350.1710.0420.5990.2490.028
AN0.1370.1660.0860.3140.1870.085
Table 7. Monte Carlo test of the RDA model and the influence of soil enzyme activity on the functional structure of the soil fungal community in three dimensions. Note: CA, cellulase; UA, urease; GA, β-glucosidase; ACP, acid phosphatase; DHA, dehydrogenase; AN, ammonia nitrogen. Bold indicates a significance level ≤ 0.05.
Functional ModeVegetative ModeGrowth Mode
R2pR2pR2p
CA0.0620.4270.0220.7680.0440.610
UA0.2430.0270.2210.0530.2060.047
GA0.1270.1850.1070.2690.3710.005
ACP0.5200.0120.1540.1490.1230.183
DHA0.4380.0010.1590.1260.1630.111
AN0.1480.1570.0420.6210.2010.062
Disclaimer/Publisher’s Note: The statements, opinions and data contained in all publications are solely those of the individual author(s) and contributor(s) and not of MDPI and/or the editor(s). MDPI and/or the editor(s) disclaim responsibility for any injury to people or property resulting from any ideas, methods, instructions or products referred to in the content.

