Abstract
Wild edible mushrooms are an important food source globally and have a crucial role in forest ecosystems. However, there is limited research on the growth characteristics and the contribution of agronomic traits to biomass, and the environmental factors affecting mushroom growth are limited. This study was conducted in the Qilian Mountains, China, and focused on investigating the growth patterns and agronomic traits of Lyophyllum decastes and Coprinus comatus. The results revealed that the growth of these mushrooms followed a logical growth curve. By calculating the model parameters, we obtained the maximum daily growth of height (PH), pileus diameter (PD), and cluster perimeter (CP) of L. decastes on the 5th, 7th, and 7th days, respectively, with values of 0.55 cm d−1, 0.54 cm d−1, and 4.54 cm d−1, respectively. However, the maximum daily growth of PH, pileus length (PL), and PD of the C. comatus appeared on the 3rd day, 2nd day, and 2nd day of the observation, respectively. This study identified near-surface relative humidity, air relative humidity, and rainfall as the primary factors influencing mushroom growth, as indicated by Pearson’s correlation analysis, redundancy analysis (RDA), and multiple linear and stepwise regression. Additionally, land surface temperature and air temperature were also identified as important factors affecting mushroom growth. By utilizing random forest and stepwise regression analysis, this study identified PH and stipe diameter (SD) as the most crucial agronomic traits affecting mushroom biomass. Overall, this study offers insights for industrial mushroom cultivation and basic fungal research.
1. Introduction
Mushrooms, as a highly biodiverse group of macrofungi, play a crucial role in forest ecosystems [1]. Classified as heterotrophic eukaryotes, mushrooms are essential components in the decomposition of organic substrates, soil mineral weathering, and element cycling [2]. They are also involved in symbiotic interactions with animals and plants, further enhancing ecosystem functions [2,3]. The application of the mathematical growth model has been developed over a long period of time. Various non-linear models, such as allometric [4], logistic [5], Gompertz [6], and Richards models [7], have been developed to simulate the growth characteristics of different organisms [6,8]. In particular, the logistic growth curve is a classic model in ecology that effectively describes the pre- and post-growth characteristics of organisms, also considering resource constraints and demonstrating ecological significance [9]. Studies have shown that the growth of Lentinula edodes and the production of mycelial extracellular polysaccharides follow a logistic model [10]. It has been reported that the growth of Agrocybe Cylindracea fruiting bodies was simulated using a digital model. In their study, in addition to utilizing exponential functions, linear regression, and power functions, they also used a logistic growth curve [11]. Furthermore, some scholars have explored the growth changes of Ganoderma lucidum in pumpkin juice and discovered that its growth also follows a logistic growth curve. Subsequently, they divided the growth into three stages: the booming, steady, and decline periods [12]. Currently, investigating the morphological structures affecting biomass, predicting biomass levels, and exploring the influencing factors of variables have become important hot issues in the research field. There are many research methods involved, such as structural equation modeling [13], artificial neural network modeling [4], random forest [14], multiple linear regression, and stepwise regression [15]. Despite the utilization of these analysis techniques, limited research exists on the growth patterns of mushrooms and the crucial morphological features affecting biomass. As a result, further exploration of mushroom growth patterns and understanding of important agronomic traits affecting mushroom biomass contribute to the development of fungal ecology and provide valuable insights for basic research on fungi.
Climate change and site characteristics play a significant role in the growth and development of plants and animals, including fungi [16,17]. However, the evaluation of fungi in relation to these factors has been relatively rare compared to other organisms. Climatic factors, such as temperature and precipitation, have been identified as key drivers of mushroom fruit body emergence and yield in various ecosystems. For example, in boreal regions and temperate forests, temperature has been found to be an active driver of mushroom production [17]. In drought-prone Mediterranean regions, the interaction between precipitation and temperature may be the main limiting factor for fungi yield. High temperatures may increase soil evapotranspiration and decrease soil water availability, impacting mushroom production [18]. However, the relationship between climate variables and mushroom growth may be complex and context-dependent. Studies have reported contrasting findings regarding the influence of temperature and rainfall on mushroom growth. For instance, there is no relationship between mushroom growth and average temperature in a Mediterranean maritime pine forest [19]. Studies have observed a positive correlation between mushroom yield and temperature and rainfall in August [16]. It has also been reported that high humidity and rainfall between May and July inhibited mushroom fruiting and growth [20]. Beyond climate, various additional factors can influence mushroom growth and productivity; for instance, soil properties, forest age, forest species, nitrogen deposition, and other changing factors can impact mushroom phenology and biomass yield [21]. For example, it was reported that the current-year photosynthates formed by trees also seem to have a strong influence on the growth and production of mycorrhizal mushroom fruit bodies [22]. These factors can further interact with climate variables, thereby affecting the growth and productivity accumulation of mushrooms. Given the complexity of the factors influencing mushroom growth, it is crucial to continue studying and understanding the various influencing factors.
L. decastes and C. comatus are widely distributed and endemic edible macrofungi species in the Qilian Mountains. They are excellent in terms of flavor and texture and are favored by the public because of their high nutrient content, including vitamins, protein, carbohydrates, dietary fiber, and essential amino acids [23,24]. Macrofungi, as an integral part of terrestrial ecosystems, are important players in balancing the material cycle and energy flow of ecosystems [2]. In addition, the antioxidant, anticholinesterase, antibacterial, and antidiabetic properties of polysaccharides in mushrooms have medicinal value in Chinese medicine [25,26]. Previous research has primarily emphasized the medicinal and nutritional benefits of wild mushrooms [3]. However, the growth characteristics of wild mushrooms are important for the ecological environment and people’s lives. The present study aims to investigate growth patterns and biomass model prediction by timed growth observation and random field sampling from two dominant edible macrofungi species (L. decastes and C. comatus) during the periods of 24–31 July 2022 and 7–26 August 2022 in the Qilian Mountains. The objectives of this study were to (1) reveal the growth models of these two dominant mushrooms during the growth period, (2) identify the important agronomic traits affecting biomass, and (3) explore the effect of environmental factors on the growth of these two mushrooms. The hypothesis of this study is that (1) mushroom growth follows a logistic growth pattern, (2) the growth of mushrooms is mainly affected by temperature, and (3) the size of pileus diameter is a key morphological factor in biomass accumulation, with larger diameters resulting in greater biomass.
2. Materials and Methods
2.1. Investigated Fungi
As fungi, the basidiomycetes (agaricomycetes) Lyophyllum decastes (Fr.) Singer and Coprinus comatus (O.P. Müll.) Pers. were investigated. Figure 1 shows examples of their fruit bodies. The first experiment we performed established two fixed sample plots (30 m × 30 m, blue square) (Figure 1) in accordance with the distribution of two species of mushrooms. Within these plots, we selected 20 strains of each mushroom species for observation. The same (cluster) mushroom was measured three times to minimize experimental error caused by the measurements. Two wild edible mushrooms, C. comatus and L. decastes, were investigated and observed on 24–31 July 2022 and 7–26 August 2022, respectively (Figure 1 and Figure S1). Specifically, C. comatus was monitored daily at 9 am over an 8-day period, focusing on height, pileus diameter, and pileus length. In addition, observations for L. decastes were conducted two days apart at 9:00 a.m., with a total observation period of 20 days. The parameters measured for L. decastes included height, pileus diameter, and cluster perimeter (Figure 1 and Figure S1). The experimental tools used to observe the growth rate of mushrooms mainly included thin nylon ropes, plastic sticks, rulers, and cameras. In the second experiment, we collected 150 C. comatus samples from 19 sampling points (purple dots) and 71 L. decastes samples from 5 sampling points (red dots) in the study area to explore the important agronomic traits affecting biomass (Figure 1 and Figure S1). Fruiting bodies (both pileus or cap and stipe or stalk) of mushrooms were hand-picked from their natural environment. The fruiting bodies were cleaned of plant and grass residue and soil substrate using a plastic knife. The sizes of the agronomic traits (height, cluster perimeter, pileus diameter, pileus length, stipe diameter, and stipe length) of the samples were measured using a ruler, vernier caliper, and thin rope. The samples were placed in envelopes and dried in an oven at 80 °C to a constant mass, and the biomass was obtained.
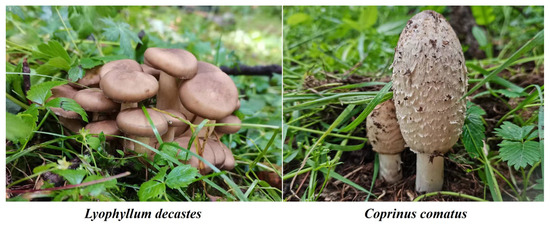
Figure 1.
Representative pictures of mushroom species.
2.2. Study Area
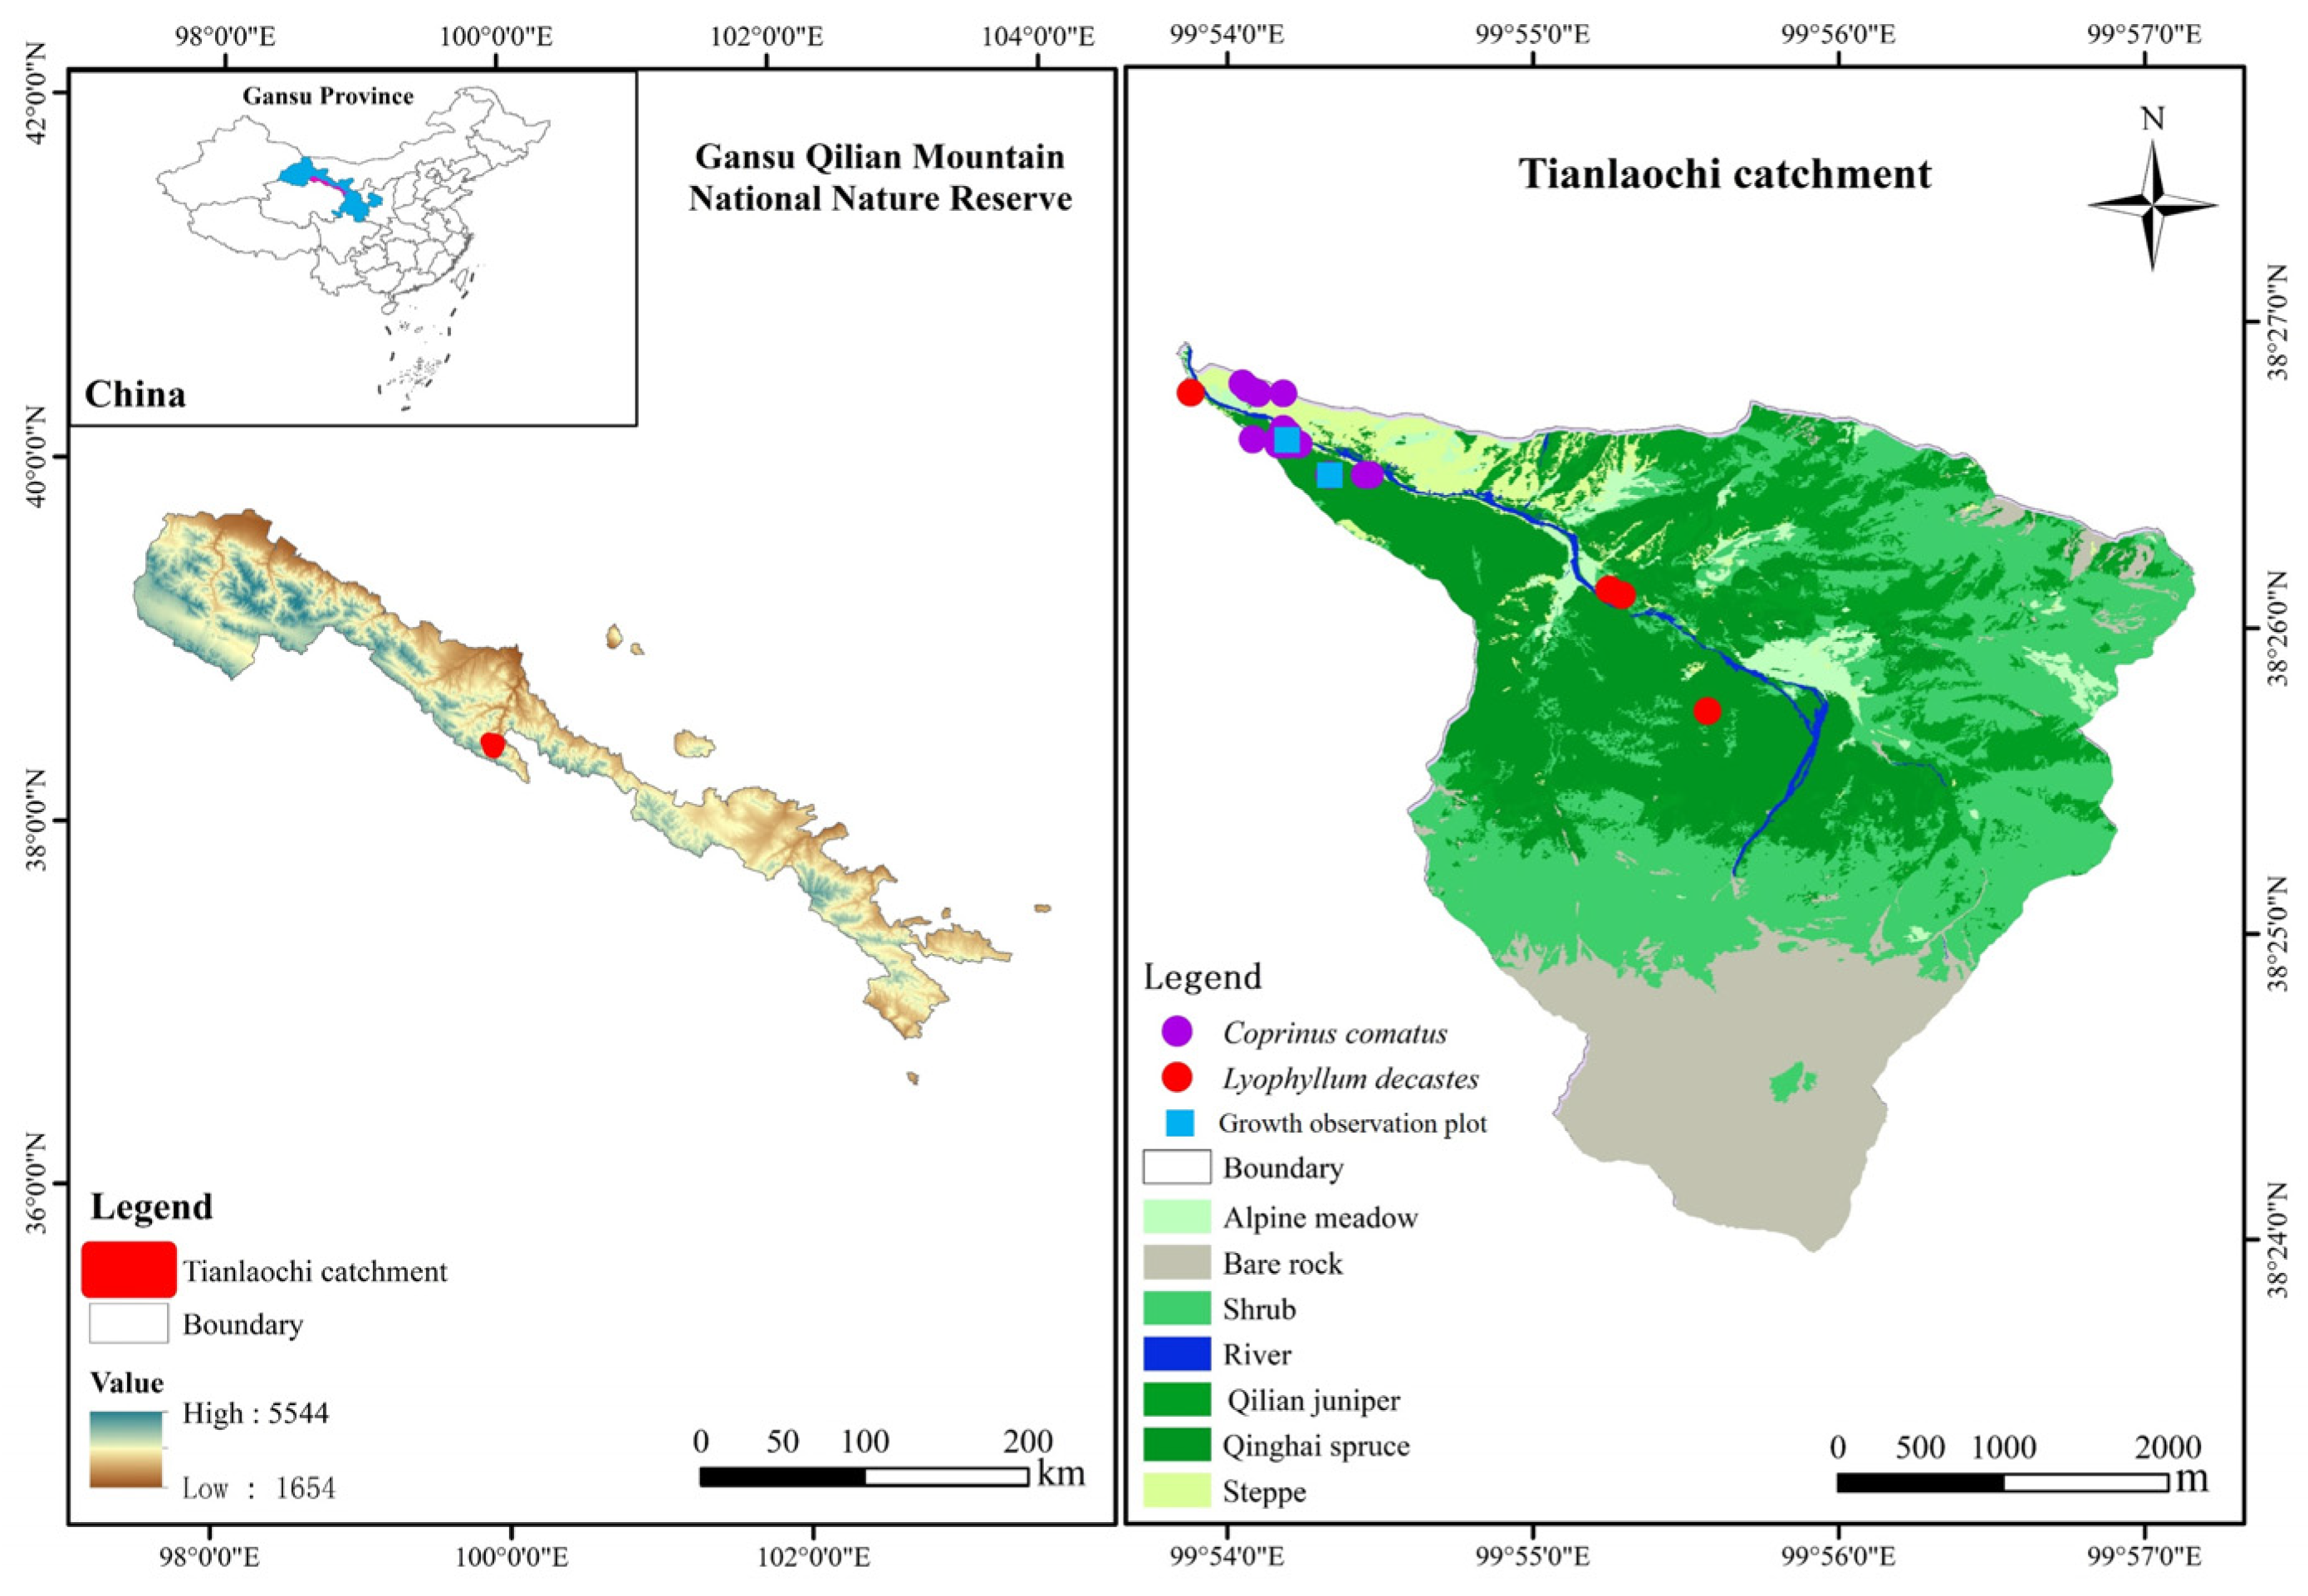
The Qilian Mountains are located at the intersection of the Qinghai–Tibet Plateau, the Loess Plateau, and the Mengxin Plateau and are one of the most famous mountain ranges in China. The study area was selected in the Tianlaochi catchment (99°53′50″–99°57′10″ E, 38°23′58″–38°26′56″ N) of the upper reaches of the Heihe River of the Qilian Mountains. The area covers an area of approximately 12.8 km2, with elevation ranging from 2600 m to 4450 m above the mean sea level. The climate type is alpine climate. The mean annual temperature was 0.6 °C. The mean annual precipitation was 437 mm, and rainfall mainly occurred from June to September (about 84.2% of annual rainfall) [27]. The average annual evaporation and average annual relative humidity were 1066 mm and 59%, respectively. The study area is rich in species, and the main dominant forest species are Qinghai spruce and Qilian juniper. Qinghai spruce forest covers 25.39% of the land area in the catchment and is distributed on the north face at elevations of 2600 to 3540 m. Qilian juniper forest covers 13.34% of the land area in the catchment and is distributed on the south face at elevations of 2700 to 3250 m [28]. The temperature and humidity in summer are suitable for Qinghai spruce forests, which provide the necessary conditions for the growth and development of the species (Figure 2). There are a large number of macrofungi distributed in the forest, such as Lactarius batsudata, L. lilacinus, Agaricus, L. decastes, C. comatus, Stropharia rugosoannulata, Lepista personata, Agaricus perrarus, Agaricus spissicaulis, Agaricus heamorrhoidarius, etc. L. decastes and C. comatus are two edible mushrooms (Figure 1) and are more commonly distributed in the forest (Figure 2). C. comatus is typically white and has a height ranging from 6 to 15 cm. The pileus length is 5–10 cm, and it is initially egg-shaped and gradually opens into a long bell [29]. The optimal temperature range for the growth of mycelium is 22–28 °C. The ideal pH range for growth falls between 7.0 and 7.5. Fruiting bodies take approximately 5–8 days to mature. It is important to note that C. comatus is highly perishable, and autolysis (self-decomposition) occurs widely in its fruiting bodies after maturity [30]. On the other hand, the fruiting body of L. decastes can be solitary or clustered. Its pileus diameter is generally 5–16 cm, and the stipe length is typically 6–10 cm. The mycelium of L. decastes can grow within a temperature range of 5–35 °C. The optimal pH range for its growth is 6.5–7.5 [31,32].

Figure 2.
Location of the study area.
2.3. Logistic Growth Curves and Parameters
The logistic growth equation is a mathematical model commonly used to describe the growth patterns of various biological, including organisms and populations. It follows a sigmoidal curve characterized by gradual initial growth, rapid growth in the middle phase, and a slowing down towards a maximum value over time [10]. In this study, the logistic growth equation was employed to fit the growth laws of several morphological parameters, specifically height (PH), cluster perimeter (CP), pileus diameter (PD), and pileus length (PL), by fitting the average growth amount of each observed sample to the logistic model. Logistic equation is described as follows:
where y is growth increment of each agronomic trait (cm) at a given time t, t is the growth period (days of observation) (d), and e is the natural constant. A, B, and K are model parameters. A is the asymptotic maximum value of the function. B is a scaling parameter (constant of integration) related to initial values of weight. K is the slope or steepness of the curve. Additionally, the weight of inflection y(i), time of inflection T(i), and maximum growth rate (MGR) are parameters related to the logistic growth equation [33,34].
2.4. Random Forest Model
The random forest (RF) model is an integrated machine learning algorithm that builds upon the concept of decision trees. It can be used for both classification and regression tasks by combining multiple decision trees [35]. Specifically, in regression problems, the RF model addresses the issue of multivariate covariance often encountered in traditional regression analysis by capturing non-linear effects and interactions among variables. In this study, we aimed to construct an RF regression model based on the principles of RF, incorporating parameters of independent variables such as height, cluster perimeter, pileus diameter, pileus length, stipe diameter, and stipe length to estimate biomass. The increase in MSE (increase in mean square error) indicator of the RF model randomly assigns values to the independent variables. If the independent variables are significant, the more the MSE (mean squared error) increases, which can be used to validate the importance of the respective in biomass variation, and a larger value of IncMSE indicates that the importance of the independent variable is greater. The RF model constructed in this study can be abbreviated as follows:
where (T) represents accumulation biomass, namely, the dependent variable parameter. PH, PD, PL, CP, SD, and SL are independent variables. PH is height (cm), PD is pileus diameter (cm), PL is pileus length (cm), CP is cluster perimeter (cm), SD is stipe diameter (cm), and SL is stipe length (cm).
2.5. Data Analysis
Meteorological data were collected during growth observation periods at altitudes of 2850 and 3050 m using two self-metering meteorological stations (HOBO U30, Decagon, Bourne, MA, USA, and HOBO U23-002A, Bourne, MA, USA) (Figure S2). Data preprocessing and statistical analysis were performed using Microsoft Excel 2015 and SPSS 27.0. Correlation analysis and RDA were performed to identify the effect of environmental factors on mushroom growth using Origin 2023b. Multiple linear regression and stepwise regression were analyzed to test the relationship between all parameters. The RF package (versions 4.6-14) from R version 4.2.3 was used to rank the importance of each participating variable (height, cluster perimeter, pileus diameter, pileus length, stipe diameter, and stipe length) in biomass. All data were shown as means ± standard deviation.
3. Results
3.1. Dynamic Growth of the Agronomic Traits of Mushrooms
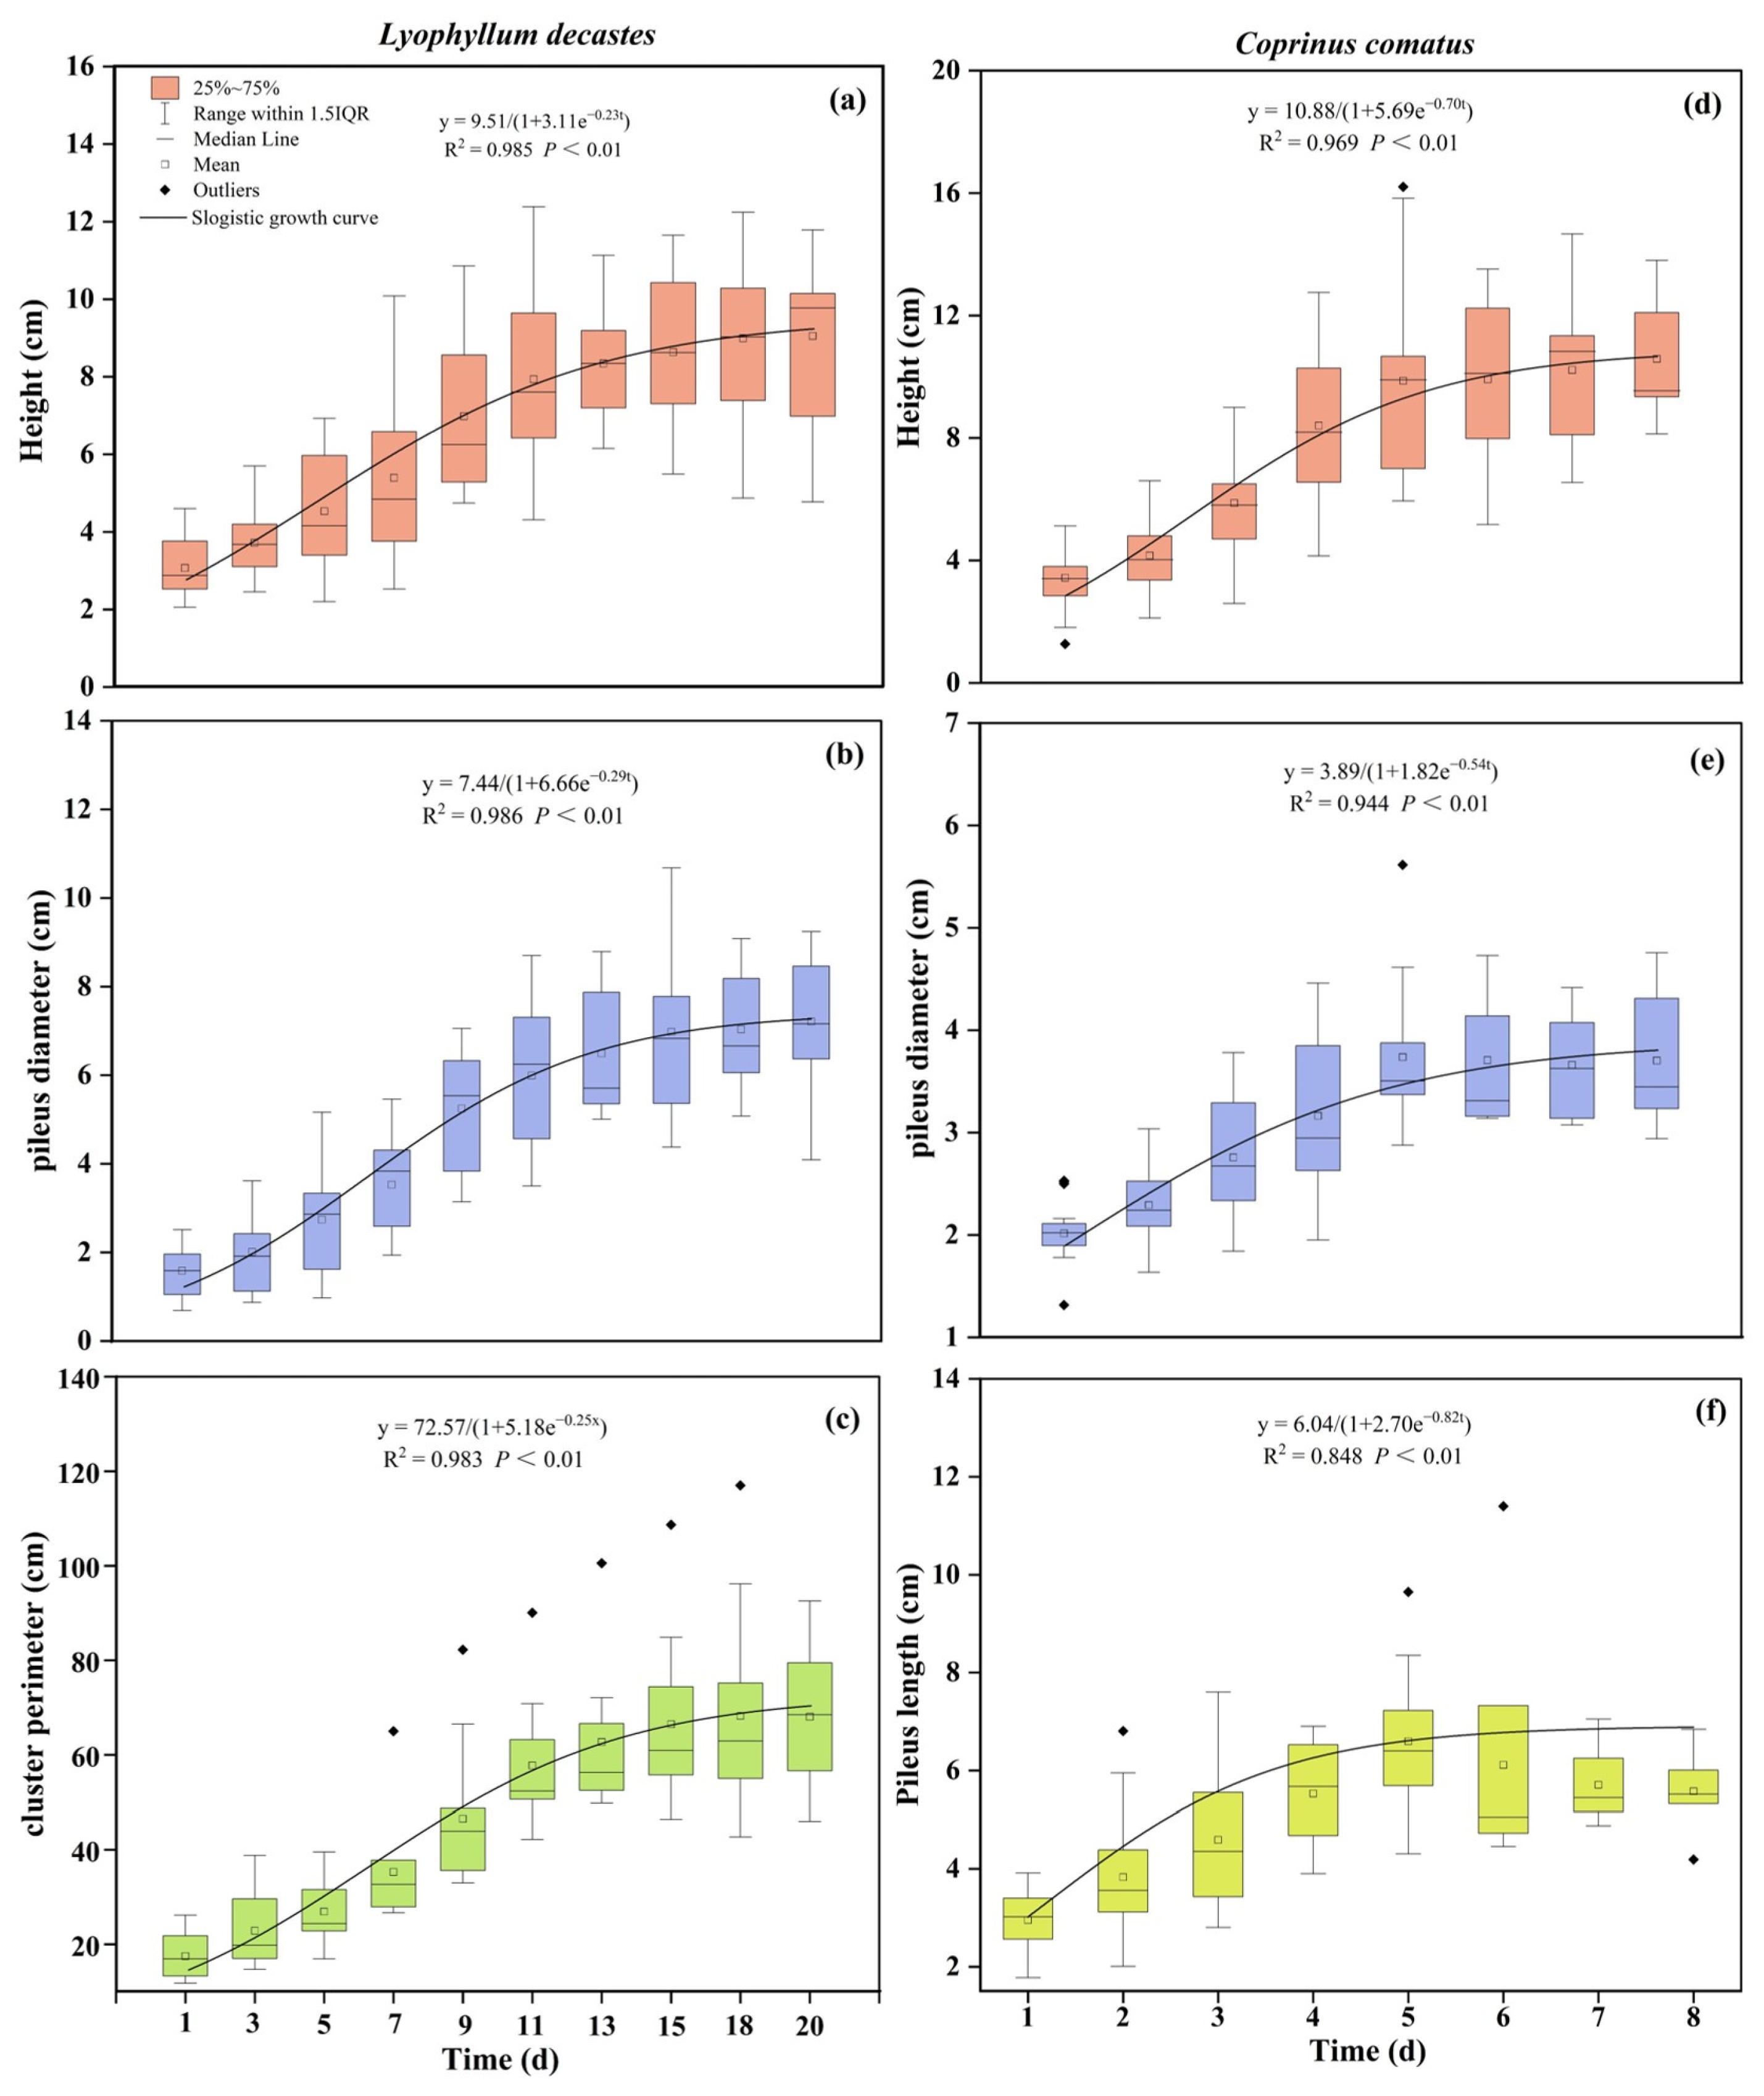
Based on the observations of the agronomic trait growth of L. decastes and C. comatus in their natural habitat. The results demonstrated that there was a “slow-fast-slow” growth trend over time in the mushrooms. To accurately describe and explain their growth, this study established a mathematical model using the observed agronomic traits data. This study obtained parameter estimation values and assessed the fitting degree of the growth curve (Figure 3). Subsequently, for L. decastes, models were established for height, pileus diameter, and cluster perimeter, resulting in the equations y(PH) = 9.51/(1 + 3.11e−0.23t), y(PD) = 7.44/(1 + 6.66e−0.29t), and y(CP) = 72.57/(1 + 5.18e−0.25t), respectively. Similarly, for C. comatus, models were formulated for height, pileus diameter, and pileus length, resulting in the equations y(PH) = 10.88/(1 + 5.69e−0.70t), y(PD) = 3.89/(1 + 1.82e−0.54t), and y(PL) = 6.04/(1 + 2.70e−0.82t), respectively. Additionally, the model-fitting R2 values for the agronomic traits of both mushrooms ranged from 0.848 to 0.986 (Figure 3). Variance analysis results indicated a highly significant regression relationship for the fitting model (p < 0.01), which means that it is feasible to use logical models to represent changes in mushroom growth over time. In terms of specific growth rates, L. decastes exhibited maximum growth rates of 0.55 cm d−1 for height, 0.54 cm d−1 for pileus diameter, and 4.54 cm d−1 for cluster perimeter, which were observed on the 5th, 7th, and 7th days of the observation period, respectively (Table 1). Among these parameters, the shortest time for the maximum daily growth of pileus diameter indicates the fastest transition to the later stage of growth. For C. comatus, height experienced the fastest growth on the 3rd day, while pileus diameter and pileus length exhibited the highest growth rates on the 2nd day. The maximum growth rates for these parameters were 1.90 cm d−1, 0.53 cm d−1, and 1.24 cm d−1, respectively (Table 1). The height grew faster at the inflection point, but it took longer to transition to growth stabilization compared to the pileus.

Figure 3.
Changes in the growth of two species of mushrooms over time. (a–c) represent the growth curves over time for the height, pileus diameter, and cluster perimeter of L. decastes, respectively. (d–f) represent the growth curves over time for the height, pileus diameter, and pileus length of C. comatus, respectively.

Table 1.
Logistic growth curve and growth stage analysis of agronomic trait.
3.2. Importance of Agronomic Traits to Biomass
An RF regression model was built using survey data on the biomass (dependent variable) and agronomic traits (independent variable) of L. decastes and C. comatus (Figure 4). Results revealed the top three variables that affect biomass accumulation in L. decastes were stipe diameter (SD), cluster perimeter (CP), and height (PH) (Figure 4a). For C. comatus, the order of importance for affect changes in biomass was SD > CP > PH > pileus diameter (PD) > stipe length (SL) (Figure 4b). Furthermore, stepwise regression analysis was conducted to rank the relative importance of the agronomic traits on biomass. The findings indicated that PH, SD, and SL were important agronomic traits influencing the biomass of L. decastes (p < 0.01). Similarly, PH, pileus length (PL), and SD were identified as the main agronomic traits influencing the biomass of C. comatus (p < 0.01) (Table 2). Based on both the RF regression model and stepwise regression analysis, this study concluded that PH and SD were key agronomic traits affecting the biomass of L. decastes. Additionally, PH, PL, and SD were identified as important structures influencing the biomass of C. comatus.
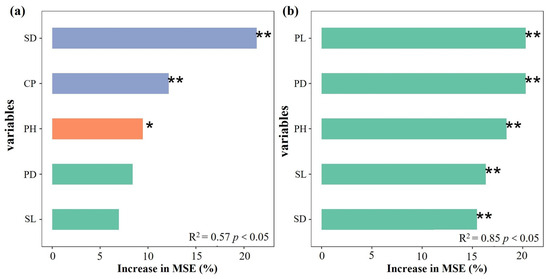
Figure 4.
The importance ranking of independent variables affecting mushroom biomass in the RF model. (a) and (b) represent L. decastes and C. comatus, respectively. CP: cluster perimeter; PH: height; PD: pileus diameter; SL: stipe length; SD: stipe diameter; PL: pileus length. * and ** indicate p < 0.05 and p < 0.01, respectively. Increase in MSE (%): percentage of increase in mean square error.
Table 2.
Stepwise regression analysis of agronomic trait and biomass of two wild dominant mushrooms in Qilian Mountains.
3.3. Identifying Dominant Environmental Impact Factors of Mushrooms
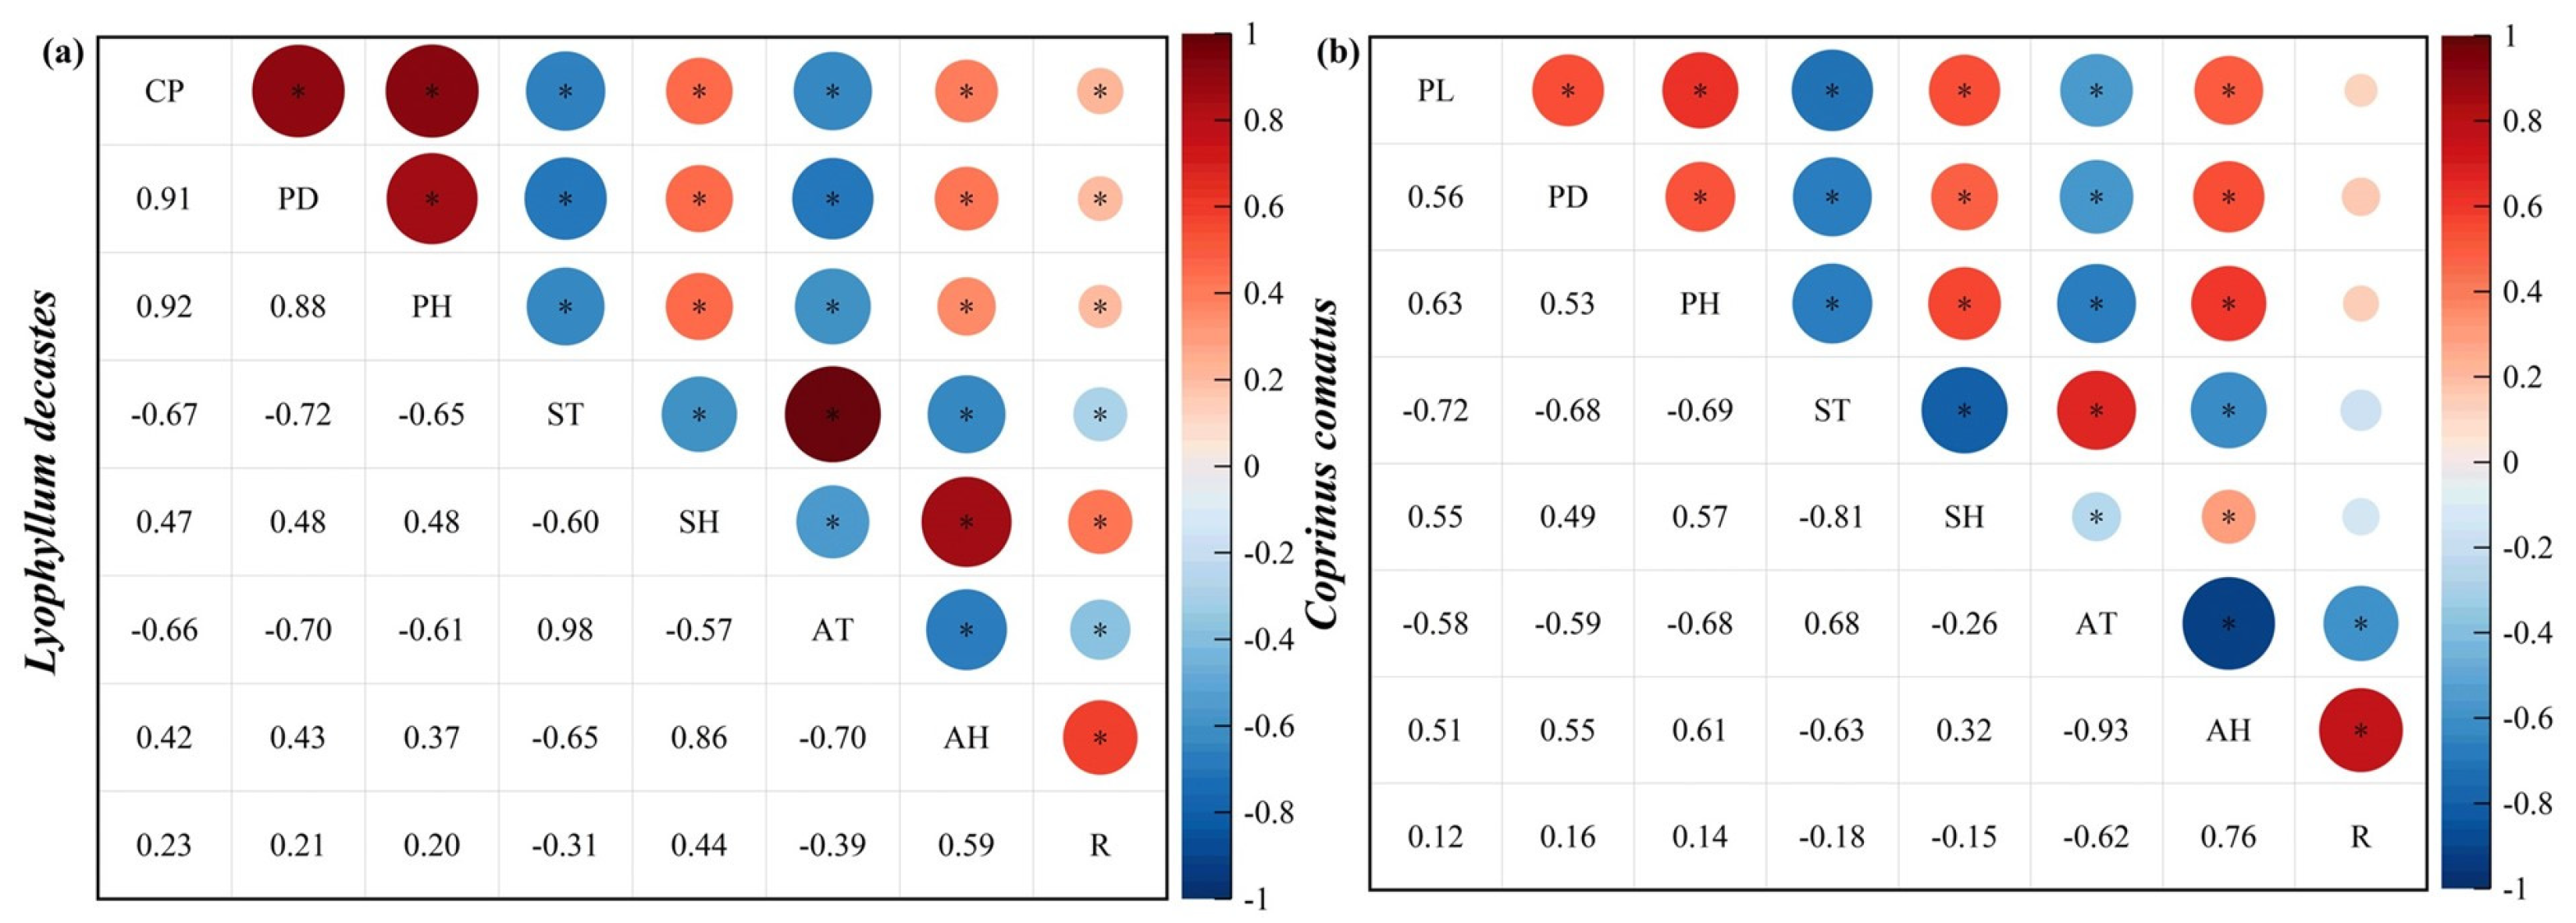
In this study, we investigated the effects of various meteorological factors on mushroom growth, specifically near-surface relative humidity, land surface temperature, air relative humidity, air temperature, and rainfall (Figure 5). The cluster perimeter (CP), height (PH), and pileus diameter (PD) of L. decastes were found to be negatively correlated with land surface temperature and air temperature (p < 0.01). Conversely, they exhibited positive correlations with near-surface relative humidity, air relative humidity, and rainfall (Figure 5a). Similarly, for C. comatus, the height (PH), pileus diameter (PD), and pileus length (PL) were negatively correlated with land surface temperature and air temperature while positively correlated with near-surface relative humidity, air relative humidity, and rainfall (Figure 5b).

Figure 5.
Pearson’s correlation between agronomic trait growth of mushrooms and environmental factors. (a) and (b) represent L. decastes and C. comatus, respectively. CP: cluster perimeter; PH: height; PD: pileus diameter; PL: pileus length; ST: land surface temperature; SH: near-surface relative humidity; AT: air temperature; AH: air relative humidity; R: rainfall. Bubble area represents the absolute value of correlation matrix. Red: positive correlation coefficient. Blue: negative correlation coefficient. * indicates p < 0.05.
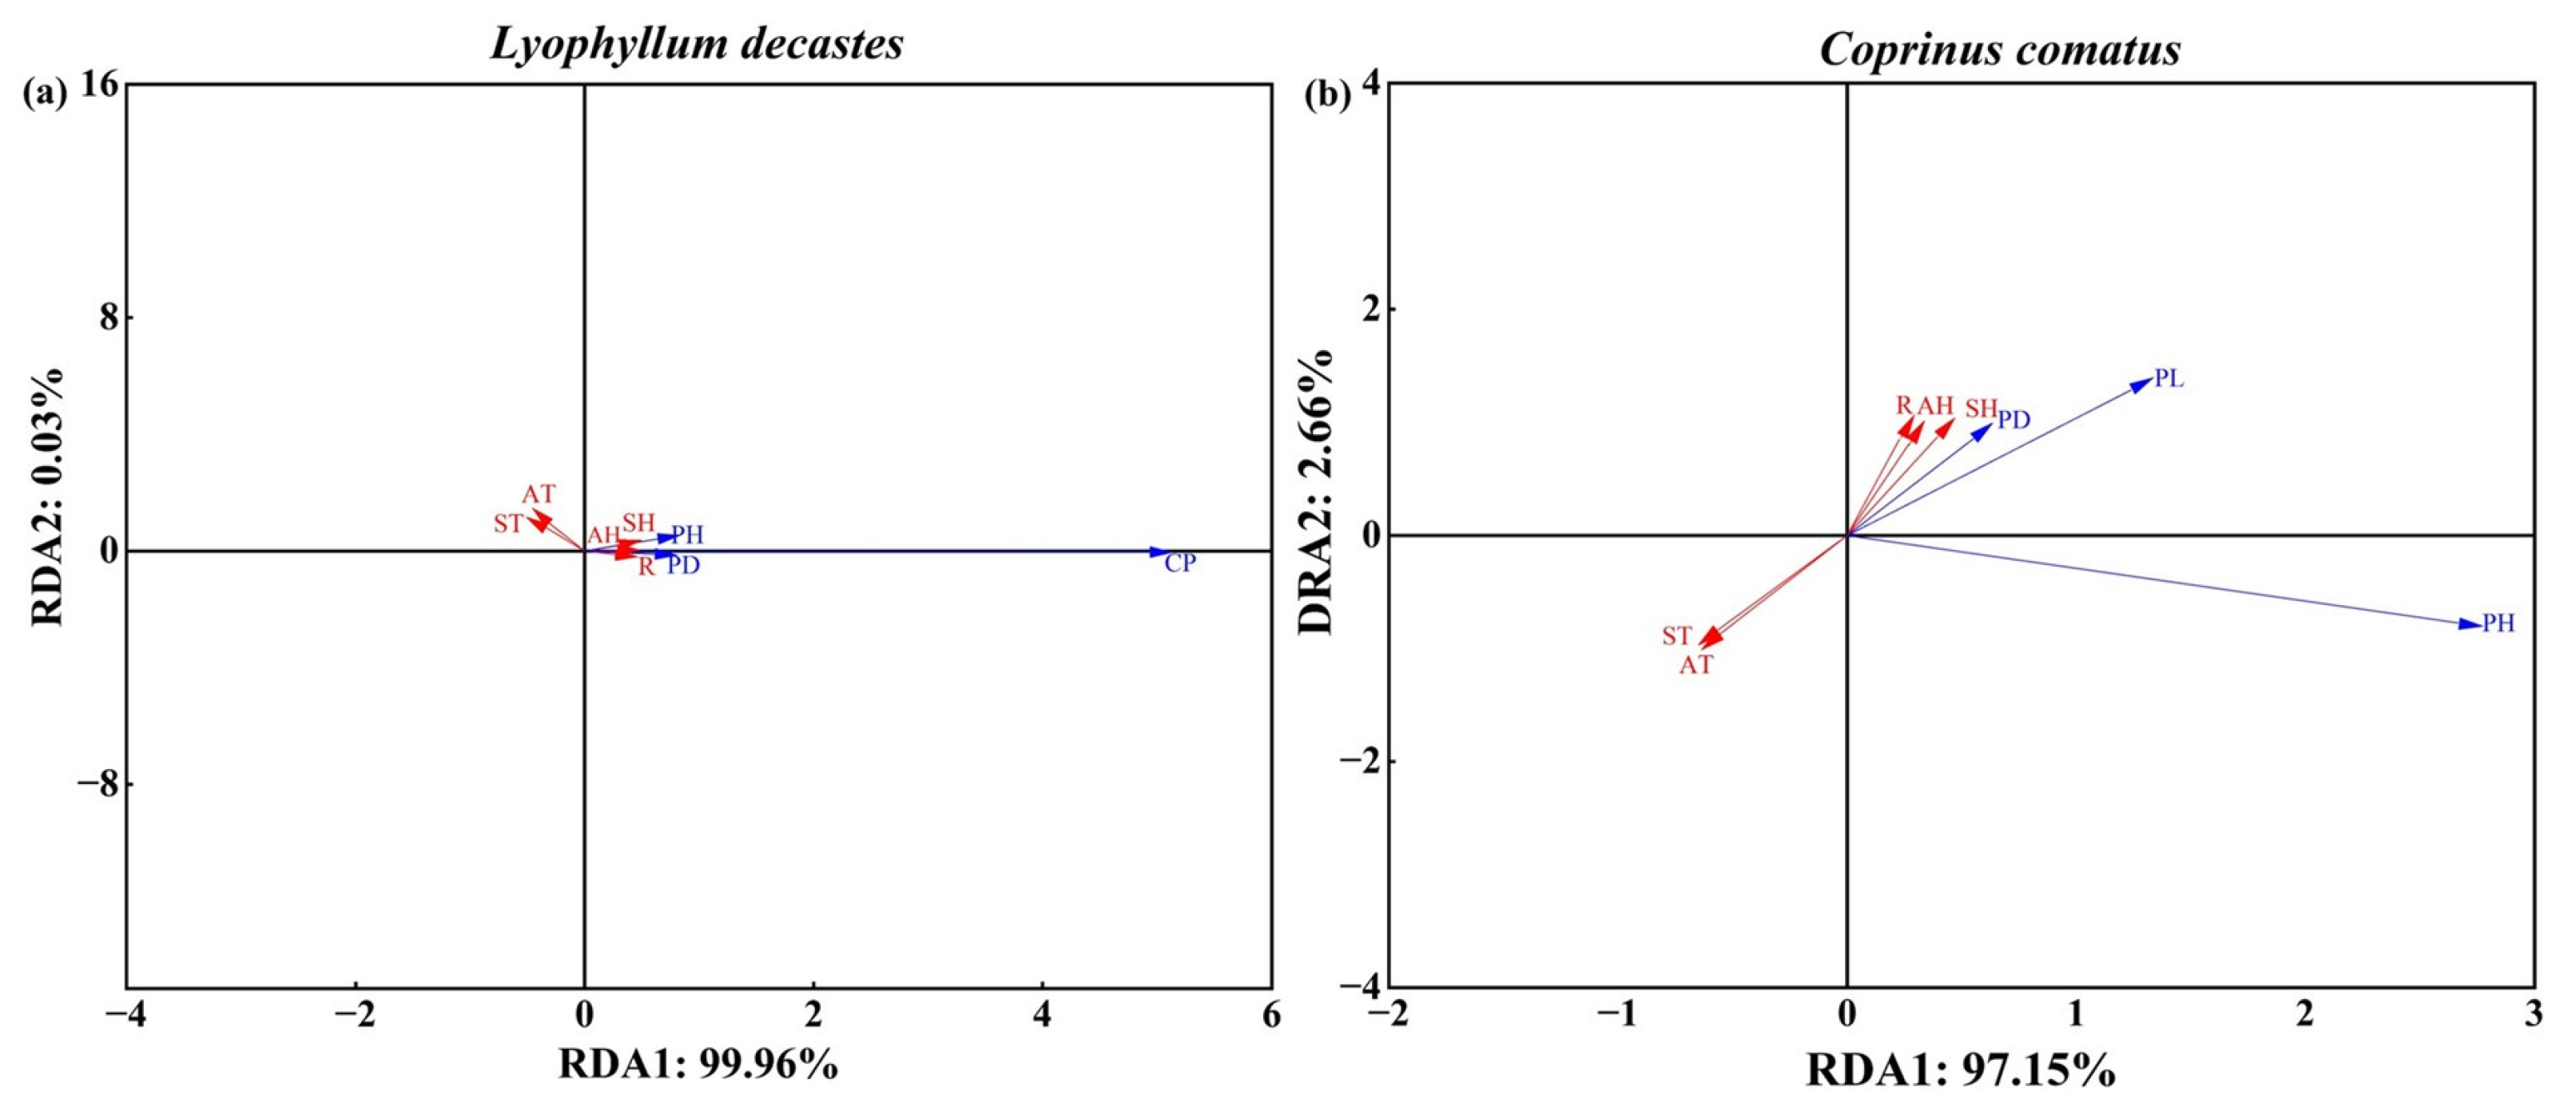
RDA was performed to analyze the response between agronomic traits and environmental factors. And the acute angle between the arrow lines indicated a positive correlation, while the obtuse angle indicated a negative correlation. The RDA results showed that the first two axes explained 99.96% (RDA1) and 0.03% (RDA2) of L. decastes agronomic traits (Figure 6a). Agronomic traits were positively influenced by the environmental variables AH, SH, and R, with explanatory capacities of 70.83%, 82.20%, and 66.02%, respectively. Agronomic traits were negatively influenced by the environmental variables ST and AT (Figure 6a). The first two axes, RDA1 and RDA2, explained 97.15% and 2.66%, respectively, of the total variance of C. comatus agronomic traits. The positive dominant response factors of agronomic traits were AH, SH, and R, with explanatory capacities of 38.07%, 55.62%, and 32.17%, respectively (Figure 6b). Similarly, agronomic traits were negatively influenced by the environmental variables ST and AT.
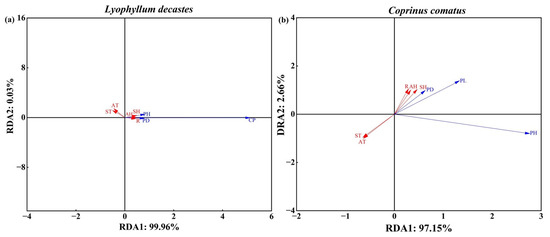
Figure 6.
RDA of environmental factors and three major agronomic traits. Red solid arrows represent environmental factors, and blue arrows represent agronomic traits, respectively. The cosine of the angle between the two rays indicates their correlation. (a) and (b) represent L. decastes and C. comatus, respectively. CP: cluster perimeter; PH: height; PD: pileus diameter; PL: pileus length; ST: land surface temperature; SH: near-surface relative humidity; AT: air temperature; AH: air relative humidity; R: rainfall.
Multiple linear regressions were used to highlight potential relationships between the morphology structure of mushrooms and near-surface relative humidity, land surface temperature, air relative humidity, air temperature, and rainfall (Table 3). The main influencing factors (p < 0.01) for the PH, PD, CP, and PL of these two types of mushrooms are land surface temperature, near-surface relative humidity, air relative humidity, air temperature, and rainfall (Table 3). A stepwise regression was used to rank the relative importance of each meteorological factor on agronomic traits of mushrooms (Table 4). The determination coefficient (R2) of each stepwise regression equation was significant at p < 0.01. The land surface temperature was the main factor that influenced the CP, PH, and PD of L. decastes (Table 4). Air temperature, air relative humidity, and near-surface relative humidity were the most important factors that affected the PH of C. comatus. The rate of growth of PL was most strongly determined by air temperature and land surface temperature. Furthermore, the growth of PD for C. comatus was predominantly influenced by air temperature, air relative humidity, and land surface temperature. The above results indicate that land surface temperature and air temperature are important environmental regulators of mushroom growth, and air relative humidity, near-surface relative humidity, and rainfall are key factors that promote mushroom growth.
Table 3.
Calculated multiple linear regression model outputs for agronomic trait changes in mushrooms with environmental factors.
Table 4.
Calculated stepwise regression model outputs for agronomic trait changes in mushrooms with environmental factors.
4. Discussion
4.1. Simulation of Mushroom Growth Rate
The growth and development of organisms are commonly described using model methods, derivations, and parametric analysis. This allows for a more precise understanding of an organism’s dynamic growth, yield formation, and response to the environment [5,34]. The logistic equation is frequently employed to simulate the growth process of organisms. There are reports that utilized a hierarchical Bayesian Function-Valued Trait (FVT) approach to fit logistic growth curves to leaf phenotypic data (length and width), characterizing leaf development [36]. Previous studies have introduced a moving boundary model to establish the uptake process of pesticides into potato tubers based on a logistic potato growth function [5]. Some scholars also observed the growth of Mortierella alpina colonies and found that their growth kinetics conformed to the logistic equation model [37]. In this study, it was observed that the growth of agronomic traits for L. decastes and C. comatus followed a logistic growth curve, consistent with previous research on the growth dynamics of Ganoderma lucidum in pumpkin juice [12]. Hence, the hypothesis that the growth process of mushrooms follows a logistic growth curve was confirmed by the study results. During our continuous observation period, we noticed that mushrooms tend to shrink somewhat in clear and dry weather. Conversely, mushrooms become very malleable on rainy days or when atmospheric humidity is high. Additionally, aside from environmental conditions, L. decastes are clustered mushrooms. It can germinate to form small fruiting bodies during the growth observation period. These factors may lead to measurement variability. Therefore, the reasons mentioned above could explain the outliers observed in the graph. By calculating the second-order derivative of the logistic growth curve equations, the time inflection points representing the fastest growth rates of different agronomic traits in L. decastes and C. comatus were obtained. During the observation period, the maximum growth rate of height was observed on the 5th day for L. decastes and the 3rd day for C. comatus. The variation can be attributed to differences in how species adapt to their habitats and their genetic characteristics. The growth cycle of wild C. comatus typically lasts around 8 days. As this period is surpassed, the mushroom tissue becomes soft and brown, the pileus is unfolded into an umbrella shape, and the fruiting bodies are finally liquefied into ink-like droplets, a process referred to as the “autolysis phenomenon” [29]. The mushroom autolysis phenomenon involves cell wall hydrolysis and energy biosynthesis, likely regulated by the ribosome [30]. Interestingly, there was an observed phenomenon where the maximum growth rates of PD and PL occurred earlier than the maximum growth rate of PH. This can be attributed to the agronomic traits and genetic characteristics of mushrooms. The mushroom’s pileus length makes up about half of the plant’s total length and is initially egg-shaped [29]. This structure may contribute to the rapid growth of pileus. Furthermore, water is known to play a critical role in mushroom growth, as it comprises a significant proportion of their body composition, about more than 90%. Given that mushroom pileus has direct exposure to rainfall and atmospheric water, it is reasonable to suggest that the availability of water in these external sources could contribute to the faster growth of the pileus compared to the height of the mushroom [38]. However, this study only focuses on the growth dynamics of L. decastes and C. comatus from young to mature mushrooms. Absolutely, further consideration of other stages of the life cycle of L. decastes and C. comatus, as well as exploring the growth patterns of different species and their influencing factors, would greatly enhance our understanding of mushroom growth dynamics. Additionally, understanding these variations can inform more targeted cultivation and management practices for edible mushroom species.
4.2. Important Agronomic Traits Affecting Mushroom Biomass
Biomass is an important component of the quantitative characteristics and productivity of ecosystems [39]. The allocation of biomass among different organs is a central research focus in ecology, as changes in biomass allocation can significantly impact organism growth and its acclimation to changing environments [40]. Similarly, the agronomic traits of organisms also determined the size of biomass [41]. Multiple studies have employed mathematical hypotheses, statistical analysis, and inference methods to identify the significant agronomic traits affecting biomass [39]. For example, research on trees and herbaceous plants has highlighted the importance of height (PH) in explaining biomass accumulation [42,43]. However, in some cases, other agronomic traits, such as crown width, may have a more significant impact on the aboveground biomass of Tamarix ramosissima and Halocnemum strobilaceum [44]. In the case of L. decastes and C. comatus, this study explored the key agronomic traits influencing biomass inspired by plant biomass prediction models. The results indicated that PH, SD, and PL were identified as crucial agronomic traits influencing biomass in C. comatus, while PH and SD were significant for L. decastes. Interestingly, the hypothesis that pileus diameter plays a significant role in determining biomass in mushrooms is refuted by the findings. It is important to note that the influence of agronomic traits on biomass accumulation can vary between different mushroom species, depending on their specific genetic characteristics and agronomic traits [24,29]. Previous studies have confirmed that manipulating environmental factors such as temperature, humidity, and light during the growth of mushrooms can lead to changes in their agronomic traits and yield [45]. For instance, the elongation of the stipe and the thinning of the pileus can be achieved through proper adjustments in temperature and humidity. Similarly, the manipulation of humidity and light intensity has been found to result in increased pileus diameter and stipe length for Lentinula edodes, thereby enhancing the overall yield [45]. Overall, these findings provide valuable insights for mushroom producers, allowing them to anticipate yield levels and optimize cultivation practices. By modifying environmental factors to manipulate critical agronomic traits, growers can potentially improve mushroom yields. Understanding the complex relationship between agronomic traits, genetic characteristics, and environmental factors is crucial for maximizing and enhancing overall productivity in mushroom cultivation.
4.3. Environmental Driving Factors of Mushroom Growth
This study investigated and analyzed the relationship between environmental factors and mushroom growth and how this relationship affects mushroom growth. Environmental factors, particularly rainfall, temperature, and humidity, are significant in shaping the growth, production, and diversity of fungi [46,47]. Temperature was a dominant factor influencing the diversity, yield, and growth of mushroom fruiting bodies [47,48]. Moisture has a stronger positive correlation with mushroom yield compared to temperature [3]. However, the summer temperature showed one significant negative correlation with the density of mushroom fruiting bodies, as well as with biomass. This is consistent with the effect of temperature on the growth morphology and structure of mushrooms in this study. This study further emphasizes the positive correlations between near-surface relative humidity, atmospheric humidity, and rainfall with mushroom growth, supporting the crucial role of environmental moisture in fostering mushroom growth. This can be attributed to the inherent characteristics of mushrooms themselves and their specific requirements for survival. For example, on the one hand, the water content in mushrooms is about 90% of the biomass. On the other hand, mushrooms require 70%–90% of the relative humidity of the environment [38]. Consequently, heightened air humidity and near-surface relative humidity levels are conducive to favorable mushroom growth. Moreover, rainfall additionally contributes to mushroom growth by modulating the environmental humidity levels. This is consistent with some studies that emphasized in their research that humidity is a key factor in controlling mushroom growth [18,20]. The study area has an alpine climate with significant temperature fluctuations between day and night, ranging from 4–16 °C during nighttime. The optimal temperature range for L. decastes and C. comatus growth is 10–26 °C [29,31]. This difference in temperature may contribute to the negative impact of air temperature and land surface temperature on the growth of C. comatus. The increase or decrease in temperature in late summer and early autumn in temperate zones and northern forests can extend the fruiting period, reduce the growth rate, and significantly impact mushroom characteristics [47,49]. Therefore, a suitable temperature and humid environment are more helpful for mushroom growth [18]. Multiple linear regression indicated that the agronomic traits of mushrooms had a significant association with any combination of climatic elements (Table 3). This indicates that mushroom growth is influenced by the synergistic effects of near-surface relative humidity, land surface temperature, air relative humidity, air temperature, and rainfall. Pearson’s correlation, RDA analysis, and stepwise regression synthesis showed that near-surface relative humidity, atmospheric humidity, and rainfall had a positive impact on the growth of L. decastes and C. comatus mushrooms. On the other hand, air temperature and land surface temperature had a negative effect on their growth. This suggests that humidity and precipitation facilitate mushroom growth while temperature acts as a key regulator. The decrease in environmental humidity can easily promote the autolysis of C. comatus, which leads to the advanced decline of C. comatus. The occurrence of recurved scales on the pileus of C. comatus can be seen as a response to reduced humidity in the environment [29]. Our research results have found that multiple factors interact in shaping mushroom growth, and the hypothesis that temperature is the primary factor in promoting mushroom growth is disproved. It is important to note that this study was short-term and conducted at a limited plot scale. Additionally, only L. decastes and C. comatus were studied, which may not provide a comprehensive understanding of other mushroom species and their interactions with environmental factors. To gain a more comprehensive understanding of the relationship between mushrooms and climatic conditions, future research should consider conducting multi-species and multi-site observations over a long period of time.
5. Conclusions
In summary, we focused on the dynamic growth process of mushrooms, the effects of environmental factors on mushroom growth, and the ranking of relative importance values affecting the accumulation of mushroom biomass. Our results revealed that the growth of L. decastes and C. comatus followed logistic growth curves. Concerning biomass accumulation, we determined that PH and SD were the primary agronomic traits influencing the biomass of L. decastes. Conversely, for C. comatus, in addition to PH and SD, PL also played a significant role in biomass. Humidity and rainfall are important factors in promoting L. decastes and C. comatus growth, and temperature is an important environmental regulator of mushroom growth. Further research is necessary to utilize regional environmental factors to forecast mushroom production.
Supplementary Materials
The following supporting information can be downloaded at: https://www.mdpi.com/article/10.3390/f15091552/s1, Figure S1. Diagram of L. decastes and C. comatus growth and change; Figure S2. Environmental factors of observation period.
Author Contributions
G.H., data curation, writing—original draft preparation, and writing—review and editing; F.Z., writing—review and funding acquisition; C.Z., formal analysis and writing—review; H.W., writing—review; Y.X., methodology and resources. All authors have read and agreed to the published version of the manuscript.
Funding
This work was supported by the National Natural Science Foundation of China (32271710) and the Gansu Province Industrial Support Project (2021CYZC-08).
Data Availability Statement
The raw data supporting the conclusions of this article will be made available by the authors on request.
Conflicts of Interest
The authors declare that they have no known competing financial interests or personal relationships that could have appeared to influence the work reported in this paper.
References
- Wang, X.M.; Zhang, J.; Wu, L.H.; Zhao, Y.L.; Li, T.; Li, J.Q.; Wang, Y.Z.; Liu, H.G. A mini-review of chemical composition and nutritional value of edible wild-grown mushroom from China. Food Chem. 2014, 15, 279–285. [Google Scholar] [CrossRef] [PubMed]
- Rasalanavho, M.; Moodley, R.; Jonnalagadda, S.B. Elemental bioaccumulation and nutritional value of five species of wild growing mushrooms from South Africa. Food Chem. 2020, 319, 126596. [Google Scholar] [CrossRef] [PubMed]
- Collado, E.; Bonet, J.A.; Camarero, J.J.; Egli, S.; Peter, M.; Salo, K.; Martínez-Peña, F.; Ohenoja, E.; Martín-Pinto, P.; Primicia, I.; et al. Mushroom productivity trends in relation to tree growth and climate across different European forest biomes. Sci. Total Environ. 2019, 689, 602–615. [Google Scholar] [CrossRef]
- Huang, X.Z.; Li, F.B.; Wang, Z.X.; Jin, Y.; Qian, H. Are allometric model parameters of aboveground biomass for trees phylogenetically constrained? Plant Divers. 2022, 45, 229–233. [Google Scholar] [CrossRef] [PubMed]
- Xiao, S.; Gong, Y.; Li, Z.; Fantke, P. Improving Pesticide Uptake Modeling into Potatoes: Considering Tuber Growth Dynamics. J. Agric. Food Chem. 2021, 69, 3607–3616. [Google Scholar] [CrossRef]
- Bhowmick, A.R.; Bhattacharya, S. A new growth curve model for biological growth: Some inferential studies on the growth of Cirrhinus mrigala. Math. Biosci. 2014, 254, 28–41. [Google Scholar] [CrossRef]
- Nguyen Hoang, T.; Do, H.T.T.; Bui, D.H.; Pham, D.K.; Hoang, T.A.; Do, D.N. Evaluation of non-linear growth curve models in the Vietnamese indigenous Mia chicken. Anim. Sci. J. 2021, 92, e13483. [Google Scholar] [CrossRef]
- Allen, H.R.; Ptashnyk, M. Mathematical Modelling of Auxin Transport in Plant Tissues: Flux Meets Signalling and Growth. Bull. Math. Biol. 2020, 82, 17. [Google Scholar] [CrossRef]
- Boettcher, T.J.; Rijal, B.; Cook, J.; Gautam, S. Modeling the presence and abundance of buckthorn across the forests of Wisconsin, USA using different regression techniques. For. Ecol. Manag. 2022, 506, 119960. [Google Scholar] [CrossRef]
- Hatamian-Zarmi, A.; Tasharofi, Z.; Alvandi, H.; Barshantashnizi, M.; Ebrahimi-Hosseinzadeh, B.; Ebrahimi-Hosseinzadeh, Z.B. Kinetic Modeling of Growth and Mycelial Exopolysaccharide Production by Lentinus edodes (Shiitake Edible Mushroom). Appl. Food Biotechnol. 2022, 9, 67–78. [Google Scholar] [CrossRef]
- Wang, L.; Li, L.L.; Zhou, Q.P. Established Digital Model of Fruit Body Growth of Agrocybe cylindracea Based on Network Programming. Discret. Dyn. Nat. Soc. 2021, 2021, 6643273. [Google Scholar] [CrossRef]
- Zhao, J.; Liu, W.; Chen, D.; Zhou, C.; Song, Y.; Zhang, Y.; Ni, Y.; Li, Q. Microbiological and physicochemical analysis of pumpkin juice fermentation by the basidiomycetous fungus Ganoderma lucidum. J. Food Sci. 2015, 80, C241–C251. [Google Scholar] [CrossRef] [PubMed]
- Zhang, T.; Lamb, E.G.; Soto-Cerda, B.; Duguid, S.; Cloutier, S.; Rowland, G.; Diederichsen, A.; Booker, H.M. Structural equation modeling of the Canadian flax (Linum usitatissimum L.) core collection for multiple phenotypic traits. Can. J. Plant Sci. 2015, 94, 1325–1332. [Google Scholar] [CrossRef]
- Brokamp, C.; Jandarov, R.; Rao, M.B.; LeMasters, G.; Ryan, P. Exposure assessment models for elemental components of particulate matter in an urban environment: A comparison of regression and random forest approaches. Atmos. Environ. 2017, 151, 1–11. [Google Scholar] [CrossRef]
- Li, X.Y.; Liu, Z.H.; Lin, H.; Wang, G.X.; Sun, H.; Long, J.P.; Zhang, M. Estimating the Growing Stem Volume of Chinese Pine and Larch Plantations based on Fused Optical Data Using an Improved Variable Screening Method and Stacking Algorithm. Remote Sens. 2020, 12, 871. [Google Scholar] [CrossRef]
- Büntgen, U.; Peter, M.; Kauserud, H.; Egli, S. Unraveling environmental drivers of a recent increase in Swiss fungi fruiting. Glob. Chang. Biol. 2013, 19, 2785–2794. [Google Scholar] [CrossRef] [PubMed]
- Tahvanainen, V.; Miina, J.; Kurttila, M.; Salo, K. Modelling the yields of marketed mushrooms in Picea abies stands in eastern Finland. For. Ecol. Manag. 2016, 362, 79–88. [Google Scholar] [CrossRef]
- Karavani, A.; De Cáceres, M.; de Aragón, J.M.; Bonet, J.A.; de-Miguel, S. Effect of climatic and soil moisture conditions on mushroom productivity and related ecosystem services in Mediterranean pine stands facing climate change. Agric. For. Meteorol. 2018, 248, 432–440. [Google Scholar] [CrossRef]
- Taye, Z.M.; Martínez-Peña, F.; Bonet, J.A.; de Aragón, J.M.; de-Miguel, S. Meteorological conditions and site characteristics driving edible mushroom production in Pinus pinaster forests of Central Spain. Fungal Ecol. 2016, 23, 30–41. [Google Scholar] [CrossRef]
- Yang, X.F.; Luedeling, E.; Chen, G.L.; Hyde, K.D.; Yang, Y.J.; Zhou, D.Q.; Xu, J.C.; Yang, Y.P. Climate change effects fruiting of the prize matsutake mushroom in China. Fungal Divers. 2012, 56, 189–198. [Google Scholar] [CrossRef]
- Egli, S. Mycorrhizal mushroom diversity and productivity—An indicator of forest health? Ann. For. Sci. 2011, 68, 81–88. [Google Scholar] [CrossRef]
- Högberg, P.; Högberg, M.N.; Göttlicher, S.G.; Betson, N.R.; Keel, S.G.; Metcalfe, D.B.; Campbell, C.; Schindlbacher, A.; Hurry, V.; Lundmark, T.; et al. High temporal resolution tracing of photosynthate carbon from the tree canopy to forest soil microorganisms. New Phytol. 2008, 177, 220–228. [Google Scholar] [CrossRef] [PubMed]
- Hu, Y.; Li, J.; Lin, H.; Liu, P.; Zhang, F.; Lin, X.; Liang, J.; Tao, Y.; Jiang, Y.; Chen, B. Ultrasonic treatment decreases Lyophyllum decastes fruiting body browning and affects energy metabolism. Ultrason. Sonochem. 2022, 89, 106111. [Google Scholar] [CrossRef] [PubMed]
- Qu, H.; Zhou, H.; Ma, T.; Zheng, Z.; Zheng, E.; Yang, H.; Gao, H. TMT-based quantitative proteomic analysis of postharvest Coprinus comatus fruiting body during storage. Postharvest Biol. Technol. 2022, 185, 111786. [Google Scholar] [CrossRef]
- Yuan, X.; Zhu, X.; Sun, R.; Jiang, W.; Zhang, D.; Liu, H.; Sun, B. Sensory attributes and characterization of aroma profiles of fermented sausages based on fibrous-like meat substitute from soybean protein and Coprinus comatus. Food Chem. 2022, 373, 131537. [Google Scholar] [CrossRef]
- Zhang, F.; Xiao, Y.; Pan, L.; Yu, L.; Liu, Y.; Li, D.; Liu, X. Effects of polysaccharides from Lyophyllum decastes (Fr.) Singer on gut microbiota via in vitro-simulated digestion and fermentation. Front. Microbiol. 2023, 14, 1083917. [Google Scholar] [CrossRef]
- Wang, Q.; Zhao, C.; Gao, C.; Xie, H.; Qiao, Y.; Gao, Y.; Yuan, L.; Wang, W.; Ge, L.; Zhang, G. Effects of environmental variables on seedling-sapling distribution of Qinghai spruce (Picea crassifolia) along altitudinal gradients. For. Ecol. Manag. 2017, 384, 54–64. [Google Scholar] [CrossRef]
- Peng, S.; Zhao, C.; Xu, Z.; Ashiq, M.W. Restoration and conservation potential of destroyed Qinghai spruce (Picea crassifolia) forests in the Qilian Mountains of northwest China. Mitig. Adapt. Strateg. Glob. Chang. 2016, 21, 153–165. [Google Scholar] [CrossRef]
- Nowakowski, P.; Naliwajko, S.K.; Markiewicz-Żukowska, R.; Borawska, M.H.; Socha, K. The two faces of Coprinus comatus-Functional properties and potential hazards. Phytother. Res. 2020, 34, 2932–2944. [Google Scholar] [CrossRef]
- Yang, H.; Zheng, Z.; Zhou, H.; Qu, H.; Gao, H. Proteomics Reveals the Mechanism Underlying the Autolysis of Postharvest Coprinus comatus Fruiting Bodies. J. Agric. Food Chem. 2022, 70, 1346–1357. [Google Scholar] [CrossRef]
- Wei, S.L.; Wang, Z.J.; Yu, H.P.; Chen, Y. Biological characteristics of Lyophyllum decastes (Fr.:Fr.) Singer. Mycosystema 2006, 25, 101–108. (In Chinese) [Google Scholar] [CrossRef]
- Wang, T.; Han, J.J.; Dai, H.Q.; Sun, J.Z.; Ren, J.W.; Wang, W.Z.; Qiao, S.S.; Liu, C.; Sun, L.; Liu, S.J.; et al. Polysaccharides from Lyophyllum decastes reduce obesity by altering gut microbiota and increasing energy expenditure. Carbohydr. Polym. 2022, 295, 119862. [Google Scholar] [CrossRef]
- Selvaggi, M.; Laudadio, V.; D’Alessandro, A.G.; Dario, C.; Tufarelli, V. Comparison on accuracy of different nonlinear models in predicting growth of Podolica bulls. Anim. Sci. J. 2017, 88, 1128–1133. [Google Scholar] [CrossRef] [PubMed]
- Ram, Y.; Dellus-Gur, E.; Bibi, M.; Karkare, K.; Obolski, U.; Feldman, M.W.; Cooper, T.F.; Berman, J.; Hadany, L. Predicting microbial growth in a mixed culture from growth curve data. Proc. Natl. Acad. Sci. USA. 2019, 116, 14698–14707. [Google Scholar] [CrossRef] [PubMed]
- Breiman, L. Random forests. Mach. Learn. 2001, 45, 5–32. [Google Scholar] [CrossRef]
- Baker, R.L.; Leong, W.F.; Welch, S.; Weinig, C. Mapping and Predicting Non-Linear Brassica rapa Growth Phenotypes Based on Bayesian and Frequentist Complex Trait Estimation. G3 Genes Genomes Genet. 2018, 8, 1247–1258. [Google Scholar] [CrossRef]
- Fang, X.; Zhao, G.; Dai, J.; Liu, H.; Wang, P.; Wang, L.; Song, J.; Zheng, Z. Macro-morphological characterization and kinetics of Mortierella alpina colonies during batch cultivation. PLoS ONE. 2018, 13, e0192803. [Google Scholar] [CrossRef]
- Xu, L.; Yang, W.; Qiu, T.; Gao, X.; Zhang, H.; Zhang, S.; Cui, H.; Guo, L.; Yu, H.; Yu, H. Complete genome sequences and comparative secretomic analysis for the industrially cultivated edible mushroom Lyophyllum decastes reveals insights on evolution and lignocellulose degradation potential. Front. Microbiol. 2023, 14, 1137162. [Google Scholar] [CrossRef] [PubMed]
- Husmann, K.; Rumpf, S.; Nagel, J. Biomass functions and nutrient contents of European beech, oak, sycamore maple and ash and their meaning for the biomass supply chain. J. Clean. Prod. 2017, 172, 4044–4056. [Google Scholar] [CrossRef]
- Pallas, B.; Da Silva, D.; Valsesia, P.; Yang, W.; Guillaume, O.; Lauri, P.E.; Vercambre, G.; Génard, M.; Costes, E. Simulation of carbon allocation and organ growth variability in apple tree by connecting architectural and source-sink models. Ann. Bot. 2016, 118, 317–330. [Google Scholar] [CrossRef]
- Asrat, Z.; Eid, T.; Gobakken, T.; Negash, M. Aboveground tree biomass prediction options for the Dry Afromontane forests in south-central Ethiopia. For. Ecol. Manag. 2020, 473, 118335. [Google Scholar] [CrossRef]
- Phan, S.M.; Nguyen, H.T.T.; Nguyen, T.K.; Lovelock, C. Modelling above ground biomass accumulation of mangrove plantations in Vietnam. For. Ecol. Manag. 2019, 432, 376–386. [Google Scholar] [CrossRef]
- Zhang, D.; Niu, D.; Chen, H.; Zhang, Y.; Fu, H. Estimation of Aboveground Biomass in an Alpine Meadow on the Eastern Qinghai-Tibetan Plateau. Mt. Res. 2014, 32, 453–459. [Google Scholar] [CrossRef]
- Zhang, D.; Wang, X. Estimating aboveground biomass of typical plant species in the oasis-desert transition zone of northern Tarim Basin. Chin. J. Ecol. 2019, 38, 3211–3220. [Google Scholar] [CrossRef]
- Li, Y.Z.; Lu, C.; Hou, Z.Y.; Fan, W.L.; Luo, X.L.; Zhang, F.; Li, Z.L.; Li, T.L. Establishment of Growth Models for Lentinua edodes Fruiting Body Development Based on Temperature and Relative Humidity. Acta Edulis Fungi 2021, 28, 87–97. [Google Scholar] [CrossRef]
- Primicia, I.; Camarero, J.J.; de Aragón, J.M.; de-Miguel, S.; Bonet, J.A. Linkages between climate, seasonal wood formation and mycorrhizal mushroom yields. Agric. For. Meteorol. 2016, 228, 339–348. [Google Scholar] [CrossRef]
- Andrew, C.; Heegaard, E.; Halvorsen, R.; Martinez-Peña, F.; Egli, S.; Kirk, P.M.; Bässler, C.; Büntgen, U.; Aldea, J.; Hoiland, K.; et al. Climate impacts on fungal community and trait dynamics. Fungal Ecol. 2016, 22, 17–25. [Google Scholar] [CrossRef]
- Hernández-Rodríguez, M.; de-Miguel, S.; Pukkala, T.; Oria-de-Rueda, J.A.; Martín-Pinto, P. Climate-sensitive models for mushroom yields and diversity in Cistusladanifer scrublands. Agric. For. Meteorol. 2015, 213, 173–182. [Google Scholar] [CrossRef]
- Diez, J.M.; James, T.Y.; McMunn, M.; Ibáñez, I. Predicting species-specific responses of fungi to climatic variation using historical records. Glob. Change Biol. 2013, 19, 3145–3154. [Google Scholar] [CrossRef]


Disclaimer/Publisher’s Note: The statements, opinions and data contained in all publications are solely those of the individual author(s) and contributor(s) and not of MDPI and/or the editor(s). MDPI and/or the editor(s) disclaim responsibility for any injury to people or property resulting from any ideas, methods, instructions or products referred to in the content. |
© 2024 by the authors. Licensee MDPI, Basel, Switzerland. This article is an open access article distributed under the terms and conditions of the Creative Commons Attribution (CC BY) license (https://creativecommons.org/licenses/by/4.0/).