
Satellite Assessment of Forest Health in Drought Conditions: A Novel Approach Combining Defoliation and Discolouration
 , , ,
, , ,
Abstract
:1. Introduction
2. Materials and Methods
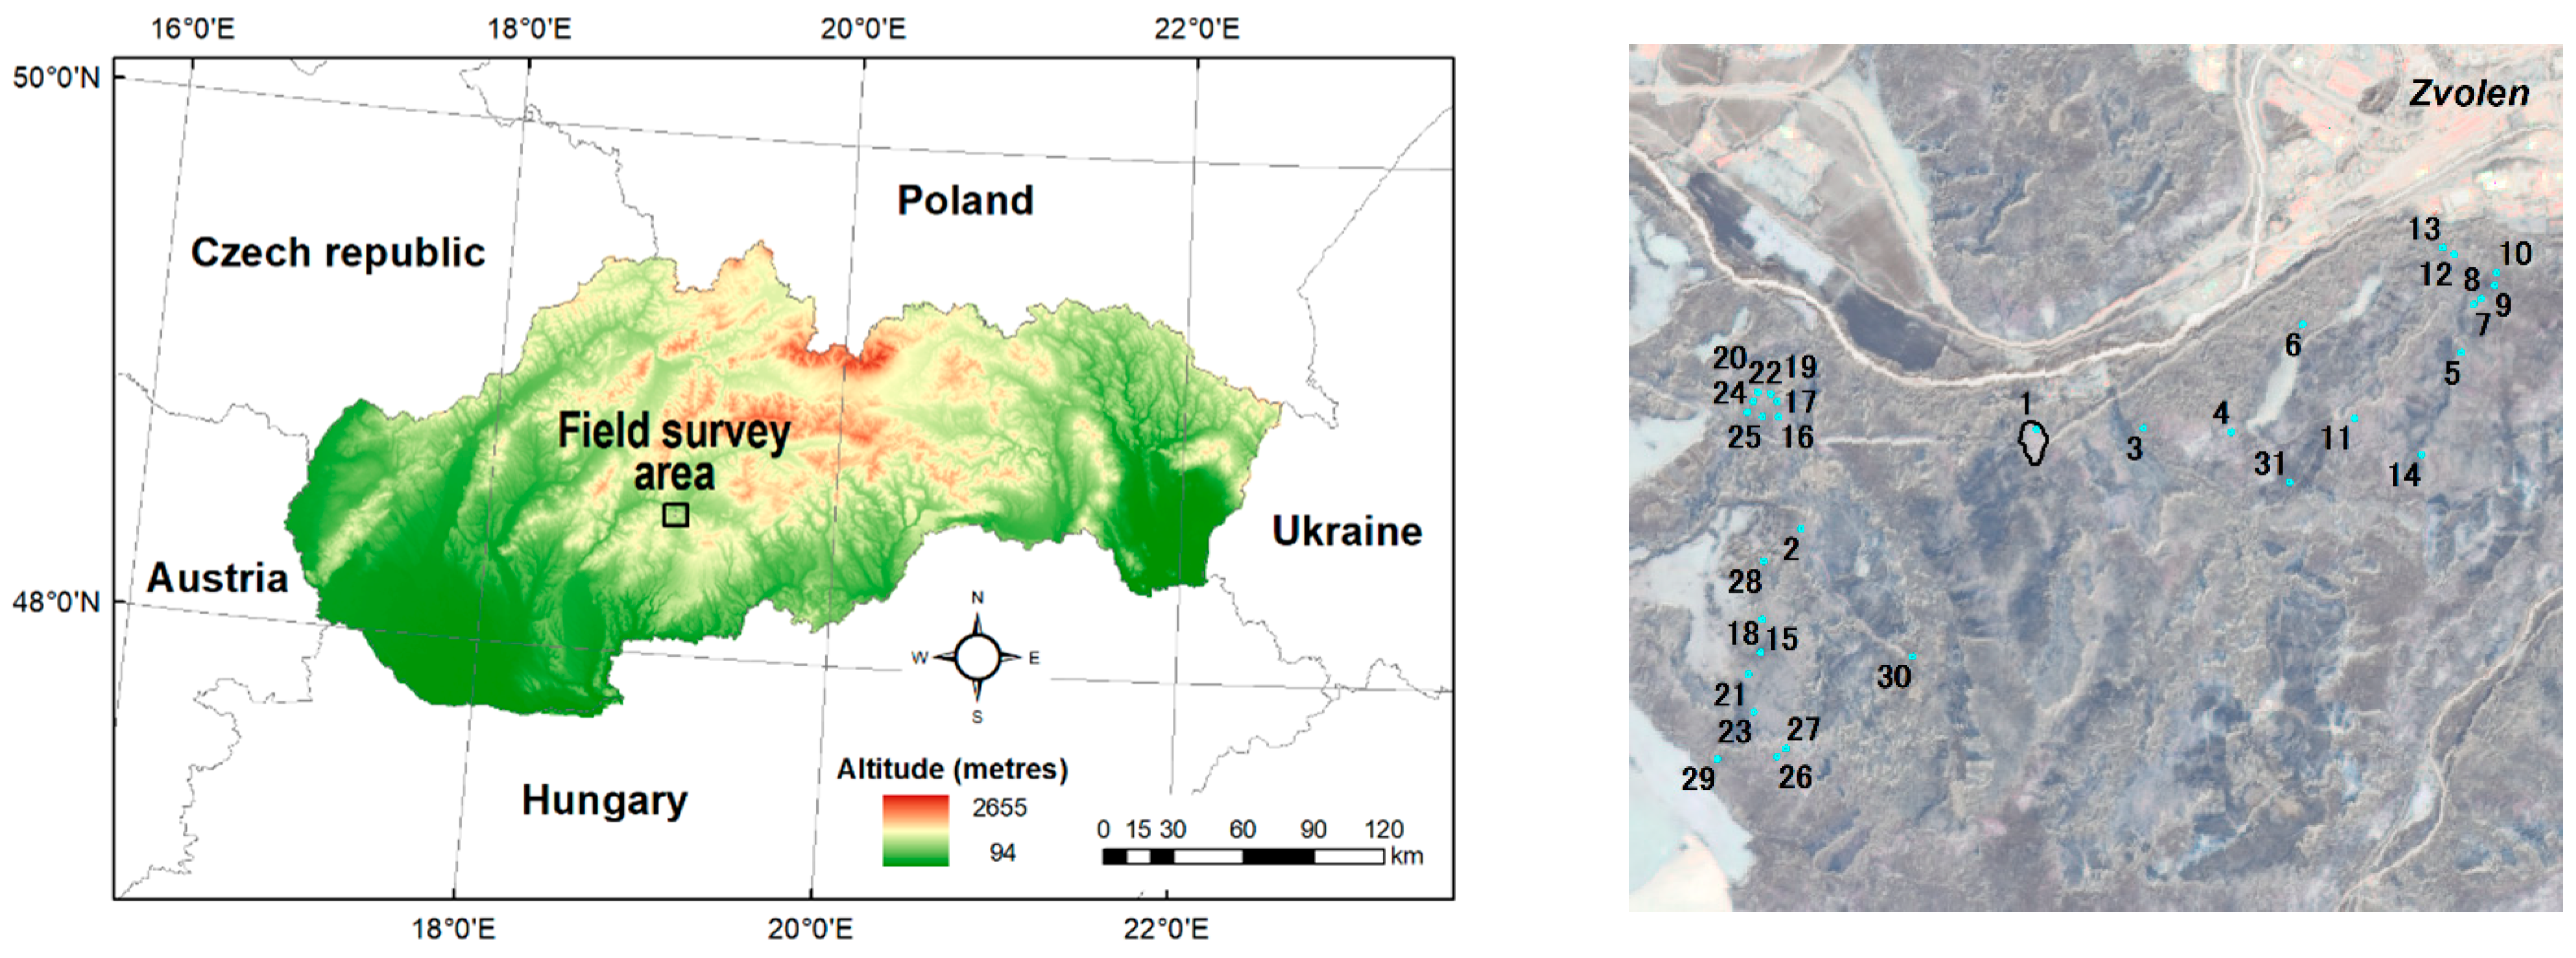
2.1. Study Area
2.2. Satellite Images, Mosaicking, Calibration, and Topographic Normalization
2.3. Visual Assessment of Crown Condition According to the ICP Forests Manual
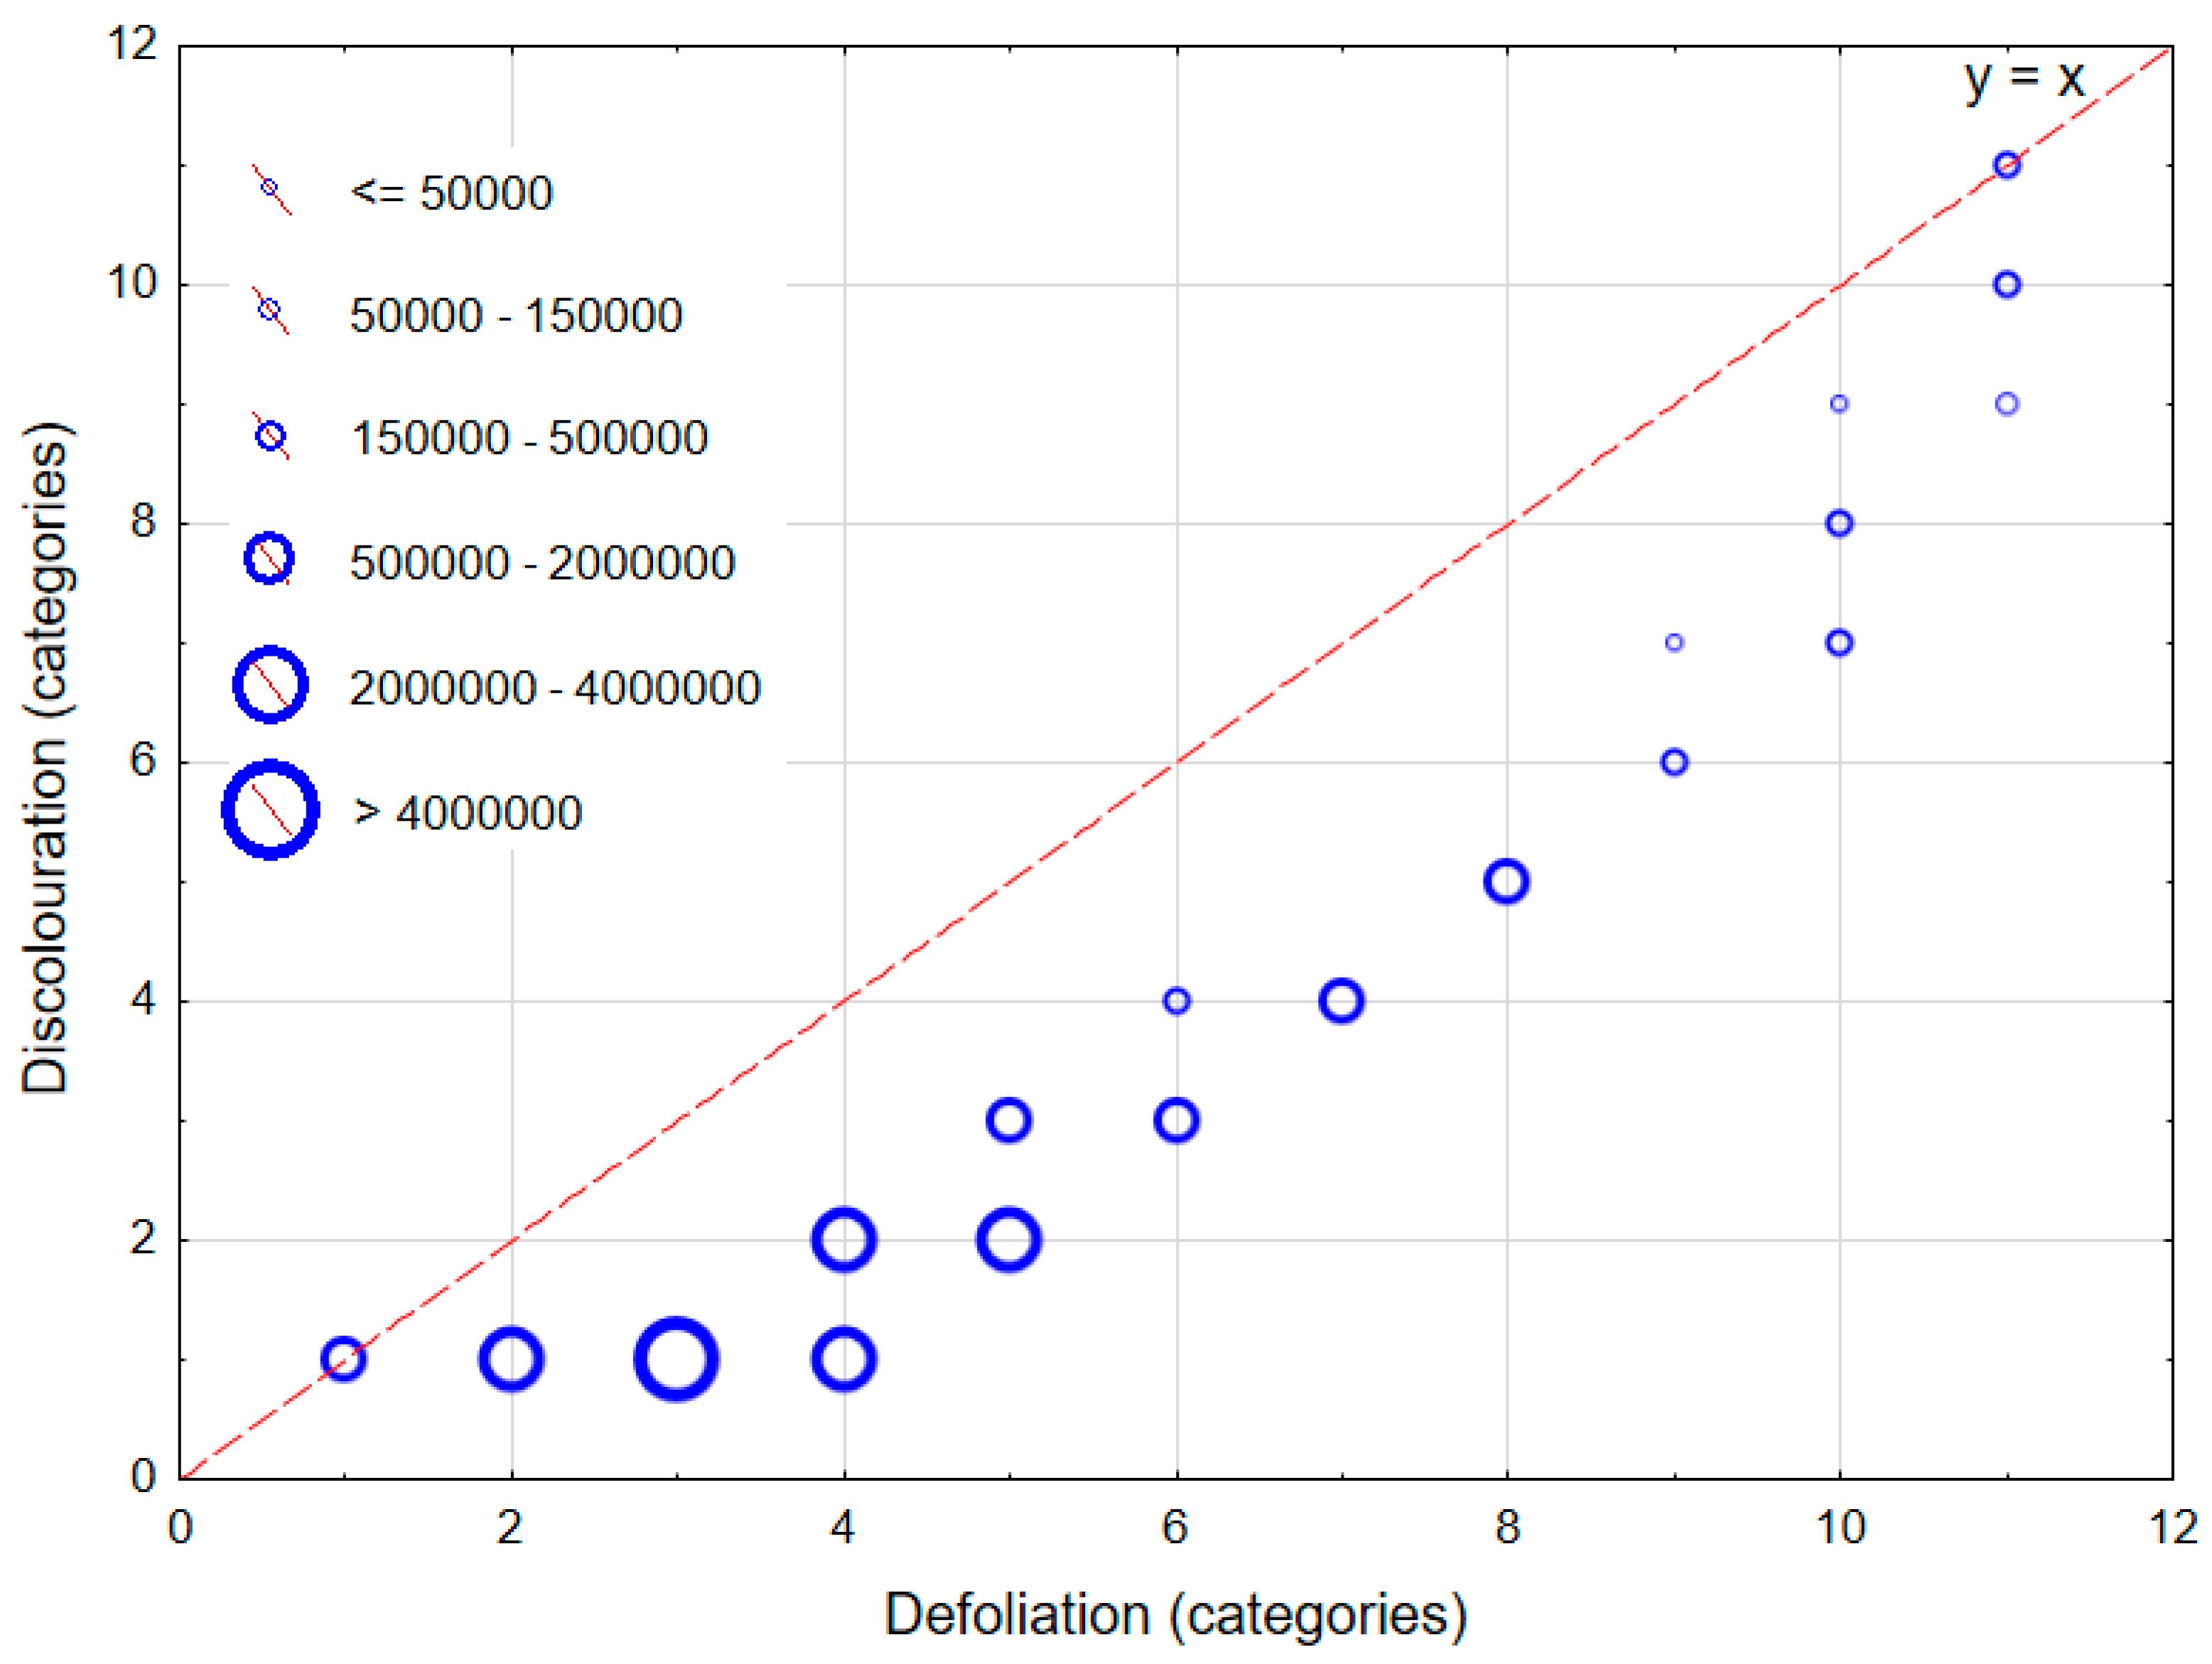
Coupling of Defoliation and Discolouration
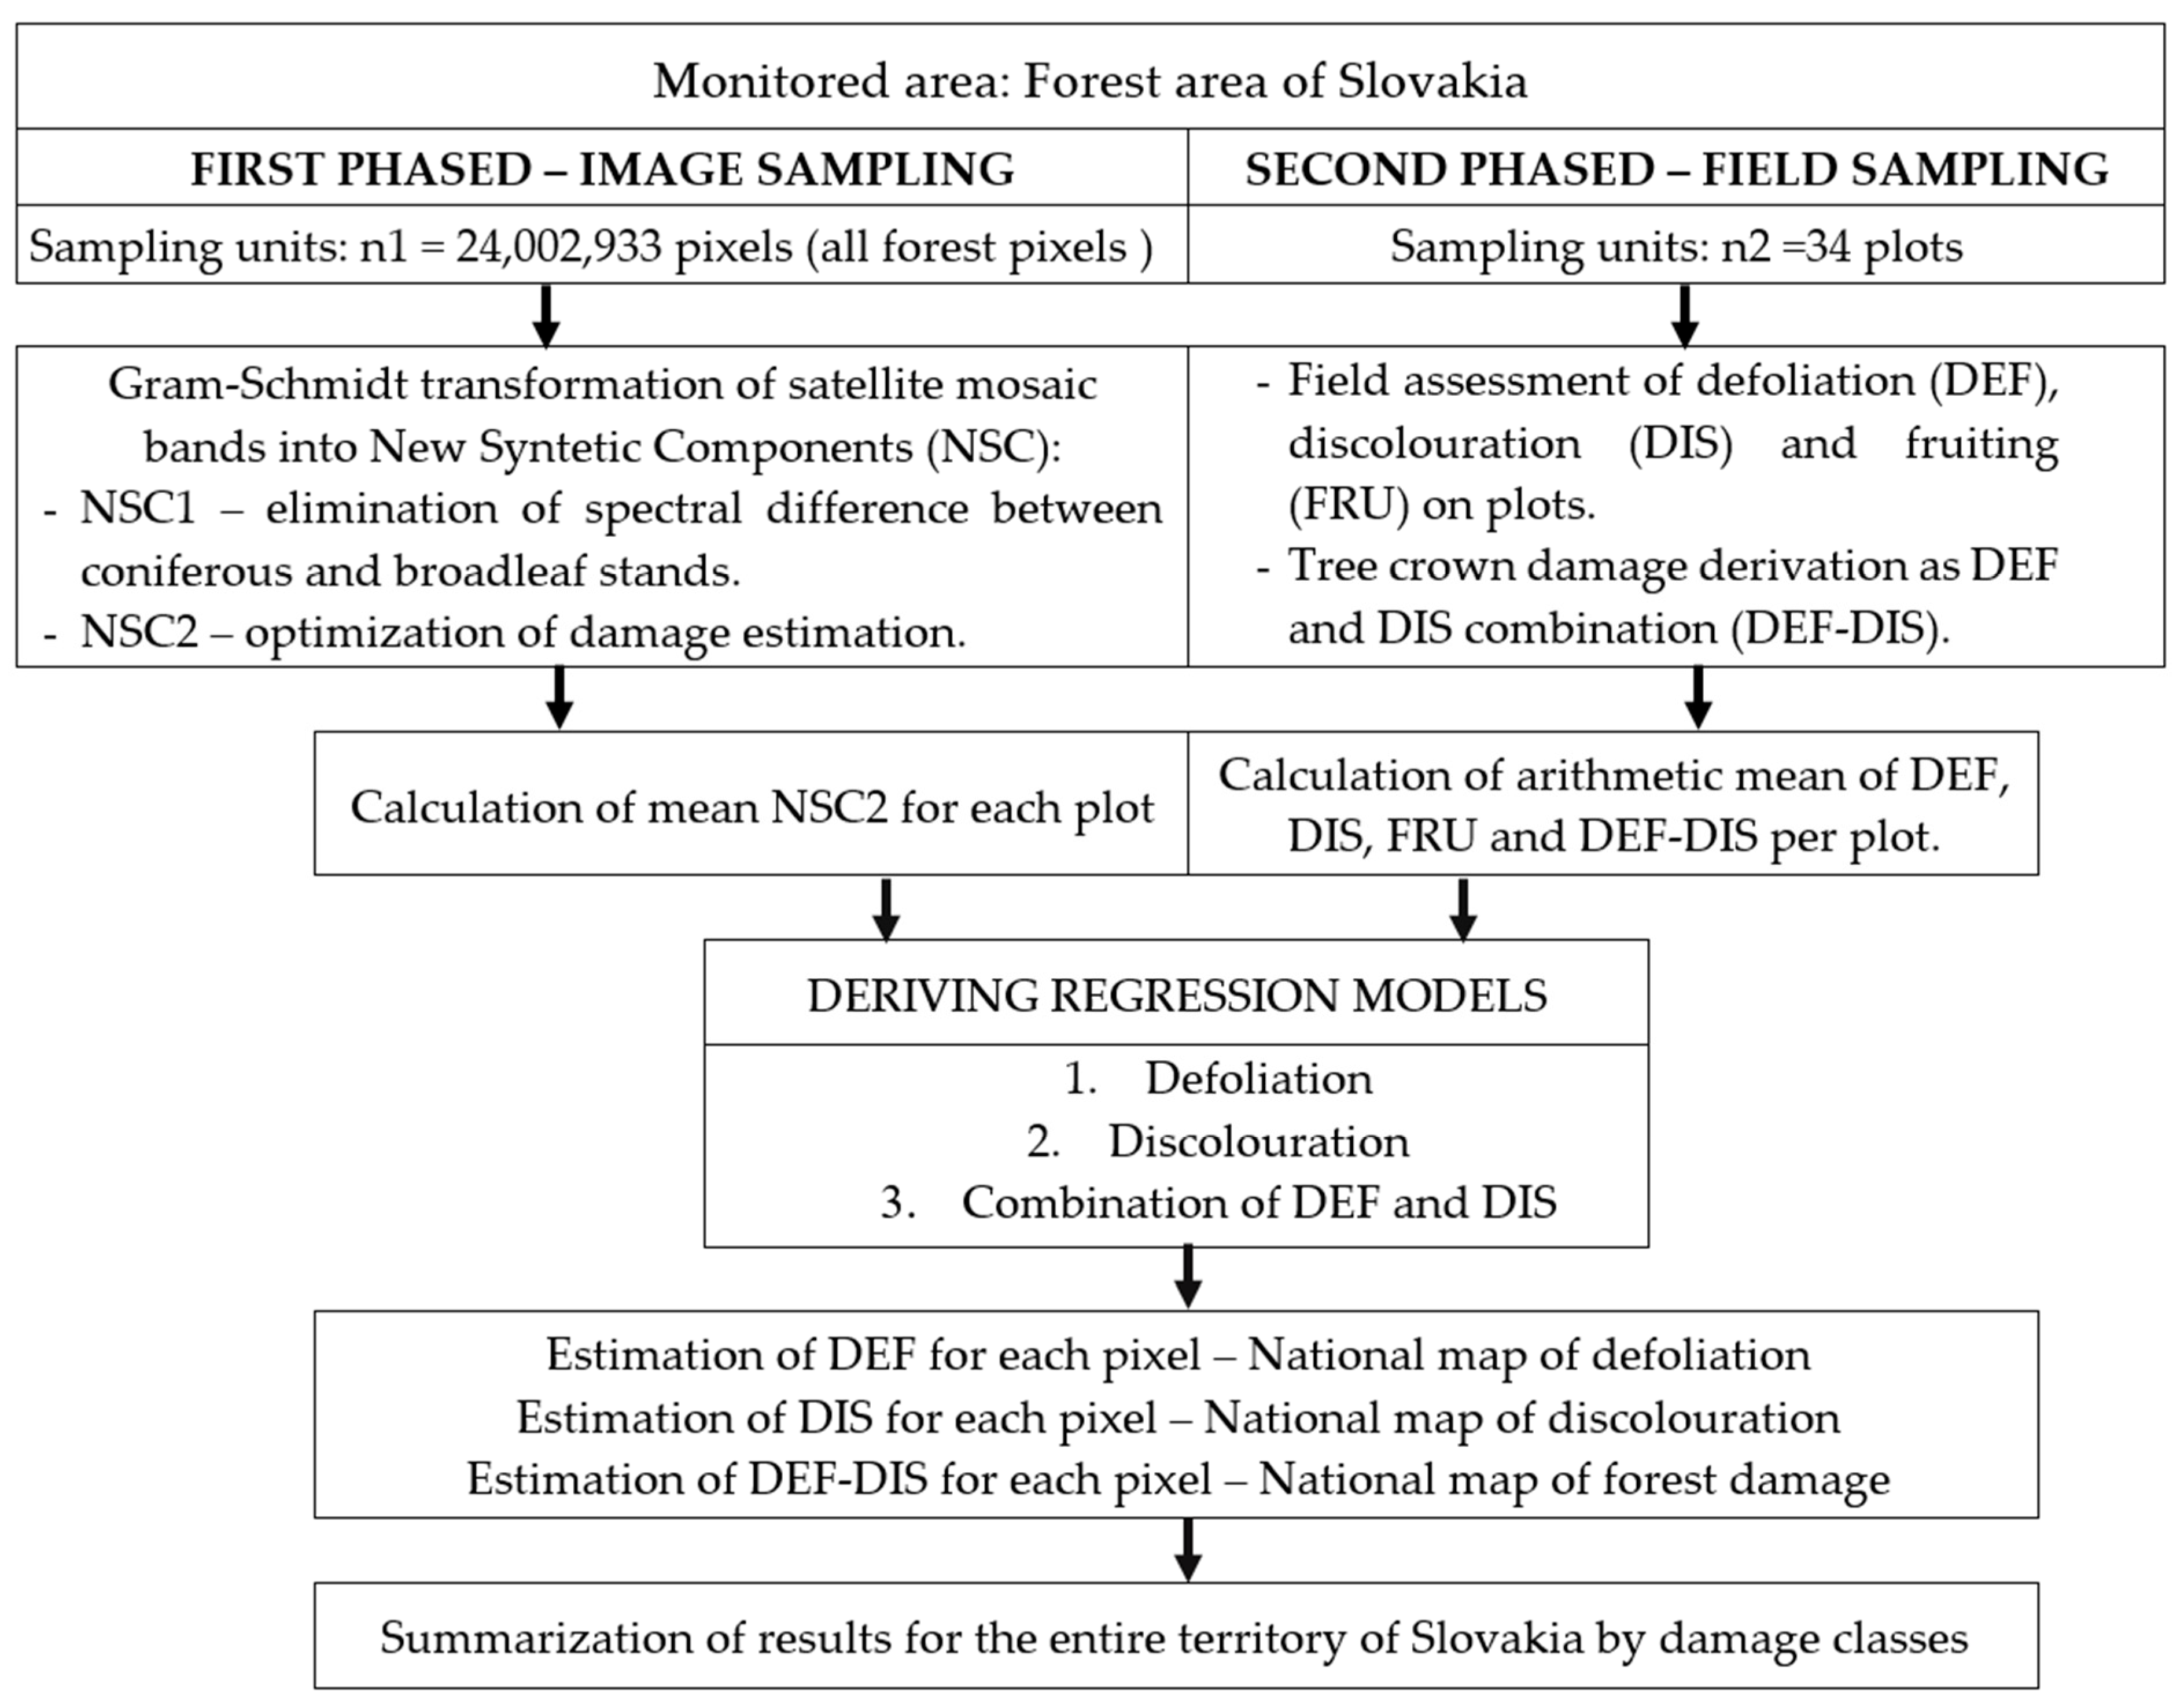
2.4. Two-Phase Sampling Assessment of Forest Damage
2.4.1. The Principles of Satellite Two-Phased Sampling
- -
- In the first phase, estimated sample units are usually not targeted values (e.g., defoliation) but auxiliary variables—spectral signatures (expressed as DN value)—which are utilised as independent variables in a reflectance regression model.
- -
- Alternatively, data from previous surveys can advantageously be used as data for damage estimation in the first phase of sampling.
- -
- Generally, the sizes (number) of the first (n1) and the second (n2) sample are the subjects for optimisation. This is based on the cost ratio between the second and the first sample units, the correlation between the target and auxiliary variables, and the required level of precision. When employing satellite data, the optimisation of n1 is not important. Data can be collected from the whole population, and the cost is not a problem.
2.4.2. The First Phase—Image Sampling
2.4.3. The Second Phase—Field Sampling
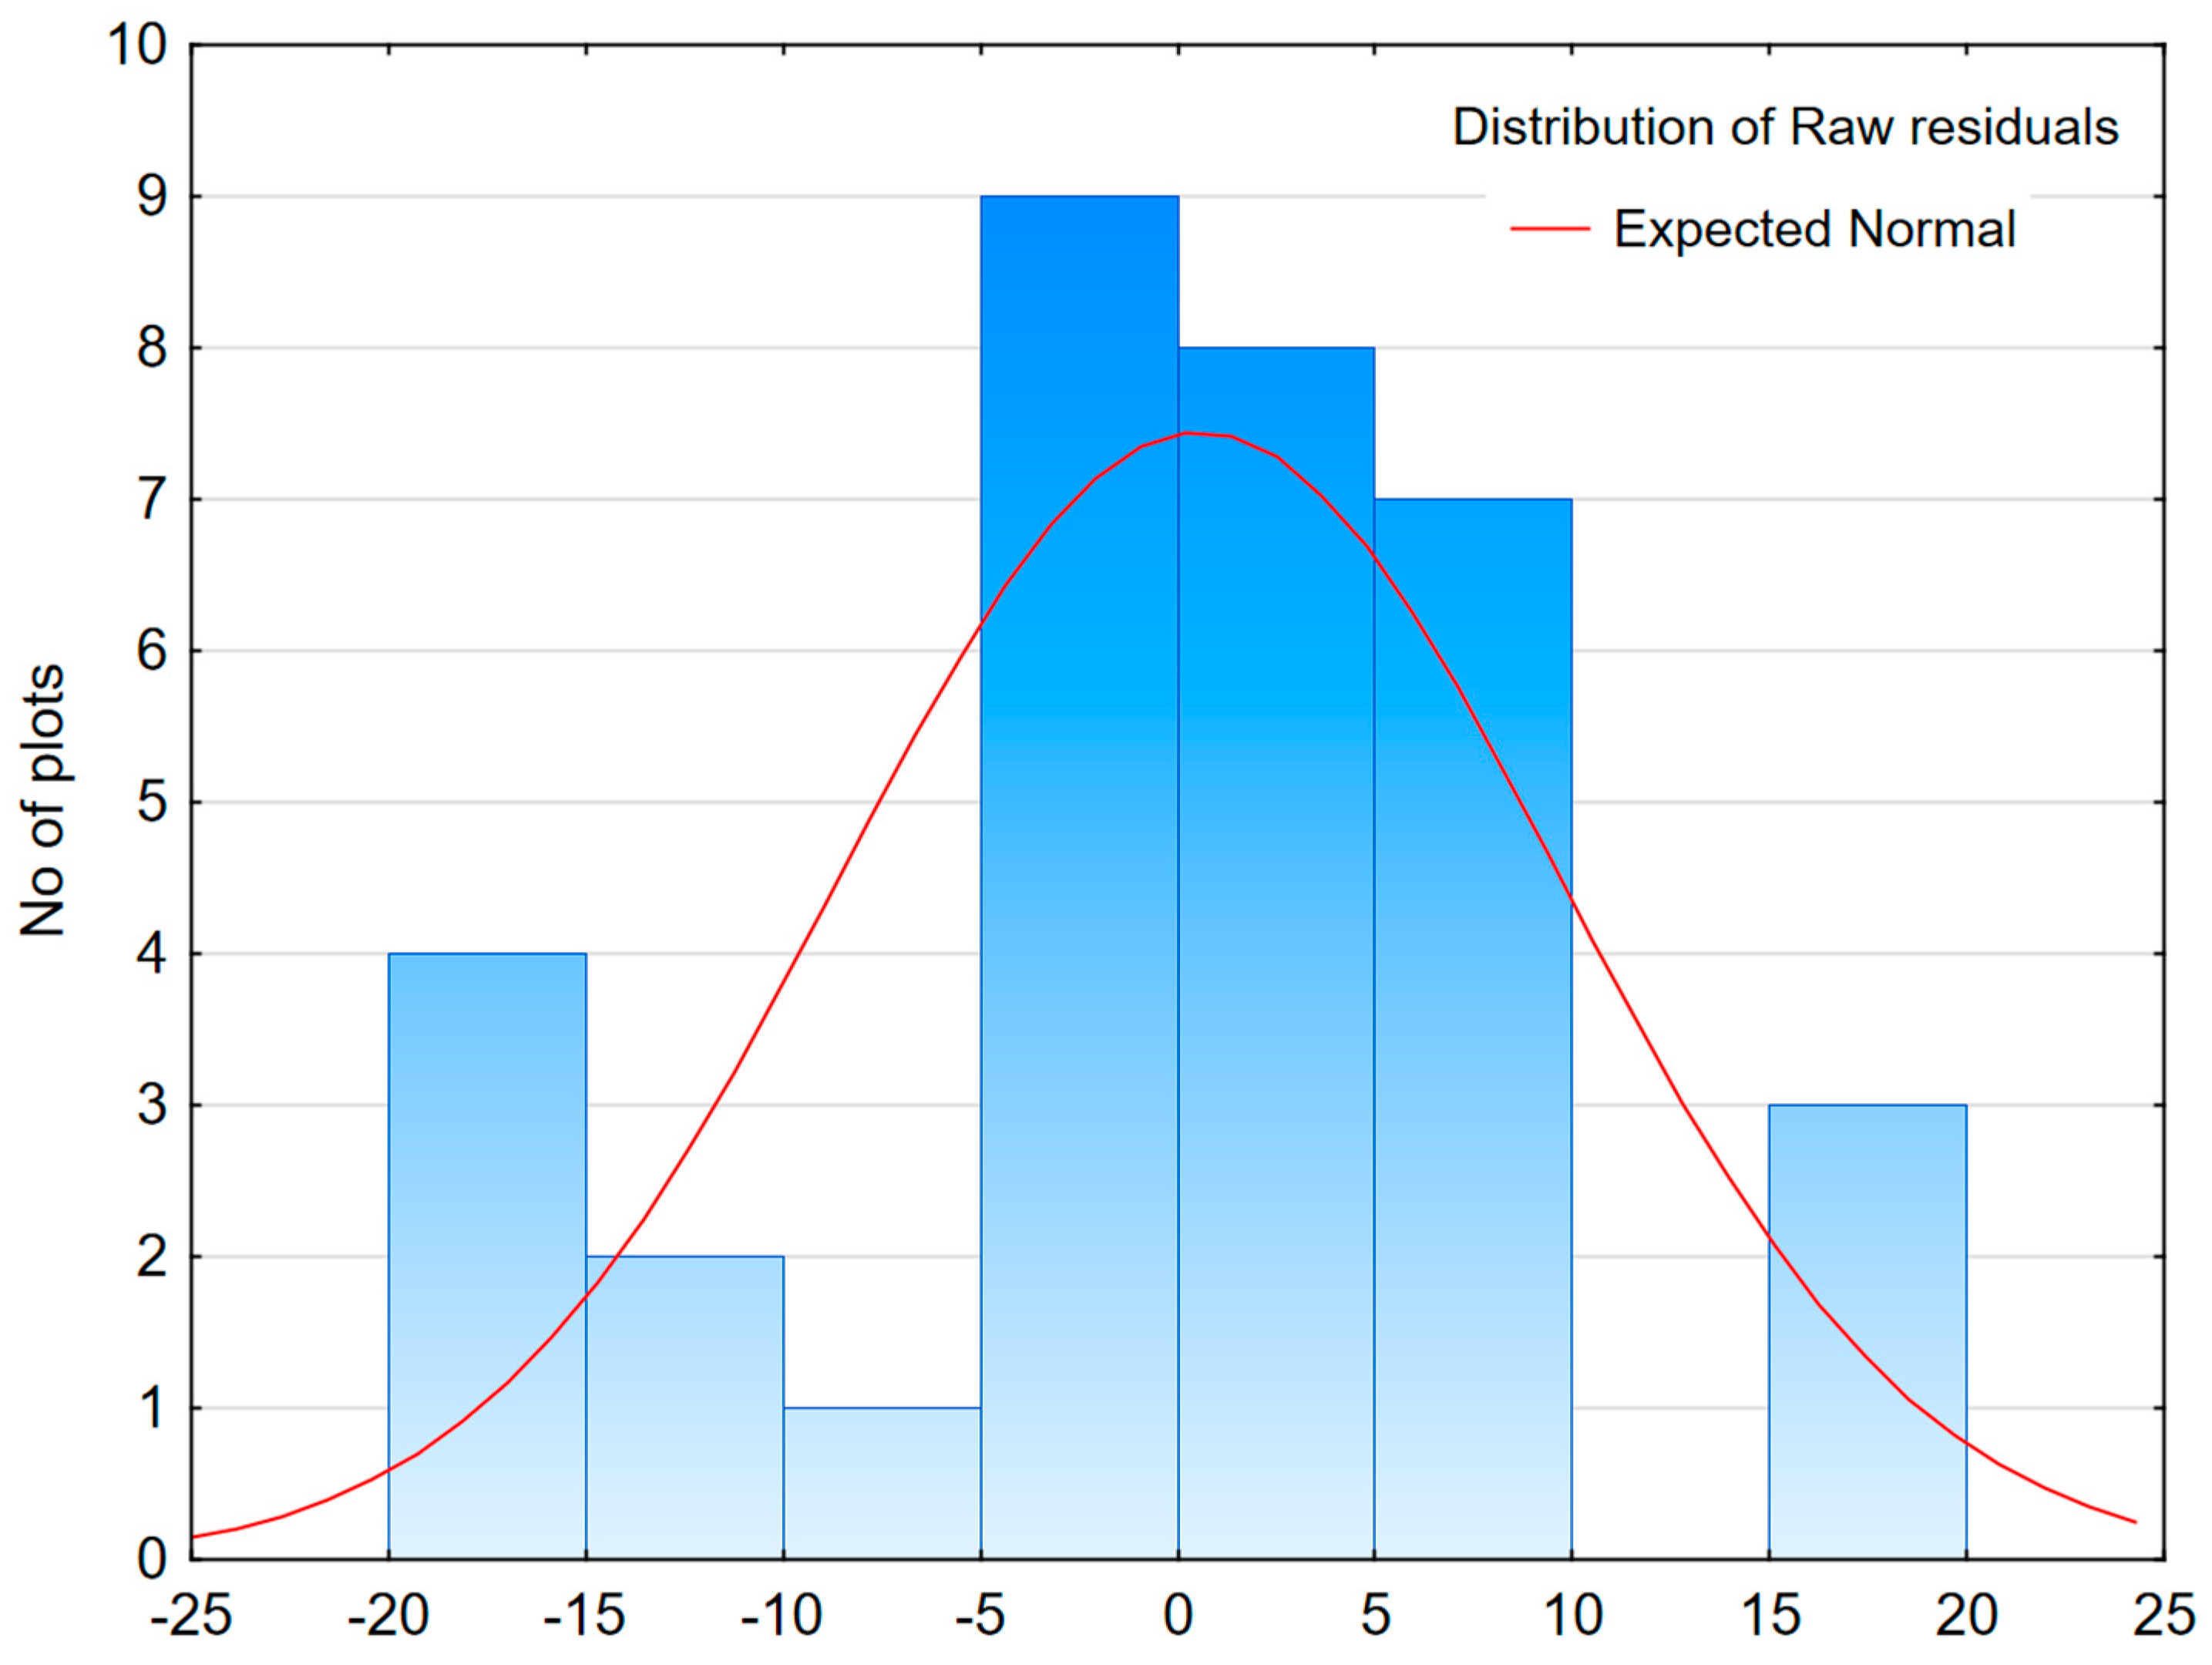
2.5. Statistical Evaluation of Data
3. Results
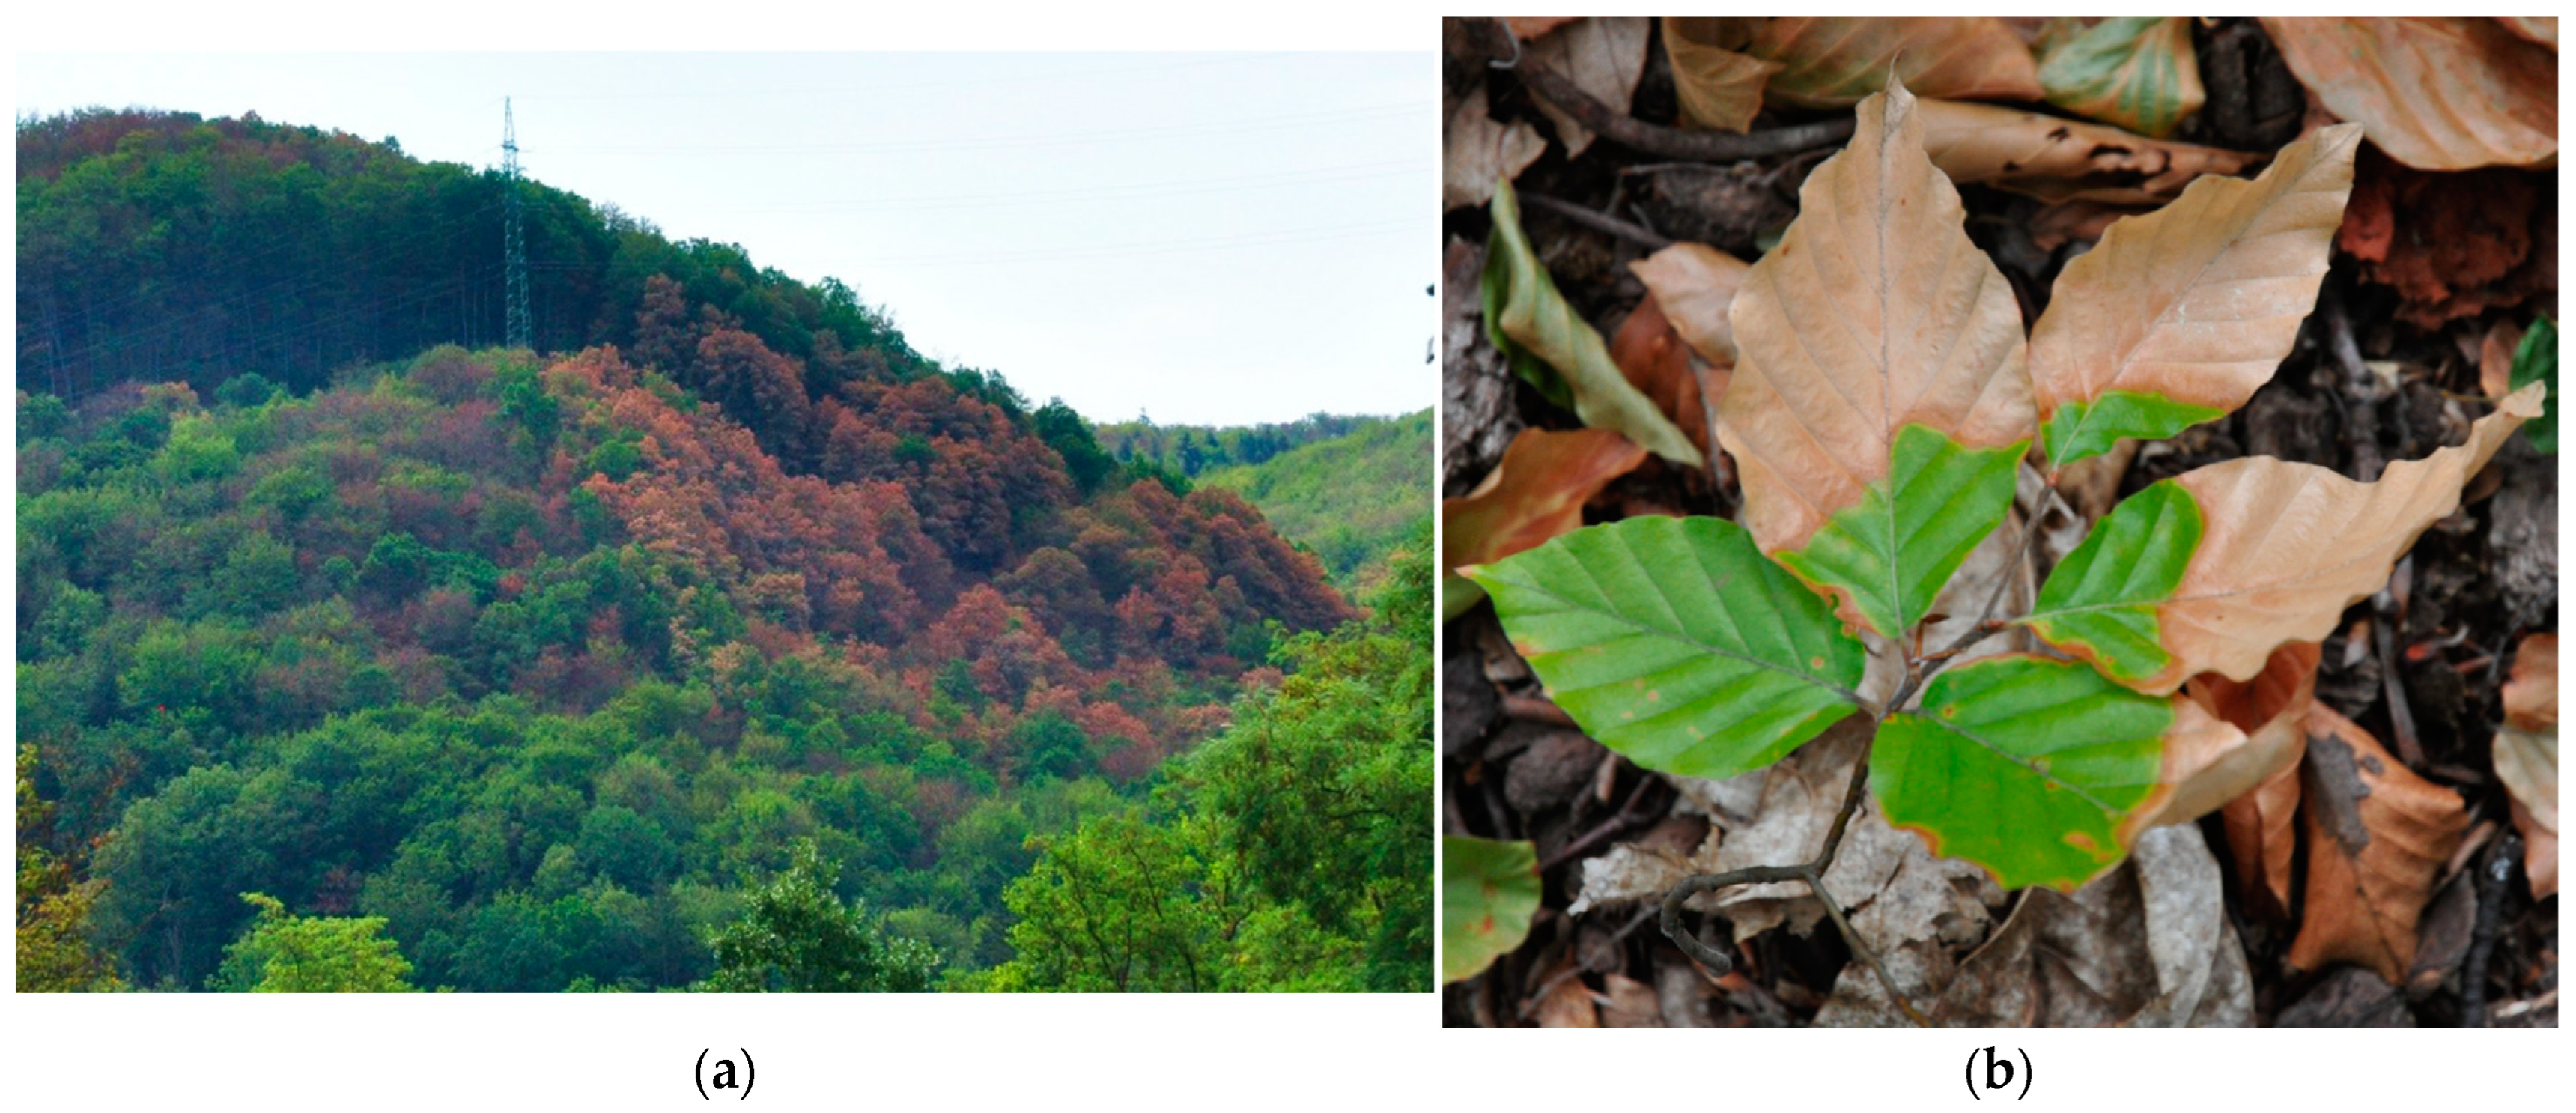
3.1. Damage Symptoms and Spectral Response of Forest
3.2. Classification of Forest Damage
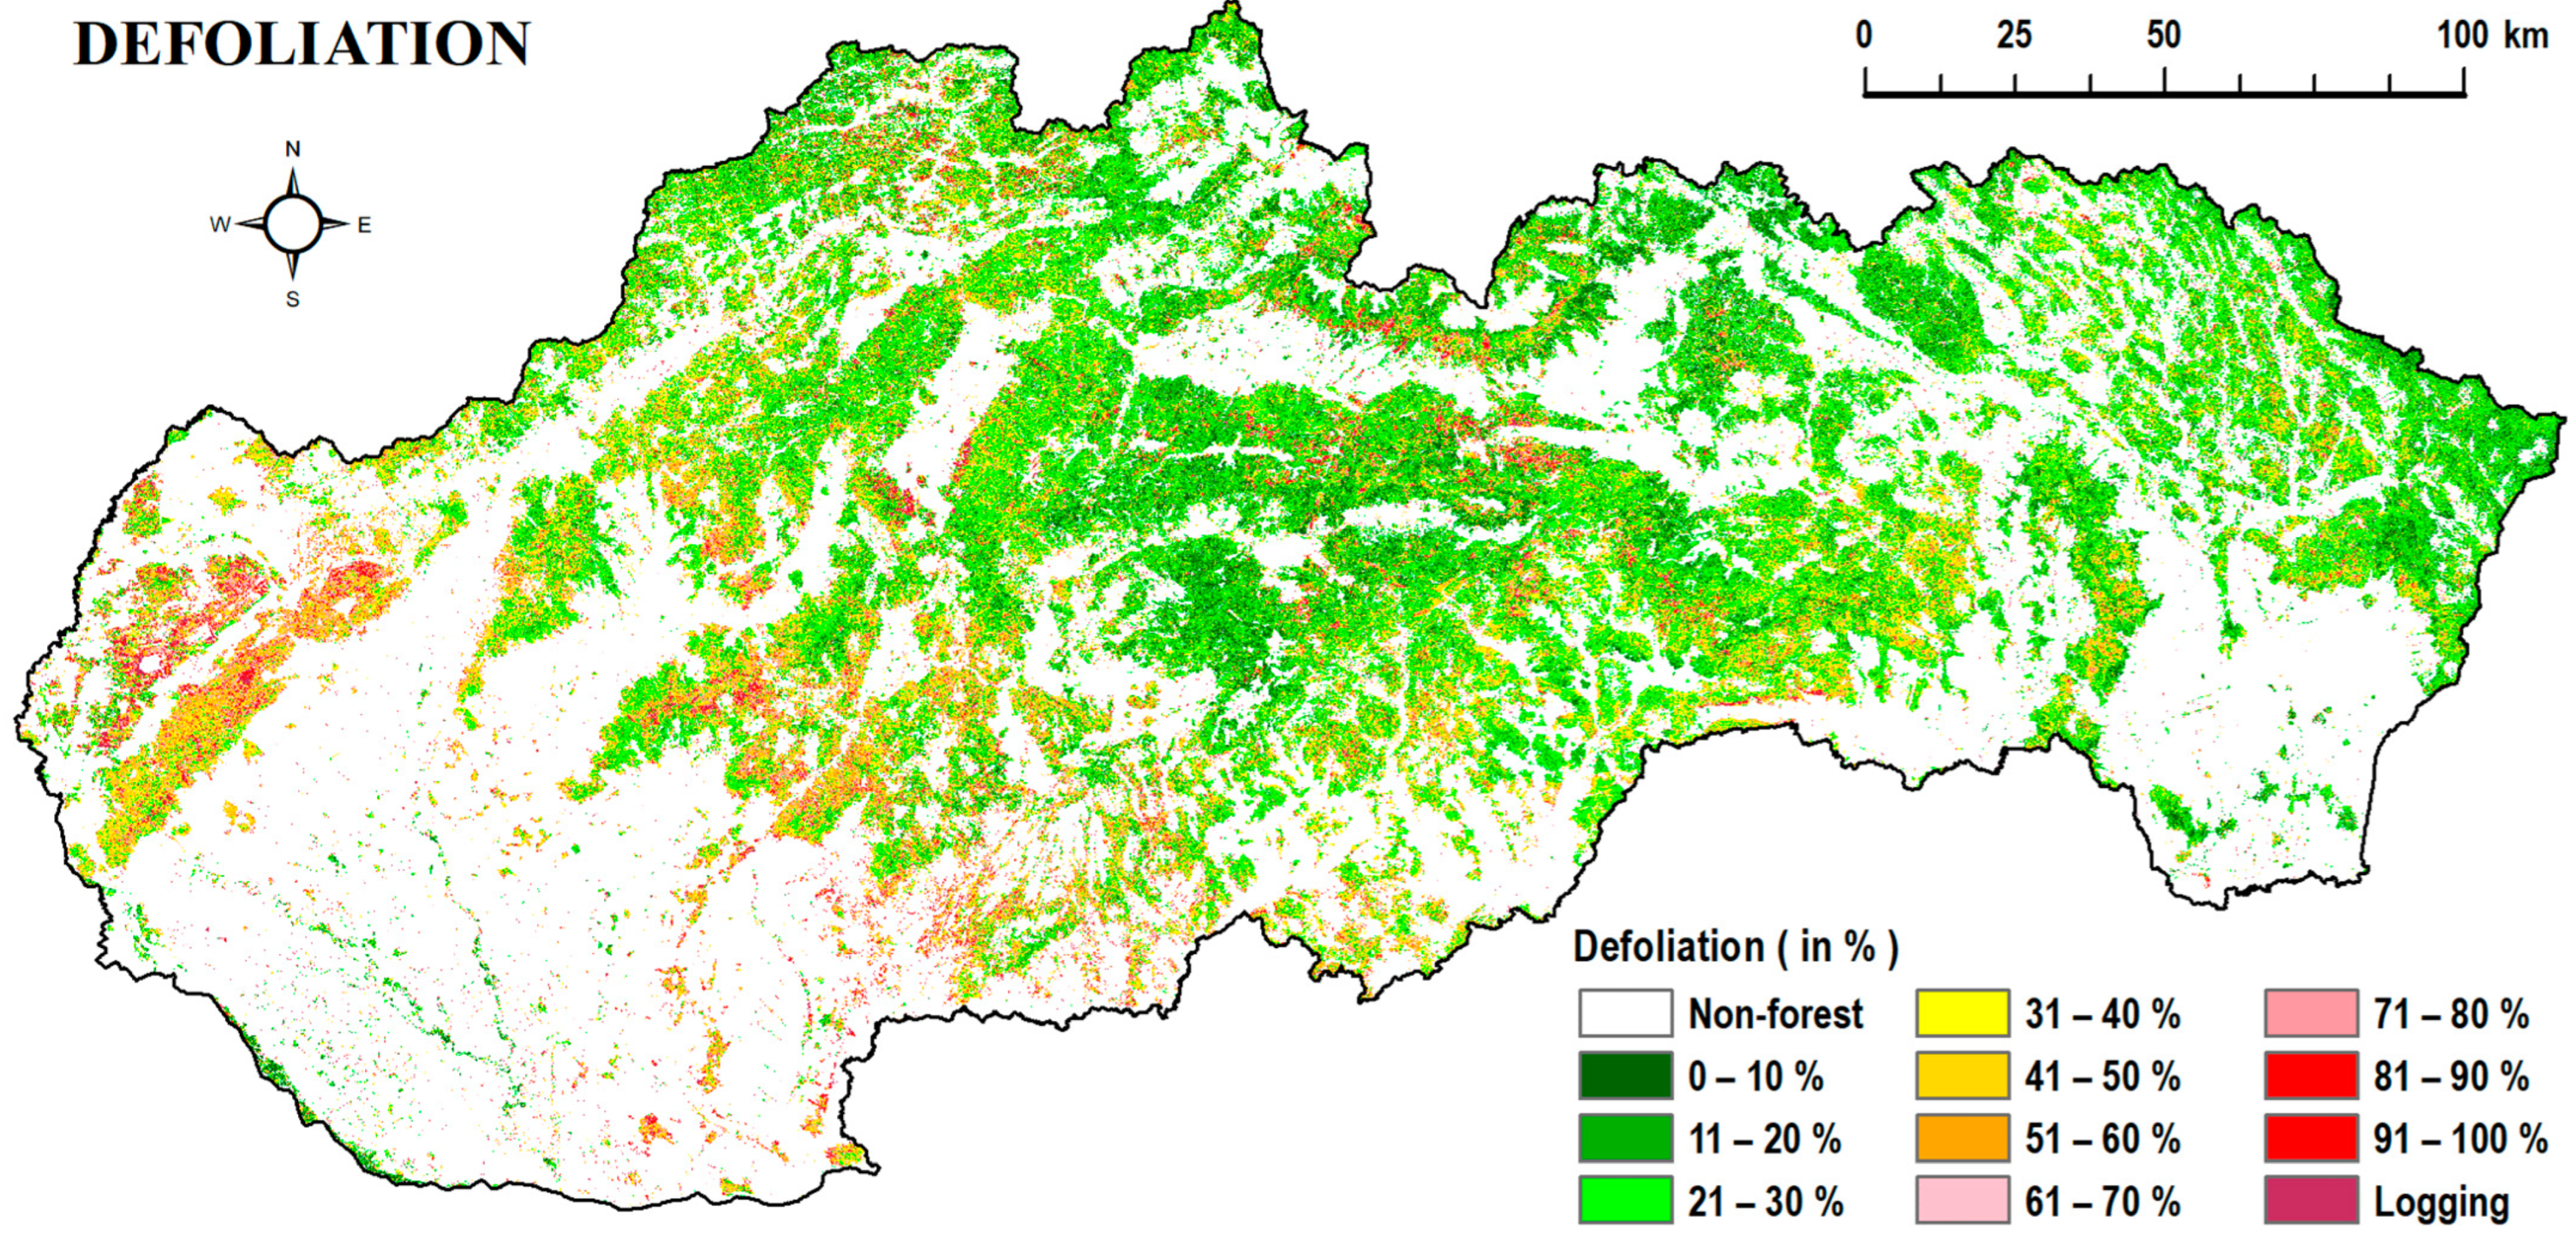
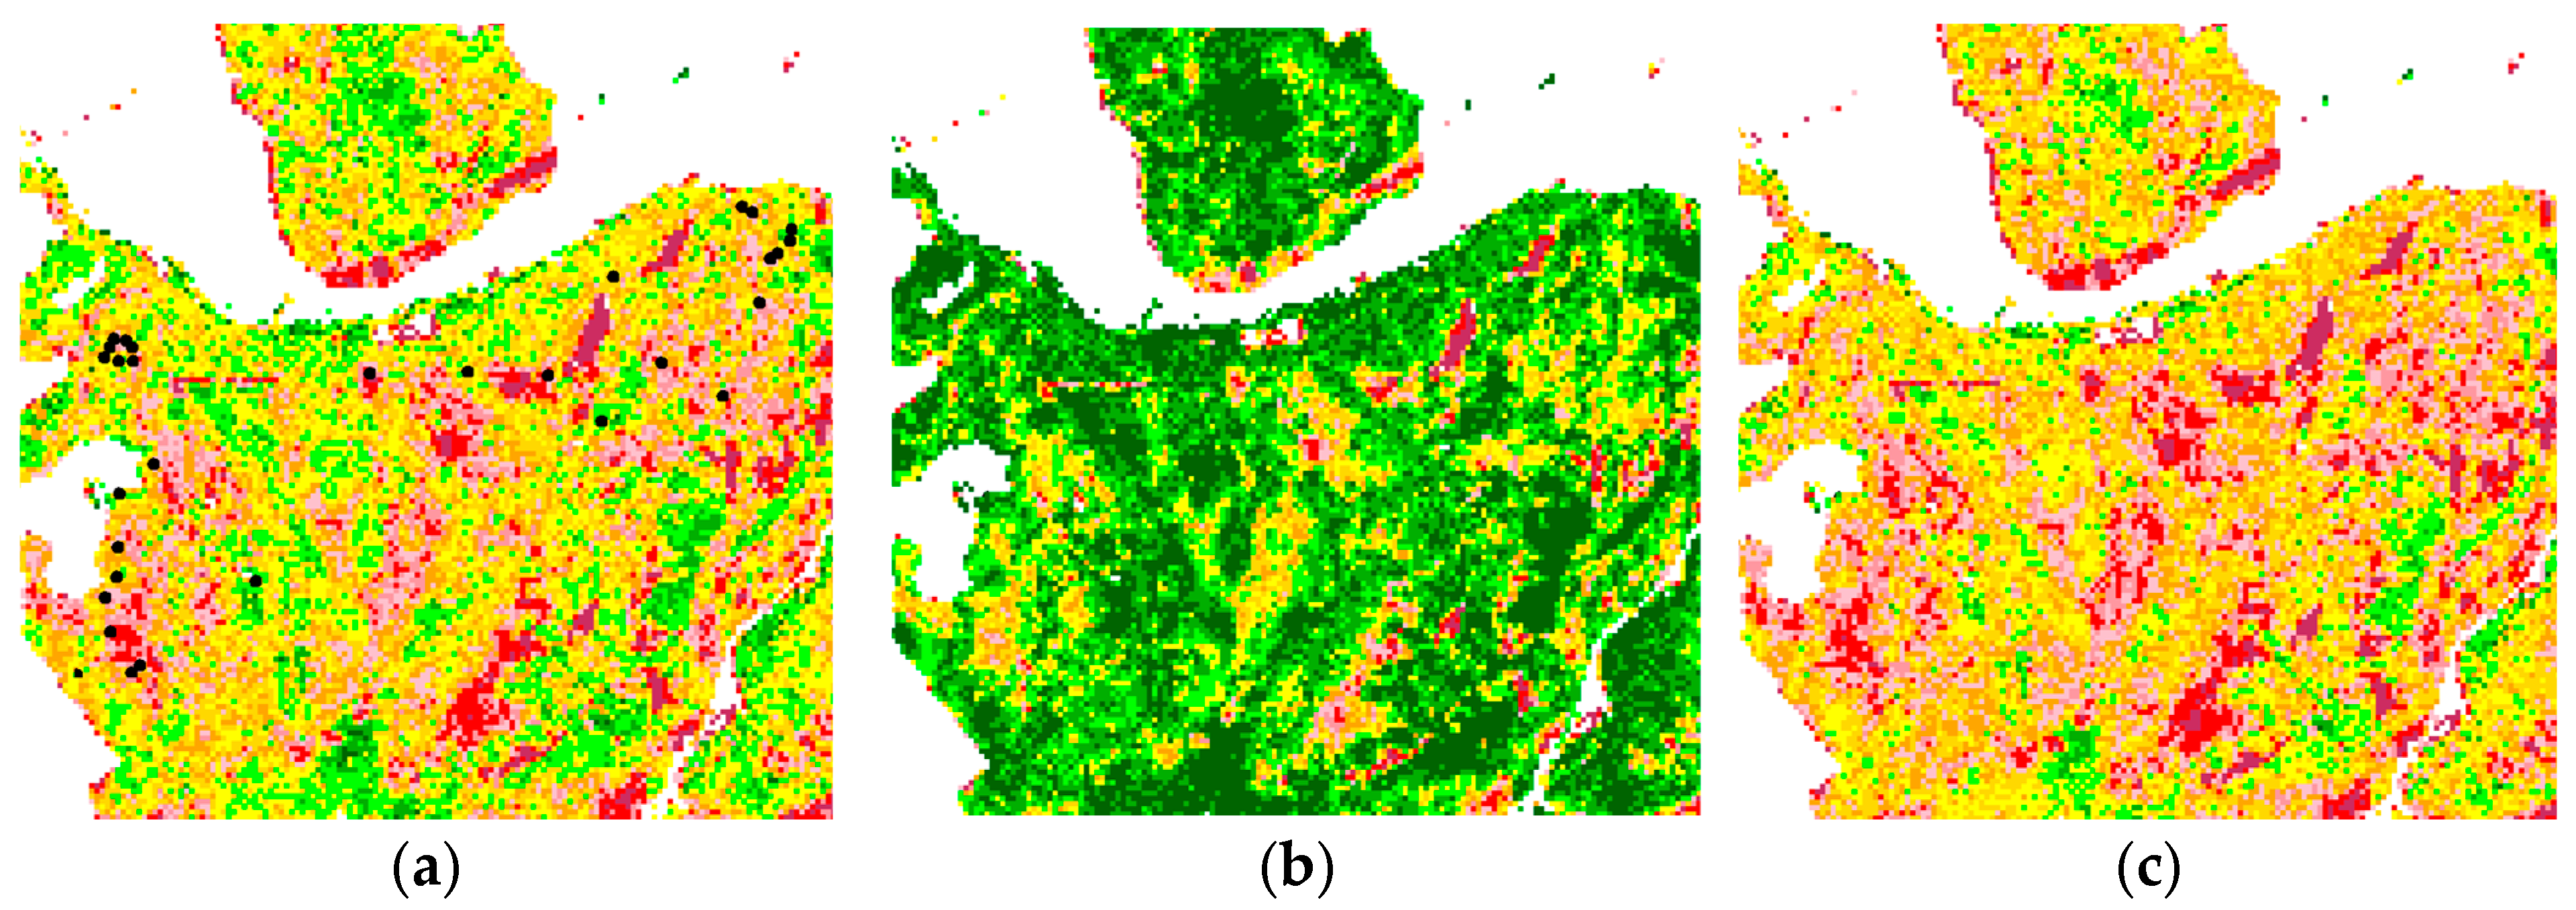
3.3. Large-Scale Forest Damage Assessment in Slovakia
4. Discussion
4.1. Spectral Response of Damaged Forest Stands
4.2. Precision of Two-Phased Sampling with Regression Estimator
4.3. Analysing Spatial Distribution of Drought-Induced Forest Damage in Slovakia
4.4. Implications for Forest Management and Policy
5. Conclusions
Author Contributions
Funding
Data Availability Statement
Conflicts of Interest
Appendix A

| DEF-DIS (%) | 21–30 | 31–40 | 41–50 | 51–60 | 61–70 | 71–80 | 81–90 | 91–100 | Logging | ||||
|---|---|---|---|---|---|---|---|---|---|---|---|---|---|
| DEF-DIS (%) | Ground Truth (Row)\Classified (Column) | 3 | 4 | 5 | 6 | 7 | 8 | 9 | 10 | 11 | Row Total | Producer Accuracy (%) | PA Adjusted ± 1 Category (%) |
| 21–30 | 3 | 0 | 1 | 1 | 2 | 0.0 | 50.0 | ||||||
| 31–40 | 4 | 4 | 1 | 5 | 80.0 | 100.0 | |||||||
| 41–50 | 5 | 1 | 1 | 1 | 3 | 33.3 | 66.7 | ||||||
| 51–60 | 6 | 3 | 1 | 1 | 2 | 7 | 14.3 | 71.4 | |||||
| 61–70 | 7 | 1 | 3 | 1 | 5 | 60.0 | 100.0 | ||||||
| 71–80 | 8 | 2 | 2 | 100.0 | 100.0 | ||||||||
| 81–90 | 9 | 4 | 1 | 5 | 20.0 | 100.0 | |||||||
| 91–100 | 10 | 1 | 3 | 1 | 5 | 60.0 | 100.0 | ||||||
| Logging | 11 | 0 | 0 | - | - | ||||||||
| Column Total | 0 | 6 | 6 | 2 | 5 | 9 | 2 | 3 | 1 | 34 | |||
| User Accuracy (%) | - | 66.7 | 16.7 | 50.0 | 60.0 | 22.2 | 50.0 | 100.0 | 0 | 44.1 | |||
| UA adjusted ± 1 category (%) | - | 100.0 | 83.3 | 100.0 | 80.0 | 77.8 | 100.0 | 100.0 | 100.0 | 88.2 |
| DEFOL | 1 | 2 | 3 | 4 | 5 | 6 | 7 | 8 | 9 | 10 | 11 | ||
|---|---|---|---|---|---|---|---|---|---|---|---|---|---|
| DISCOL | 0%–10% | 11%–20% | 11%–20% | 31%–40% | 41%–50% | 51%–60% | 61%–70% | 71%–80% | 81%–90% | 91%–100% | Logging | Total | |
| 1 | 0%–10% | 1,249,729 | 3,451,358 | 6,916,861 | 2,407,198 | 0 | 0 | 0 | 0 | 0 | 0 | 0 | 140,25,146 |
| 2 | 11%–20% | 0 | 0 | 0 | 2,547,361 | 2,160,393 | 0 | 0 | 0 | 0 | 0 | 0 | 4,707,754 |
| 3 | 21%–30% | 0 | 0 | 0 | 0 | 629,610 | 1,371,503 | 0 | 0 | 0 | 0 | 0 | 2,001,113 |
| 4 | 31%–40% | 0 | 0 | 0 | 0 | 0 | 173,562 | 935,354 | 0 | 0 | 0 | 0 | 1,108,916 |
| 5 | 41%–50% | 0 | 0 | 0 | 0 | 0 | 0 | 0 | 674,188 | 0 | 0 | 0 | 674,188 |
| 6 | 51%–60% | 0 | 0 | 0 | 0 | 0 | 0 | 0 | 0 | 386,430 | 0 | 0 | 386,430 |
| 7 | 61%–70% | 0 | 0 | 0 | 0 | 0 | 0 | 0 | 0 | 44,309 | 256,185 | 0 | 300,494 |
| 8 | 71%–80% | 0 | 0 | 0 | 0 | 0 | 0 | 0 | 0 | 0 | 205,987 | 0 | 205,987 |
| 9 | 81%–90% | 0 | 0 | 0 | 0 | 0 | 0 | 0 | 0 | 0 | 21,135 | 124,476 | 145,611 |
| 10 | 91%–100% | 0 | 0 | 0 | 0 | 0 | 0 | 0 | 0 | 0 | 0 | 179,320 | 179,320 |
| 11 | Logging | 0 | 0 | 0 | 0 | 0 | 0 | 0 | 0 | 0 | 0 | 238,824 | 238,824 |
| Total | 1,249,729 | 3,451,358 | 6,916,861 | 4,954,559 | 2,790,003 | 1,545,065 | 935,354 | 674,188 | 430,739 | 483,307 | 542,620 | 23,973,783 |
References
- Eggleston, S.; Goodwin, J.; Pulles, T.; Visschedijk, A.; Bakker, J.; Ritter, M.; Koch, D.; Pazdan, W. Emissions of Atmospheric Pollutants in Europe, 1980–1996; Topic report 9; European Environment Agency: Copenhagen, Denmark, 2000; 115p. [Google Scholar]
- Seidl, R.; Thom, D.; Kautz, M.; Martin-Benito, D.; Peltoniemi, M.; Vacchiano, G.; Wild, J.; Ascoli, D.; Petr, M.; Honkaniemi, J.; et al. Forest disturbances under climate change. Nat. Clim. Chang. 2017, 7, 395–402. [Google Scholar] [CrossRef] [PubMed]
- Senf, C.; Buras, A.; Zang, C.S.; Ramming, A.; Seild, R. Excess forest mortality is consistently linked to drought across Europe. Nat. Commun. 2020, 11, 6200. [Google Scholar] [CrossRef]
- Dai, A. Increasing drought under global warming in observations and models. Nat. Clim. Chang. 2012, 3, 52–58. [Google Scholar] [CrossRef]
- Česljar, G.; Jovanovič, F.; Brašanec-Bosanac, L.; Dordevič, I.; Mitrovič, S.; Eremija, S.; Ćirković-Mitrović, T.; Lučić, A. Impact of an Extremely Dry Period on Tree Defoliation and Tree Mortality in Serbia. Plants 2022, 11, 1286. [Google Scholar] [CrossRef] [PubMed]
- Gregory, S.C.; Redfern, D.B. Diseases and Disorders of Forest Trees. A Guide to Indentifying Causes of Ill-Health in Woods and Plantations; Forestry Commission, The Stationary Office: Edinburgh, UK, 1998; 136p. [Google Scholar]
- Flexas, J.; Bota, J.; Loreto, F.; Cornic, G.; Sharkey, T.D. Diffusive and metabolic limitations to photosynthesis under drought and salinity in C(3) plants. Plant Biol. 2004, 6, 269–279. [Google Scholar] [CrossRef] [PubMed]
- Verslues, P.E.; Agarwal, M.; Katiyar-Agarwal, S.; Zhu, J.; Zhu, J.K. Methods and concepts in quantifying resistance to drought, salt and freezing, abiotic stresses that affect plant water status. Plant J. 2006, 45, 523–539, Erratum in Plant J. 2006, 46, 1092. [Google Scholar] [CrossRef] [PubMed]
- Pavlenda, P.; Pajtík, P.; Sitková, Z.; Priwitzer, T.; Pavlendová, P. Manifestations of extreme drought on forest trees species in permanent monitoring plots of PMS Forests. APOL 2022, 3, 94–101. [Google Scholar]
- Bucha, T.; Pavlenda, P.; Konôpka, B.; Tomaštík, J.; Chudá, J.; Surový, P. Identification of drought-induced forest damage in 2022 and of its key site condition drivers through satellite imagery. Cent. Eur. For. J. 2024, 70, 156–175. [Google Scholar]
- Rebetez, M.; Mayer, H.; Dupont, O.; Schindler, D.; Gartner, K.; Kropp, J.P.; Menzel, A. Heat and drought 2003 in Europe: A climate synthesis. Ann. For. Sci. 2006, 63, 569–577. [Google Scholar] [CrossRef]
- Buras, A.; Ramming, A.; Zang, C.S. Quantifying impacts of the 2018 drought on European ecosystems in comparison to 2003. Biogeosciences 2020, 17, 1655–1672. [Google Scholar] [CrossRef]
- Brun, P.; Psomas, A.; Ginzler, C.; Thuiller, W.; Zappa, M.; Zimmermann, N.E. Large-Scale Early-Wilting Response of Central European Forests to the 2018 Extreme Drought. Glob. Chang. Biol. 2020, 26, 7021–7035. [Google Scholar] [CrossRef]
- Rukh, S.; Sanders, T.G.M.; Krüger, I.; Schad, T.; Bolte, A. Distinct responses of European beech (Fagus sylvatica L.) to drought intensity and length—A review of the impacts of the 2003 and 2018–2019 drought events in Central Europe. Forests 2023, 14, 248. [Google Scholar] [CrossRef]
- Nussbaumer, A.; Meusburger, K.; Schmitt, M.; Waldner, P.; Gehrig, R.; Haeni, M.; Rigling, A.; Brunner, I.; Thimonier, A. Extreme Summer Heat and Drought Lead to Early Fruit Abortion in European Beech. Sci. Rep. 2020, 10, 5334. [Google Scholar] [CrossRef] [PubMed]
- Rohner, B.; Kumar, S.; Liechti, K.; Gessler, A.; Ferretti, M. Tree Vitality Indicators Revealed a Rapid Response of Beech Forests to the 2018 Drought. Ecol. Indic. 2021, 120, 106903. [Google Scholar] [CrossRef]
- Konôpka, B.; Lukac, M. Moderate drought alters biomass and depth distribution of fine roots in Norway spruce. For. Pathol. 2013, 43, 115–123. [Google Scholar] [CrossRef]
- Scharnweber, T.; Smiljanic, M.; Cruz-García, R.; Manthey, M.; Wilmking, M. Tree Growth at the End of the 21st Century—The Extreme Years 2018/19 as Template for Future Growth Conditions. Environ. Res. Lett. 2020, 15, 074022. [Google Scholar] [CrossRef]
- Colangelo, M.; Camarero, J.J.; Rippulone, F.; Gazol, A.; Sánchez-Salguero, R.; Oliva, J.; Redondo, M.A. Drought Decreases Growth and Increases Mortality of Coexisting Native and Introduced Tree Species in a Temperate Floodplain Forest. Forests 2018, 9, 205. [Google Scholar] [CrossRef]
- Somogyi, Z. Projected effects of climate change on the carbon stocks of European beech (Fagus sylvatica L.) forests in Zala County, Hungary. Lesn. Časopis–For. J. 2016, 62, 3–14. [Google Scholar] [CrossRef]
- Klutsch, J.G.; Shamoun, S.F.; Erbilgin, N. Drought stress leads to systemic induced susceptibility to a nectrotrophic fungus associated with mountain pine beetle in Pinus banksiana seedlings. PLoS ONE 2017, 12, e0189203. [Google Scholar] [CrossRef]
- Netherer, S.; Ehn, M.; Blackwell, E.; Kirisits, T. Defence reaction of mature Norway spruce (Picea abies) before and after inoculation of the blue-stain fungus Endoconidiophora polonica in a drought stress experiment. Lesn. Časopis–For. J. 2016, 62, 169–177. [Google Scholar] [CrossRef]
- Drechsel, J.; Forkel, M. Remote sensing forest health assessment—A literature review on a European level. Cent. Eur. For. J. 2024. in print. [Google Scholar]
- Eichhorn, J.; Roskams, P.; Potočić, N.; Timmermann, V.; Ferretti, M.; Mues, V.; Szepesi, A.; Durrant, D.; Seletković, I.; Schröck, H.-W.; et al. Part IV: Visual Assessment of Crown Condition and Damaging Agents; Thünen Institute of Forest Ecosystems: Eberswalde, Germany, 2020; 49p. [Google Scholar]
- Michel, A.; Kirchner, T.; Prescher, A.-K.; Schwärzel, K. Forest Condition in Europe: The 2023 Assessment. ICP Forests Technical Report under the UNECE Convention on Long-range Transboundary Air Pollution; Thünen Institute: Eberswalde, Germany, 2023. [Google Scholar]
- Torres, P.; Rodes-Blanco, M.; Viana-Soto, A.; Nieto, H.; Garcia, M. The Role of Remote Sensing for the Assessment and Monitoring of Forest Health: A Systematic Evidence Synthesis. Forests 2021, 12, 1134. [Google Scholar] [CrossRef]
- Ceccato, P.; Flasse, S.; Tarantola, S.; Jacquemoud, S.; Grégoire, J.M. Detecting vegetation leaf water content using reflectance in the optical domain. Remote Sens. Environ. 2001, 77, 22–33. [Google Scholar] [CrossRef]
- Walshe, D.; McInerney, D.; Van De Kerchove, R.; Goyens, C.; Balaji, P.; Byrne, K.A. Detecting nutrient deficiency in spruce forests using multispectral satellite imagery. Int. J. Appl. Earth Obs. Geoinf. 2020, 86, 101975. [Google Scholar] [CrossRef]
- Franklin, S.E.; Wulder, M.A.; Skakun, R.S.; Carroll, A.L. Mountain pine beetle red-attack forest damage classification using stratified Landsat TM data in British Columbia, Canada. Photogramm. Eng. Remote Sens. 2003, 69, 283–288. [Google Scholar] [CrossRef]
- Leckie, D.G.; Cloney, E.; Joyce, S.P. Automated detection and mapping of crown discolouration caused by jack pine budworm with 2.5m resolution multispectral imagery. Int. J. Appl. Earth Obs. Geoinf. 2005, 7, 61–77. [Google Scholar]
- Brovkina, O.; Cienciala, E.; Zemek, F.; Lukeš, P.; Fabianek, T.; Russ, R. Composite indicator for monitoring of Norway spruce stand decline. Eur. J. Remote Sens. 2017, 50, 550–563. [Google Scholar] [CrossRef]
- Albrechtová, J.; Rock, B.N.; Soukupová, J.; Entcheva, P.; Šolcová, B.; Polák, T. Biochemical, histochemical, structural and reflectance markers of damage in Norway spruce from the Krušné hory Mts. used for interpretation of remote sensing data. J. For. Sci. 2001, 47, 26–33. [Google Scholar]
- Zarco-Tejada, P.J.; Miller, J.R.; Noland, T.L.; Mohammed, G.H.; Sampson, P. Scalling-up and Model Inversion Methods with Narrow-band Optical Indices for Chlorophyll Content Estimation in Closed Forest Canopies with Hyperspectral Data. IEEE Trans. Geosci. Remote Sens. 2001, 39, 1491–1507. [Google Scholar] [CrossRef]
- Panigada, C.; Rossini, M.; Busetto, L.; Meroni, M.; Fava, F.; Colombo, R. Chlorophyll concentration mapping with MIVIS data to assess crown discoloration in the Ticino Park oak forest. Int. J. Remote Sens. 2010, 31, 3307–3332. [Google Scholar] [CrossRef]
- Darvishzadeh, R.; Skidmore, A.; Abdullah, H.; Cherenet, E.; Ali, A.; Wang, T.; Nieuwenhuis, W.; Heurich, M.; Vrieling, A.; O’Connor, B.; et al. Mapping leaf chlorophyll content from Sentinel-2 and RapidEye data in spruce stands using the invertible forest reflectance model. Int. J. Appl. Earth Obs. Geoinf. 2019, 79, 58–70. [Google Scholar] [CrossRef]
- De Marco, A.; Vitale, M.; Popa, I.; Anav, A.; Badea, O.; Silaghi, D.; Leca, S.; Screpanti, A.; Paoletti, E. Ozone exposure affects tree defoliation in a continental climate. Sci. Total Environ. 2017, 596–597, 396–404. [Google Scholar] [CrossRef]
- Farella, M.M.; Fisher, J.B.; Jiao, W.; Key, K.B.; Barnes, M.L. Thermal remote sensing for plant ecology from leaf to globe. J. Ecol. 2022, 110, 1996–2014. [Google Scholar] [CrossRef]
- Henrich, V.; Jung, A.; Götze, C.; Sandow, C.; Thürkow, D.; Gläßer, C. Development of an online indices database: Motivation, concept and implementation. In Proceedings of the 6th EARSeL SIG IS Workshop Imaging Spectroscopy: Innovative Tool for Scientific and Commercial Environment Applications, Tel Aviv, Israel, 16–18 March 2009. [Google Scholar]
- Schellenberg, K.; Jagdhuber, T.; Zehner, M.; Hese, S.; Urban, M.; Urbazaev, M.; Hartmann, H.; Schmullius, C.; Dubois, C. Potential of Sentinel-1 SAR to Assess Damage in Drought-Affected Temperate Deciduous Broadleaf Forests. Remote Sens. 2023, 15, 1004. [Google Scholar] [CrossRef]
- Joyce, S.; Olsson, H. Long-term forest monitoring with temporal-spectral trajectories from Landsat TM data. In Proceedings of the Conference on Remote Sensing and Forest Monitoring, Rogow, Poland, 1–3 June 1999; pp. 68–81. [Google Scholar]
- Wulder, M.A.; White, J.C.; Coops, N.C.; Butson, C.R. Multi-temporal analysis of high spatial resolution imagery for disturbance monitoring. Remote Sens. Environ. 2008, 112, 2729. [Google Scholar] [CrossRef]
- Entcheva-Campbell, P.; Rock, B.N.; Martin, M.E.; Neefus, C.D.; Irons, J.R.; Middleton, E.M.; Albrechtová, J. Detection of initial damage in Norway spruce canopies using hyperspectral airborne data. Int. J. Remote Sens. 2004, 25, 5557–5583. [Google Scholar] [CrossRef]
- Townsend, P.A.; Singh, A.; Foster, J.R.; Rehberg, N.J.; Kingdon, C.C.; Eshleman, K.N.; Seagle, S.W. A general Landsat model to predict canopy defoliation in broadleaf deciduous forests. Remote Sens. Environ. 2012, 119, 255–265. [Google Scholar] [CrossRef]
- Lukeš, P. Monitoring of bark beetle forest damage. In Big Data in Bioeconomy; Ödergård, M., Habyarimana, B., Fernandes, Z.-W., Eds.; Springer International Publishing: Cham, Switzerland, 2021; pp. 351–361. [Google Scholar]
- Thonfeld, F.; Gessner, U.; Holzwarth, S.; Kriese, J.; da Ponte, E.; Huth, J.; Kuenzer, C. A First Assessment of Canopy Cover Loss in Germany’s Forests after the 2018–2020 Drought Years. Remote Sens. 2022, 14, 562. [Google Scholar] [CrossRef]
- Barka, I.; Lukeš, P.; Bucha, T.; Hlásny, T.; Strejček, R.; Mlčoušek, M.; Křístek, S. Remote sensing-based forest health monitoring systems—Case studies from Czechia and Slovakia. Cent. Eur. For. J. 2018, 64, 259–275. [Google Scholar]
- Hawryło, P.; Bednarz, B.; Wężyk, P.; Szostak, M. Estimating defoliation of Scots pine stands using machine learning methods and vegetation indices of Sentinel-2. Eur. J. Remote Sens. 2018, 51, 194–204. [Google Scholar] [CrossRef]
- Field, J.P.; Breshears, D.D.; Bradford, J.B.; Law, D.J.; Feng, X.; Allen, C.D. Forest Management Under Megadroughts: Urgent Needs at Finer Scale and High Intensity. Front. For. Glob. Chang. 2020, 3, 502669. [Google Scholar] [CrossRef]
- Manrique-Alba, A.; Begueria, S.; Camarero, J.J. Long-term effects of forest management on post-drought growth resilience: An analytical framework. Sci. Total Environ. 2022, 810, 152374. [Google Scholar] [CrossRef]
- Bowditch, E.; Santopuoli, G.; Binder, F.; del Rio, M.; Kluvankova, T.; Lesinski, J.; Lesinski, J.; Motta, R.; Pach, M.; Panzacchi, P.; et al. What is Climate-Smart Forestry? A definition from a multinational collaborative process focused on mountain regions of Europe. Ecosyst. Serv. 2020, 43, 101113. [Google Scholar] [CrossRef]
- Gregor, K.; Knoke, T.; Krause, A.; Reyer, C.P.O.; Lindeskog, M.; Papastefanou, P.; Smith, B.; Lansø, A.S.; Rammig, A. Trade-Offs for Climate-Smart Forestry in Europe Under Uncertain Future. Clim. Earth’s Future 2022, 10, e2022EF002796. [Google Scholar] [CrossRef]
- Ekstrand, S.; Schardt, M.; Granica, K.; Koch, B.; Kahabka, H.; Carnemolla, S.; Bottai, L.; Häusler, T. SEMEFOR. Satellite based environmental monitoring of European forests; EC Community Research, EUR 19435; Office for Official Publications of the European Communities: Luxembourg, 2001; 103p. [Google Scholar]
- Vogelmann, J.E.; Rock, B.N. Assessing forest damage in high-elevation coniferous forests in Vermont and New Hampshire using Thematic mapper dat. Remote Sens. Environ. 1988, 24, 227–246. [Google Scholar] [CrossRef]
- WRB. World Reference Base for Soil Resources. 2015. Available online: https://www.isric.org/explore/wrb (accessed on 24 June 2023).
- Climate Atlas of Slovakia; Slovak Hydrometeorological Institute: Bratislava, Slovakia, 2015; 132p.
- MPRV SR. Správa o lesnom hospodárstve v Slovenskej republike za rok 2021—Zelená správa. (In Slovak). Available online: https://www.mpsr.sk/zelena-sprava-2022/123---18463/ (accessed on 24 June 2023).
- Intersucho. Drought Map for 32nd Week of 2022. Available online: https://www.intersucho.sk/en/?mapcountry=sk&from=2022-08-01&to=2022-08-10 (accessed on 27 December 2023).
- Olsson, H. Regression functions for multitemporal relative calibration of thematic mapper data over Boreal forest. Remote Sens. Environ. 1993, 46, 89–102. [Google Scholar] [CrossRef]
- Teillet, P.M.; Guindon, B.; Goodenough, D.G. On the slope-aspect correction of multispectral scanner data. Can. J. Remote Sens. 1982, 8, 84–106. [Google Scholar] [CrossRef]
- Cochran, W.G. Sampling Techniques; Wiley & Sons: New York, NY, USA, 1977; 412p. [Google Scholar]
- Scheer, Ľ. Assessment of forest conditions employing two-phased satellite remote sensing. In Proceedings of the International Workshop: Application of Remote Sensing in European Forest Monitoring, Vienna, Austria, 14–16 October 1996; pp. 337–346. [Google Scholar]
- Jackson, R.D. Spectral indices in N-Space. Remote Sens. Environ. 1983, 13, 409–421. [Google Scholar] [CrossRef]
- Innes, J.L. The Sanasilva Manual: A Field Manual for Assessing Forest Damage; Swiss Federal Institute for Forest, Snow and Landscape Research: Birmensdorf, Switzerland, 1990. [Google Scholar]
- Congalton, R.G.; Green, K. Assessing the Accuracy of Remotely Sensed Data: Principles and Practices, 3rd ed.; CRC Press: Boca Raton, FL, USA, 2019. [Google Scholar]
- Bucha, T. Classification of tree species composition in Slovakia from satellite images as a part of monitoring forest ecosystems biodiversity. Acta Instituti For. Zvolen 1999, 9, 65–84. [Google Scholar]
- Joria, E.P.; Ahearn, S.A.; Connor, M. A comparison of the SPOT and LANDSAT Thematic Mapper 816 satellite systems for detecting gypsy moth defoliation in Michigan. Photogramm. Eng. Remote Sens. 1991, 57, 1605–1612. [Google Scholar]
- Bucha, T.; Raši, R.; Vladovič, J. Metódy monitoringu zdravotného stavu lesov prostriedkami DPZ; Technical Report; Lesnícky výskumný ústav vo Zvolene: Zvolen, Slovakia, 2002; 91p, (In Slovak). Available online: https://www.researchgate.net/publication/353761076_Metody_monitoringu_zdravotneho_stavu_lesov_prostriedkami_DPZ (accessed on 15 May 2024).
- Ekstrand, S. Assessment of forest damage with Landsat TM: Correction for varying forest stand characteristics. Remote Sens. Environ. 1994, 47, 291–302. [Google Scholar] [CrossRef]
- Maresi, G.; Salvadori, C. Crown conditions and damages in two forest ecosystems in Trentino (Italy). Studi Trent. Sci. Nat. Acta Biol. 2005, 81 (Suppl. 1), 253–260. [Google Scholar]
- Koch, B.; Ammer, U.; Schneider, T.; Wittmeier, H. Spectroradiometer measurements in the laboratory and in the field to analyse the influence of different damage symptoms on the reflection spectra of forest trees. Int. J. Remote Sens. 1990, 11, 1145–1163. [Google Scholar] [CrossRef]
- Stoklasa, M.; Fabiánek, P. Dálkový průzkum země a pozemní šetření zdravotního stavu lesů ČR. Lesn. Práce 1998, 77, 368–370. (In Czech) [Google Scholar]
- Barka, I.; Bucha, T. Satelitné monitorovanie zdravotného stavu lesov Slovenska. In Zborník odborných prác z konferencie LignoSilva 2021; Tóthová, S., Gergeľ, T., Eds.; NLC: Zvolen, Slovakia, 28 September 2021; pp. 84–92. (In Slovak) [Google Scholar]
- Rullan-Silva, C.D.; Olthoff, A.E.; Delgado de la Mata, J.A.; Pajares-Alonso, J.A. Remote monitoring of forest insect defoliation. A review. For. Syst. 2013, 22, 377–391. [Google Scholar] [CrossRef]
- Kunca, A.; Zúbrik, M.; Galko, J.; Vakula, J.; Leontovyč, R.; Konôpka, B.; Nikolov, C.; Gubka, A.; Longauerová, V.; Maľová, M.; et al. Salvage felling in the Slovak Republic’s forests during the last twenty years (1998–2017). Cent. Eur. For. J. 2019, 65, 3–11. [Google Scholar] [CrossRef]
- Pretzsch, H.; del Rio, M.; Grote, H.J.; Klemmt, H.J.; Ordonez, C.; Oviedo, F.B. Tracing drought effects from the tree to the stand growth in temperate and Mediterranean forests: Insights and consequences for forest ecology and management. Eur. J. For. Res. 2022, 14, 727–751. [Google Scholar] [CrossRef]
- WSL. Methods of the Sanasilva Inventory. Available online: https://www.wsl.ch/en/forest/forest-development-and-monitoring/sanasilva-forest-health-inventory/methods-of-the-sanasilva-inventory/ (accessed on 29 July 2024).
- Munsell Color (firm). Munsell Plant Tissue Color Book, 2nd ed.; re. Munsell Color: Baltimore, MD, USA, 1977. [Google Scholar]
- Lakatos, F.; Mirtchev, S.; Mehmeti, A.; Shabanaj, H. Manual for Visual Assessment of Forest Crown Condition; Food and Agriculture Organization of the United Nations (FAO): Pristina, Kosovo, 2014; ISBN 978-92-5-108641-4. [Google Scholar]
- Janik, G.; Pödör, Z.; Koltay, A.; Hirka, A.; Juhász, J.; Kovacs, G.; Csóka, G. Effects of Meteorological and Site Parameters on the Health Status of Beech (Fagus sylvatica L.) Forests in Hungary. Acta Silv. Lignaria Hung. 2020, 16, 67–78. [Google Scholar] [CrossRef]
- Kodrík, H.; Hlaváč, P. Integrovaná ochrana lesa; Technická univerzita vo Zvolene: Zvolen, Slovakia, 2013; 328p. (In Slovak) [Google Scholar]


| Satellite Platform | Sensing Date | Sensing Area and Satellite Product Type | Scene Cloudiness|Covered Area of Mosaic |
|---|---|---|---|
| Sentinel-2B | 5 August 2022 | Western and Central Slovakia: S2B_MSIL1C_20220805T094549_N0400_R079 | Cloud-free|64% |
| Sentinel-2A | 4 August 2022 | Eastern Slovakia: S2A_MSIL1C_20220804T093051_N0400_R136 | Cloud-free|17.3% |
| Sentinel-2B | 12 August 2022 | Central and Eastern Slovakia: S2B_MSIL1C_20220812T093549_N0400_R036 | Partly cloud-free|11.2% |
| Landsat 9 | 1 August 2022 | Central and Eastern Slovakia: LC09_L2SP_187026_20220801_20220803_02_T1 | Partly cloud-free|6.2% |
| Sentinel-2 Band | Central Wavelength (nm) S2A/S2B | Band Widths (nm) S2A/S2B | Resolution (m) |
|---|---|---|---|
| B4—Red | 664.6/665.0 | 31/31 | 10 × 10 |
| B8—Visible and near infrared (VNIR) | 832.8/833.0 | 106/106 | 10 × 10 |
| B11—Shortwave infrared (SWIR1) | 1613.7/1610.4 | 91/94 | 20 × 20 |
| B12—Shortwave infrared (SWIR2) | 2202.4/2185.7 | 175/185 | 20 × 20 |
| RED | VNIR | SWIR1 | SWIR2 | |
|---|---|---|---|---|
| DN Values Used for Gram–Schmidt Transformation (GST) | ||||
| Fully foliated beech stands | 95.67 | 247.30 | 131.47 | 107.00 |
| Fully foliated spruce stands | 91.32 | 61.88 | 55.00 | 77.61 |
| Dead spruce stands | 112.16 | 82.78 | 112.06 | 116.79 |
| Calculated transformation coefficients for 1st and 2nd components according to the GST | ||||
| NSC1 | 0.0215 | 0.9145 | 0.3771 | 0.1449 |
| NSC2 | 0.3366 | −0.3708 | 0.6687 | 0.5496 |
| Variable | Defoliation | Defol-Discol | Fruct. | RED | VNIR | SWIR1 | SWIR2 | NSC2 | NSC1 |
|---|---|---|---|---|---|---|---|---|---|
| ** DISCOLOURATION | 0.82 | 0.91 | −0.07 | 0.90 | −0.62 | 0.60 | 0.79 | 0.91 | −0.47 |
| * DEFOLIATION | 0.98 | −0.21 | 0.53 | −0.77 | 0.02 | 0.78 | 0.87 | −0.71 | |
| DEFOL-DISCOL | −0.23 | 0.65 | −0.74 | 0.20 | 0.81 | 0.91 | −0.66 | ||
| ** FRUCTIFICATION | −0.15 | −0.13 | −0.21 | −0.04 | −0.04 | −0.17 |
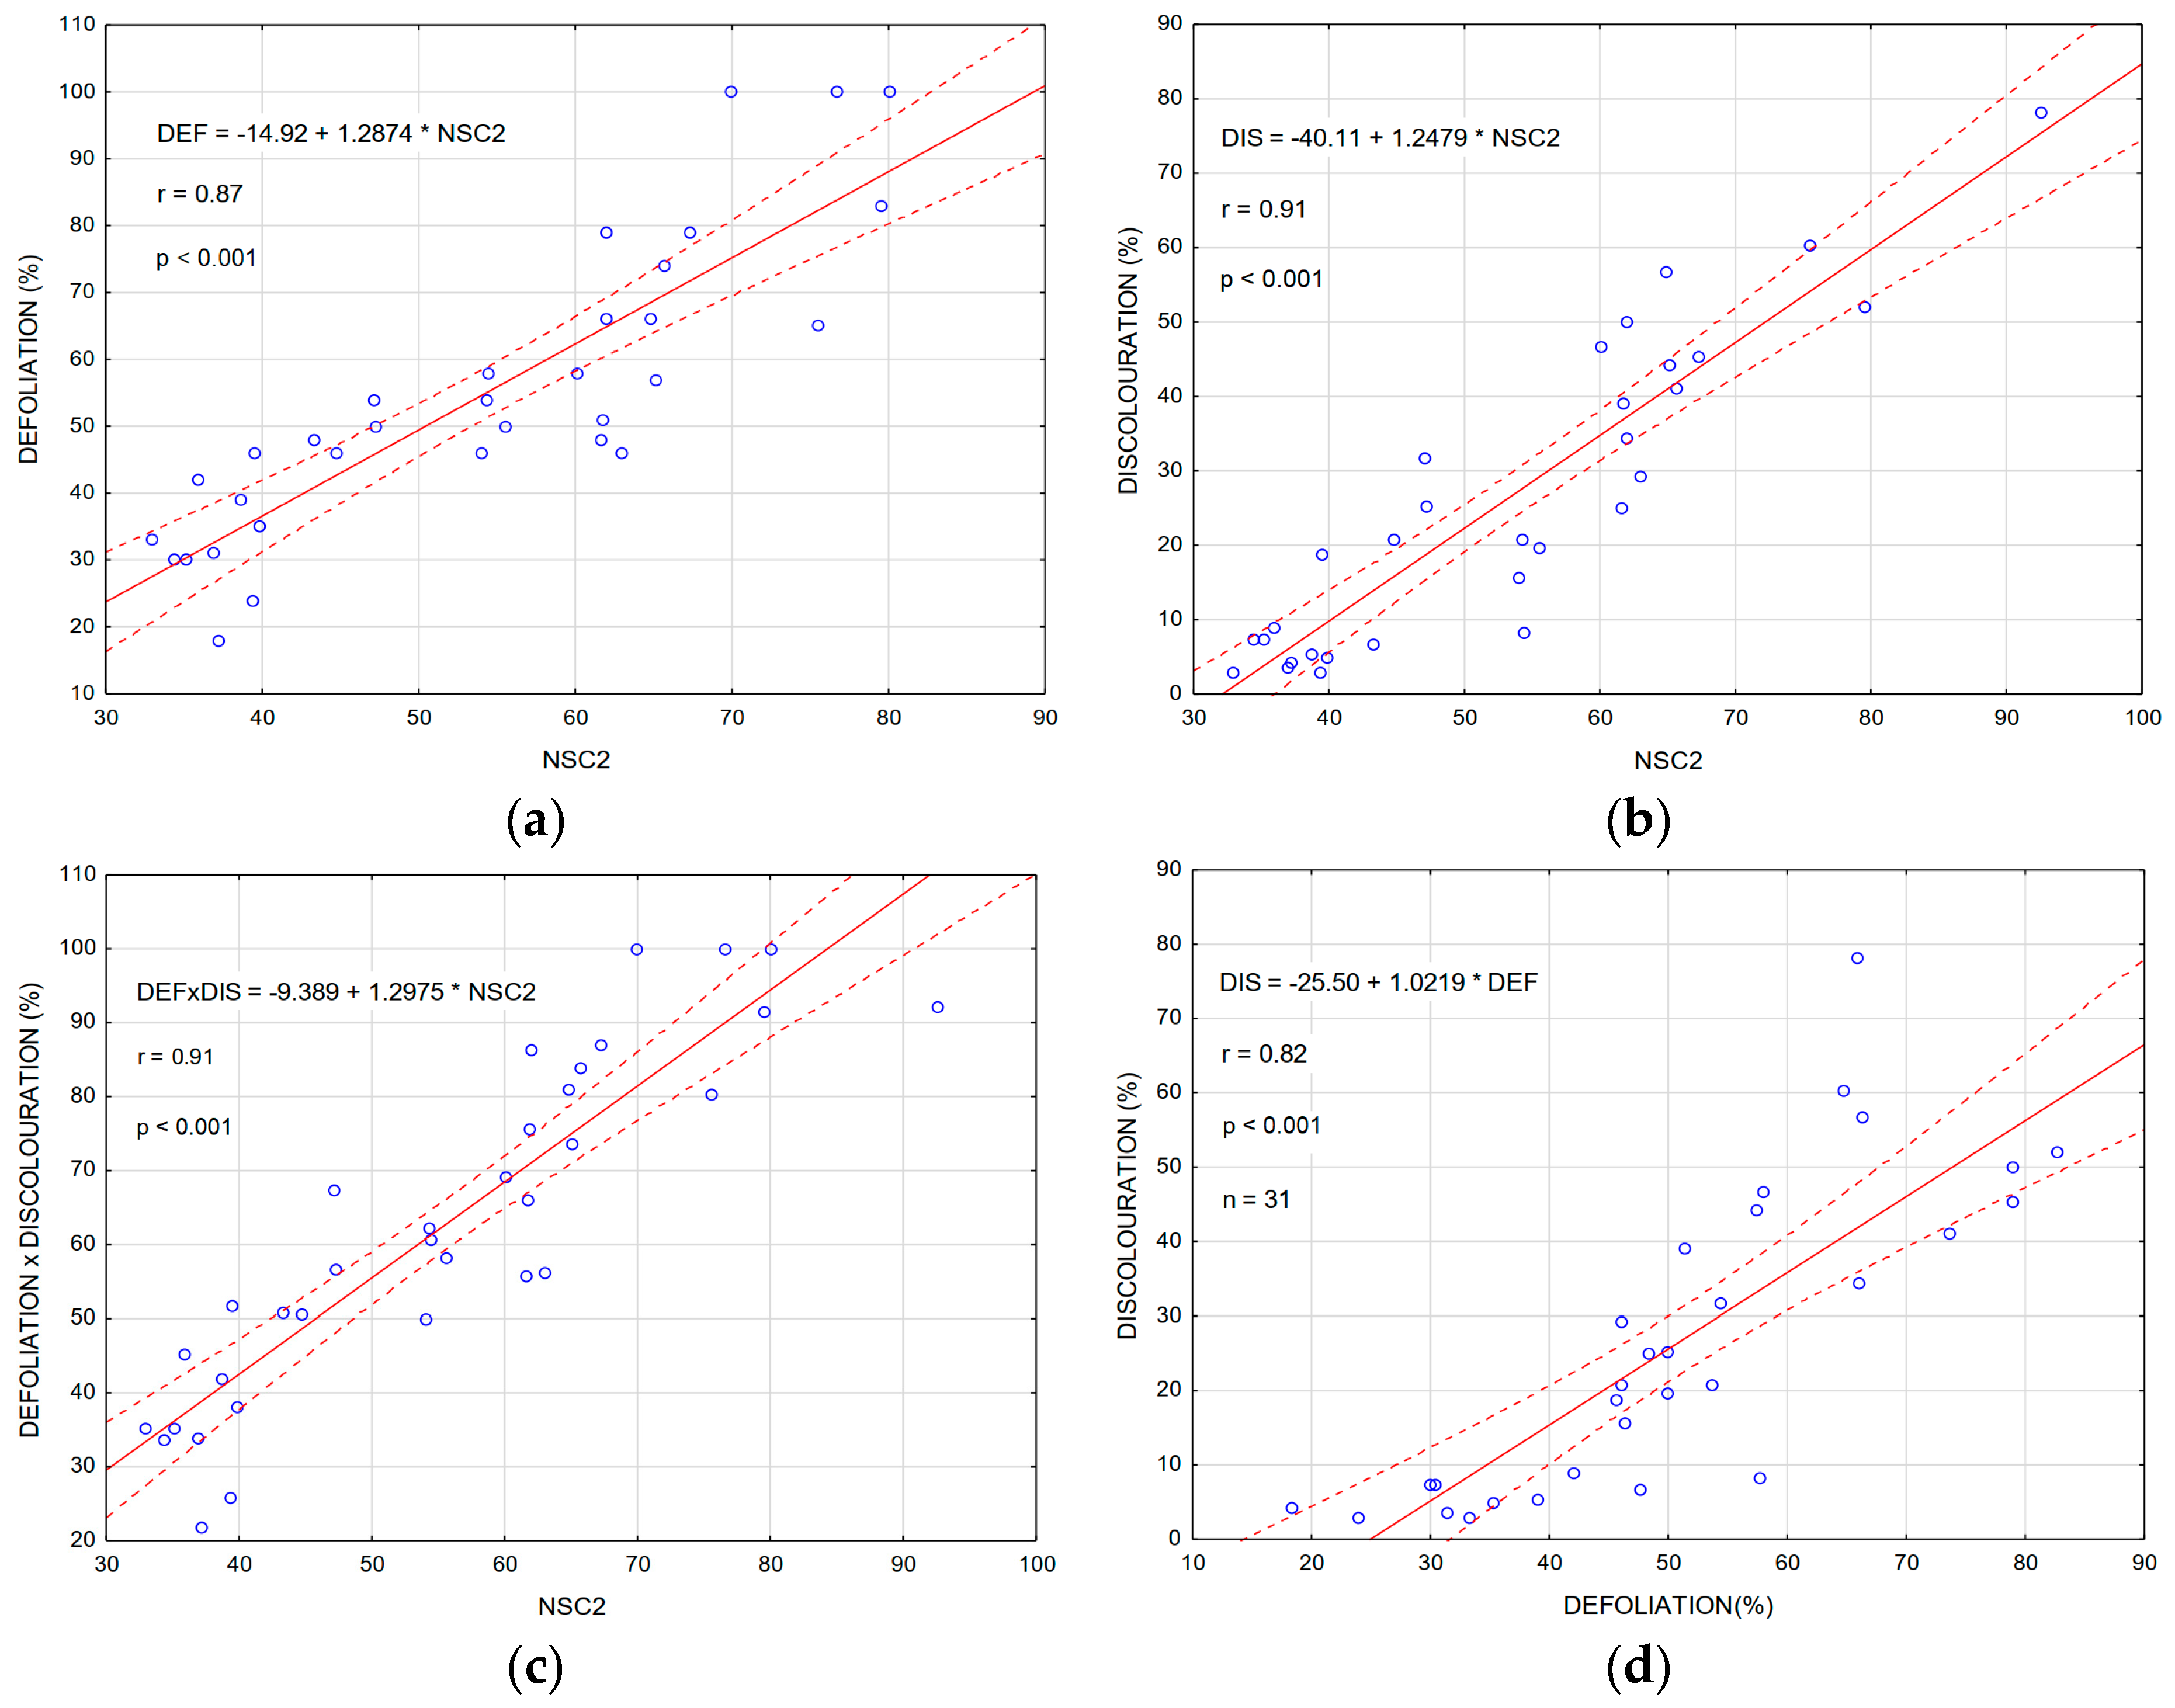
| Model | r | SEE | Sample Size |
|---|---|---|---|
| First phase: Estimation of damage using Gram–Schmidt transformation | |||
| NSC2 = 0.337 × R2022 − 0.371 × IR2022 + 0.669 × SWIR12022 + 0.550 × SWIR22022 | - | - | n1: all pixels |
| Second phase: Refinement of classification based on terrestrial FHA | |||
| Defoliation: DEF2022 = −14.9224 + 1.2874 × NSC2 | 0.87 | ±10.7 | n2: 33 plots * |
| Discolouration: DIS2022 = −40.106 + 1.2479 × NSC2 | 0.91 | ±8.4 | n2: 31 plots ** |
| Defoliation-Discolouration: DEF-DIS2022 = −9.389 + 1.2975 × NSC2 | 0.91 | ±9.7 | n2: 34 plots |
| Classes of Damage | DEF | DIS | DEF-DIS | Description of Damage Level in Pixels for DEF and DEF-DIS | |
|---|---|---|---|---|---|
| % of Pixels | % of Pixels | % of Pixels | Area (ha) | ||
| 0%–10% | 5.33 | 58.50 | 2.14 | 46,313 | No or only negligible damage |
| 11%–20% | 14.38 | 18.14 | 7.66 | 165,466 | Stands with slight damage |
| 21%–30% | 28.82 | 9.07 | 20.12 | 434,678 | |
| 31%–40% | 20.64 | 4.95 | 25.46 | 549,923 | Stands with moderate damage |
| 41%–50% | 11.62 | 3.27 | 17.87 | 386,100 | |
| 51%–60% | 6.44 | 1.61 | 9.75 | 210,606 | Stands with severe damage, disturbed areas, and forest stands in regeneration |
| 61%–70% | 3.90 | 1.25 | 6.11 | 132,023 | |
| 71%–80% | 2.81 | 0.86 | 3.58 | 77,245 | |
| 81%–90% | 1.79 | 0.61 | 2.24 | 48,297 | Dying and dead stands, disturbed areas without forest regeneration, logging |
| 91%–100% | 2.01 | 0.75 | 2.33 | 50,417 | |
| Logging | 2.26 | 1.00 | 2.74 | 59,195 | |
| Total: | 100 | 100 | 100 | 2,160,264 | |
Disclaimer/Publisher’s Note: The statements, opinions and data contained in all publications are solely those of the individual author(s) and contributor(s) and not of MDPI and/or the editor(s). MDPI and/or the editor(s) disclaim responsibility for any injury to people or property resulting from any ideas, methods, instructions or products referred to in the content. |
© 2024 by the authors. Licensee MDPI, Basel, Switzerland. This article is an open access article distributed under the terms and conditions of the Creative Commons Attribution (CC BY) license (https://creativecommons.org/licenses/by/4.0/).
Share and Cite
Bucha, T.; Pavlenda, P.; Konôpka, B.; Tomaštík, J.; Chudá, J.; Surový, P. Satellite Assessment of Forest Health in Drought Conditions: A Novel Approach Combining Defoliation and Discolouration. Forests 2024, 15, 1567. https://doi.org/10.3390/f15091567
Bucha T, Pavlenda P, Konôpka B, Tomaštík J, Chudá J, Surový P. Satellite Assessment of Forest Health in Drought Conditions: A Novel Approach Combining Defoliation and Discolouration. Forests. 2024; 15(9):1567. https://doi.org/10.3390/f15091567
Chicago/Turabian StyleBucha, Tomáš, Pavel Pavlenda, Bohdan Konôpka, Julián Tomaštík, Juliána Chudá, and Peter Surový. 2024. "Satellite Assessment of Forest Health in Drought Conditions: A Novel Approach Combining Defoliation and Discolouration" Forests 15, no. 9: 1567. https://doi.org/10.3390/f15091567