Article

Integrated Transcriptome and Metabolome Analyses Provided Insight into the Variation in Quality of Green Bamboo (Bambusa oldhamii) Shoots at Different Growth Stages

State Key Laboratory of Subtropical Silviculture, Zhejiang A&F University, Hangzhou 311300, China
*
Author to whom correspondence should be addressed.
Forests 2024, 15(9), 1582; https://doi.org/10.3390/f15091582
Submission received: 3 August 2024 / Revised: 2 September 2024 / Accepted: 6 September 2024 / Published: 9 September 2024

Abstract

:
Green bamboo (Bambusa oldhamii) shoots are not only delicious but also highly nutritious. However, their palatability and quality changed significantly upon being unearthed, making them unsuitable for commercial sale and subsequently diminishing their market value. To clarify the mechanisms that regulate the quality of green bamboo shoots at different growth stages, we conducted a comprehensive analysis of the metabolome and transcriptome at the unearthed height of 0 cm (H0), 5 cm (H5), and 10 cm (H10). Metabolome analysis identified 149 differentially accumulated metabolites (DAMs) among H0, H5, and H10, primarily comprising phenolic acids, lipids and flavonoids. Metabolic pathways enriched by these DAMs included phenylpropanoid biosynthesis, phenylalanine metabolism, flavonoid biosynthesis, linoleic acid metabolism and alpha-linolenic acid metabolism. Further transcriptome analysis identified 2976 differentially expressed genes (DEGs) among H0, H5, and H10. Additionally, KEGG analysis indicated that these DEGs mainly enriched pathways associated with metabolic pathways, biosynthesis of secondary metabolites, and phenylalanine metabolism. We screened out 10 DEGs and 16 intermediate metabolites of these pathways. Furthermore, we identified six DEGs with expression patterns highly correlated with the content of lignin and the total flavonoids from H0 to H5 and H10. Finally, RT-qPCR analysis of six genes validated the transcriptome sequencing data. Our findings indicate significant quality variations in green bamboo shoots from H0 to H5 and H10. These variations are closely related to key genes involved in the synthesis of lignin and flavonoids, which result in the flavor and quality changes of green bamboo shoots from the belowground stage to unearthed stage.

1. Introduction

Bamboo shoots are widely acclaimed as nutrient-rich green food items, characterized by high content of dietary fiber, protein, amino acids, carbohydrates, and minerals, while being low in fat, making them popular among the public [1,2,3]. In addition, green bamboo (Bambusa oldhamii) shoots have significant economic value in the market due to their deliciously sweet, crispy, and tender taste [4,5], and they are highly regarded in various culinary traditions [1,3]. However, the quality and market value of bamboo shoots vary significantly depending on the genetic characteristics of different bamboo species, as well as cultivar varieties and spatio-temporal factors [6,7,8,9]. Particularly relevant, the palatability and nutrient composition of bamboo shoots undergo substantial changes at different developmental stages [3,9,10]. These changes are characterized by the accumulation of bitter compounds and increased lignification, which are visually manifested as the transformation of the sheath color from green to yellow [4]. Thus, lignification and increased bitterness are two major drawbacks that affect the sale of fresh bamboo shoots, and addressing these issues is essential for improving their marketability.
Lignification symptoms occur during the development of bamboo shoots as well as in the post-harvest stage [11,12,13,14]. The edible quality of fresh bamboo shoots deteriorates rapidly after harvest. Li et al. [15] found a rapid decrease in soluble sugars, structural polysaccharides, and hydrolyzed tannins, along with an increase in lignin and condensed tannins in postharvest moso bamboo shoots. Furthermore, Zhang et al. [13] comparatively analyzed the lignification process of two types of bamboo shoots and concluded that the molecular mechanisms of lignification in moso bamboo and high bamboo are significantly different. Numerous studies have focused on cell wall metabolism and the related physiological and molecular mechanisms in fruits and vegetables, such as postharvest kiwifruits [16], papaya fruit [17], loquat fruit [18,19,20,21], bamboo shoots [11,12,13,14,22], and asparagus [23,24]. The phenylpropanoid pathway is a general pathway for monolignol biosynthesis, which leads to lignification in plants. The complex regulatory mechanisms of phenylpropanoid biosynthesis have been extensively studied [25,26]. However, the relationship between the lignification process and the synthesis of other nutrient compositions during the development of bamboo shoots remains unclear.
The bitterness of bamboo shoots is determined by a plethora of different compounds varying among bamboo species [4,27] and phenological stages [8,9,28]. Previous studies have identified various bitter phytonutrients in common plant foods, including flavanones, flavones, flavonols, flavans, phenolic flavonoids, polyphenols, and isoflavones [29,30]. Yu et al. [5] isolated two bitter components from the phenylpropanoid biosynthesis pathway, while Gao et al. [27] found that L-phenylalanine is the greatest contributor to bamboo shoot bitterness. In addition, Chen et al. [31] revealed that the deterioration in taste of moso bamboo from winter to spring shoots is due to a significant increase in hydrolyzed tannins in spring shoots, whereas Jiao et al. [4] identified other bitter compounds such as solanidine, amygdalin, arbutin, apigenin, and salicin, which contribute to the bitter taste in the tip shoots of Bambusa oldhamii. Interestingly, the accumulation of flavanones and flavones in citrus was associated with transcriptional regulation by AP2/ERF family, which regulates type IV chalcone isomerase [32]. Additionally, some transcription factors (e.g., MYB and bHLH) can regulate the expression of genes involved in the flavonoid pathway, thus affecting bitterness in medicinal plants and herbs [33,34].
Newly developed transcriptomics and metabolomics have extensively explored the relationship between gene expression and metabolites, clarifying possible molecular mechanisms behind variations in plant characteristics [35]. These approaches are also widely applied in research on the growth and quality of bamboo shoots. Recently, Zhang et al. [36] revealed that the phenylpropanoid pathway may cooperatively regulate the biosynthesis of flavonoids and lignin in plants. However, the synthesis of flavonoids in bamboo shoots during different growth stages, as well as the relationship between the processes of lignification and flavonoid synthesis in green bamboo shoots, requires further study. Thus, we focused on the phenylpropanoid pathway to investigate the synthesis of lignin and flavonoids, along with the related mechanisms. To identify the lignification process and palatability of green bamboo shoots, we analyzed the transcriptomics and metabolomics of green bamboo shoots at three growth stages (the unearthed height of bamboo shoots at 0 cm, 5 cm, and 10 cm, respectively) to assess the differentially accumulated metabolites (DAMs) and differentially expressed genes (DEGs) across developmental stages. Understanding these variations through integrated transcriptome and metabolome analyses is crucial for optimizing the harvesting and processing of green bamboo shoots, ultimately enhancing their market value and consumer satisfaction.

2. Materials and Methods

2.1. Study Site and Plant Materials

Green bamboo (Bambusa oldhamii) shoots were harvested in July 2021 from Pingyang County (27°35′55″ N, 120°19′9″ E), Wenzhou City, Zhejiang Province, China. The bamboo stand was nearly 20 years old, and the green bamboo forest has been managed by a local farm for bamboo shoot production for almost 6 years. It is located at an altitude of 15 to 20 m with a subtropical marine monsoon climate, and the annual average temperature is 17.8 °C. The average diameter at breast height of bamboo stands is about 6.50 cm, with nearly 600 bamboo per hectare.
Based on the previous studies by Jiao et al. [4] and Yu et al. [5] and the production practice experience of green bamboo shoot harvesting, there were great variations of flavor and quality of the bamboo shoot samples. We selected three representative growth stages to collect bamboo shoot samples. Briefly, the underground shoots were delicious taste and popular in the market, and we defined bamboo shoots in this growth stage as H0. When the bamboo shoots just emerged aboveground and exposed to the sunlight, the bitter substances started accumulating in the tips. We collected bamboo shoots in this growth stage as H5, representing the aboveground height of green bamboo shoots nearly 5 cm. The third growth stage of the bamboo shoot was the aboveground height of almost 10 cm, and a large number of bitter substances synthesized with the foliole of the shoot sheath have become green. Above all, to investigate the variation of flavor and quality during the emergence of bamboo shoots, we collected samples at three growth stages: unearthed (H0), 5 cm height above ground (H5), and 10 cm height above ground (H10). There were 3 biological replicates in each growth stage. The harvested shoots were transported to the laboratory at low temperature in 6 h post-harvest. The middle section of each shoot, approximately 2 cm thick, was collected; some samples were frozen in liquid nitrogen, and then stored in an ultra-low temperature freezer (−80 °C) for transcriptome and metabolome analysis and quantitative real-time PCR assays, while other samples were dried in an oven for further physiological index analysis.

2.2. Determination of Lignin, Cellulose, Hemicellulose and Total Flavonoid Content

The measurement methods of lignin and cellulose were adapted from Li et al. [12] and Wang [37], with slight modifications for acid-insoluble lignin. Initially, the samples were dried in an oven and ground using a grinder. The dried samples were then extracted via Soxhlet extraction with a benzene–ethanol mixture (2:1, v/v) under constant reflux for 12 h to obtain dewaxed materials. Acid-insoluble lignin was isolated through a two-step sulfuric acid hydrolysis process, and filtered using a G4 crucible-type funnel until the lower edge of the funnel was neutral. The residue, which was the acid-insoluble lignin, was placed in an oven to dry and weighed for calculation. Cellulose content and hemicellulose content were determined using the cellulose content Kit (G0715W, Suzhou Grace Biotechnology Co., Ltd., Suzhou, China) and hemicellulose content Kit (G0716W, Suzhou Grace Biotechnology Co., Ltd., Suzhou, China), respectively. The dried samples were ground into powder and filtered through a 40-mesh sieve. The UV absorbance (A) was measured by a Spark Multimode Microplate Reader (Tecan Group Ltd., Männedorf, Switzerland) at 620 nm and 460 nm, respectively. Then, the absorbance difference (ΔA = AA’) between the samples and the blank solution (A’) was calculated. The cellulose content and the hemicellulose content were calculated using the following formulas based on the kit manuals:
c e l l u l o s e   c o n t e n t   % = Δ A 0.004 ÷ 8.6029 × V 1 ÷ W × V 1 ÷ V × 0.9 × D × 10 3 × 100 %
h e m i c e l l u l o s e   c o n t e n t   % = C × V 1 × Δ A ÷ A 1 A 0 ÷ W × V 1 ÷ V × 0.9 × D × 10 3 × 100 %
In Formulas (1) and (2) above, V is extraction volume, V1 is sample volume, W is sample quality, D is dilution multiple, C is the concentration of the standard (0.5 mg/mL), A1 is the absorbance of standard and A0 is the absorbance of the blank. Three independent replicates were conducted for each developmental stage.
The measurement method for total flavonoids was adapted from Miao et al. [38], with slight modifications for bamboo shoot material. Fresh bamboo shoot samples (1.0 g) were extracted with a 60% ethanol solution at 60 °C for 20 min using ultrasonic oscillation, and the filtrate was collected. The supernatant was subsequently treated with NaNO2, Al(NO3)3, and NaOH solutions. After 15 min, the absorbance was measured by a spectrophotometer (UV2600, Shimadzu, Tokyo, Japan) at 510 nm. The rutin standard was used for expressing the total flavonoid content.

2.3. Metabolite Extraction and Analysis

The freeze-dried bamboo shoots were crushed using a mixer mill (MM 400, Retsch GmbH, Haan, Germany) with a zirconia bead for 1.5 min at 30 Hz. A total of 100 mg of the lyophilized powder was dissolved in 1.2 mL of a 70% methanol solution. The mixture was vortexed for 30 s every 30 min, for a total of six cycles, and then placed in a refrigerator at 4 °C overnight. After 10 min of centrifugation at 12,000 rpm, the supernatant was collected and filtered. The sample extracts were analyzed using a UPLC-ESI-MS/MS system (UPLC, Shimadzu Nexera X2, www.shimadzu.com.cn/ (accessed on 29 December 2021); MS, Applied Biosystems 4500 Q TRAP, www.appliedbiosystems.com.cn/ (accessed on 29 December 2021)). All metabolites of bamboo shoots were analyzed using the OPLS-DA model to determine the differences between H0, H5, and H10, and a Q2 value greater than 0.5 for the compared groups indicated the validity of these models. These variations could be further analyzed using VIP analysis to identify the DAMs. Significantly regulated metabolites between groups were identified based on a VIP threshold of ≥1 and an absolute log2 fold change (FC) of ≥1. VIP values were extracted from the OPLS-DA results, which also included score plots and permutation plots generated using the R package MetaboAnalystR 4.0. The data underwent log transformation (log2) and mean centering prior to OPLS-DA analysis. To avoid overfitting, a permutation test with 200 permutations was performed. These DAMs were annotated using the Kyoto Encyclopedia of Genes and Genomes (KEGG) database (https://www.genome.jp/kegg/pathway.html (accessed on 29 December 2021)) and mapped onto KEGG metabolic pathways for pathway analysis and enrichment.

2.4. RNA Extraction, Library Construction, and Transcriptome Analysis

Total RNA was extracted from bamboo shoots using RNAprep pure Plant Kit (TIANGEN, Beijing, China) and then treated with PrimeScript RT reagent kit (TaKaRa Bio, Inc., Otsu, Japan) with gDNA Eraser (TaKaRa Bio Inc., Otsu, Japan) to remove possible genomic DNA contamination. The RNA concentration and quality of each sample were determined using gel electrophoresis and a NanoPhotometer® spectrophotometer (IMPLEN, Calabasas, CA, USA), with the ratio of A260 to A280 from 2.0 to 2.1, and the concentration ranged from 650 to 950 ng/μL. Additionally, the total RNA purity was analyzed using an Agilent Bioanalyzer 2100 (Agilent Technologies, Santa Clara, CA, USA). RNA samples were prepared with 1 µg of input material per sample and sequenced using the NEBNext® Ultra™ RNA Library Prep Kit (New England BioLabs, Ipswich, MA, USA) for Illumina®. All subsequent analyses were based on clean reads. TransDecoder v5.7.1 (https://github.com/TransDecoder/TransDecoder/releases (accessed on 29 December 2021)) was used to identify candidate coding regions within transcript sequences generated by de novo RNA-Seq transcript assembly using Trinity. Gene expression levels were estimated using RSEM, and the FPKM (Fragments Per Kilobase of transcript per Million mapped reads) for each gene was calculated based on gene length. FPKM is currently the most commonly used method for estimating gene expression. Differential expression between the two groups was analyzed using DESeq2 v1.22.1, with the p value corrected using the Benjamini–Hochberg method. The corrected p value < 0.05 and |log2 fold change| ≥ 1 were used as thresholds for significant differential expression. Gene Ontology (GO) [39] and KEGG [40] pathway enrichment analyses were conducted using cloud analysis tools (https://cloud.metware.cn, accessed on 5 July 2022) provided by Metware Biotechnology Co., Ltd. (Wuhan, China).

2.5. Quantitative Real-Time-PCR Validation

Six key genes in the KEGG pathway were selected and the transcriptome data were validated by qRT-PCR. Total RNA extraction was performed according to RNA library construction. First-strand cDNA was obtained using the PrimeScript RT Reagent kit with gDNA Eraser (TaKaRa Bio, Inc., Otsu, Japan). The qRT-PCR was performed with ChamQ Universal SYBR qPCR Master Mix (Vazyme, Nanjing, China) using a CFX96 instrument (Bio-Rad, Hercules, CA, USA). The NTB genes of green bamboo shoots were used as internal reference controls, primers (Table S1) were added and PCR amplification was performed. Primers were designed using the online software Primer-BLAST 26, and after design, they were checked using the software Primer Check to confirm that no primers between the primers were designed using the online software Primer-BLAST 26. The relative expression levels of the genes were determined using the cyclic threshold method 2−ΔΔCT. Three biological replicates were set for each growth stage, and each biological replicate was then subjected to three technical replicates.

2.6. Statistical Analysis

All data were represented as mean ± standard deviation (SD). The data were analyzed by one-way ANOVA with SPSS 22.0 (IBM, Armonk, NY, USA). Least significant differences (LSDs) were calculated to compare significance at α = 0.05 level. Visualization of relationships was performed using Cytoscape software (version 3.9.1, USA), while Origin 2021 was utilized for graphic drawing.

3. Results

3.1. Changes of Lignin, Cellulose, Hemicellulose and Flavonoid Contents of Green Bamboo Shoots at Three Growth Stages

The quality of green bamboo shoots changed significantly at different growth stages. As green bamboo shoots grow from being unearthed to above ground, their internodes visibly elongate, and the surface color of the bamboo sheath gradually shifts to green from the top to the base (Figure 1A). The lignin content of green bamboo shoots ranged from 7.03% to 11.26%, cellulose content ranged from 13.65% to 15.55%, and hemicellulose content ranged from 9.85% to 12.47% (Figure 1B(a–c)). There was a significant increase in lignin, cellulose, and hemicellulose content from H0 to H5, followed by a slight decrease in cellulose and hemicellulose from H5 to H10. In contrast, the total flavonoid content did not change from H0 to H5, but it increased by 18.70% from H0 to H10 (p < 0.05) (Figure 1B(d)).

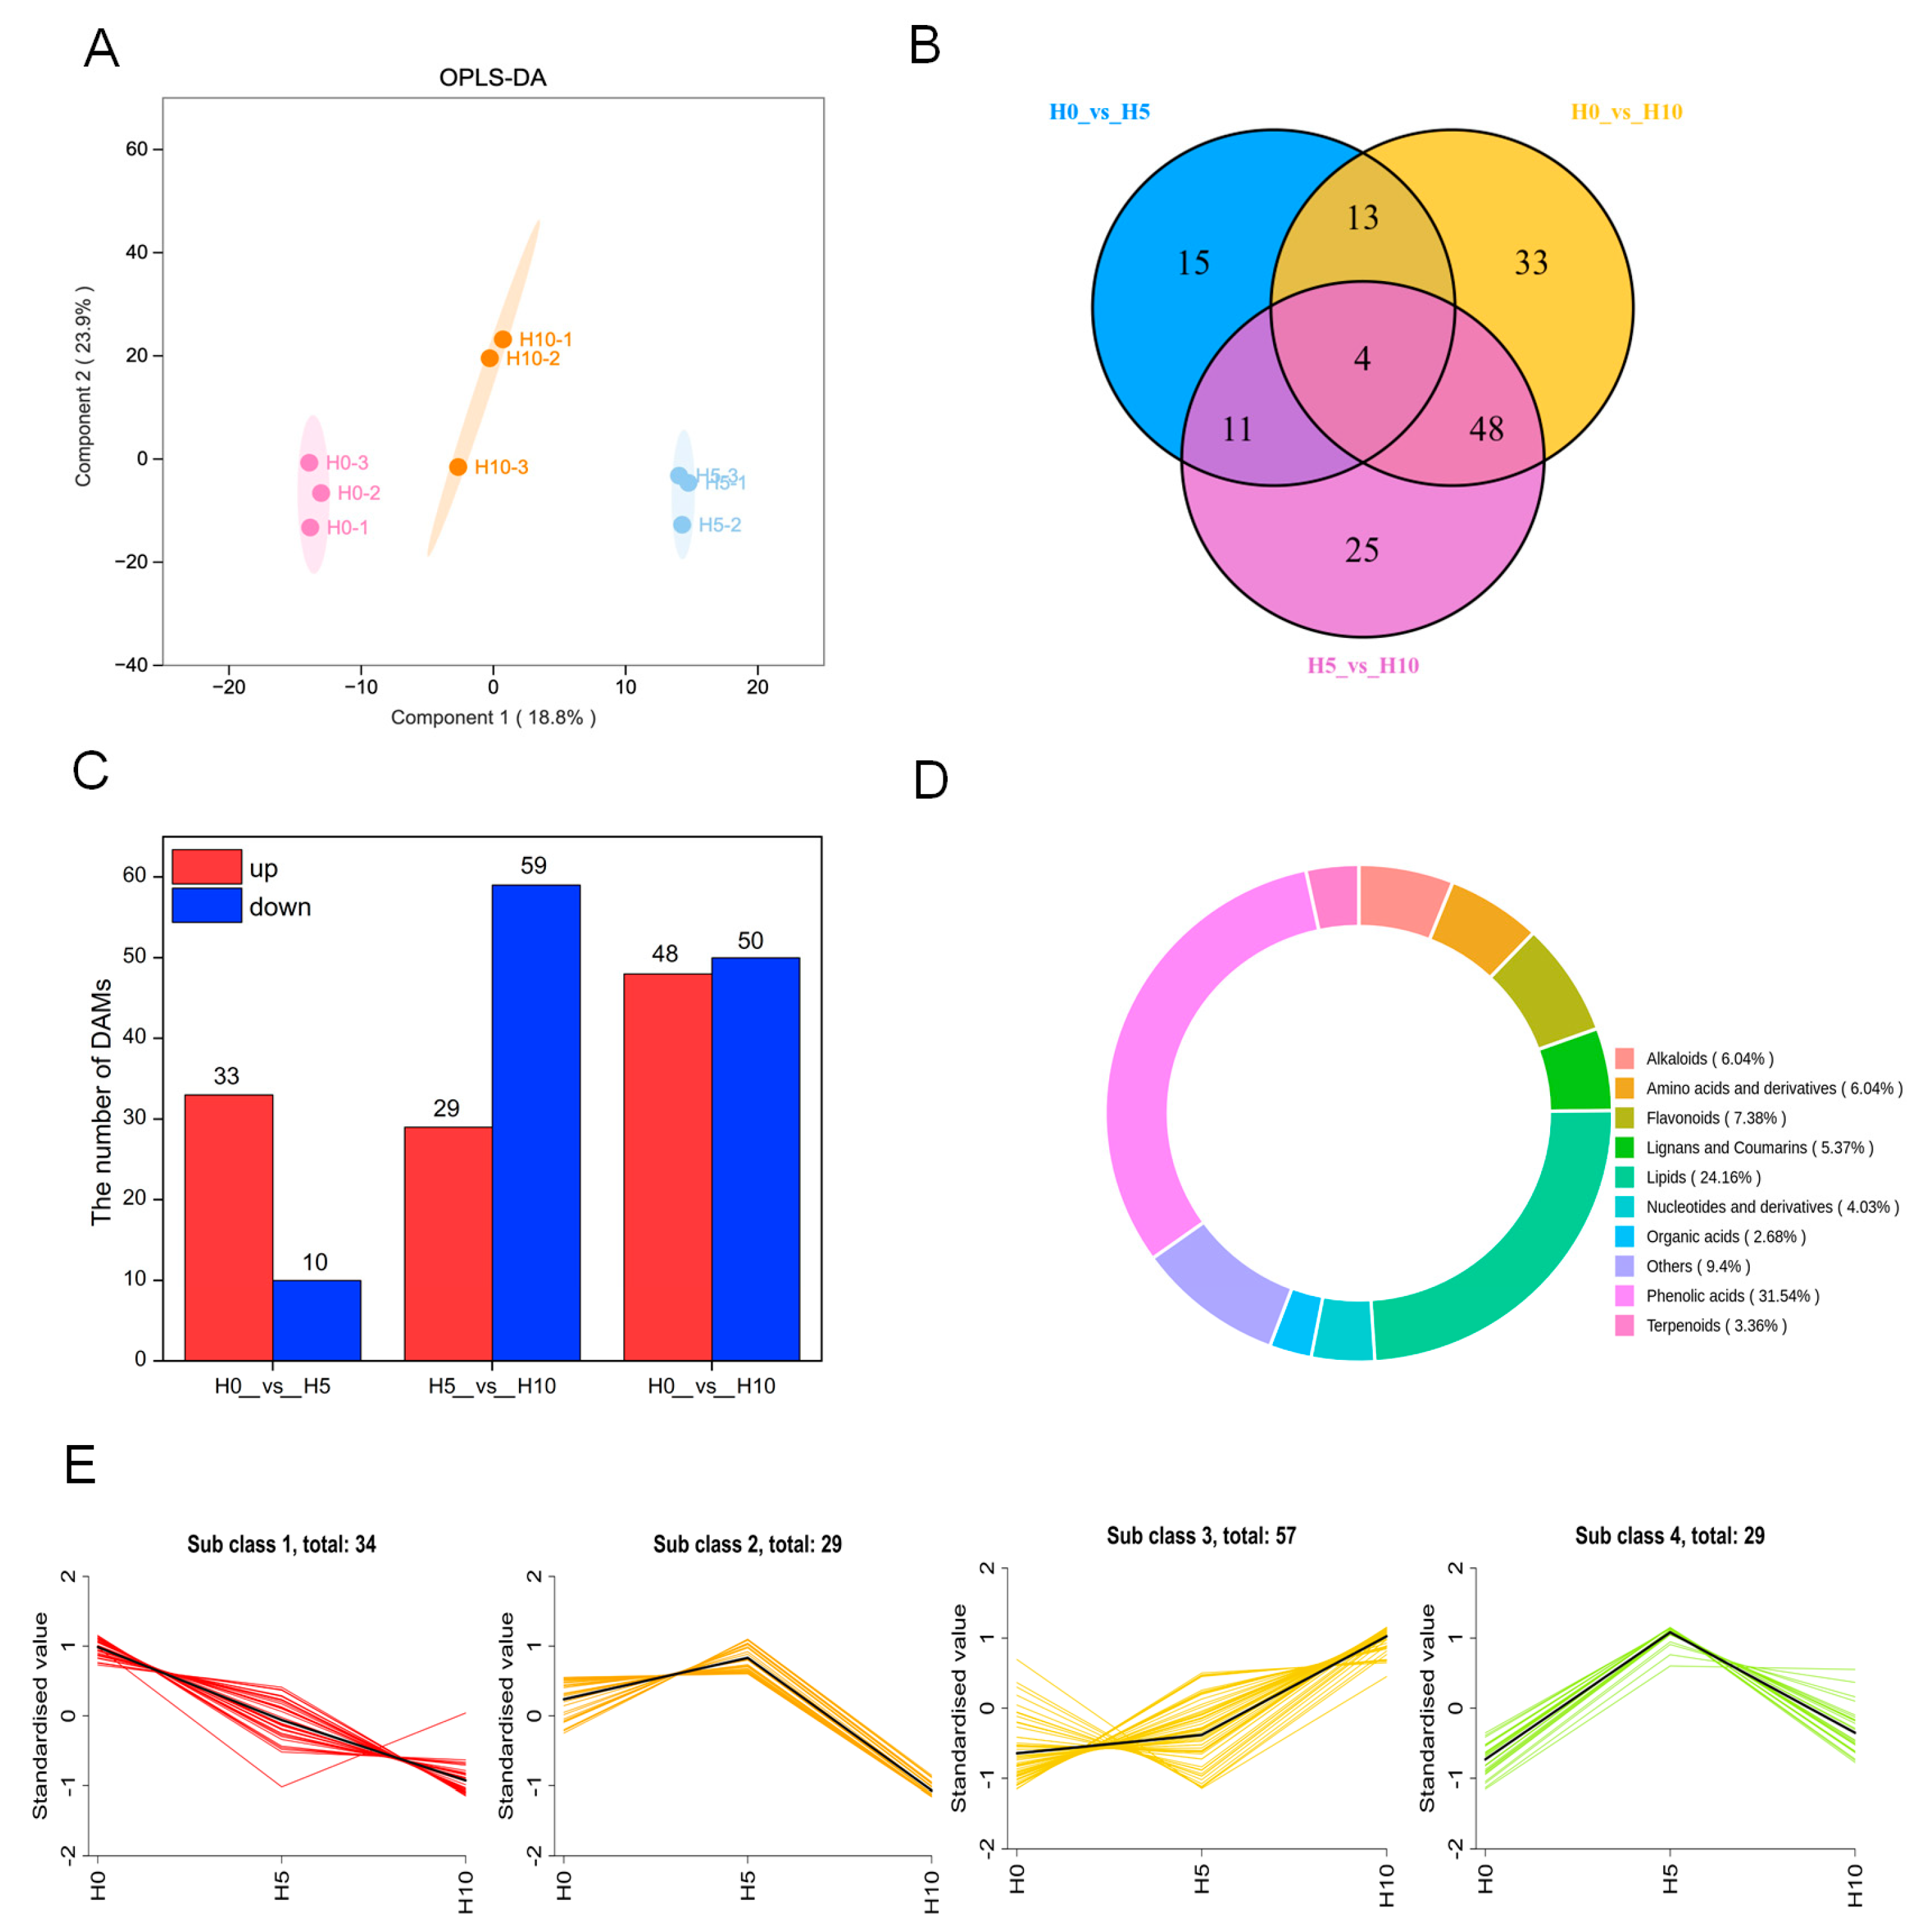
3.2. Metabolomic Changes at Three Growth Stages

All metabolites of bamboo shoots were analyzed using the OPLS-DA model to determine the differences between H0, H5, and H10 (Figure 2A, Q2 = 0.698, R2X = 0.429, R2Y = 0.992). A Q2 value greater than 0.5 for the compared groups indicated the variations of three growth stages could be further analyzed to identify the DAMs. The Venn diagram showed a total of 149 DAMs among H0, H5 and H10, and there were only 4 DAMs that overlapped between H0, H5 and H10. (Figure 2B). A total of 43 DAMs were identified in the comparison between H0 and H5, of which 33 were up-regulated and 10 were down-regulated. The number of DAMs identified in the comparison between H5 and H10 was higher than those in H0 versus H5, with a total of 88 DAMs, of which 29 were up-regulated and 49 were down-regulated (Figure 2C).
A total of 11 classes of metabolites were detected in green bamboo shoots at three growth stages (Figure 2D). The most abundant classes were phenolic acids (31.54%) and lipids (24.16%), followed by flavonoids (7.38%), alkaloids (6.04%), amino acids and their derivatives (6.04%), lignans and coumarins (5.37%), nucleotides and their derivatives (4.03%), terpenoids (3.36%), and organic acids (2.68%).
To understand the accumulation patterns of DAMs at three growth stages, all DAMs were clustered by K-means and were divided into four sub classes, and most of the DAMs belonged to up-regulated (sub class 3, 57 DAMs), primarily exhibiting an accumulation trend of phenolic acid compounds, which may be related to the growth changes of bamboo shoots. In sub class 1, the accumulation pattern of DAMs in the H5 and H10 was opposite to sub class 3, showing a decreasing trend, mainly among lipid compounds (Figure 2E, Table S2).
The KEGG analysis revealed that the main enriched pathways of metabolites in the comparison between H0, H5 and H10 included phenylpropanoid biosynthesis, phenylalanine metabolism, flavonoid biosynthesis, linoleic acid metabolism and alpha-linolenic acid metabolism (Figure 3). Phenylpropanoid biosynthesis, ubiquinone and other terpenoid-quinone biosynthesis, tryptophan metabolism, and phenylalanine metabolism were the most enriched pathways between H0 and H5 (Figure 3A), in contrast to linoleic acid metabolism and alpha-linolenic acid metabolism were found to be the most enriched pathways in the comparisons H5 vs. H10 and H0 vs. H10 (Figure 3B,C).

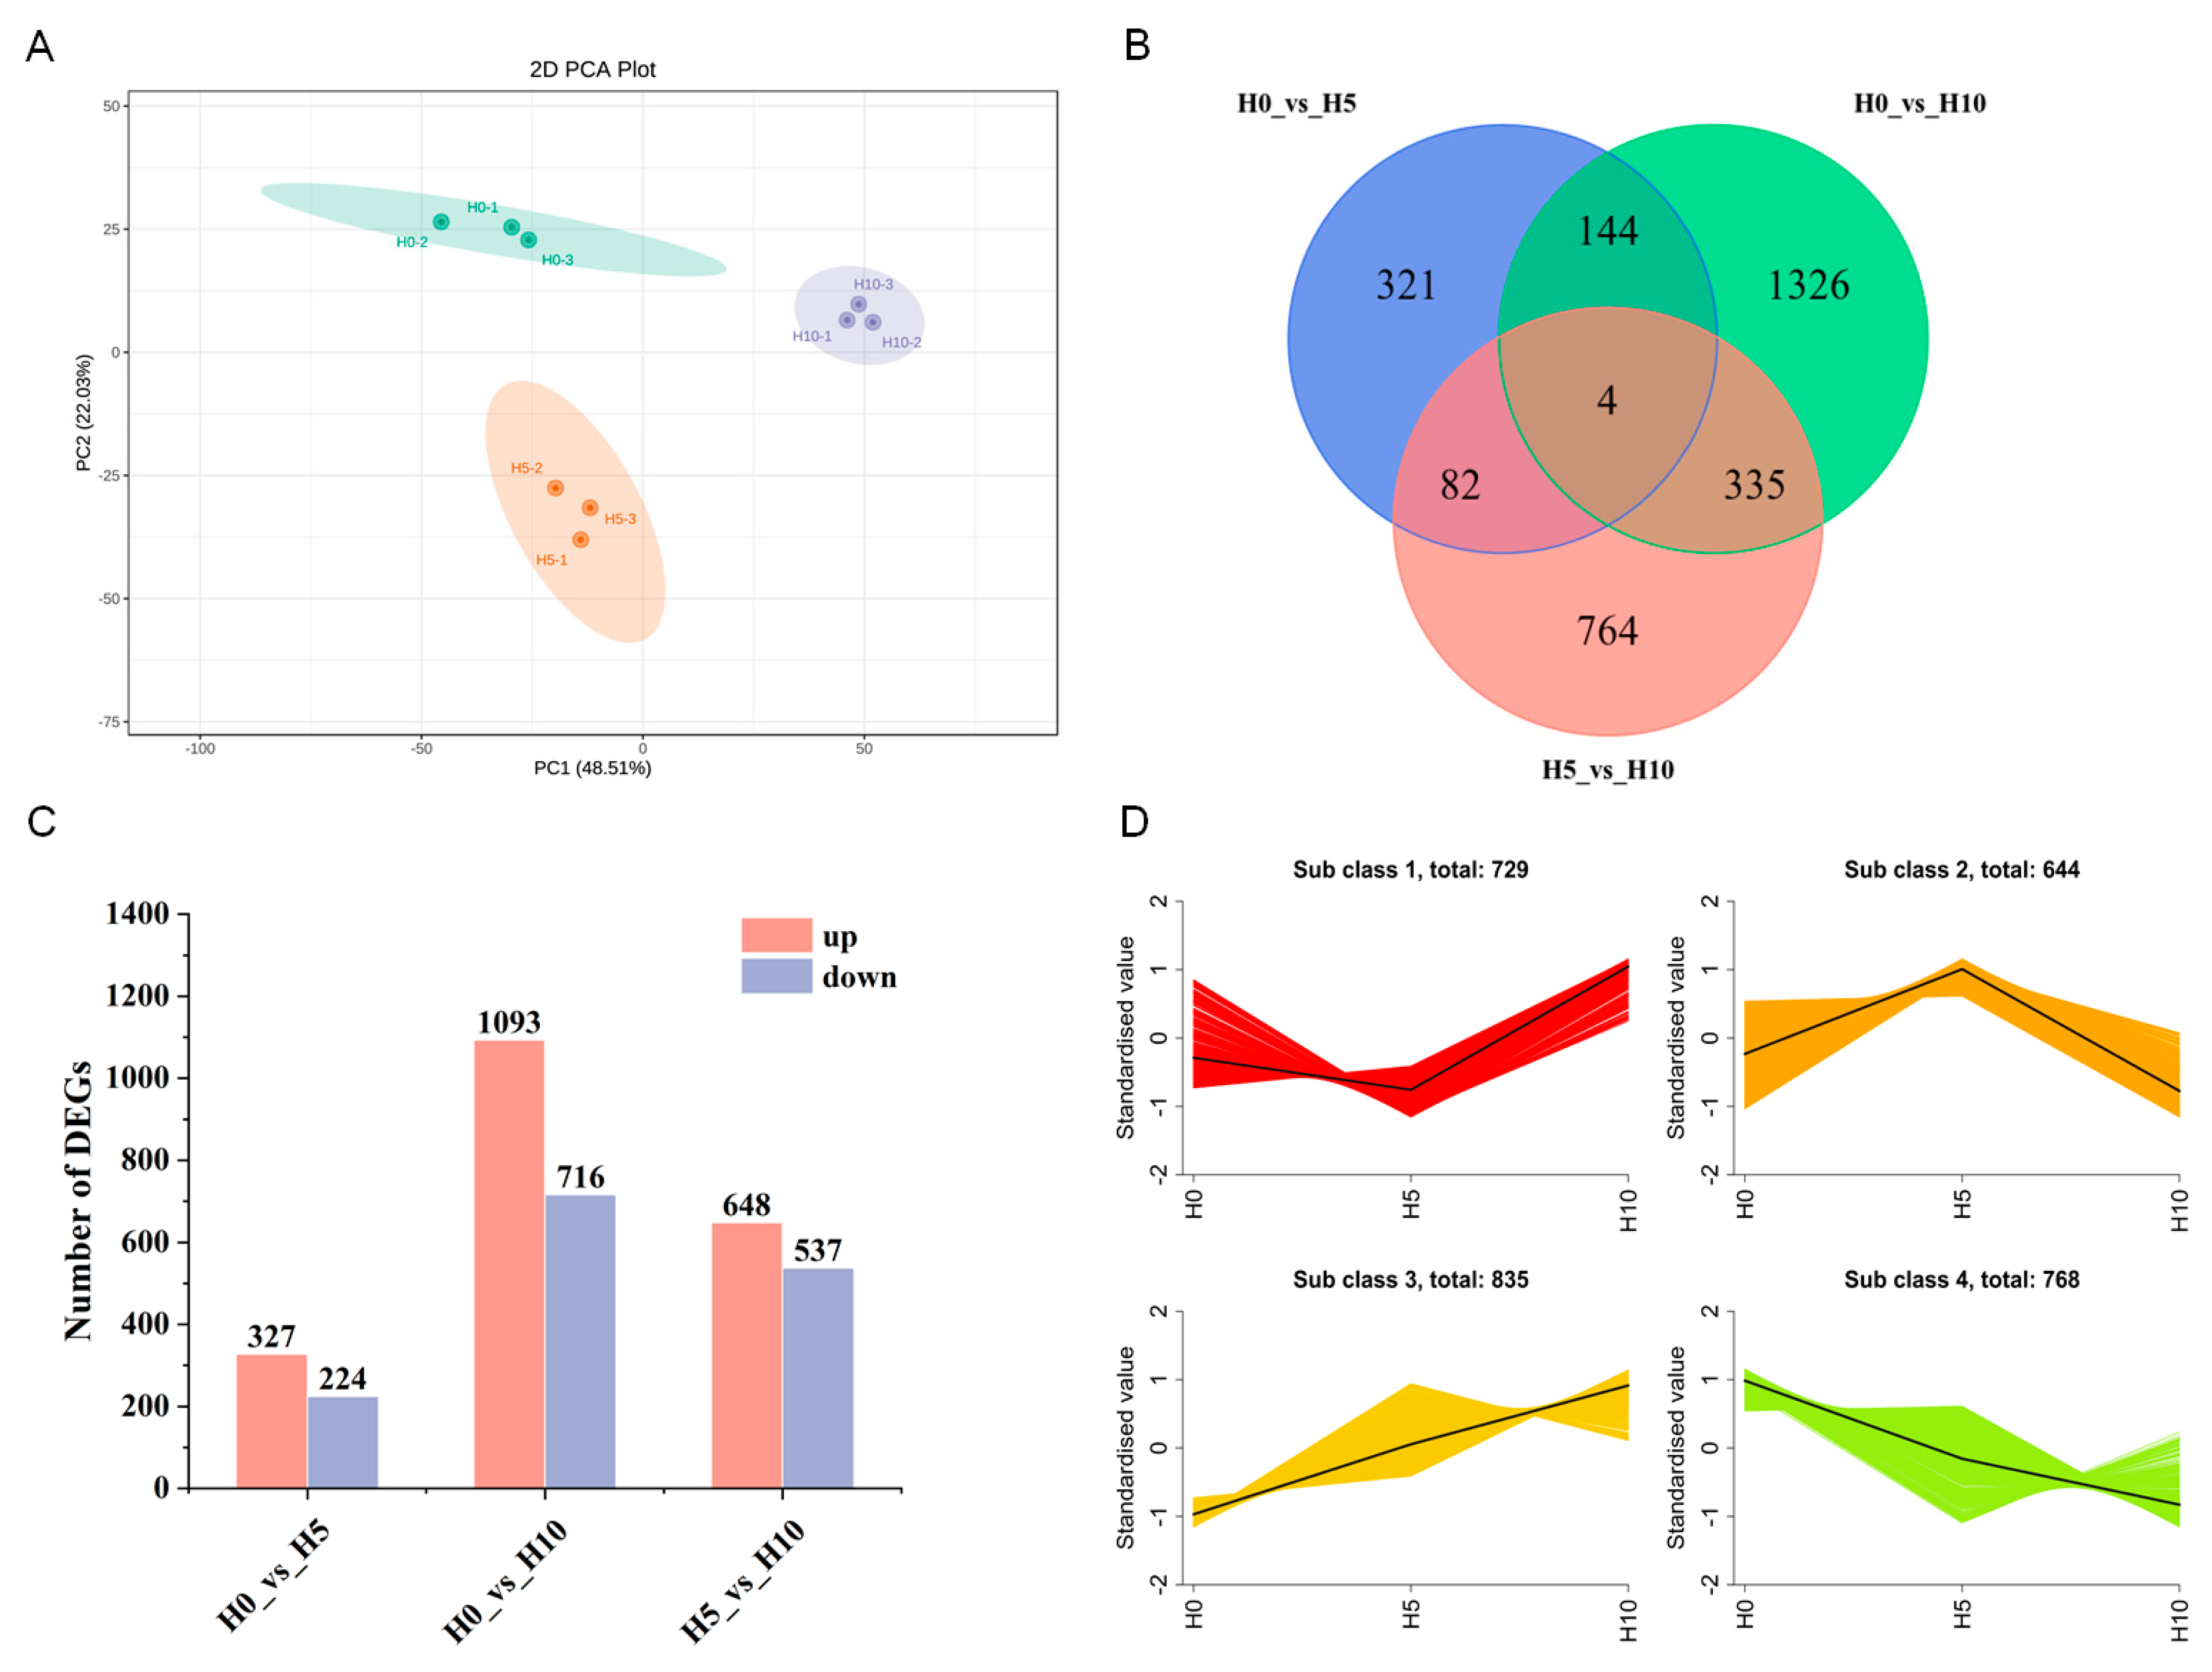
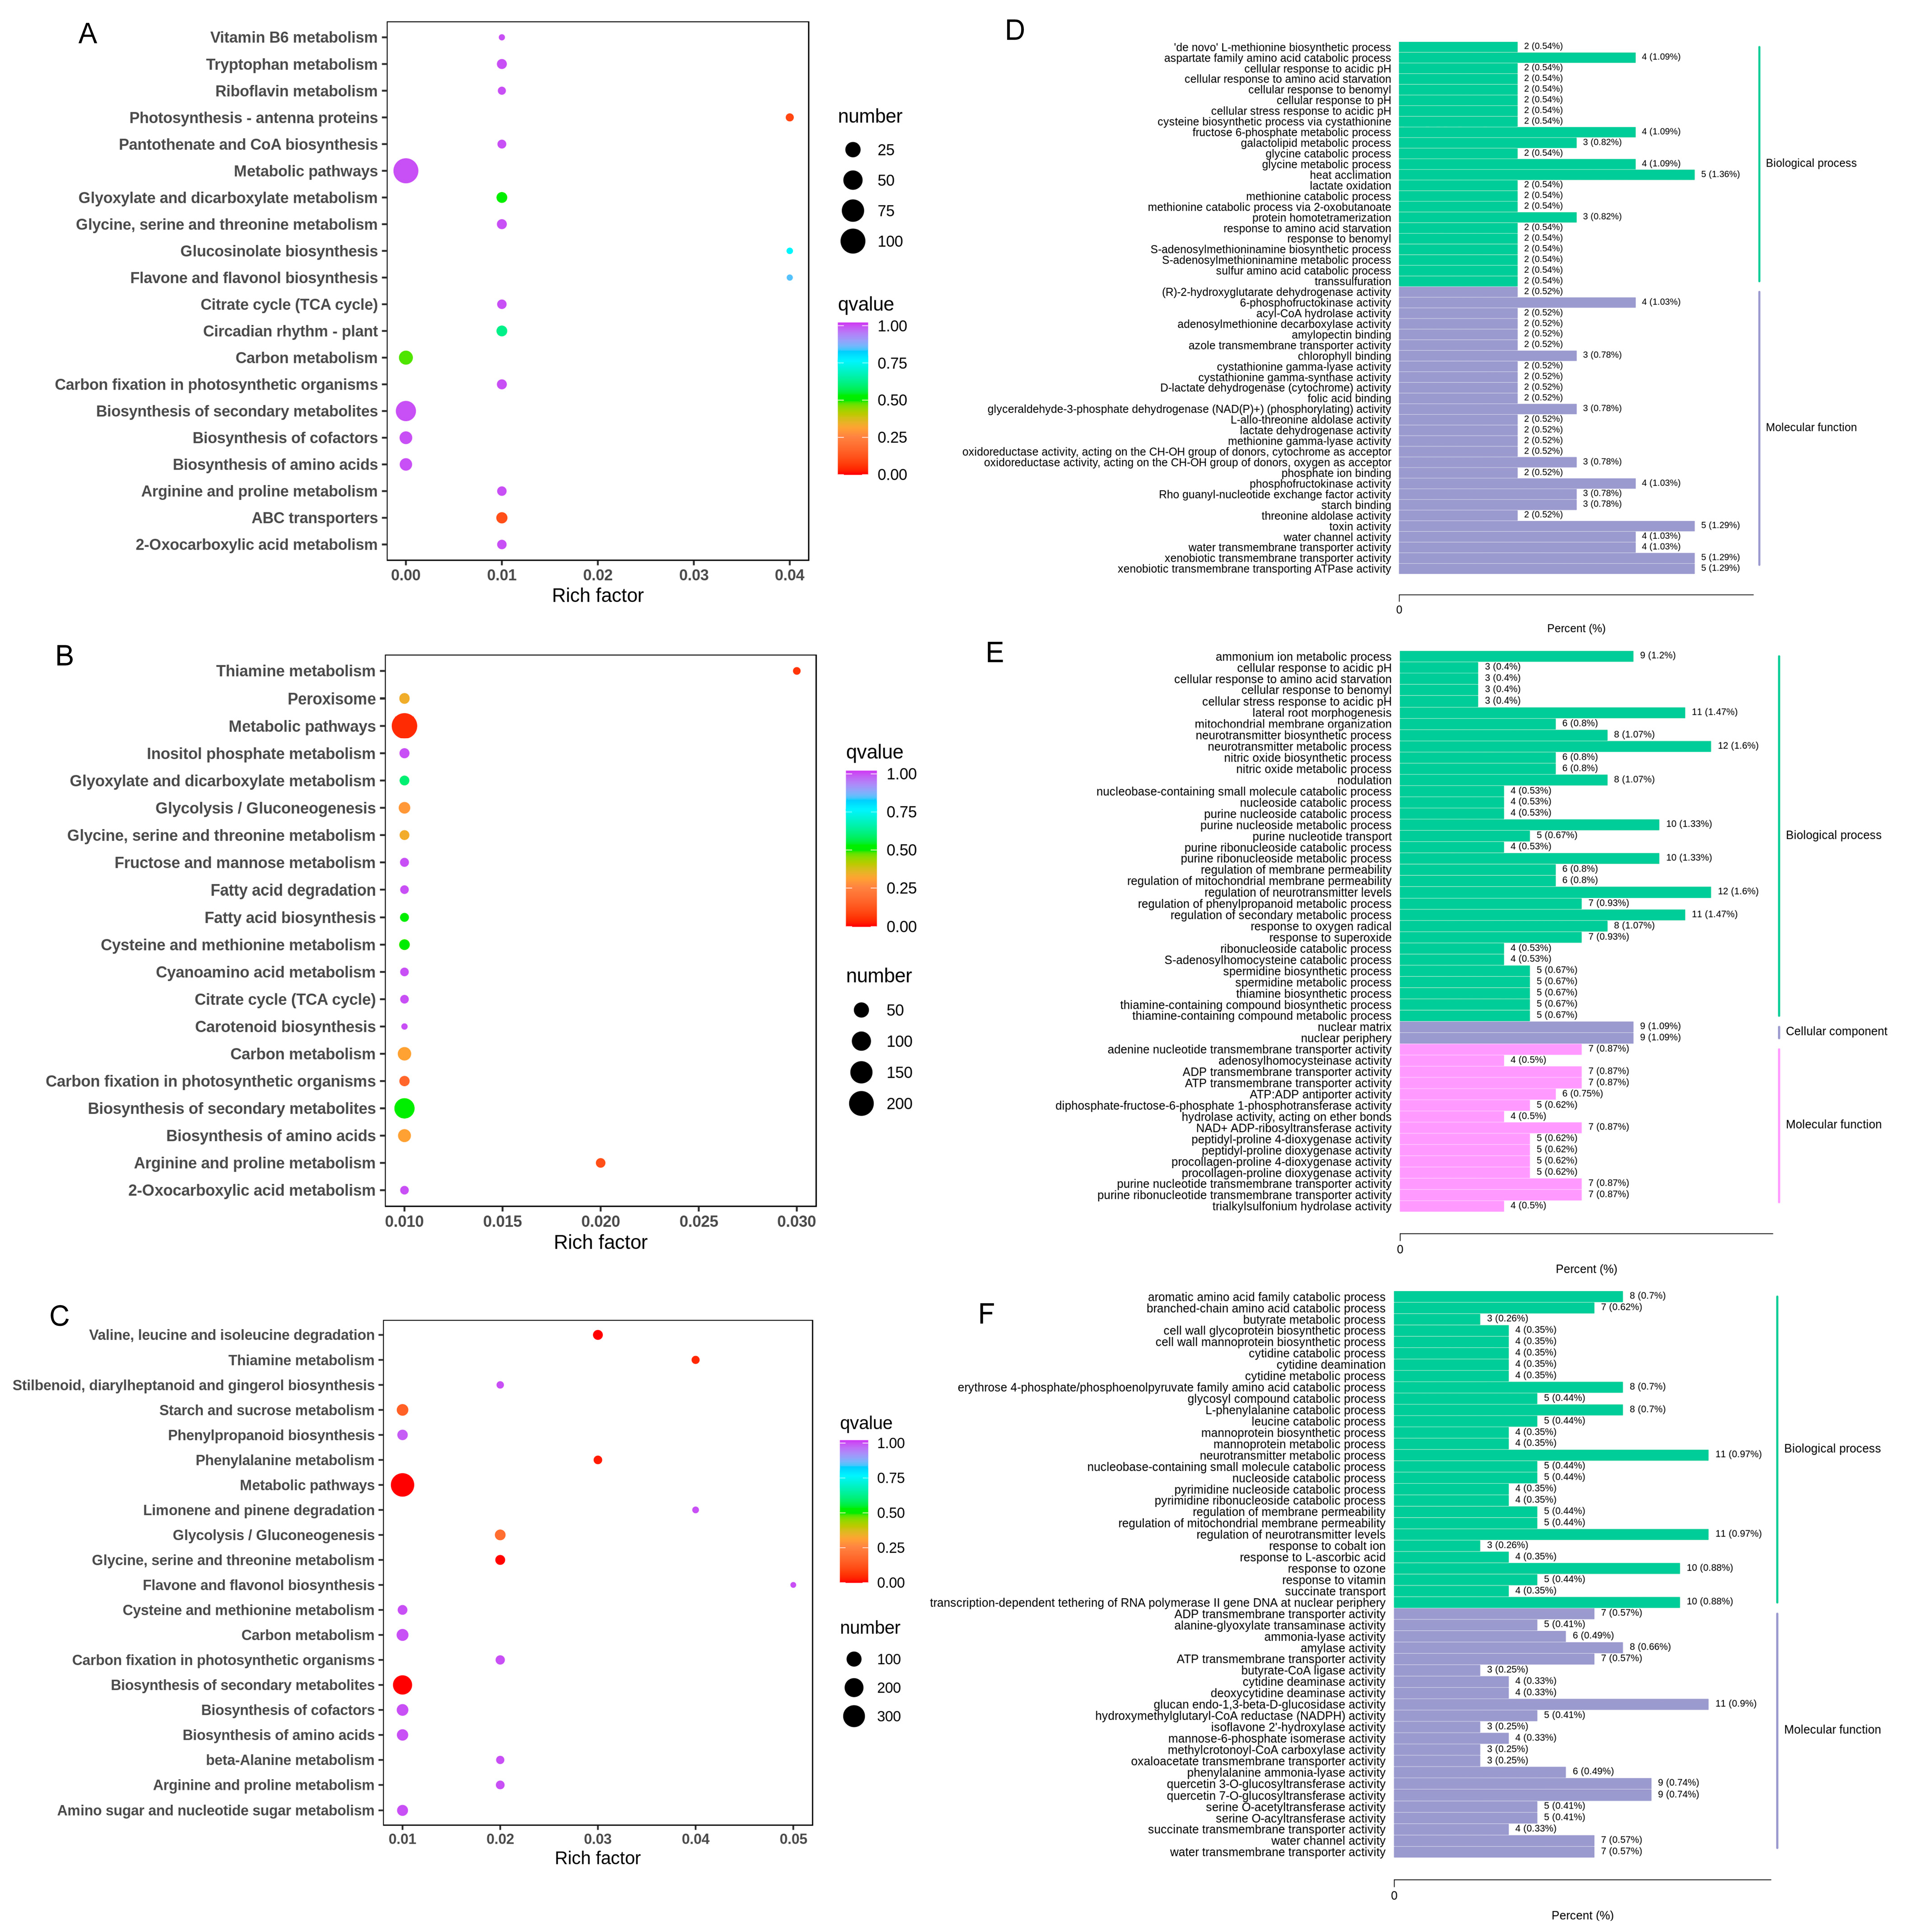
3.3. Transcriptome Analysis and Identification of DEGs of Three Growth Stages

To identify candidate genes involved in the flavor and quality of green bamboo shoots at three different growth stages, a transcriptome analysis was performed in this study (Figure 4). The PCA-based score plot of genes revealed clear differentiation between the H0, H5, and H10 groups, indicating reliable replicates for subsequent analysis. PC1 and PC2 accounted for 48.51% and 22.03% of the total differentially expressed genes (DEGs), respectively (Figure 4A). Based on the transcriptome data for differential expression analysis, a total of 2976 DEGs were identified at different growth stages (Table S3). The Venn diagram showed a total of 2976 DEGs among H0, H5 and H10, and there were only 4 DEGs that overlapped between H0, H5 and H10 (Figure 4B). In the comparison between H0 and H5, 551 DEGs were identified, with 327 up-regulated and 224 down-regulated (Figure 4B,C). In the comparison between H5 and H10, a total of 1185 DEGs were identified, of which 648 were up-regulated and 537 down-regulated, with 86 DEGs overlapping between the two comparison groups. Based on the pattern of expression, the DEGs were also divided into four clusters, the DEGs in H5 and H10 groups increased gradually with the growth of green bamboo shoots in sub class 3, most enriched 835 DEGs, including some key genes in phenylpropanoid biosynthesis, which may reflect the quality change of green bamboo shoots under different growth stage (Figure 4D, Table S3).
The KEGG analysis revealed the DEGs in the comparison between H0 and H5 were significantly enriched in the photosynthesis-antenna proteins and ABC transporters pathways, suggesting that light may play a role in the emergence of green bamboo shoots. In contrast, the DEGs in the comparison between H5 and H10 were primarily enriched in metabolic pathways, including the biosynthesis of secondary metabolites, phenylalanine metabolism, starch and sucrose metabolism, flavone and flavonol biosynthesis, and phenylpropanoid biosynthesis (Figure 5A–C).
Gene Ontology (GO) enrichment analyses were performed to gain further insights into the functions and associated biological processes in which the DEGs participated (Figure 5D–F). The top 50 GO enrichment of DEGs were classified into biological process (BP), molecular function (MF), and cellular component (CC), and mainly concentrated in BP and MF during three developmental stages. Different GO terms such as regulation of phenylpropanoid metabolic process and regulation of secondary metabolic process enriched between H5 and H10. Aromatic amino acid family catabolic process, L-phenylalanine catabolic process, quercetin 3-O-glucosyltransferase activity, and quercetin 7-O-glucosyltransferase activity enriched between H0 and H10, while heat acclimation, toxin activity, water channel activity, and water transmembrane transporter activity enriched between H0 and H5.

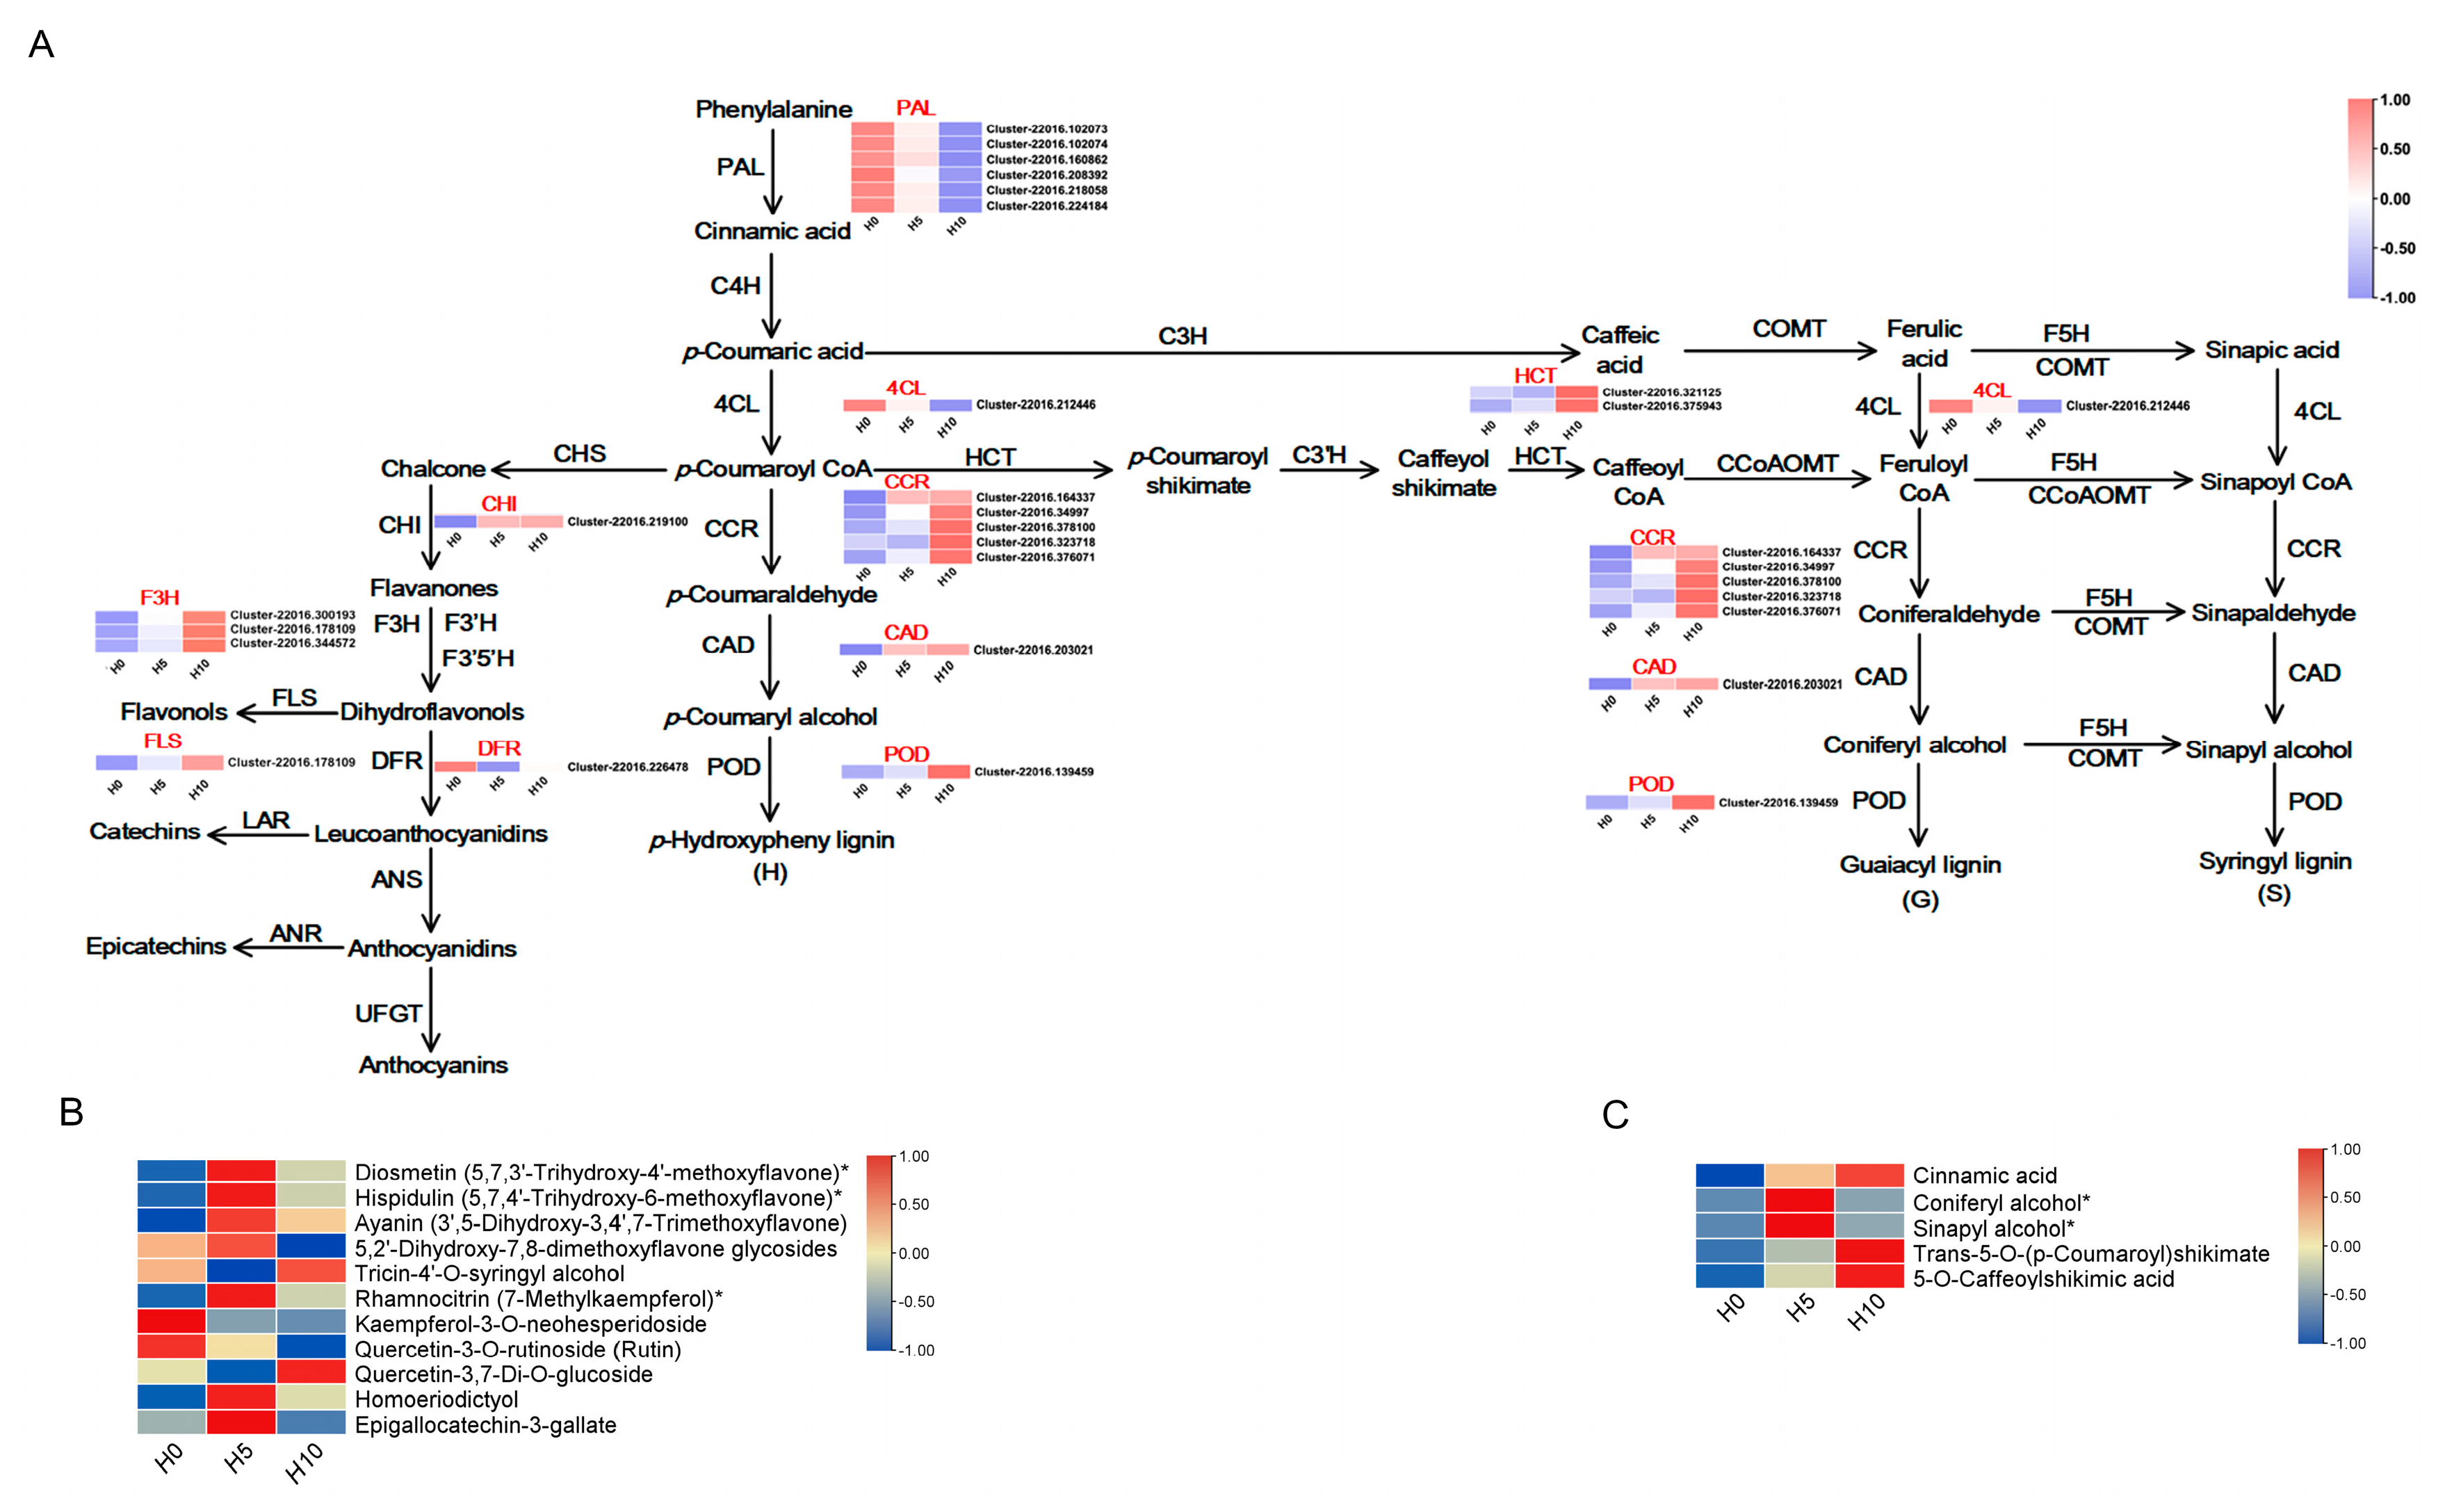
3.4. DEGs and DAMs Related to Lignin and Flavonoid Synthesis

Comprehensive transcriptome and metabolome analyses revealed that the phenylpropanoid biosynthesis pathway is crucial for lignin and flavonoid synthesis during the emergence of green bamboo shoots (Figure 6A–C). The DAMs in the phenylpropanoid biosynthesis pathway, including cinnamic acid, p-coumaroyl shikimic acid, and caffeoyl shikimic acid, exhibited an up-regulation trend during the unearthed stage of green bamboo shoots. The monomers involved in lignin synthesis, coniferyl alcohol and sinapyl alcohol, were significantly up-regulated between H0 and H5 (Table S2, Figure 6C). Additionally, seven flavonoids also significantly up-regulated from H0 to H5 (Table S2, Figure 6B). These up-regulated DAMs were consistent with changes in lignin and flavonoid content.
Moreover, the gene expression profiles related to phenylpropanoid biosynthesis were analyzed (Figure 6A). The results indicated that the expression levels of genes related to CCR (Cluster-22016.164337, Cluster-22016.378100, Cluster-22016.323718) and CAD (Cluster-22016.203021), the key enzymes for phenylpropanoid biosynthesis, were up-regulated with the increase in the height of green bamboo shoots during the unearthed stage. These levels were also positively correlated with lignin and total flavonoid contents. In contrast, the expression levels of PAL (Cluster-22016.160862, Cluster-22016.218058, Cluster-22016.224184), 4CL (Cluster-22016.212446), and POD (Cluster-22016.156759, Cluster-22016.176078, Cluster-22016.182782, Cluster-22016.214130, Cluster-22016.222071) were down-regulated and exhibited a negative correlation with lignin and total flavonoid contents. Additionally, the expression levels of CHI (Cluster-22016.219100) and FLS (Cluster-22016.178109), the key enzymes for flavonoid biosynthesis, were up-regulated and showed a positive correlation with changes in total flavonoid content. These findings indicate that genes related to phenylpropanoid biosynthesis play a crucial role in regulating the synthesis of lignin and flavonoids with the development of green bamboo shoots.
We further did the correlation analysis between the main cell wall components (lignin, cellulose, and hemicellulose), total flavonoids, and the expression of DEGs in the phenylpropanoid biosynthesis pathway. These phenylpropanoid biosynthesis pathway genes including some lignin synthesis genes and flavonoid synthesis genes (i.e., Cluster-22016.160862, Cluster-22016.156759, Cluster-22016.203021, Cluster-22016.164337, Cluster-22016.219100, Cluster-22016.178109) were highly correlated with cell wall metabolism and flavonoid synthesis and were the candidates involved in quality changes of green bamboo shoots in different growth stage.

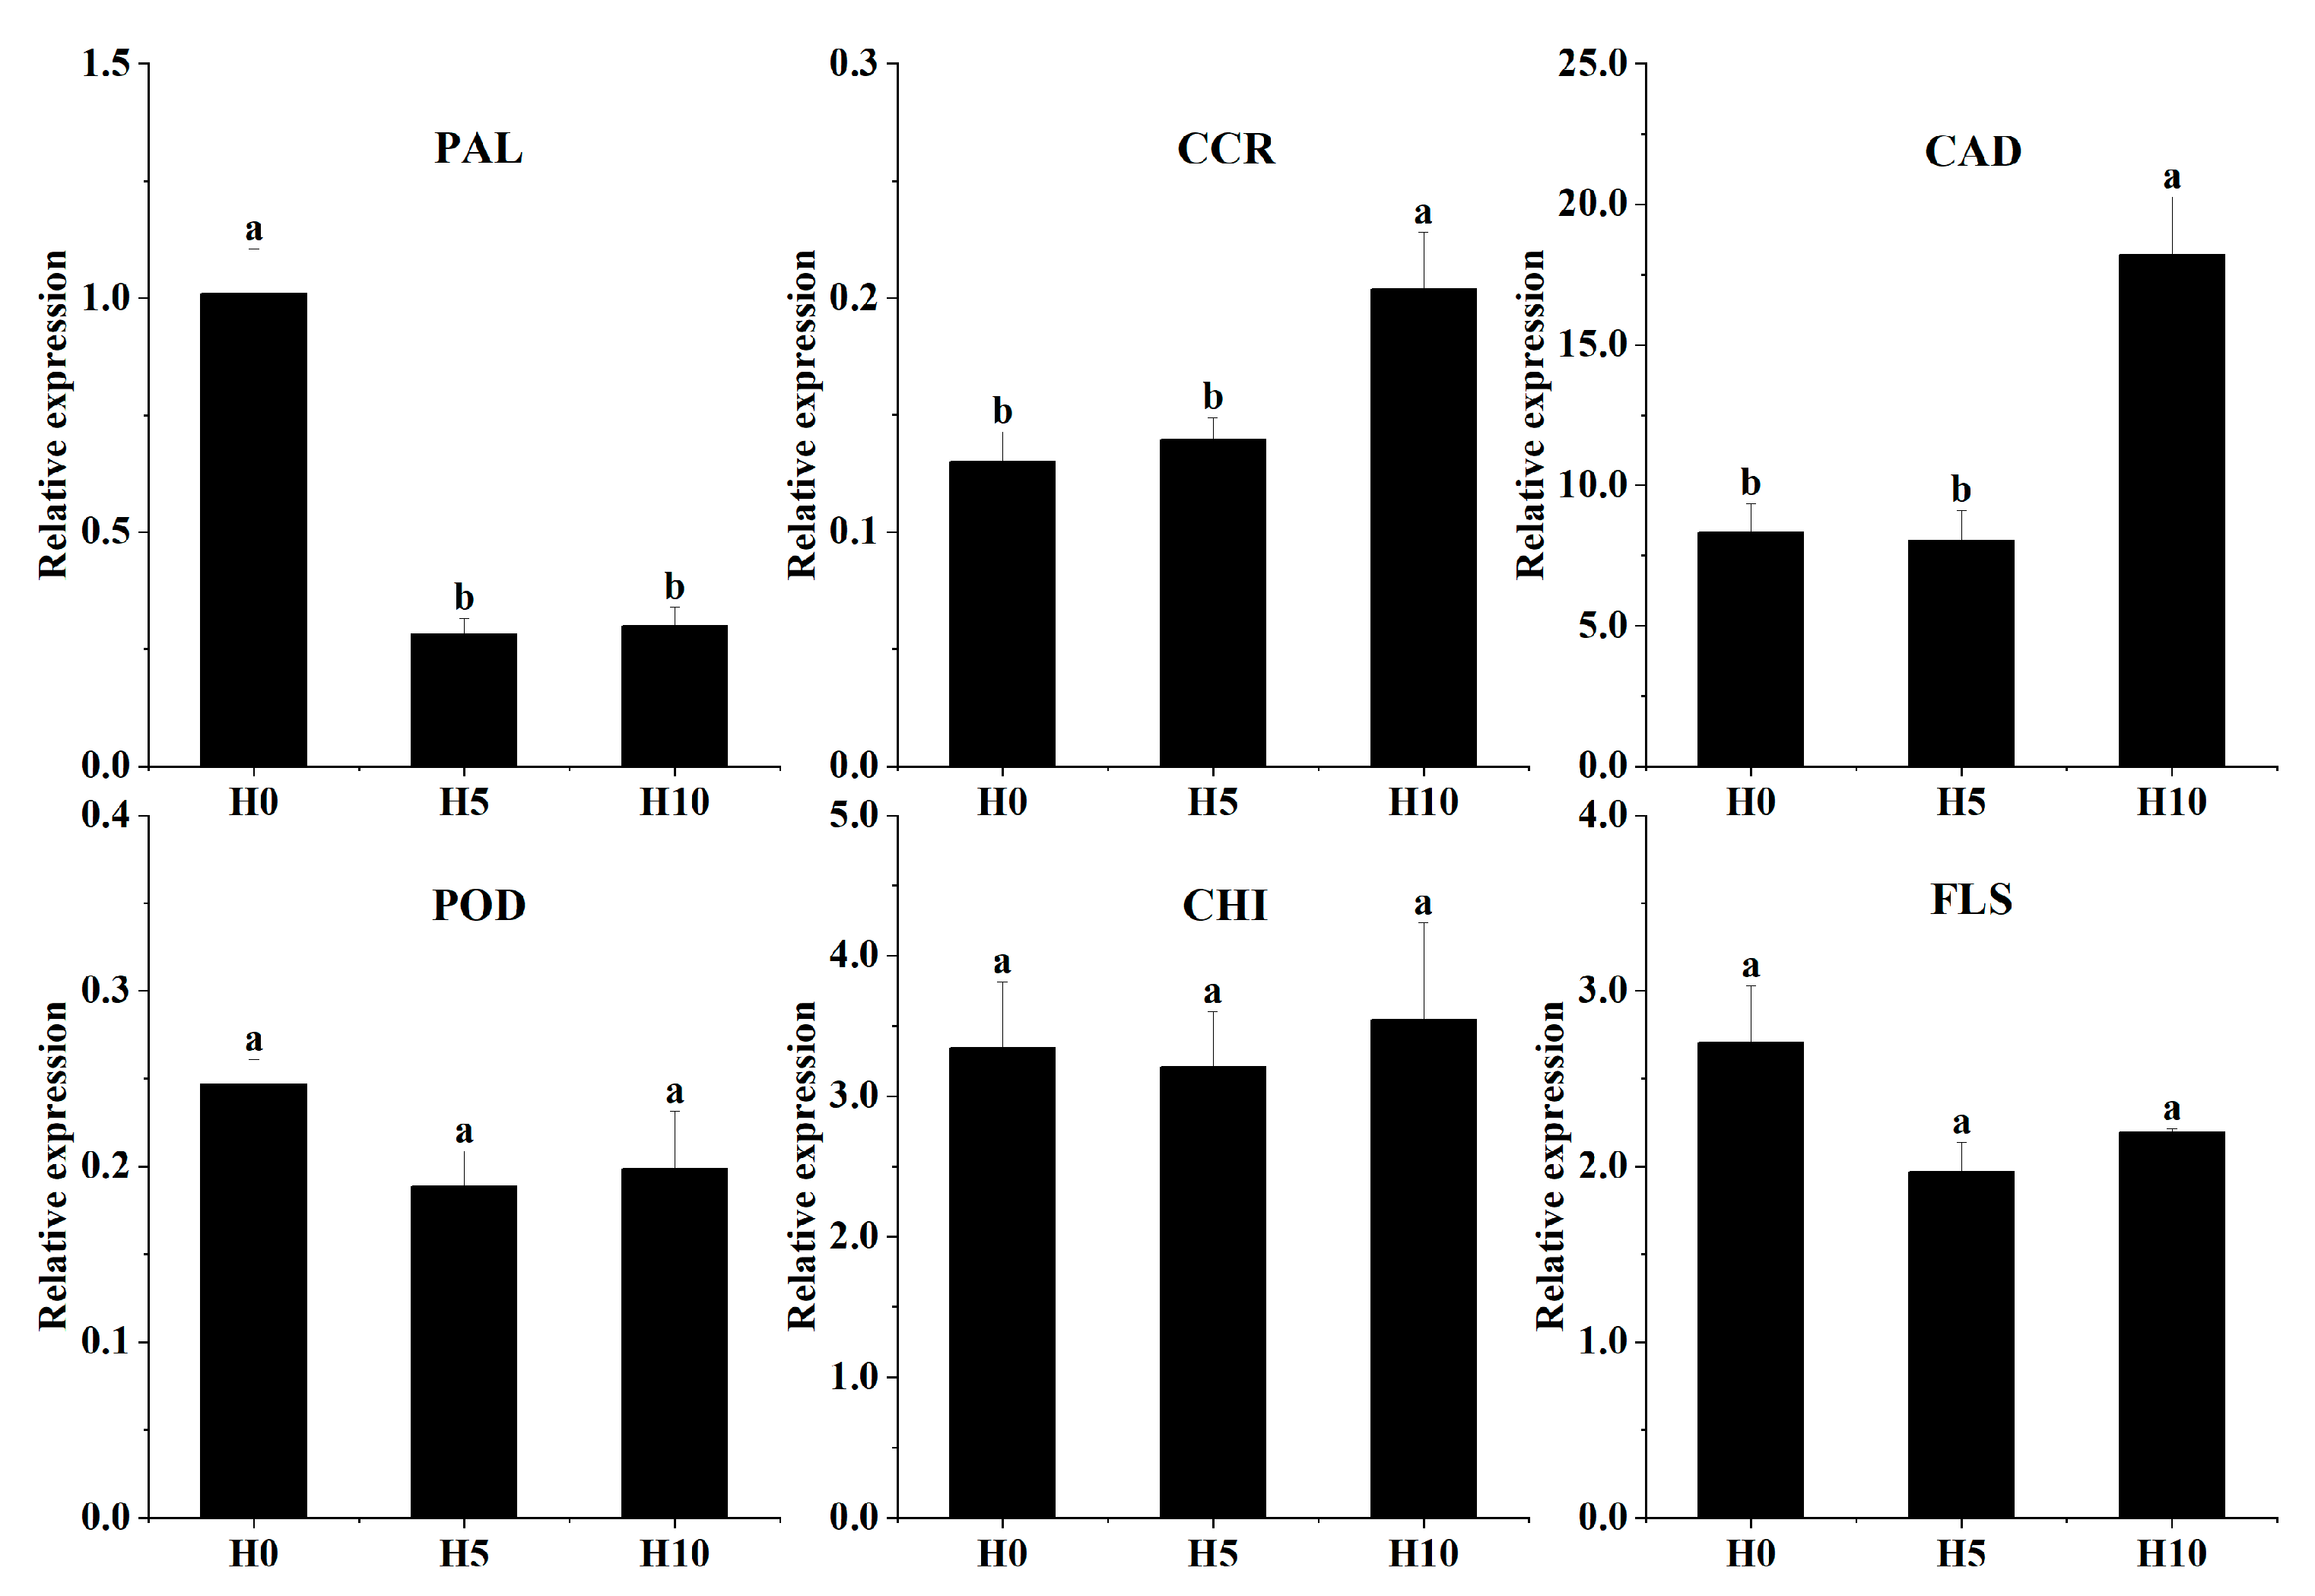
3.5. Validation of Gene Expression in Green Bamboo Shoots via qRT-PCR

The expression patterns of the six selected target genes were analyzed by qRT-PCR to validate the RNA-seq data (Figure 7). PAL (Cluster-22016.160862) expression level was down regulated from H0 to H5 and H10, while those of CAD (Cluster-22016.203021) and CCR (Cluster-22016.164337) were significantly upregulated between H5 and H10. There was a slight increment between H5 and H10 of CHI (Cluster-22016.219100) expression, and a slight decrement between H0 to H5 of POD (Cluster-22016.156759) and FLS (Cluster-22016.178109) expression. Overall, there was a strong correlation between qRT-PCR and transcriptome sequencing data, demonstrating the validity of the DEG analysis and the results of transcriptome sequencing.

4. Discussion

Bamboo shoots are excellent food materials with high nutritional value; however, their palatability and quality change significantly after being unearthed, and their nutrient composition also varies spatiotemporally [5,7,8,26]. Juvenile shoots are usually utilized as popular food items which indicates that their flavor and quality changed dramatically with different development stages [41]. Lignification and the formation of a bitter taste are two typical characteristics as the green bamboo (Bambusa oldhamii) shoots stretched out from the soil surface, often linked to changes in cell wall metabolism and the accumulation of bitter phytonutrients. Previous studies [4,5] also inferred that the biosynthesis of phenylpropanoids might participate in the green bamboo shoot bitter taste transition, which is crucial for lignin and flavonoid synthesis, yet how the related physiological index changed and the metabolism and transcription varied with the development of green bamboo shoots were rarely studied. In the present study, we first investigated the variations of the main cell wall components (i.e., lignin, cellulose, and hemicellulose) and total flavonoid content of green bamboo shoots at different growth stages, then we conducted a more detailed analysis of the transcriptome and metabolome to identify DAMs and DEGs in lignin and flavonoid synthesis pathway and determine target genes involved in the growth stage, ultimately providing the insight into the variations in flavor and quality related to lignin and flavonoid synthesis of green bamboo shoots at different growth stages.
Differences in the composition of substances found in bamboo shoots directly impact their palatability and quality. Lignin, cellulose and hemicellulose, which provide structural support during the growth of bamboo shoots, increase in content, potentially leading to a higher degree of lignification. This increase can enhance roughness and hardness, thereby reducing the quality and edibility of bamboo shoots. Numerous studies have investigated the variations of cell wall components of bamboo shoots, mostly focusing on the postharvest physiological changes of bamboo shoots. Li et al. [12] showed that melatonin treatment was effective in delaying the lignification of bamboo shoots by increasing the activity of antioxidant enzymes; Li et al. [15] conducted morphological, physiological, transcriptomic and microRNA sequencing analyses discovering a rapid decrease in soluble sugars, structural polysaccharides and hydrolyzed tannins, and the increase in lignin in the postharvest bamboo shoots. Considering the spatiotemporal variations and the effect of environmental factors, Liu et al. [7] found that soil temperature influenced the emergence, as well as the nutrient and taste of green bamboo shoots, whereas the metabolome and transcriptome analysis performed by Wang et al. [9] revealed the different metabolite biosynthesis profiles related to the palatability of winter and spring moso bamboo shoots. In our study, three main cell wall components including lignin and structural polysaccharide (i.e., cellulose and hemicellulose) showed an increasing tendency, especially from H0 to H5 (Figure 1), indicating that the components of the cell wall changed dramatically before and after unearthed of green bamboo shoots. This finding is consistent with the results previously described for the three growth stages of moso bamboo shoots [42]. The observed developmental changes might be attributed to several factors, including the genetic foundation, soil temperature and humidity, light environment, and so on [5,7,9]. Totally 5 differentially accumulated secondary metabolites including cinnamic acid, coniferyl alcohol, sinapyl alcohol, trans-5-O-(p-coumaroyl) shikimate, and 5-O-caffeoyl shikimic acid in the biosynthetic pathway of monolignols were identified (Figure 6), which is primarily attributed to the transcriptional up-regulation of the related genes HCT, CCR, CAD, and POD. Those were the main variations associated with the lignification process of green bamboo shoots during different growth stages observed in our study.
Additionally, an increasing trend of total flavonoid content from H0 to H10 was observed (Figure 1). Although flavonoid may boost the antioxidant capacity of bamboo shoots acting as a functional substance for human health [43], it may also be one of the bitter ingredients of bamboo shoots [9,27,44], especially for green bamboo shoots [4,5], so as to influence its edible quality. In our study, in total, 11 differentially accumulated secondary metabolites in the biosynthesis pathway of flavonoids were identified and that might be caused by the activation of some related genes (i.e., CHI, F3H, and FLS). Our study results indicated that during the emergence process of green bamboo shoots, the contents of total flavonoids showed an opposite trend compared with moso bamboo shoots during different growth stages [42], while variations of lignin and cellulose were comparable between the two bamboo species. This interesting phenomenon might indicate a balanced and cooperative regulation mechanism between lignin and flavonoids synthesis.
Plants can activate a vast array of secondary metabolite syntheses to alter their material composition, with these changes varying across different developmental stages. It is well-established that the biosynthetic pathways for flavonoids and lignin originate from the general phenylpropanoid way. Our study demonstrates that during the emergence of green bamboo shoots, the accumulation of intermediate secondary metabolites such as cinnamic acid, p-coumaroyl shikimic, and caffeoyl shikimic acid increased, along with a significant accumulation of lignin precursors like coniferyl alcohol and sinapyl alcohol. The evident upregulation of key lignin biosynthesis enzyme genes, such as CCR and CAD, indicates that the phenylpropanoid biosynthetic pathway regulates lignin synthesis during the development of green bamboo shoots, which affects their palatability. Moreover, during the developmental stage, plants could also enhance the synthesis of flavonoid compounds through the regulation of physiological and biochemical pathways to adapt to environmental changes and maintain normal growth and development. Studies on blueberries and tomatoes have shown that UV-C radiation can regulate the structural and regulatory genes of flavonoids, affecting their synthesis and accumulation, and consequently the sensory characteristics and material composition of the fruit [45,46,47]. This study found that increased accumulation of flavonoid compounds such as diosmetin, hispidulin, and ayanin, correlated with a significant upregulation of key enzymes in the flavonoid biosynthesis pathway, including CHI, FLS, and F3H. It indicated that the phenylpropanoid biosynthetic pathway might regulate flavonoid synthesis in green bamboo shoots during emergence, which might lead to bitter flavor. Moreover, the cooperative regulation of flavonoid and lignin biosynthesis in plants has been reviewed by Zhang et al. [36], elucidating the mechanisms of lignin–flavonoids synthesis in bamboo shoots still needs to open the way for further investigations.
To further elucidate the molecular mechanisms underlying the flavor and quality of green bamboo shoots during different growth stages, further studies should focus more on the lignification and the synthesis of flavonoids and exploring the gene regulatory networks associated with the accumulation of bitter compounds, as well as understanding the impact of abiotic factors (i.e., sunlight and air temperature) on metabolic pathways during the growth stage. This research will contribute to the development of cultivation strategies to improve the quality and market value of green bamboo shoots.

5. Conclusions

This study focused on the variation in quality and palatability of green bamboo (Bambusa oldhamii) shoots at different developmental growth stages. Notably, the lignification and bitterness of green bamboo shoots changed significantly as they grew from underground to unearthed. Metabolome and transcriptome analyses lead to the identification of 149 differentially accumulated metabolites (DAMs) and 2976 differentially expressed genes (DEGs), possibly responsible for the quality variations of bamboo shoots during different growth stages. The phenylpropanoid biosynthesis pathway was revealed as the primary regulatory mechanism for the synthesis of monolignols and flavonoids across different growth stages. Further exploration of gene interactions and the cooperative transcriptional regulation of flavonoid and lignin biosynthesis is necessary to unveil the molecular mechanisms regulating this process. Overall, our findings provide valuable insights into the quality formation of green bamboo shoots at different growth stages, eventually increasing green bamboo market value by optimization of shoot harvest and processing.

Supplementary Materials

The following supporting information can be downloaded at: https://www.mdpi.com/article/10.3390/f15091582/s1. Table S1: Primers for qRT-PCR; Table S2: Differentially accumulated metabolites among H0, H5 and H10; Table S3: Differentially expression genes among H0, H5 and H10.

Author Contributions

Conceptualization, Y.H. and K.P.; methodology, X.C.; data analysis, Y.H., X.C. and K.P.; investigation, Y.H., K.P., W.S. and Y.Y.; writing—original draft, Y.H. and K.P.; writing—review and editing, X.C.; visualization, K.P. and X.C.; supervision, Y.Y.; funding acquisition, Y.Y. All authors have read and agreed to the published version of the manuscript.

Funding

This research was funded by the Developmental Research Found for Zhejiang A&F University (2021LFR019) and the Cooperation Project between Zhejiang Province and the Chinese Academy of Forestry (2020SY07).

Data Availability Statement

The data presented in this study are available on request from the corresponding author.

Acknowledgments

We would like to express our gratitude to our team members, Fangyan Bao and Rui Xiong, for their assistance in collecting green bamboo shoots in the field, as well as to METWARE Biotechnology Co., Ltd. (Wuhan, China) for their contributions to data analysis.

Conflicts of Interest

The authors declare no conflict of interest.

References

  1. Singhal, P.; Bal, L.M.; Satya, S.; Sudhakar, P.; Naik, S. Bamboo shoots: A novel source of nutrition and medicine. Crit. Rev. Food Sci. Nutr. 2013, 53, 517–534. [Google Scholar] [CrossRef] [PubMed]
  2. Bajwa, H.K.; Santosh, O.; Koul, A.; Bisht, M.; Nirmala, C. Quantitative determination of macroelement and microelement content of fresh and processed bamboo shoots by wavelength dispersive X-ray fluorescence spectrometry. X-ray Spectrom. 2019, 48, 637–643. [Google Scholar] [CrossRef]
  3. Wang, Y.; Chen, J.; Wang, D.; Ye, F.; He, Y.; Hu, Z.; Zhao, G. A systematic review on the composition, storage, processing of bamboo shoots: Focusing the nutritional and functional benefits. J. Funct. Foods 2020, 71, 104015. [Google Scholar] [CrossRef]
  4. Jiao, Y. Transcriptomic and metabolomic analyses reveal the flavor of bitterness in the tip shoots of Bambusa oldhamii Munro. Sci. Rep. 2023, 13, 14853. [Google Scholar] [CrossRef] [PubMed]
  5. Yu, L.; Hua, K.; Chen, C.; Yue, J.; Yuan, J. Metabolomic and transcriptomic analysis of bitter compounds in Dendrocalamopsis oldhamii shoots. J. Food Compos. Anal. 2024, 130, 106140. [Google Scholar] [CrossRef]
  6. Tong, L.; Zhang, L.; Li, B.; Geng, Y.; Wang, L.; Chen, L. Influence of soil-covered cultivation on quality and palatability of Dendrocalamopsis oldhami shoot. Acta Agric. Univ. Jiangxiensis 2018, 40, 487–493. [Google Scholar]
  7. Liu, K.; Lin, C.; Lin, T.; Tsao, S.; Lo, H. Growth and shoot emergence of green bamboo (Bambusa oldhamii Munro) under different temperatures. In Proceedings of the XXVII International Horticultural Congress-IHC2006: International Symposium on Asian Plants with Unique Horticultural 769, Seoul, Republic of Korea, 13 August 2006; pp. 83–90. [Google Scholar]
  8. Shi, J.; Zhang, C.; Chen, S.; Gu, R.; Guo, Z.; Ye, H.; Sun, P.; Jiang, Z. Temporal variation of appearance, nutrition and eating quality of Phyllostachys prominens shoots after unearthed. For. Res. 2019, 32, 137–143. [Google Scholar] [CrossRef]
  9. Wang, X.; Yang, L.; Geng, X.; Shi, W.; Chen, Y.; Lu, C. Integrative analysis of metabolome and transcriptome reveals the different metabolite biosynthesis profiles related to palatability in winter and spring shoot in moso bamboo. Plant Physiol. Biochem. 2023, 202, 107973. [Google Scholar] [CrossRef]
  10. Bal, L.M.; Singhal, P.; Satya, S.; Naik, S.; Kar, A. Bamboo shoot preservation for enhancing its business potential and local economy: A review. Crit. Rev. Food Sci. Nutr. 2012, 52, 804–814. [Google Scholar] [CrossRef]
  11. Luo, Z.; Feng, S.; Pang, J.; Mao, L.; Shou, H.; Xie, J. Effect of heat treatment on lignification of postharvest bamboo shoots (Phyllostachys praecox f. prevernalis.). Food Chem. 2012, 135, 2182–2187. [Google Scholar] [CrossRef]
  12. Li, C.; Suo, J.; Xuan, L.; Ding, M.; Zhang, H.; Song, L.; Ying, Y. Bamboo shoot-lignification delay by melatonin during low temperature storage. Postharvest Biol. Technol. 2019, 156, 110933. [Google Scholar] [CrossRef]
  13. Zhang, Z.; Li, C.; Zhang, H.; Ying, Y.; Hu, Y.; Song, L. Comparative analysis of the lignification process of two bamboo shoots stored at room temperature. Plants 2020, 9, 1399. [Google Scholar] [CrossRef] [PubMed]
  14. Hou, D.; Lu, H.; Zhao, Z.; Pei, J.; Yang, H.; Wu, A.; Yu, X.; Lin, X. Integrative transcriptomic and metabolomic data provide insights into gene networks associated with lignification in postharvest Lei bamboo shoots under low temperature. Food Chem. 2022, 368, 130822. [Google Scholar] [CrossRef] [PubMed]
  15. Li, Z.; Xu, X.; Yang, K.; Zhu, C.; Liu, Y.; Gao, Z. Multifaceted analyses reveal carbohydrate metabolism mainly affecting the quality of postharvest bamboo shoots. Front. Plant Sci. 2022, 13, 1021161. [Google Scholar] [CrossRef] [PubMed]
  16. Mack, C.; Wefers, D.; Schuster, P.; Weinert, C.H.; Egert, B.; Bliedung, S.; Trierweiler, B.; Muhle-Goll, C.; Bunzel, M.; Luy, B. Untargeted multi-platform analysis of the metabolome and the non-starch polysaccharides of kiwifruit during postharvest ripening. Postharvest Biol. Technol. 2017, 125, 65–76. [Google Scholar] [CrossRef]
  17. Zhu, Q.; Zhang, K.; Chen, W.; Li, X.; Zhu, X. Transcriptomic and metabolomic analyses reveal key factors regulating chilling stress-induced softening disorder in papaya fruit. Postharvest Biol. Technol. 2023, 205, 112534. [Google Scholar] [CrossRef]
  18. Liu, J.; Wang, W.; Zhang, J.; Ge, H.; Li, S.; Li, X.; Yin, X.; Grierson, D.; Chen, K. EjMYB8 transcriptionally regulates flesh lignification in loquat fruit. PLoS ONE 2016, 11, e0154399. [Google Scholar] [CrossRef]
  19. Zeng, J.K.; Li, X.; Zhang, J.; Ge, H.; Yin, X.R.; Chen, K.S. Regulation of loquat fruit low temperature response and lignification involves interaction of heat shock factors and genes associated with lignin biosynthesis. Plant Cell Environ. 2016, 39, 1780–1789. [Google Scholar] [CrossRef]
  20. Huang, W.; Zhu, N.; Zhu, C.; Wu, D.; Chen, K. Morphology and cell wall composition changes in lignified cells from loquat fruit during postharvest storage. Postharvest Biol. Technol. 2019, 157, 110975. [Google Scholar] [CrossRef]
  21. Zhu, N.; Zhao, C.; Wei, Y.; Sun, C.; Wu, D.; Chen, K. Biosynthetic labeling with 3-O-propargylcaffeyl alcohol reveals in vivo cell-specific patterned lignification in loquat fruits during development and postharvest storage. Hortic. Res. 2021, 8, 61. [Google Scholar] [CrossRef]
  22. Li, C.; Xuan, L.; He, Y.; Wang, J.; Zhang, H.; Ying, Y.; Wu, A.; Bacic, A.; Zeng, W.; Song, L. Molecular Mechanism of Xylogenesis in Moso Bamboo (Phyllostachys edulis) Shoots during Cold Storage. Polymers 2018, 11, 38. [Google Scholar] [CrossRef]
  23. Boonsiriwit, A.; Lee, M.; Kim, M.; Itkor, P.; Lee, Y.S. Exogenous melatonin reduces lignification and retains quality of green asparagus (Asparagus officinalis L.). Foods 2021, 10, 2111. [Google Scholar] [CrossRef] [PubMed]
  24. Schäfer, J.; Wagner, S.; Trierweiler, B.; Bunzel, M. Characterization of cell wall components and their modifications during postharvest storage of Asparagus officinalis L.: Storage-related changes in dietary fiber composition. J. Agric. Food Chem. 2016, 64, 478–486. [Google Scholar] [CrossRef] [PubMed]
  25. Kumar, M.; Campbell, L.; Turner, S. Secondary cell walls: Biosynthesis and manipulation. J. Exp. Bot. 2016, 67, 515–531. [Google Scholar] [CrossRef] [PubMed]
  26. Deng, Y.; Lu, S. Biosynthesis and regulation of phenylpropanoids in plants. Crit. Rev. Plant Sci. 2017, 36, 257–290. [Google Scholar] [CrossRef]
  27. Gao, Q.; Jiang, H.; Tang, F.; Cao, H.; Wu, X.; Qi, F.; Sun, J.; Yang, J. Evaluation of the bitter components of bamboo shoots using a metabolomics approach. Food Funct. 2019, 10, 90–98. [Google Scholar] [CrossRef]
  28. Zhang, Z.; Ding, X.; Cui, F.; Cai, H. Impact of avoiding light on bitterness and astringency, tannin content, morphology and distribution of Dendrocalamus latiflorus. For. Res. 2016, 29, 770–777. [Google Scholar]
  29. Drewnowski, A.; Gomez-Carneros, C. Bitter taste, phytonutrients, and the consumer: A review. Am. J. Clin. Nutr. 2000, 72, 1424–1435. [Google Scholar] [CrossRef]
  30. Ververidis, F.; Trantas, E.; Douglas, C.; Vollmer, G.; Kretzschmar, G.; Panopoulos, N. Biotechnology of flavonoids and other phenylpropanoid-derived natural products. Part I: Chemical diversity, impacts on plant biology and human health. Biotechnol. J. Healthc. Nutr. Technol. 2007, 2, 1214–1234. [Google Scholar] [CrossRef]
  31. Chen, M.; Guo, L.; Ramakrishnan, M.; Fei, Z.; Vinod, K.K.; Ding, Y.; Jiao, C.; Gao, Z.; Zha, R.; Wang, C.; et al. Rapid growth of Moso bamboo (Phyllostachys edulis): Cellular roadmaps, transcriptome dynamics, and environmental factors. Plant Cell 2022, 34, 3577–3610. [Google Scholar] [CrossRef]
  32. Zhao, C.; Wang, Z.; Liao, Z.; Liu, X.; Li, Y.; Zhou, C.; Sun, C.; Wang, Y.; Cao, J.; Sun, C. Integrated metabolomic–transcriptomic analyses of flavonoid accumulation in citrus fruit under exogenous melatonin treatment. Int. J. Mol. Sci. 2024, 25, 6632. [Google Scholar] [CrossRef] [PubMed]
  33. Matsui, K.; Walker, A.R. Biosynthesis and regulation of flavonoids in buckwheat. Breed. Sci. 2020, 70, 74–84. [Google Scholar] [CrossRef] [PubMed]
  34. Wang, M.; Qiu, X.; Pan, X.; Li, C. Transcriptional factor-mediated regulation of active component biosynthesis in medicinal plants. Curr. Pharm. Biotechnol. 2021, 22, 848–866. [Google Scholar] [CrossRef]
  35. Yan, Q.; Zhang, G.; Zhang, X.; Huang, L. A review of transcriptomics and metabolomics in plant quality and environmental response: From bibliometric analysis to science mapping and future trends. Metabolites 2024, 14, 272. [Google Scholar] [CrossRef] [PubMed]
  36. Zhang, S.; Yang, J.; Li, H.; Chiang, V.L.; Fu, Y. Cooperative regulation of flavonoid and lignin biosynthesis in plants. Crit. Rev. Plant Sci. 2021, 40, 109–126. [Google Scholar] [CrossRef]
  37. Wang, J. The Study of Expression and Analysis of Different Expression Genes in Moso Bamboo Shoot Transcriptome Associated with the Lignification. Master’s Thesis, Nanjing Agriculture University, Nanjing, China, 2016. [Google Scholar]
  38. Miao, N.; Yun, C.; Han, S.; Shi, Y.; Gao, Y.; Wu, S.; Zhao, Z.; Wang, H.; Wang, W. Postharvest UV-A radiation affects flavonoid content, composition, and bioactivity of Scutellaria baicalensis root. Postharvest Biol. Technol. 2022, 189, 111933. [Google Scholar] [CrossRef]
  39. Ashburner, M.; Ball, C.A.; Blake, J.A.; Botstein, D.; Butler, H.; Cherry, J.M.; Davis, A.P.; Dolinski, K.; Dwight, S.S.; Eppig, J.T. Gene ontology: Tool for the unification of biology. Nat. Genet. 2000, 25, 25–29. [Google Scholar] [CrossRef]
  40. Kanehisa, M.; Goto, S.; Kawashima, S.; Okuno, Y.; Hattori, M. The KEGG resource for deciphering the genome. Nucleic Acids Res. 2004, 32, D277–D280. [Google Scholar] [CrossRef]
  41. Nongdam, P.; Tikendra, L. The nutritional facts of bamboo shoots and their usage as important traditional foods of northeast India. Int. Sch. Res. Not. 2014, 2014, 679073. [Google Scholar] [CrossRef]
  42. Guo, M.; He, Y.; Pan, K.; Bao, F.; Ying, Y. Analysis of differential metabolites of Phyllostachys edulis shoots at different growth stages by ultra-high performance liquid chromatography-tandem mass spectrometry. Food Sci. 2023, 44, 283–291. [Google Scholar]
  43. Hostetler, G.L.; Ralston, R.A.; Schwartz, S.J. Flavones: Food sources, bioavailability, metabolism, and bioactivity. Adv. Nutr. 2017, 8, 423–435. [Google Scholar] [CrossRef] [PubMed]
  44. Choudhury, D.; Sahu, J.K.; Sharma, G. Biochemistry of bitterness in bamboo shoots. Assam Univ. J. Sci. Technol. 2010, 6, 105–111. [Google Scholar]
  45. Yang, J.; Li, B.; Shi, W.; Gong, Z.; Chen, L.; Hou, Z. Transcriptional activation of anthocyanin biosynthesis in developing fruit of blueberries (Vaccinium corymbosum L.) by preharvest and postharvest UV irradiation. J. Agric. Food Chem. 2018, 66, 10931–10942. [Google Scholar] [CrossRef] [PubMed]
  46. Yang, J.; Shi, W.; Li, B.; Bai, Y.; Hou, Z. Preharvest and postharvest UV radiation affected flavonoid metabolism and antioxidant capacity differently in developing blueberries (Vaccinium corymbosum L.). Food Chem. 2019, 301, 125248. [Google Scholar] [CrossRef]
  47. Zhang, Q.; Yang, W.; Liu, J.; Liu, H.; Lv, Z.; Zhang, C.; Chen, D.; Jiao, Z. Postharvest UV-C irradiation increased the flavonoids and anthocyanins accumulation, phenylpropanoid pathway gene expression, and antioxidant activity in sweet cherries (Prunus avium L.). Postharvest Biol. Technol. 2021, 175, 111490. [Google Scholar] [CrossRef]
Figure 1. Changes of green bamboo shoots at different growth stages. (A) Morphological changes of shoots at H0, H5, and H10 growth stages. H0, H5, and H10 represent the unearthed height of shoots 0 cm, 5 cm, and 10 cm, respectively. (B(ad)) represent lignin content, cellulose content, hemicellulose content, and total flavonoid content, respectively. Bars represent means ± SD and lowercase letters indicate significant differences among different growth stages.
Forests 15 01582 g001
Figure 2. Qualitative and quantitative analysis of green bamboo shoots metabolome at three growth stages. (A) OPLS-DA model of metabolome data, (B) Venn diagram of differentially accumulated metabolites (DAMs) at different growth stages, (C) the number of DAMs between H0, H5 and H10, (D) the classification of DAMs, (E) K-means cluster analysis of DAMs.
Forests 15 01582 g002
Figure 3. KEGG pathway enrichment analysis of green bamboo shoots at different growth stages. (AC) represented top 20 most enriched pathways of DAMs in H0_vs_H5, H5_vs_H10, and H0_vs_H10, respectively. Rich Factor represents the ratio of the number of differentially accumulated metabolites (DAMs) in a specific metabolic pathway to the total number of DAMs analyzed. Coloring indicates p-value with higher in blue and lower in red, and the lower p-value, the more significantly enriched. Point size indicates the number of DAMs.
Forests 15 01582 g003
Figure 4. Qualitative and quantitative analysis of green bamboo shoots transcriptome at three growth stages. (A) Principal component analysis (PCA) of transcriptomic data, (B) Venn diagram of differentially expression genes (DEGs) at different growth stage, (C) the number of DEGs between H0, H5 and H10, (D) Kmeans cluster analysis of DEGs.
Forests 15 01582 g004
Figure 5. KEGG pathway enrichment analysis and GO enrichment analysis of green bamboo shoots at different growth stages. (AC) represented top 20 most enriched pathways of the shared DEGs in H0_vs_H5, H5_vs_H10, and H0_vs_H10, respectively; (DF) represented top 50 GO enrichment of DEGs in H0_vs_H5, H5_vs_H10, and H0_vs_H10, respectively. Rich Factor represents the ratio of the number of differentially expressed genes (DEGs) in a specific category to the total number of DEGs analyzed. Coloring indicates p-value with higher in blue and lower in red, and the lower p-value, the more significantly enriched. Point size indicates the number of DEGs.
Forests 15 01582 g005
Figure 6. Expression profiles of DAMs and DEGs involved in phenylpropanoid and flavonoid biosynthesis. Abbreviations: PAL: phenylalanine ammonia-lyase; C4H: cinnamate 4-hydroxylase; 4CL: 4-coumarate: CoA ligase; CCR: (hydroxy) cinnamoyl CoA reductase; CAD: (hydroxy) cinnamyl alcohol dehydrogenase; POD: peroxidase; CHS: chalcone synthase; CHI: chalcone isomerase; F3H: flavanone 3-hydroxylase; F3′H: flavonoid 3′-hydroxylase; F3′5′H: flavonoid 3′5′-hydroxylase; FLS: flavonol synthase; DFR: dihydroflavonol 4-reductase; LAR: leucoanthocyanidin reductase; ANS: anthocyanidin synthase; ANR: anthocyanidin reductase; UFGT: UDP flavonoid glucosyl transferase; HCT: p-hydroxycinnamoyl-CoA: quinate shikimate p-hydroxycinnamoyl transferase; C3H: p-coumarate 3-hydroxylase; C3′H: p-coumaroyl quinate/shikimate 3′-hydroxylase; COMT: caffeic acid (5-hydroxy-coniferaldehyde) O-methyltransferase; CCoAOMT: caffeoyl CoA O-methyltransferase; F5H: ferulate 5-hydroxylase.
Forests 15 01582 g006
Figure 7. The qRT-PCR validations of the DEGs in lignin and flavonoid biosynthesis. Abbreviations: PAL: phenylalanine ammonia-lyase; CCR: (hydroxy) cinnamoyl CoA reductase; CAD: (hydroxy) cinnamyl alcohol dehydrogenase; POD: peroxidase; CHI: chalcone isomerase; FLS: flavonol synthase. Bars represent means ± SD and lowercase letters indicate significant differences among different growth stages.
Forests 15 01582 g007
Disclaimer/Publisher’s Note: The statements, opinions and data contained in all publications are solely those of the individual author(s) and contributor(s) and not of MDPI and/or the editor(s). MDPI and/or the editor(s) disclaim responsibility for any injury to people or property resulting from any ideas, methods, instructions or products referred to in the content.

