Article

Impact of Nitrogen Fertilizer Application on Soil Organic Carbon and Its Active Fractions in Moso Bamboo Forests

1
International Center for Bamboo and Rattan, Key Laboratory of National Forestry and Grassland Administration, Beijing 100102, China
2
Sanya Research Base of International Center for Bamboo and Rattan, Sanya 572022, China
*
Author to whom correspondence should be addressed.
Forests 2024, 15(9), 1483; https://doi.org/10.3390/f15091483 (registering DOI)
Submission received: 17 June 2024 / Revised: 14 August 2024 / Accepted: 16 August 2024 / Published: 24 August 2024

Abstract

:
Soil organic carbon (SOC) is a crucial indicator of soil quality and fertility. However, excessive nitrogen (N) application, while increasing Moso bamboo yield, may reduce SOC content, potentially leading to soil quality issues. The impact of N on SOC and its active fraction in Moso bamboo forests remains underexplored. Investigating these effects will elucidate the causes of soil quality decline and inform effective N management strategies. Four N application gradients were set: no nitrogen (0 kg·hm−2·yr−1, N0), low nitrogen (242 kg·hm−2·yr−1, N1), medium nitrogen (484 kg·hm−2·yr−1, N2), and high nitrogen (726 kg·hm−2·yr−1, N3), with no fertilizer application as the control (CK). We analyzed the changes in SOC, active organic carbon components, and the Carbon Pool Management Index (CPMI) under different N treatments. The results showed that SOC and its active organic carbon components in the 0~10 cm soil layer were more susceptible to N treatments. The N0 treatment significantly increased microbial biomass carbon (MBC) content but had no significant effect on SOC, particulate organic carbon (POC), dissolved organic carbon (DOC), and readily oxidizable organic carbon (ROC) contents. The N1, N2, and N3 treatments reduced SOC content by 29.36%, 21.85%, and 8.67%, respectively. Except for POC, N1,N2 and N3 treatments reduced MBC, DOC, and ROC contents by 46.29% to 71.69%, 13.98% to 40.4%, and 18.64% to 48.55%, respectively. The MBC/SOC ratio can reflect the turnover rate of SOC, and N treatments lowered the MBC/SOC ratio, with N1 < N2 < N3, indicating the slowest SOC turnover under the N1 treatment. Changes in the Carbon Pool Management Index (CPMI) illustrate the impact of N treatments on soil quality and SOC sequestration capacity. The N1 treatment increased the CPMI, indicating an improvement in soil quality and SOC sequestration capacity. The comprehensive evaluation index of carbon sequestration capacity showed N3 (−0.69) < N0 (−0.13) < CK (−0.05) < N2 (0.24) < N1 (0.63), with the highest carbon sequestration capacity under the N1 treatment and a gradual decrease with increasing N fertilizer concentration. In summary, although the N1 treatment reduced the SOC content, it increased the soil CPMI and decreased the SOC turnover rate, benefiting soil quality and SOC sequestration capacity. Therefore, the reasonable control of N fertilizer application is key to improving soil quality and organic carbon storage in Moso bamboo forests.

1. Introduction

China boasts abundant bamboo resources, making bamboo forests a vital part of its forest assets [1]. These forests play a key role in ecological protection and hold significant economic, cultural, and recreational value [2]. Moso bamboo (Phyllostachys edulis) is particularly important for its high timber and shoot value. According to the “2021 China Forestry and Grassland Ecology Comprehensive Monitoring and Evaluation Report,” China’s bamboo forest area reached 756.27 × 10⁴ hm2 in 2021, with Moso bamboo forests covering 527.76 × 10⁴ hm2 (accounting for 69.78%) [3]. Moso bamboo growth requires many nutrients. In bamboo forest management, many appropriately aged trees are typically harvested simultaneously [4,5], and this practice results in the nutrient return in these forests generally being lower than the nutrient output [6,7].
N plays a crucial role in various growth stages of Moso bamboo, and proper N fertilization is essential for ensuring the yield and long-term management of these forests [8,9]. However, excessive N application, while boosting yield and economic benefits, can lead to soil quality decline, including acidification, accelerated organic carbon decomposition, and reduced microbial activity [10,11,12,13]. SOC is a key indicator of soil quality and is crucial for soil structure formation, fertility improvement, buffering capacity, and nutrient supply [14]. Thus, exploring the effects of N fertilizer on the SOC in Moso bamboo forests is essential in assessing N’s direct and potential impacts on soil quality.
N application affects the accumulation and turnover of SOC pools [15,16,17]. Some studies have found that N fertilizer inputs increase the SOC content, benefiting soil fertility [18,19]. Increased carbon input due to N application is one of the reasons for this rise in the SOC content [20]. N application promotes plant growth, increasing the input of aboveground and belowground litter, which benefits SOC accumulation [21,22]. Additionally, N application inhibits the soil microbial decomposition of SOC, which is another important factor that contributes to SOC accumulation [23]. N application causes soil acidification, which inhibits microbial activity, leading to the suppressed decomposition of plant residues and SOC [24]. This reduced decomposition increases SOC content [25,26]. N application also reduces microbial biomass and depolymerizes organic carbon molecules, decreasing carbon input from microbial sources [27], and it increases the mineralization and leaching of the SOC, ultimately reducing SOC content. A meta-analysis of the effects of N application on SOC pools indicated that N application has no significant impact on SOC [28]. This phenomenon can be attributed to the combined effects of reduced carbon input from plant roots and the inhibited microbial decomposition of organic carbon. Additionally, the impact of N application on SOC is influenced by soil depth [29]. Compared with deeper soils, surface soils are more susceptible to N application, which tends to increase SOC content in the surface layer (organic horizon) while having a lesser effect on deeper soils (mineral horizon) [30]. Some researchers have also found that while N application increases organic horizon SOC content, it can reduce mineral horizon SOC content [31]. Different N application methods can influence microbial responses to exogenous N in surface soils, thereby affecting SOC content [32,33]. Currently, research on the effects of N application on SOC primarily focuses on broadleaf forests, grassland ecosystems, and agricultural systems, with relatively few studies on Moso bamboo forests. Thus, this study provides theoretical support for investigating the impact of N application on SOC pools in Moso bamboo forests.
SOC is a complex aggregate, and subdividing it into different components can help us better understand the effects of N application on the SOC. Based on its ease of decomposition, SOC can be categorized into three types of carbon pools: active, chronic, and inert [34,35]. The active organic carbon pool is highly sensitive to soil management practices and is often considered an important indicator for assessing changes in soil fertility and soil quality [36]. Generally, the active organic carbon pool includes particulate organic carbon (POC), microbial biomass carbon (MBC), dissolved organic carbon (DOC), and readily oxidizable carbon (ROC) [37]. Numerous studies have shown that N application increases POC content by enhancing litter input [38,39,40]. Meta-analyses of the effects of N on microbial growth indicate that N application inhibits microbial growth, reducing the MBC content [41,42,43]. In surface soils, DOC content is more susceptible to N application, generally increasing with N input. However, some studies have found that low N treatment increases DOC content, whereas high N input decreases it [44,45]. The impact of N input on the ROC can be positive, negative, or neutral [46,47,48]. Blair et al. proposed using the CPMI to evaluate the effects of soil management practices on soil quality and organic carbon sequestration capacity [49]. Gai et al. used the CPMI to assess the impact of chicken farming on soil quality under Lei bamboo (Phyllostachys praecox) [50], and Guo et al. used the CPMI to evaluate soil quality in Moso bamboo plantations [51]. These studies indicate that the CPMI is a viable tool for assessing soil quality in bamboo ecosystems.
Currently, research on the effects of nutrient addition on the SOC and its active components in bamboo forests primarily focuses on adding compounds and organic fertilizers [52,53], with limited evaluations of soil quality post-fertilization. In previous studies, we focused on the physical fractions of the SOC to analyze the changes in the SOC, POC, and mineral-associated organic carbon (MAOC) within the 0~10 cm soil layer of Moso bamboo forests following nitrogen application and explored the main environmental factors influencing POC and MAOC content [54]. However, there has been a lack of research on SOC and its active components in the root zone of Moso bamboo (0~30 cm soil layer) and a comprehensive assessment of soil quality and carbon sequestration capacity under different nitrogen treatments within this depth. Therefore, it is crucial to investigate SOC and its active components across different soil layers after nitrogen application. This research will not only enhance our understanding of how nitrogen affects soil quality but also provide a theoretical foundation for the scientific management of nutrients and the long-term productivity of Moso bamboo forests. This study focuses on Moso bamboo forests, setting four different N application gradients to analyze changes in SOC and its active components in the 0~10 cm, 10~20 cm, and 20~30 cm soil layers under different N application treatments. The CPMI and principal component analysis (PCA) comprehensively evaluate soil quality and organic carbon sequestration capacity post-N application. Our study has two objectives: (1) to explore the effects of N application on SOC and its active components in Moso bamboo forests and (2) to comprehensively evaluate the soil quality and organic carbon sequestration capacity of Moso bamboo forests after N application.

2. Materials and Methods

2.1. Study Site

This study was conducted at the Hushi Forest Farm in Hushi Town, Chishui City, northern Guizhou Province, China (28°23′–28°30′ N, 105°54′–106°06′ E). This area has a humid subtropical monsoon climate, with an average annual temperature of approximately 18.1 °C and an average annual precipitation of around 1195.7 mm. The study area features mid-subtropical hilly terrain, with soils classified as purple yellow sandy loam.
The study area features hilly terrain in the middle mountains, and the soils in the sample sites are predominantly mountain red and yellow earth. The average pH of the soil in the test site is 4.75, with a SOC content of 16.94 g/kg, total carbon content of 19.68 g/kg, total N content of 1.25 g/kg, and total phosphorus content of 0.39 g/kg [54].
In August 2021, we selected a Moso bamboo forest for the experiment, ensuring that the management practices, stand structure, and site conditions were consistent and free from pests and diseases. We established 15 standard plots, each measuring 15 × 15 m2, with 5-m buffer zones between adjacent plots. The research team determined the nutrient requirements necessary for optimal Moso bamboo growth and recommended a baseline nitrogen fertilizer application rate of 242 kg·hm−2·yr−1, using urea (46.4% N) [55]. To assess the impact of excessive nitrogen application, as well as nitrogen residue and loss during production, this study implemented four levels of nitrogen application: no nitrogen fertilizer (no nitrogen, N0: 0 kg·hm−2·yr−1), baseline nitrogen application (low nitrogen, N1: 242 kg·hm−2·yr−1), double the baseline amount (medium nitrogen, N2: 484 kg·hm−2·yr−1), and triple the baseline amount (high nitrogen, N3: 726 kg·hm−2·yr−1). The no-fertilizer treatment served as the control. The experiment used a randomized block design, with each treatment replicated three times.
The N application experiment was conducted in early October 2021, during the spring bamboo shoot development period. Phosphate and potash fertilizers were applied as basal treatments simultaneously with N application in each sample plot. The phosphorus fertilizer in the basal fertilizer was 178 kg·hm−2 of calcium superphosphate (12% P2O5), and the potassium fertilizer was 147 kg·hm−2 of potassium chloride (60% K2O). To apply N uniformly, it was applied by spraying a water solution, and according to different levels of N application, the corresponding urea content was dissolved in 50 L of pure water. The N application test was completed within one week.

2.2. Soil Sample Collection

In this study, the data for SOC and POC content in the 0~10 cm soil layer under different nitrogen treatments in Moso bamboo forests were sourced from previous research. Building on this, we further investigated the SOC, POC, MBC, DOC, and ROC contents in the 10~20 cm and 20~30 cm soil layers [54].
Soil samples were collected at the beginning of October 2022. Ten sampling points were established in an “S” shape within each plot. Using an auger with an inner diameter of 38 mm, soil samples were collected from the 0~10 cm, 10~20 cm, and 20~30 cm soil horizons. Before sampling, the litter layer was removed from each sampling point. Soil samples from the same soil layer within each plot were mixed, and approximately 1 kg of the mixed soil sample was selected using the quadrat method and stored in a portable insulated box for timely delivery to the laboratory for processing. Stones, roots, and plant debris were removed from the soil samples, and the selected soil was divided into three parts: one part of the fresh soil was sieved through a 2 mm sieve and stored in a refrigerator at −4 °C to determine microbial biomass carbon; another part of the soil was air-dried, ground, and sieved through a 2 mm sieve to determine SOC, DOC, and ROC; and the third part of the fresh soil was carefully broken into 1 cm sized pieces along the cracks in the soil blocks, air-dried, and used to determine particulate organic carbon.

2.3. SOC and Active Organic Carbon Fractions

SOC was measured using a TOC analyzer (TOC-LCSH/CPH, Shimadzu, Beijing, China).
POC was obtained by wet sieving the soil using the method improved by Marriott and Wander [56]. In total, 20 g of air-dried soil was placed in a 50 mL centrifuge tube, 10 mL of 5% sodium hexametaphosphate solution was added and mixed well, and the soil suspension was shaken at 25 °C for 18 h (90 r/min). The soil suspension was passed through a 53 μL sieve and rinsed repeatedly with distilled water, and the portion that remained in the sieve was the particulate organic carbon, which was dried at 60 °C. Then, the POC content was determined using the TOC analyzer.
MBC was extracted using the chloroform fumigation-K2SO4 method. The total carbon content in the extract was then determined using a TOC meter, representing the MBC content.
DOC was determined using the deionized water extraction method, followed by TOC meter analysis. The specific operational steps are as follows: A 10 g soil sample was mixed with deionized water in a ratio of 1:5; the mixture was oscillated for 1 h with the oscillator speed set to 250 r/min and the water temperature maintained at 25 °C; after oscillation, the mixture was centrifuged for 10 min, with the centrifuge speed set to 15,000 r/min. After centrifugation, the supernatant was aspirated and filtered using a 0.45 μm filter membrane. The filtered solution was then analyzed for its organic carbon content using the TOC meter, which provided the DOC content.
ROC content determination followed the Blair method [49]. Specifically, 2 g of soil was placed in a 50 mL centrifuge tube, and 25 mL of potassium permanganate solution was added. The tube was shaken at room temperature for 60 min. The sample was then centrifuged at 3000–4000 r/min for 10 min. The supernatant was collected, and its absorbance was measured at 565 nm using a UV spectrophotometer(T6, Puxi General, Beijing, China). The ROC content was calculated based on the difference in absorbance between the blank sample and the soil sample.

2.4. Soil Carbon Pool Management Index

CPMI was used to assess the impact of N application on SOC sequestration in Moso bamboo forests. Carbon pool activity (L) is expressed as the ratio between the active and inert organic carbon components in SOC under the same treatment. The carbon pool activity index (LI) is expressed as the ratio between soil carbon pool activity under different N application treatments to that under the control treatment, reflecting the relative proportions and dynamics of active organic carbon in the soil. The carbon pool index (CPI) refers to the ratio of soil total organic carbon content under different N application treatments to that under the control treatment, indicating the relative abundance of total organic carbon content in the soil. The soil carbon pool management index was calculated by combining the carbon pool index and the carbon pool activity index.
L = R O C / S O C R O C
L I = L t / L C K
C P I = S O C t / S O C c k
C P M I = C P I × L I × 100
In the above equation, ROC is the readily oxidizable organic carbon content; Lt is the carbon pool activity of the soil under N treatments; Lck denotes the carbon pool activity of the soil under control; SOCt is the organic carbon content of the soil under N treatments; and SOCck denotes the organic carbon content of the soil under control.

2.5. Data Analysis

One-way ANOVA was used to investigate the differences in soil chemical properties, SOC content, active organic carbon content, and the carbon pool management index under different N application treatments, with Duncan’s test used for post hoc comparisons (p < 0.05). Pearson correlation analysis explored the correlations between the soil carbon pool management index and soil chemical properties, SOC, and active organic carbon under different N application treatments. Principal component analysis was used to comprehensively evaluate SOC, active organic carbon, and the carbon pool management index under N application treatments. All data were organized using Excel 2021 (Microsoft Corp., Redmond, WA, USA). One-way ANOVA was performed using SPSS 27.0 (version 3.4.2; R Foundation for Statistical Computing, Vienna, Austria), Pearson correlation analysis was conducted using R Studio (corrplot package), principal component analysis was carried out using R Studio (FactoMineR package), and all graphs and charts were plotted using R Studio (ggplot2 package).

3. Results

3.1. Characterization of Changes in Soil Organic Carbon and Active Organic Carbon in Response to N Input

From Figure 1, it can be seen that, compared to the CK treatment, the N0 treatment significantly increased the MBC content (p < 0.05), but had no significant effect on SOC, POC, DOC, and ROC contents (p > 0.05). This suggests that phosphorus fertilizer application promotes an increase in microbial biomass, while N fertilizer application is more likely to cause changes in SOC, POC, DOC, and ROC contents. Compared to the CK and N0 treatments, the N1 and N2 treatments significantly reduced SOC content in the 0~10 cm soil layer (p < 0.05), decreasing by 18.63% to 29.37%. As soil depth increased, the inhibitory effect of N on SOC weakened, showing no significant impact on SOC content in the 10~20 cm and 20~30 cm soil layers (p > 0.05) (Figure 1A).
N fertilizer application had a certain promoting effect on the increase of POC content. In the 0~10 cm soil layer, POC content in the N1 treatment was significantly higher than in the CK and N0 treatments, increasing by 45.26% and 67.49%, respectively (p < 0.05). The N2 treatment significantly increased POC content by 51.24% compared to the N0 treatment. Compared to the CK and N0 treatments, the N2 and N3 treatments significantly increased POC content in the 10~20 cm soil layer by 25.14% to 41.71% (p < 0.05) (Figure 1B).
MBC content was more easily affected by fertilization treatments. Compared to the CK treatment, the N0 treatment significantly increased the MBC content in different soil layers, by 24.21% to 179.16% (p < 0.05). In the 0~10 cm soil layer, the MBC content in the N1 and N2 treatments was significantly lower than in the CK treatment, decreasing by 63.97% and 50.31%, respectively. The N1, N2, and N3 treatments significantly reduced the MBC content compared to the N0 treatment, decreasing by 70.99%, 59.99%, and 17.91%, respectively (p < 0.05) (Figure 1C). As soil depth increased, the inhibitory effect of N treatments on the MBC content gradually transformed into a promoting effect.
Changes in DOC and ROC contents were related to N input. Compared to the CK and N0 treatments, the N1, N2, and N3 treatments significantly reduced DOC content in the 0~10 cm soil layer by 10.6% to 40.39%. DOC content in the 10~20 cm and 20~30 cm soil layers was significantly higher in the N1 and N2 treatments compared to the N0 treatment (p < 0.05). The inhibitory effect of the N3 treatment on DOC content decreased with increasing soil depth (Figure 1D). Compared to the CK and N0 treatments, the N2 and N3 treatments significantly reduced the ROC content in the 0~10 cm soil layer by 31.18% to 49.19%. The N3 treatment significantly reduced the ROC content in the 10~20 cm soil layer by 37.5% and 34.07%, respectively. The N1 treatment significantly increased the ROC content in the 20~30 cm soil layer by 53.33% and 34.22%, respectively (p < 0.05) (Figure 1E).

3.2. Characterization of Changes in the Proportion of Active Organic Carbon in Response to N Input

From Table 1, it can be seen that, except for MBC/SOC, there were no significant differences in POC/SOC, DOC/SOC, and ROC/SOC between the CK and N0 treatments (p > 0.05). N application had a promoting effect on POC/SOC in the 0~10 cm and 10~20 cm soil layers. Compared to the CK and N0 treatments, the N1 and N2 treatments significantly increased POC/SOC in the 0~10 cm soil layer by 62.13% to 138.26%, while the N2 treatment significantly increased POC/SOC in the 10~20 cm soil layer by 34.95% to 35.38% (p < 0.05).
Compared to the CK treatment, the N0 treatment significantly increased MBC/SOC in different soil layers by 19.08% to 190.59%. The N1 and N2 treatments significantly reduced MBC/SOC in the 0~10 cm soil layer by 48.54% and 50.87%, respectively, while the N3 treatment significantly increased MBC/SOC in the 10~20 cm soil layer by 57.94%, and the N1 treatment significantly increased MBC/SOC in the 20~30 cm soil layer by 61.18% (p < 0.05). Compared to the N0 treatment, the N1 and N2 treatments significantly reduced MBC/SOC in the 0~10 cm soil layer by 58.74% and 48.54%, respectively. The N1, N2, and N3 treatments significantly reduced MBC/SOC in the 10~20 cm soil layer by 57.83%, 43.78%, and 32.13%, respectively, while the N1 treatment significantly reduced MBC/SOC in the 20~30 cm soil layer by 44.53% (p < 0.05).
Compared to the CK and N0 treatments, the N1 treatment significantly increased DOC/SOC in the 0~10 cm and 10~20 cm soil layers by 19.49% to 24.78%, while the N2 treatment significantly increased DOC/SOC in the 20~30 cm soil layer by 26.09% to 33.03%. The N3 treatment significantly reduced DOC/SOC in the 0~10 cm and 10~20 cm soil layers by 34.78% to 44.92% (p < 0.05).
Compared to the CK and N0 treatments, the N1 and N2 treatments significantly increased ROC/SOC in the 20~30 cm soil layer by 11.6% to 32.63%, while the N3 treatment significantly reduced ROC/SOC in the 0~10 cm and 10~20 cm soil layers by 40.02% to 47.03% (p < 0.05). In the 0~10 cm soil layer, changes in POC/SOC, DOC/SOC, and ROC/SOC were related to the amount of N applied, with all ratios decreasing as N application increased.

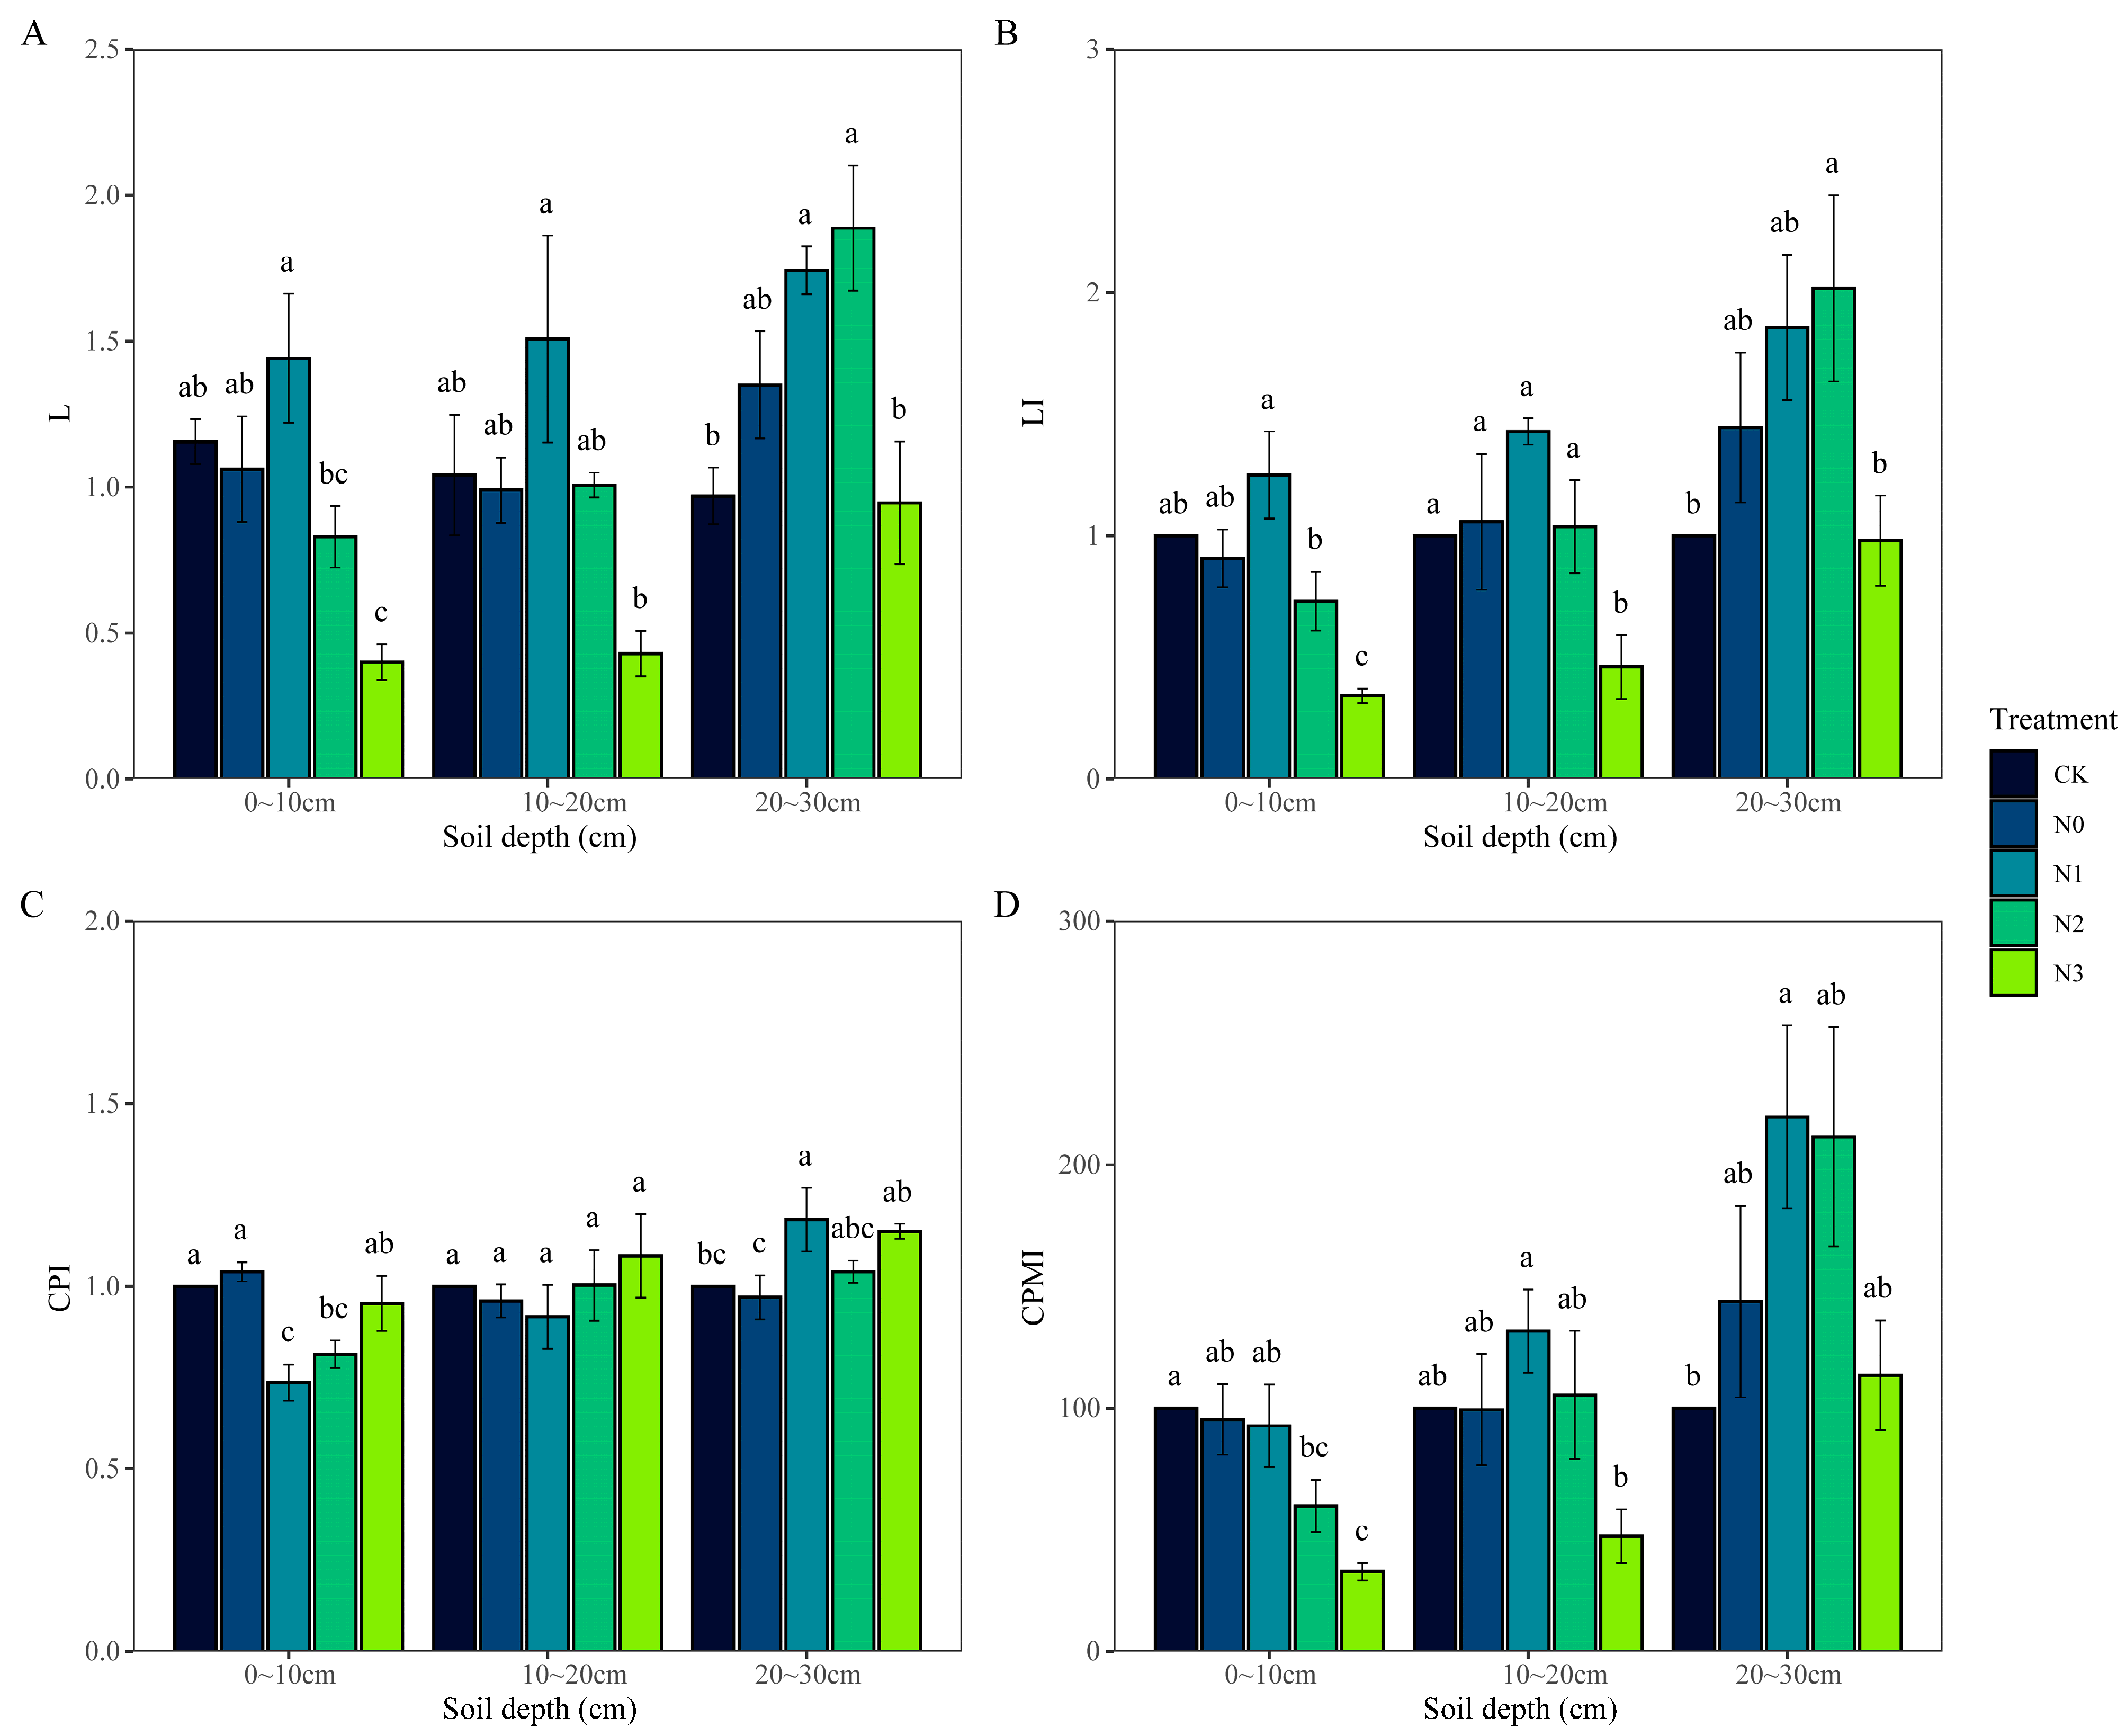
3.3. Characterization of Changes in Soil Carbon Pool Management Indices in Response to N Input

From Figure 2, it can be seen that there were no significant differences in L, LI, CPI, and CPMI between the CK and N0 treatments (p > 0.05). Compared to the CK treatment, the N1 and N2 treatments significantly increased L in the 20~30 cm soil layer by 79.73% and 94.64%, respectively, while the N3 treatment significantly reduced L in the 0~10 cm and 10~20 cm soil layers by 56.59% to 65.33% (p < 0.05) (Figure 2A). Compared to the CK treatment, the N2 treatment significantly increased LI in the 20~30 cm soil layer by 101.68% (p < 0.05). Compared to the CK and N0 treatments, the N3 treatment significantly reduced LI in the 0~10 cm and 10~20 cm soil layers by 53.9% to 63.7% (p < 0.05) (Figure 2B). Compared to the CK and N0 treatments, the N1 and N2 treatments significantly reduced CPI in the 0~10 cm soil layer by 18.67% to 29.16%, while the N1 treatment significantly increased CPI in the 20~30 cm soil layer by 18.33% and 21.99% (p < 0.05) (Figure 2C). Compared to the CK treatment, the N1 treatment significantly increased the CPMI in the 20~30 cm soil layer by 119.52% (p < 0.05). Compared to the CK and N0 treatments, the N2 and N3 treatments significantly reduced the CPMI in the 0~10 cm soil layer by 37.22% to 67.25%, while the N3 treatment significantly reduced the CPMI in the 10~20 cm soil layer by 52.64% and 52.32% (p < 0.05) (Figure 2D). Except for CPI, L, LI, and CPMI showed a decreasing trend with increasing N fertilizer concentration.

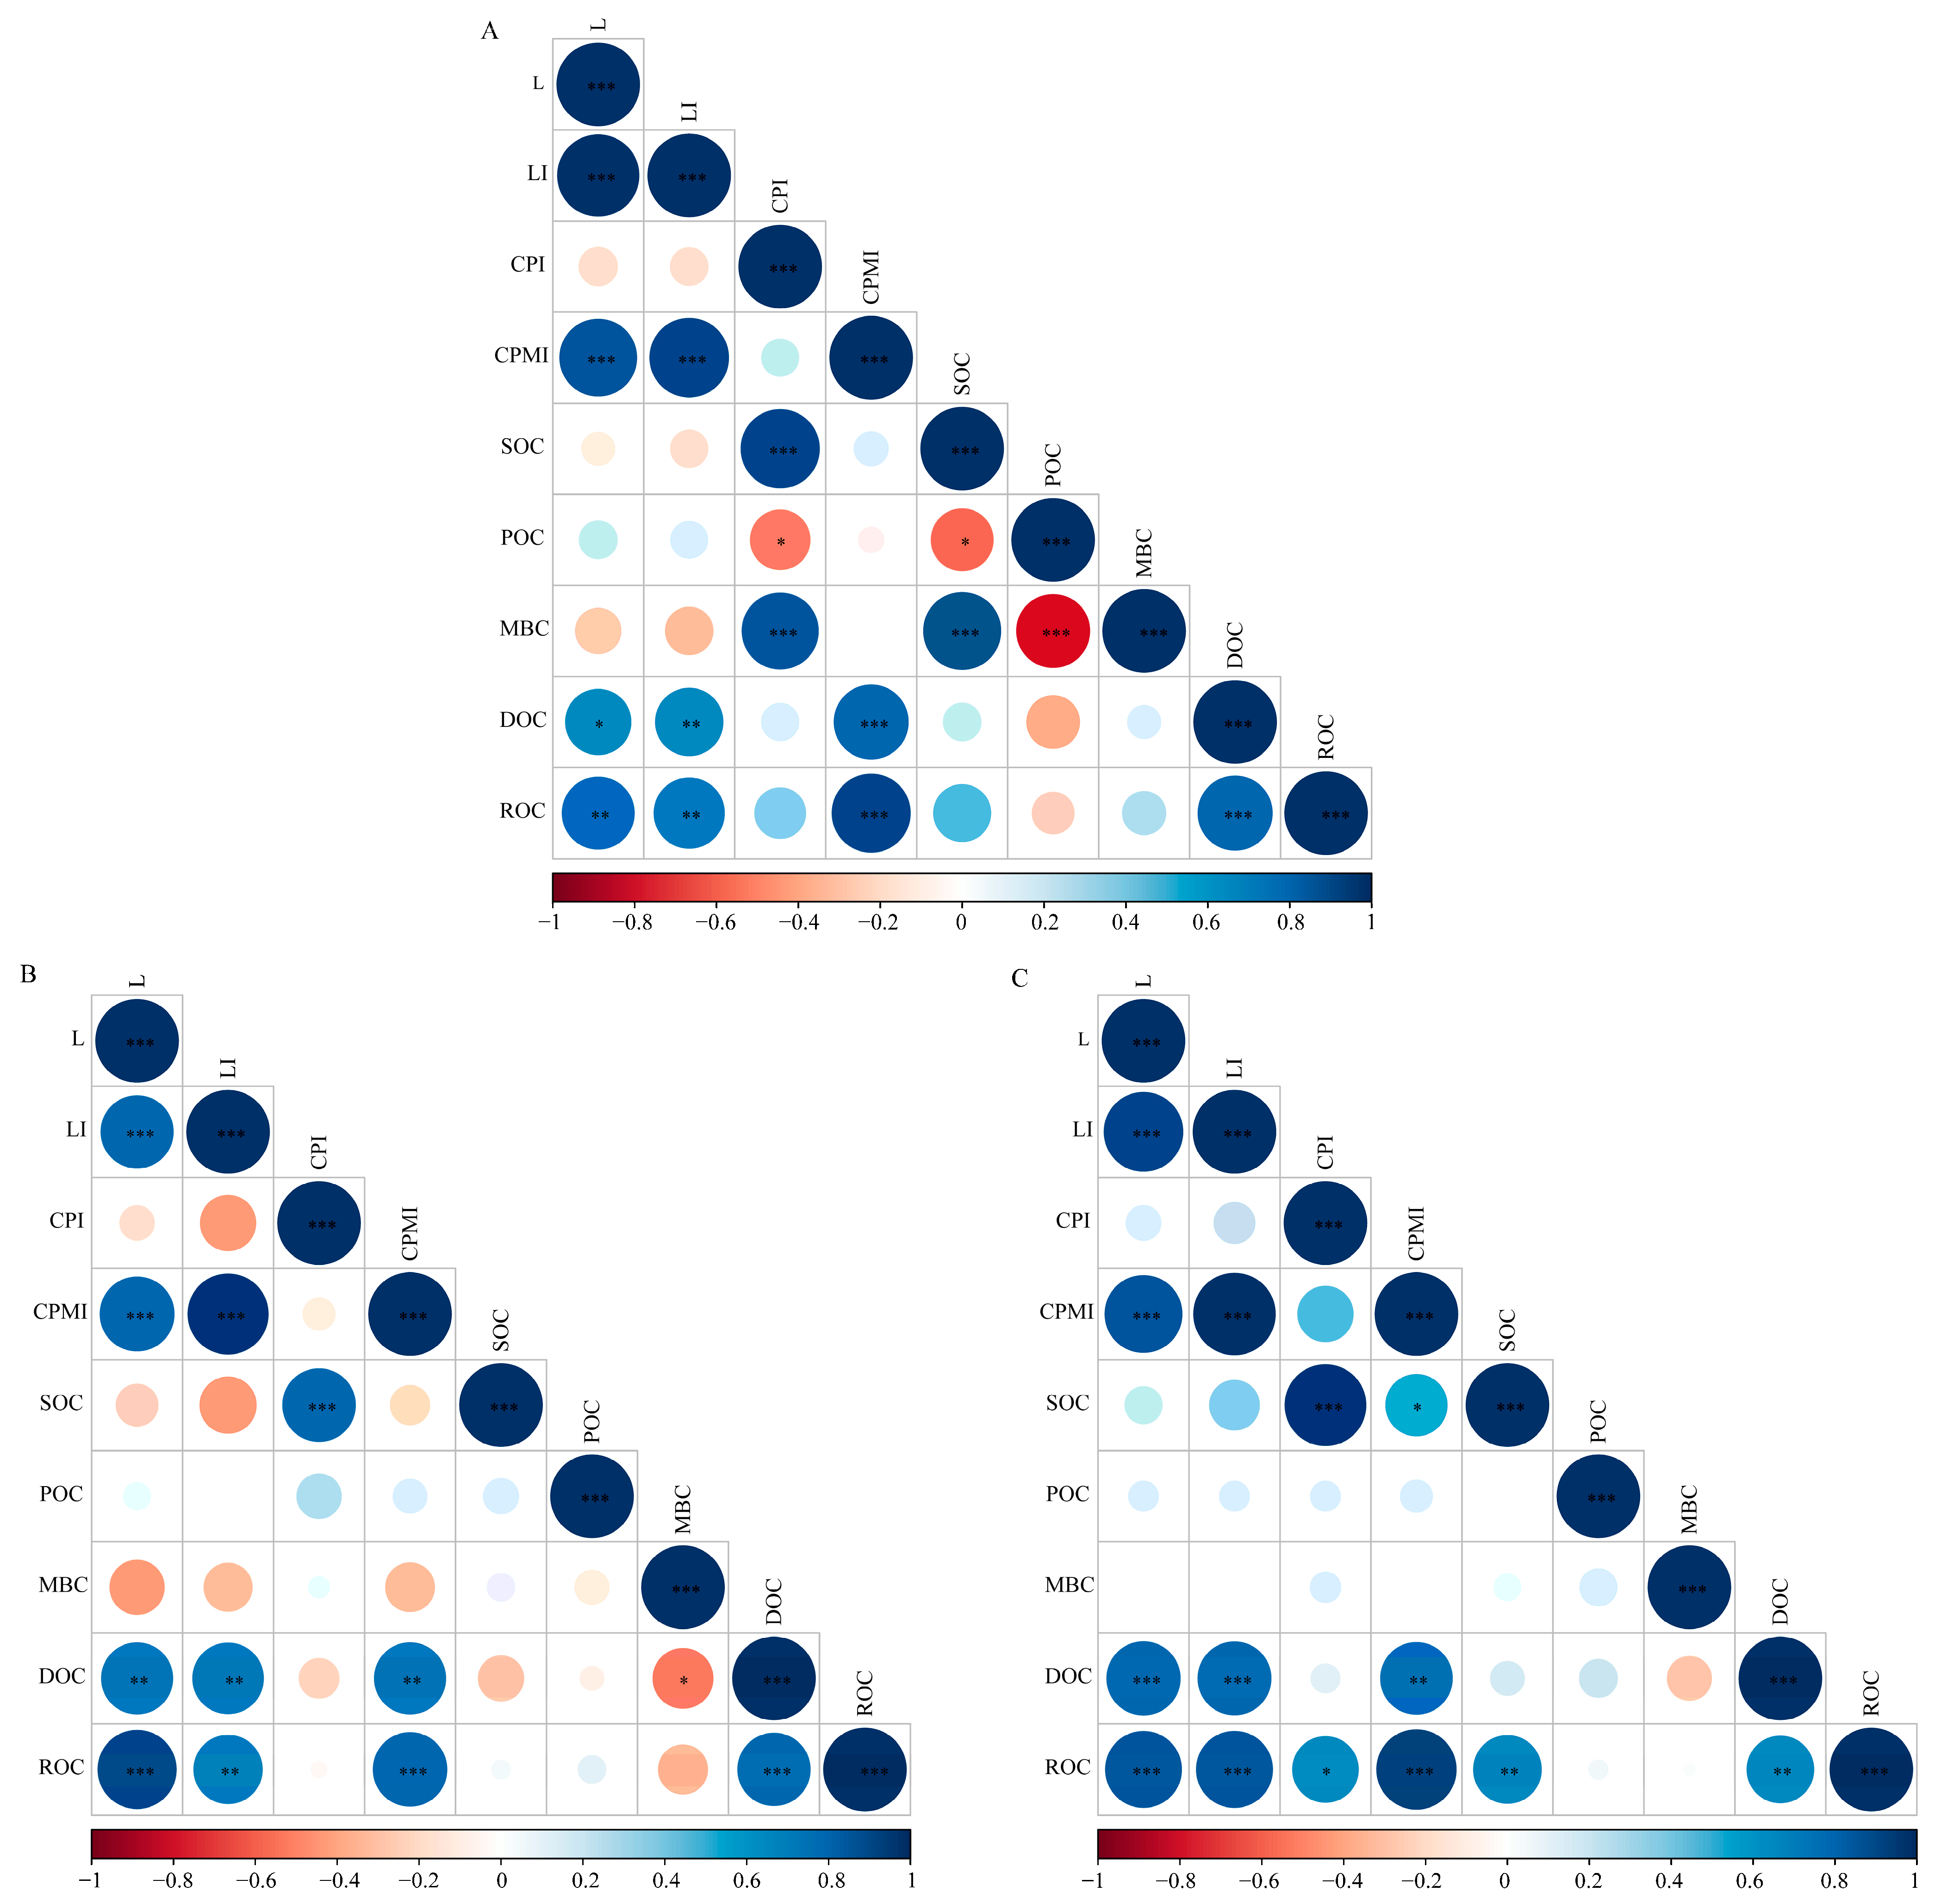
3.4. Correlation between Soil Organic Carbon, Active Organic Carbon, and Carbon Pool Management Indices

From Figure 3, it can be seen that there is a significant positive correlation between the changes in L and LI and the changes in DOC and ROC content. The correlation between CPI and SOC and its active organic carbon components depends on soil depth. In the 0~10 cm soil layer, CPI is significantly positively correlated with SOC and MBC (p < 0.05). In the 10~20 cm soil layer, CPI is only significantly positively correlated with SOC (p < 0.05). In the 20~30 cm soil layer, CPI is significantly positively correlated with the changes in SOC and ROC (p < 0.05). The changes in the CPMI are significantly positively correlated only with the changes in DOC and ROC content (p < 0.05).

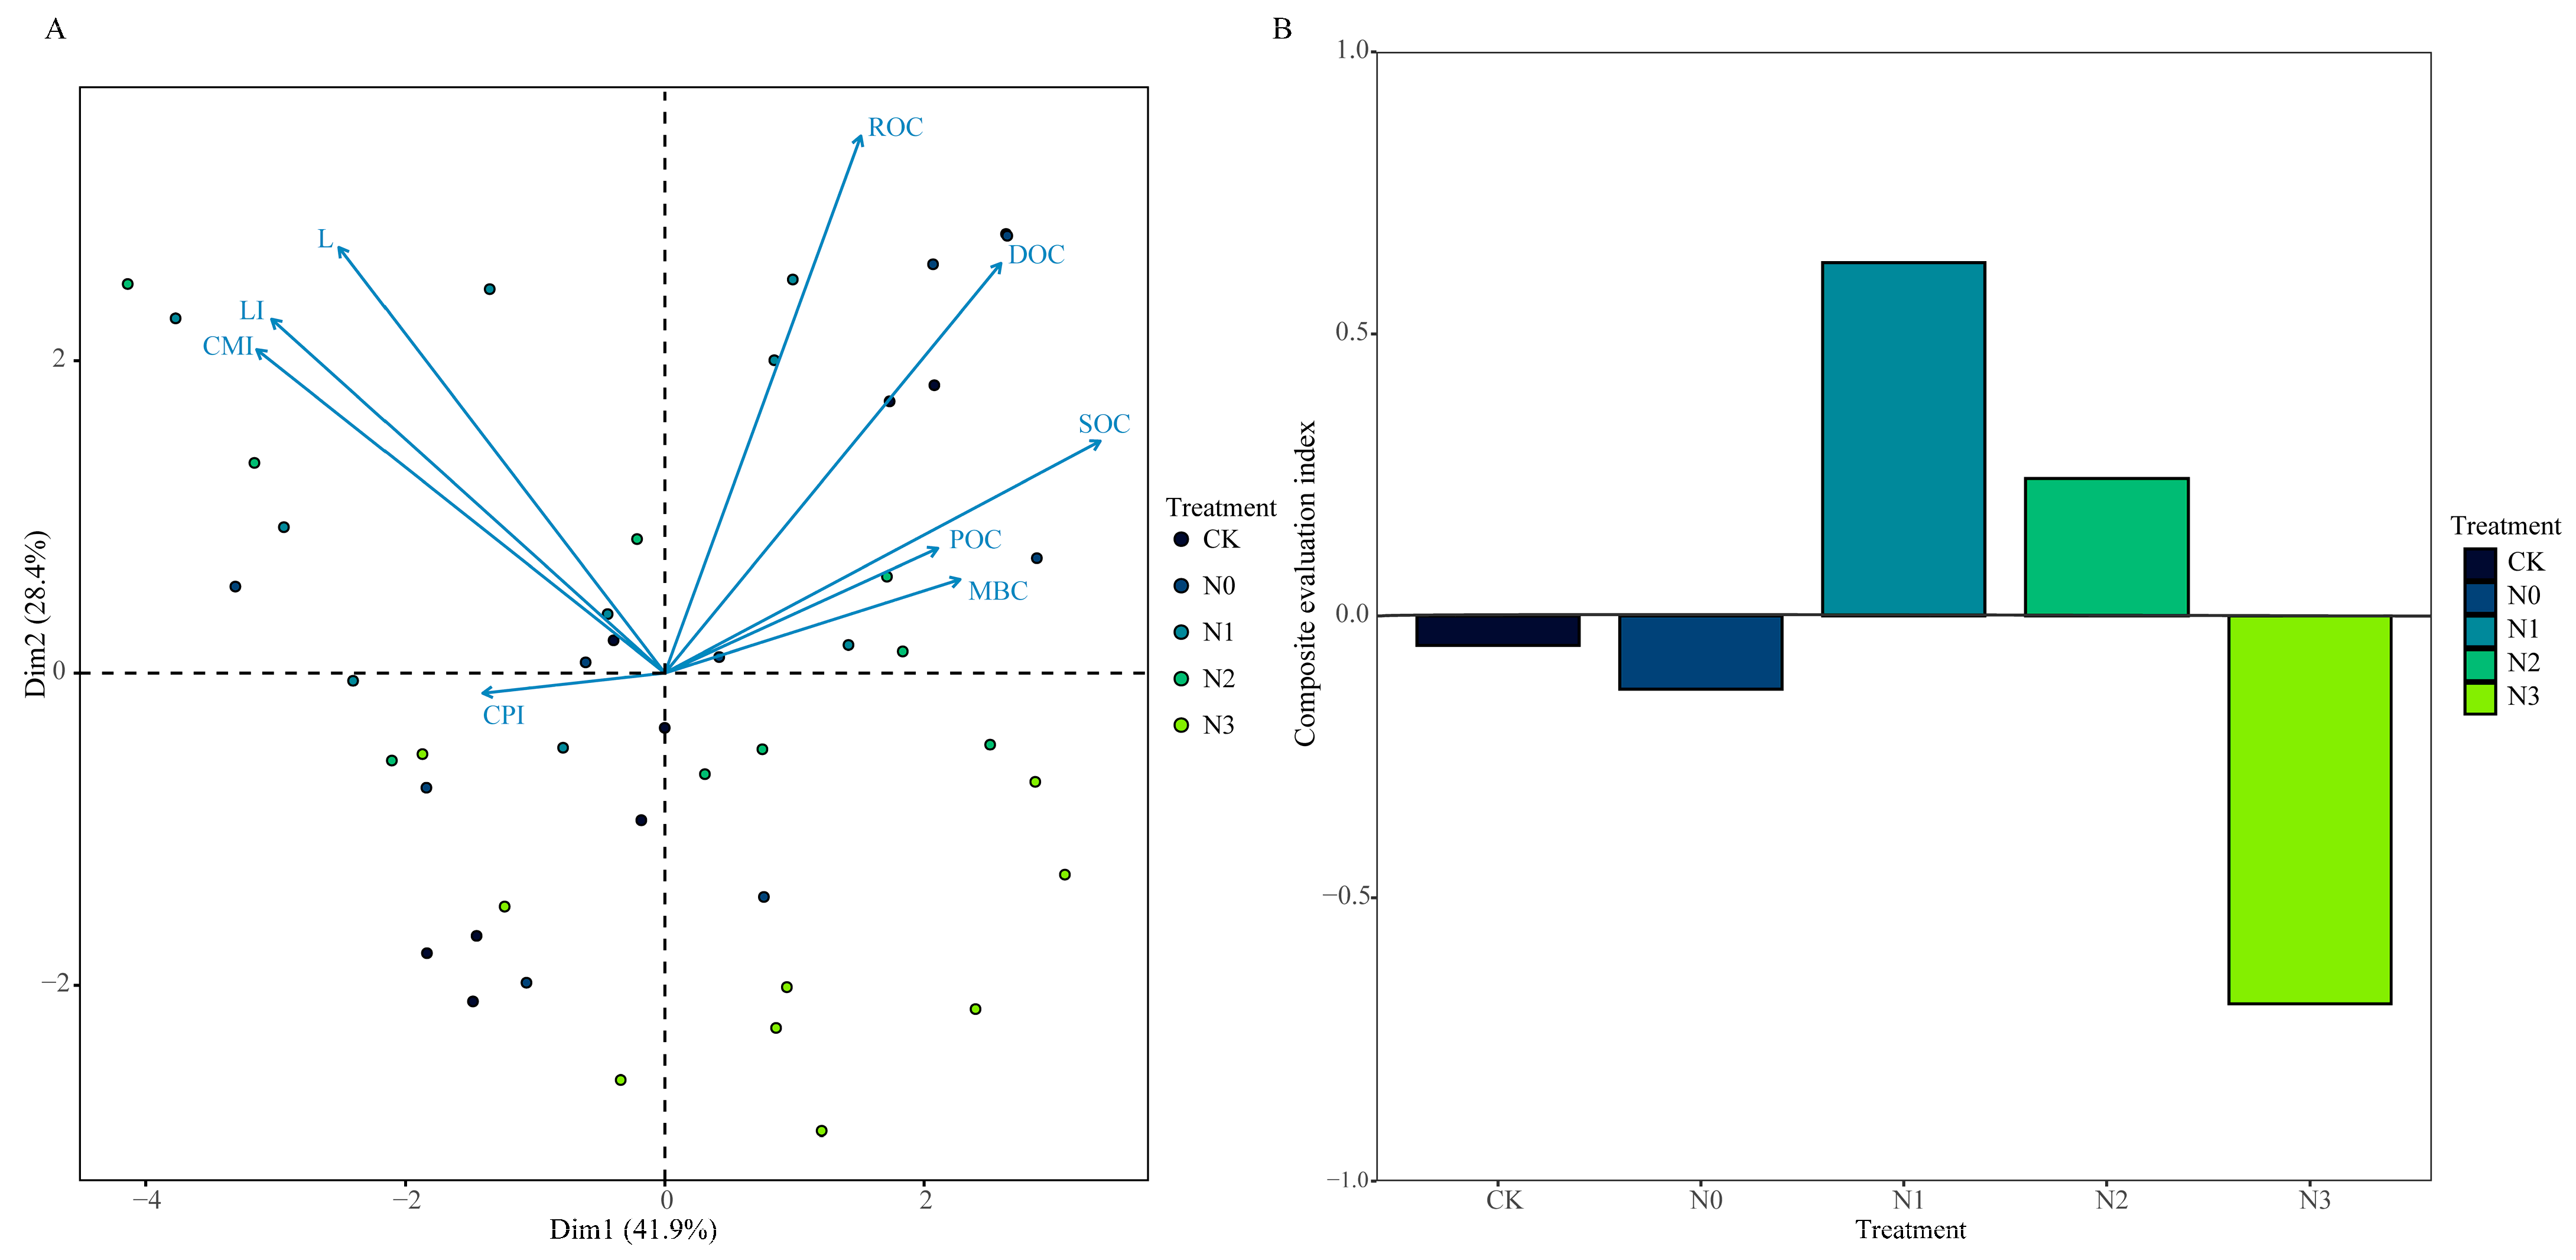
3.5. Comprehensive Evaluation of Soil Organic Carbon and Its Active Fractions with Carbon Pool Management Indices

This study conducted a principal component analysis on SOC, active organic carbon components, and the CPMI to comprehensively evaluate the soil carbon sequestration capacity of Moso bamboo forests under different N treatments (Figure 4). Principal components with eigenvalues greater than 1 were extracted, and the first three principal components were selected for the comprehensive evaluation, accounting for a cumulative contribution rate of 86.57%, indicating the reliability of the evaluation results (Figure 4A). The comprehensive evaluation results showed that N3 (−0.69) < N0 (−0.13) < CK (−0.05) < N2 (0.24) < N1 (0.63), with the highest comprehensive evaluation index for the N1 treatment and the lowest for the N3 treatment (Figure 4B). This indicates that the N1 treatment resulted in the best soil carbon sequestration capacity in Moso bamboo forests, while the N3 and N0 treatments had negative impacts, with the N3 treatment showing the poorest soil carbon sequestration capacity.

4. Discussion

4.1. Effects of Nitrogen Application on Soil Organic Carbon in Moso Bamboo Forests

The impact of N application on the SOC varies and is influenced by factors such as soil type, application methods, duration, and types of N fertilizer [56]. In this study, the SOC content in Moso bamboo forests was not affected by phosphorus fertilizer but varied with the amount of N fertilizer applied. Zhang et al. found that no N fertilizer had no significant impact on the SOC content in subtropical Cunninghamia lanceolata forests compared to no-fertilizer treatment, which is consistent with our findings [57]. In this study, N application significantly reduced the SOC content in the 0~10 cm soil layer, and there was a negative correlation between the amount of N applied and the SOC content (Figure 1A). Previous studies have concluded that N application increases MAOC decomposition in the 0~10 cm soil layer of Moso bamboo forests and decreases SOC stability. This may be one of the reasons for the reduction in the SOC content [54]. Additionally, changes in microbial biomass stoichiometry and aboveground plant community composition due to N application increase the microbial decomposition of SOC and plant-derived carbon substrates, thereby reducing SOC accumulation [58]. Extensively applying N fertilizer is a common practice in managing Moso bamboo forests. Some researchers have suggested that the increased SOC decomposition caused by N application is one of the main reasons for decreased organic carbon pools in bamboo forests [59,60]. In addition, the SOC in the 0~10 cm soil layer is less physically protected than in deeper soils, and the SOC in the organic layer is more susceptible to decomposition and mineralization when the soil environment is altered by N application [35]. Therefore, we believe that N application may exacerbate SOC decomposition, which is the main cause of declining SOC content in the 0~10 cm soil layer. Increased N fertilizer application may enhance SOC stability, thus, decreasing the SOC content. Chen et al. found that the number of small aggregates and microaggregates in the soil increased with higher N concentrations [61]. They concluded that N applications enhance the stability of the SOC by increasing its physical protection. This finding supports our hypothesis. The response of the SOC to N application varies across different soil horizons. Forstner et al. observed that a high N input (NH4NO3, 35 kg N·ha−1·yr−1) did not significantly affect the total organic carbon content in the 0–30 cm soil horizon [31]. However, it increased the organic carbon content in the soil organic horizons and decreased it in the mineral horizons, a finding that contradicts our study’s results. In our study, the increased SOC content in the 20~30 cm soil layer may be attributable to N loss and fertilization methods. The water solution spraying method may have less impact on deep soil layers. Coupled with the runoff loss of N, the actual action of N in deep soil is lower than the N fertilizer contents of N1, N2, and N3. This could potentially benefit SOC storage [19].

4.2. Effects of Nitrogen Application on Soil Active Organic Carbon and Its Ratio in Moso Bamboo Forests

In this study, compared to the no-fertilizer treatment, no N fertilizer increased the MBC content but had no significant effect on POC, DOC, and ROC contents. We observed that N application led to an increase in the POC content within the 0~10 cm and 10~20 cm soil layers to varying degrees (Figure 1B). Previous research has suggested that this rise in the POC content could be attributable to the inhibited microbial decomposition of the POC induced by N application [54]. POC primarily originates from plant residues within the soil that undergo decomposition. Increased carbon input from plant sources can consequently elevate the POC content [62]. N application can enhance the root biomass of Moso bamboo [63], and studies have also shown that N application can increase its root biomass. Increased root biomass may be one of the reasons for the rise in POC content resulting from N application [64]. Phosphorus is an essential element for microbial growth and development. The application of phosphorus fertilizer can enhance microbial metabolic activity, leading to a short-term increase in microbial biomass [65]. This may be one of the reasons for the observed increase in the MBC content following phosphorus application. N application treatments have been observed to significantly decrease the MBC content in both the 0~10 cm and 10~20 cm soil layers (Figure 1C). Studies have found that N-only fertilization has no significant effect on soil microbial biomass in subtropical forests. However, when both N and phosphorus fertilizers are applied, microbial biomass increases with the amount of N fertilizer applied [66]. Li et al. observed that N application treatments (7.5 g N·m−2·yr−1) decreased the MBC content [67], and this reduction was correlated with alterations in microbial nutrient limitations and the efficiency of carbon and N use induced by the N application. Some studies suggest that soils in subtropical regions generally lack phosphorus, and the application of phosphorus fertilizer helps alleviate the phosphorus limitation on microbial growth, thereby increasing microbial biomass. However, previous studies have found that microbial growth in the study area is limited by carbon and N. Although N application alleviates the N limitation to some extent, changes in MBC content are also related to shifts in the microbial community structure [68]. Numerous studies have demonstrated that N application modifies the ratio of bacteria to fungi within the soil. Furthermore, different bacterial strains exhibit varying carbon utilization efficiencies, resulting in diverse MBC content [69,70]. A meta-analysis conducted by Jian et al. demonstrated that applying N significantly diminished the MBC content, a reduction that could be ascribable to alterations in the microbial community composition [71]. Wang et al. observed that low N treatments increased the DOC content, whereas excessive N applications resulted in a decrease. They identified the balance between plant-source carbon inputs and microbial decomposition as a crucial factor in regulating variations in the DOC content [36]. In this study, applying N significantly diminished the DOC content in the top 10 cm soil layer (Figure 1D). This reduction can be attributed to our high N fertilizer application, which may have inhibited the microbial decomposition of plant residues and consequently reduced carbon input into DOC. As the soil depth increased, the amount of exogenous N that influenced the soil decreased. This was evidenced by an increase in the DOC content with low concentrations of N fertilizer and a decrease with high concentrations, a pattern consistent with other studies. Furthermore, the microbial consumption of DOC may have contributed to the observed decrease in the DOC content [45]. Our correlation analysis revealed a negative relationship between the DOC and MBC in the 10~20 cm and 20~30 cm soil layers, supporting our hypothesis (Figure 3B). The variation characteristics of the ROC under different N application treatments mirrored those of the DOC. Correlation analysis further demonstrated a significant positive correlation between the ROC and DOC across various soil layers, suggesting a degree of similarity between the ROC and DOC (Figure 1E and Figure 3).
The ratio of active organic carbon to SOC reflects the turnover and cycling of the SOC [63]. The POC/SOC is thought to reflect the potential activity of the SOC [50]. In this study, the POC/SOC ratio was higher than the control in the 0~10 cm and 10~20 cm soil layers. However, it was lower than the control in the 20~30 cm soil layer. This suggests that N application may have reduced the stability of the SOC in the shallower layers while increasing its stability in the deeper layer (20~30 cm). This increased stability in the deeper soil layer benefits organic carbon sequestration. The MBC/SOC ratio can serve as an indicator of the turnover rate of active SOC pools [72]. No N fertilizer increased the MBC/SOC ratio, indicating that the rise in microbial biomass following phosphorus application enhances the role of microorganisms in the accumulation and decomposition of the SOC, thus increasing the SOC turnover. The results showed that treatments involving N1 and N2 significantly reduced the MBC/SOC ratio, suggesting a decrease in the turnover rate of these active SOC pools. Furthermore, the rate of the SOC accumulation was higher under these treatments compared with the control and N3 treatments. This suggests that moderate applications of N fertilizer can enhance SOC accumulation. DOC is readily absorbed, used, and decomposed by both plants and microorganisms, thereby enhancing soil fertility. Consequently, the DOC/SOC ratio indicates soil fertility. Our research revealed that the DOC/SOC ratio in the N3 treatment was consistently lower than in the control, N1, and N2 treatments across various soil horizons. This suggests that excessive N fertilizer applications may lead to a decline in soil fertility, which is detrimental to its long-term maintenance. The EOC/SOC ratio can indicate the conversion rate of SOC within the soil [73]. A larger ratio suggests that the stability of the organic carbon is compromised. The N3 treatment significantly reduced the EOC/SOC ratio across various soil layers, suggesting enhanced SOC stability. SOC accumulation is a product of the balanced regulation between carbon input and loss. While the N3 treatment bolstered SOC stability, the N1 and N2 treatments impeded the microbial decomposition of this carbon. Consequently, further assessments are warranted to understand the dynamics of organic carbon accumulation.

4.3. Effect of Nitrogen Application on Soil Carbon Pool Management Index in Moso Bamboo Forests

The CPMI assesses soil quality changes by measuring variations in the SOC and ROC contents. Higher CPMI values indicate improved soil fertility and quality, which promote SOC sequestration [74]. Compared to the no-fertilizer treatment, no N fertilizer did not significantly affect the CPMI in different soil layers of Moso bamboo forests. This indicates that no N fertilizer has a minimal impact on soil fertility and carbon sequestration capacity in Moso bamboo forests. N3 treatment significantly reduced the carbon pool activity and carbon pool activity index across various soil layers (Figure 2A,B), indicating that the high N application decreased the contents of active organic carbon in Moso bamboo forest soils. Therefore, excessively applying N fertilizer may lead to a decline in soil fertility, negatively impacting the productivity of bamboo forests [75]. The magnitude of the carbon pool index reflects the total organic carbon content in the soil. We found that the N1 and N2 treatments reduced the carbon pool index in the 0~10 cm soil layer (Figure 2C). However, the N application did not significantly affect the CPI at greater soil depths, likely owing to N loss and the nature of organic carbon in different soil layers. The CPMI measures the efficacy of management strategies in enhancing soil quality, particularly focusing on organic carbon pools. In the 0~10 cm soil layer, applying N3 significantly reduced the CPMI, suggesting a notable decline in the surface soil quality of Moso bamboo forests (Figure 2D). Conversely, in the 10~20 cm soil layer, the N1 treatment markedly improved the CPMI, while the N3 treatment significantly decreased. This indicates that the N1 application positively impacted the quality of the 10~20 cm soil layer in Moso bamboo forests, whereas the N3 treatment had a detrimental effect. Furthermore, within the 10~20 cm soil stratum, the N1 and N2 treatments enhanced the soil quality of the 20~30 cm layer. On a broader scale, the N application treatments resulted in an order of N1 > N2 > N3 for the CPMI, which increased with increasing soil depth. This suggests that excessive N applications are unfavorable for maintaining soil quality or augmenting organic carbon sequestration capacity in Moso bamboo forests. Interestingly, compared with surface soils, moderate N applications were found to boost the organic carbon sequestration capacity of deeper soils, particularly improving the quality of these deeper layers.
PCA is widely used to assess soil environmental factors [76] comprehensively. This study employed PCA to downscale SOC, active organic carbon fractions, and the CPMI and rank the newly generated variables. This method comprehensively assessed changes in Moso bamboo forests’ soil carbon sequestration capacity under different N application treatments. The results indicate that the N1 treatment was the most effective in enhancing the soil carbon sequestration capacity, consistent with findings inferred from the CPMI. Su et al. [55] analyzed the demand pattern of 10 major nutrient elements, including N, during the full-growth period of Moso bamboo and concluded that proposing 242 kg·hm−2·yr−1 as the basal N requirement could effectively improve bamboo forest productivity. This indicates that the N1 treatment improves the comprehensive quality of bamboo forests.

4.4. Innovations and Limitations

In response to the challenges of maintaining long-term productivity and soil quality in Moso bamboo forests under heavy nitrogen application, we built on previous research to explore the effects of nitrogen on the SOC and its active components across the 0~10 cm, 10~20 cm, and 20~30 cm soil layers. By using the CPMI and principal component analysis, we comprehensively assessed the soil quality and carbon sequestration capacity in these soil layers under different nitrogen treatments. This study provides a foundation for the scientific management of nutrients in Moso bamboo forests.
The impact of nitrogen on the SOC and its components is a long-term process. This study only examined changes in the SOC and its active components one year after nitrogen application, focusing on the 0~10 cm, 10~20 cm, and 20~30 cm soil layers. While the findings offer valuable insights into the short-term effects of nitrogen on the SOC and its active components, they lack long-term monitoring of soil conditions following nitrogen application. Future research should also consider the diversity of microbial communities, as microbial decomposition and transformation are critical to the SOC turnover. Nitrogen application can alter microbial community structures, which in turn affects the SOC dynamics. Investigating how microbial communities respond to nitrogen application will provide deeper insights into the mechanisms by which nitrogen influences the SOC turnover.

5. Conclusions

N application is an important practice for increasing the yield of Moso bamboo forests. However, while extensive N application can enhance bamboo forest yield, it can also lead to a decline in soil quality. Our results show that N application treatments have a significant impact on the SOC and active organic carbon fractions in the 0~10 cm soil layer. N application significantly reduced the SOC content and decreased the MBC, DOC, and ROC contents to varying degrees, but it increased the POC content. N3 treatments significantly inhibited the DOC and ROC contents, DOC/SOC ratios, and ROC/SOC ratios across different soil layers. The decrease in the MBC/SOC ratio indicates that N application reduced soil organic carbon turnover. Sole phosphorus fertilization increased the SOC turnover in Moso bamboo forests, but N application had an inhibitory effect on SOC turnover. Among the treatments, the SOC turnover was the slowest under the N1 treatment. The comprehensive evaluation index of carbon sequestration capacity was N3 (−0.69) < N0 (−0.13) < CK (−0.05) < N2 (0.24) < N1 (0.63), with the N1 treatment having the highest and the N3 treatment having the lowest values. In summary, the N1 treatment demonstrated the best SOC sequestration capacity in Moso bamboo forests, promoting soil quality improvement. Excessive N application negatively impacts soil quality and carbon sequestration. Therefore, controlling N application and avoiding excessive N use are crucial for the long-term sustainable management of these forests. Our research provides theoretical support for further exploring the mechanisms through which N application affects soil quality.

Author Contributions

Conceptualization, S.F. and W.S.; formal analysis X.H.; methodology, W.S. and S.F.; data curation, H.C., X.H. and Z.H.; writing—original draft, H.C.; writing—review and editing, H.C. and W.S.; visualization, H.C. and Z.H.; funding acquisition, W.S. All authors have read and agreed to the published version of the manuscript.

Funding

Basic scientific Research Business Expenses of International Center for Bamboo and Rattan (1632021021); National Key R&D Program of China (2023YFD2201202); Research Projects on Special Forestry Industries in Guizhou Province (2020-01).

Data Availability Statement

The data presented in this study are available on request from the corresponding author. The data are not publicly available due to privacy or ethical restrictions.

Conflicts of Interest

The authors declare no conflicts of interest.

References

  1. Jiang, Z. Bamboo and Rattan in the World; China Forest Publishing House: Beijng, China, 2002. [Google Scholar]
  2. Alamerew, A.N.; Kozak, R.; Shrestha, A.K.; Zhu, Z.; Wang, G. A Way for Livelihood Improvement: Systematic Review on Bamboo Forest Research. Trees For. People. 2024, 16, 100571. [Google Scholar] [CrossRef]
  3. Feng, P.; Li, Y. China’s Bamboo Resources in 2021. World Bamboo Ratt. 2023, 21, 100–103. [Google Scholar]
  4. Zheng, Y.; Guan, F.; Fan, S.; Yan, X.; Huang, L. Dynamics of Leaf-Litter Biomass, Nutrient Resorption Efficiency and Decomposition in a Moso Bamboo Forest After Strip Clearcutting. Front. Plant Sci. 2022, 12, 799424. [Google Scholar] [CrossRef] [PubMed]
  5. Zhou, X.; Guan, F.; Zhang, X.; Li, C.; Zhou, Y. Response of Moso Bamboo Growth and Soil Nutrient Content to Strip Cutting. Forests 2022, 13, 1293. [Google Scholar] [CrossRef]
  6. Fan, S.; Liu, G.; Su, W.; Cai, C.; Guan, F. Advances in Research of Bamboo Forest Cultivation. For. Res. 2018, 31, 137–144. [Google Scholar]
  7. Su, W.; Fan, S.; Zhao, J.; Cai, C. Effects of Various Fertilization Placements on the Fate of Urea-15N in Moso Bamboo Forests. For. Ecol. Manag. 2019, 453, 117632. [Google Scholar] [CrossRef]
  8. Zhao, J.; Cai, C. Physiological Integration Improves Nitrogen Use Efficiency of Moso Bamboo: An Isotopic (15N) Assessment. For. Ecol. Manag. 2023, 542, 121073. [Google Scholar] [CrossRef]
  9. Zhao, J.; Su, W.; Fan, S.; Cai, C.; Su, H.; Zeng, X. Ammonia Volatilization and Nitrogen Runoff Losses from Moso Bamboo Forests after Different Fertilization Practices. Can. J. For. Res. 2019, 49, 213–220. [Google Scholar] [CrossRef]
  10. Song, X.; Zhou, G.; Gu, H.; Qi, L. Management Practices Amplify the Effects of N Deposition on Leaf Litter Decomposition of the Moso Bamboo Forest. Plant Soil. 2015, 395, 391–400. [Google Scholar]
  11. Kim, C.; Baek, G.; Yoo, B.O.; Jung, S.-Y.; Lee, K.S. Regular Fertilization Effects on the Nutrient Distribution of Bamboo Components in a Moso Bamboo (Phyllostachys Pubescens (Mazel) Ohwi) Stand in South Korea. Forests 2018, 9, 671. [Google Scholar] [CrossRef]
  12. Song, Q.; Ouyang, M.; Yang, Q.; Lu, H.; Yang, G.; Chen, F.; Shi, J.-M. Degradation of Litter Quality and Decline of Soil Nitrogen Mineralization after Moso Bamboo (Phyllostachys Pubscens) Expansion to Neighboring Broadleaved Forest in Subtropical China. Plant Soil 2016, 404, 113–124. [Google Scholar] [CrossRef]
  13. Li, C.; Zhou, G.; Shi, Y.; Zhou, Y.; Zhang, Y. Effects of different management measures on soil carbon in bamboo forest ecosystems. Sci. Silvae Sin. 2015, 51, 26–35. [Google Scholar]
  14. Davidson, E.A.; Janssens, I.A. Temperature Sensitivity of Soil Carbon Decomposition and Feedbacks to Climate Change. Nature 2006, 440, 165–173. [Google Scholar] [CrossRef] [PubMed]
  15. Riggs, C.E.; Hobbie, S.E.; Bach, E.M.; Hofmockel, K.S.; Kazanski, C.E. Nitrogen Addition Changes Grassland Soil Organic Matter Decomposition. Biogeochemistry 2015, 125, 203–219. [Google Scholar] [CrossRef]
  16. Wang, M.; Li, F.; Dong, L.; Wang, X.; Han, L.; Olesen, J.E. Effects of Exogenous Organic/Inorganic Nitrogen Addition on Carbon Pool Distribution and Transformation in Grassland Soil. Sci. Total Environ. 2023, 858, 159919. [Google Scholar] [CrossRef]
  17. Liu, W.; Qiao, C.; Yang, S.; Bai, W.; Liu, L. Microbial Carbon Use Efficiency and Priming Effect Regulate Soil Carbon Storage under Nitrogen Deposition by Slowing Soil Organic Matter Decomposition. Geoderma 2018, 332, 37–44. [Google Scholar] [CrossRef]
  18. Luo, L.; Yu, J.; Zhu, L.; Gikas, P.; He, Y.; Xiao, Y.; Deng, S.; Zhang, Y.; Zhang, S.; Zhou, W.; et al. Nitrogen Addition May Promote Soil Organic Carbon Storage and CO2 Emission but Reduce Dissolved Organic Carbon in Zoige Peatland. J. Environ. Manag. 2022, 324, 116376. [Google Scholar] [CrossRef]
  19. Xu, C.; Xu, X.; Ju, C.; Chen, H.Y.H.; Wilsey, B.J.; Luo, Y.; Fan, W. Long-term, Amplified Responses of Soil Organic Carbon to Nitrogen Addition Worldwide. Glob. Change Biol. 2021, 27, 1170–1180. [Google Scholar] [CrossRef]
  20. Huang, R.; He, J.; Wang, N.; Christakos, G.; Gu, J.; Song, L.; Luo, J.; Agusti, S.; Duarte, C.M.; Wu, J. Carbon Sequestration Potential of Transplanted Mangroves and Exotic Saltmarsh Plants in the Sediments of Subtropical Wetlands. Sci. Total Environ. 2023, 904, 166185. [Google Scholar] [CrossRef]
  21. Ngaba, M.J.Y.; Uwiragiye, Y.; Bol, R.; de Vries, W.; Zhou, J. Low-Level Nitrogen and Short-Term Addition Increase Soil Carbon Sequestration in Chinese Forest Ecosystems. CATENA 2022, 215, 106333. [Google Scholar] [CrossRef]
  22. Yu, M.; Wang, Y.-P.; Baldock, J.A.; Jiang, J.; Mo, J.; Zhou, G.; Yan, J. Divergent Responses of Soil Organic Carbon Accumulation to 14 Years of Nitrogen Addition in Two Typical Subtropical Forests. Sci. Total Environ. 2020, 707, 136104. [Google Scholar] [CrossRef] [PubMed]
  23. Wang, Q.; Wang, Y.; Wang, S.; He, T.; Liu, L. Fresh Carbon and Nitrogen Inputs Alter Organic Carbon Mineralization and Microbial Community in Forest Deep Soil Layers. Soil. Biol. Biochem. 2014, 72, 145–151. [Google Scholar] [CrossRef]
  24. Fan, Y.; Yang, L.; Zhong, X.; Yang, Z.; Lin, Y.; Guo, J.; Chen, G.; Yang, Y. N Addition Increased Microbial Residual Carbon by Altering Soil P Availability and Microbial Composition in a Subtropical Castanopsis Forest. Geoderma 2020, 375, 114470. [Google Scholar] [CrossRef]
  25. Khan, S.A.; Mulvaney, R.L.; Ellsworth, T.R.; Boast, C.W. The Myth of Nitrogen Fertilization for Soil Carbon Sequestration. J. Environ. Qual. 2007, 36, 1821–1832. [Google Scholar] [CrossRef]
  26. Waldrop, M.P.; Zak, D.R.; Sinsabaugh, R.L.; Gallo, M.; Lauber, C. Nitrogen Deposition Modifies Soil Carbon Storage Through Changes in Enzymatic Activity. Ecol. Appl. 2004, 14, 1172–1177. [Google Scholar] [CrossRef]
  27. Boot, C.M.; Hall, E.K.; Denef, K.; Baron, J.S. Long-Term Reactive Nitrogen Loading Alters Soil Carbon and Microbial Community Properties in a Subalpine Forest Ecosystem. Soil. Biol. Biochem. 2016, 92, 211–220. [Google Scholar] [CrossRef]
  28. Chen, H.; Li, D.; Gurmesa, G.A.; Yu, G.; Li, L.; Zhang, W.; Fang, H.; Mo, J. Effects of Nitrogen Deposition on Carbon Cycle in Terrestrial Ecosystems of China: A Meta-Analysis. Environ. Pollut. 2015, 206, 352–360. [Google Scholar] [CrossRef]
  29. Balesdent, J.; Basile-Doelsch, I.; Chadoeuf, J.; Cornu, S.; Derrien, D.; Fekiacova, Z.; Hatté, C. Atmosphere–Soil Carbon Transfer as a Function of Soil Depth. Nature 2018, 559, 599–602. [Google Scholar] [CrossRef]
  30. Lu, M.; Zhou, X.; Luo, Y.; Yang, Y.; Fang, C.; Chen, J.; Li, B. Minor Stimulation of Soil Carbon Storage by Nitrogen Addition: A Meta-Analysis. Agric. Ecosyst. Environ. 2011, 140, 234–244. [Google Scholar] [CrossRef]
  31. Forstner, S.J.; Wechselberger, V.; Müller, S.; Keibinger, K.M.; Díaz-Pinés, E.; Wanek, W.; Scheppi, P.; Hagedorn, F.; Gundersen, P.; Tatzber, M.; et al. Vertical Redistribution of Soil Organic Carbon Pools After Twenty Years of Nitrogen Addition in Two Temperate Coniferous Forests. Ecosystems 2019, 22, 379–400. [Google Scholar] [CrossRef]
  32. Chen, L.; Liu, L.; Mao, C.; Qin, S.; Wang, J.; Liu, F.; Blagodatsky, S.; Yang, G.; Zhang, Q.; Zhang, D.; et al. Nitrogen Availability Regulates Topsoil Carbon Dynamics after Permafrost Thaw by Altering Microbial Metabolic Efficiency. Nat. Commun. 2018, 9, 3951. [Google Scholar] [CrossRef] [PubMed]
  33. Liu, L.; Greaver, T.L. A Global Perspective on Belowground Carbon Dynamics under Nitrogen Enrichment. Ecol. Lett. 2010, 13, 819–828. [Google Scholar] [CrossRef] [PubMed]
  34. Stockmann, U.; Adams, M.A.; Crawford, J.W.; Field, D.J.; Henakaarchchi, N.; Jenkins, M.; Minasny, B.; McBratney, A.B.; Courcelles, V.D.R.D.; Singh, K.; et al. The Knowns, Known Unknowns and Unknowns of Sequestration of Soil Organic Carbon. Agric. Ecosyst. Environ. 2013, 164, 80–99. [Google Scholar] [CrossRef]
  35. Ramesh, T.; Bolan, N.S.; Kirkham, M.B.; Wijesekara, H.; Kanchikerimath, M.; Srinivasa Rao, C.; Sandeep, S.; Rinklebe, J.; Ok, Y.S.; Choudhury, B.U.; et al. Soil Organic Carbon Dynamics: Impact of Land Use Changes and Management Practices: A Review. Adv. Agron. 2019, 156, 1–107. [Google Scholar]
  36. Wang, H.; Wu, J.; Li, G.; Yan, L.; Wei, X.; Ma, W. Effects of Simulated Nitrogen Deposition on Soil Active Carbon Fractions in a Wet Meadow in the Qinghai-Tibet Plateau. J. Soil. Sci. Plant. Nutr. 2022, 22, 2943–2954. [Google Scholar] [CrossRef]
  37. Wang, W.; Lai, D.; Wang, C.; Pan, T.; Zeng, C. Effects of Rice Straw Incorporation on Active Soil Organic Carbon Pools in a Subtropical Paddy Field. Soil Tillage Res. 2015, 152, 8–16. [Google Scholar] [CrossRef]
  38. Wu, J.; Zhang, H.; Pan, Y.; Cheng, X.; Zhang, K.; Liu, G. Particulate Organic Carbon Is More Sensitive to Nitrogen Addition than Mineral-Associated Organic Carbon: A Meta-Analysis. Soil Tillage Res. 2023, 232, 105770. [Google Scholar] [CrossRef]
  39. Chen, J.; Xiao, W.; Zheng, C.; Zhu, B. Nitrogen Addition Has Contrasting Effects on Particulate and Mineral-Associated Soil Organic Carbon in a Subtropical Forest. Soil. Biol. Biochem. 2020, 142, 107708. [Google Scholar] [CrossRef]
  40. Chen, H.; Li, D.; Feng, W.; Niu, S.; Plante, A.; Luo, Y.; Wang, K. Different Responses of Soil Organic Carbon Fractions to Additions of Nitrogen. Eur. J. Soil. Sci. 2018, 69, 1098–1104. [Google Scholar] [CrossRef]
  41. Zhou, Z.; Wang, C.; Zheng, M.; Jiang, L.; Luo, Y. Patterns and Mechanisms of Responses by Soil Microbial Communities to Nitrogen Addition. Soil. Biol. Biochem. 2017, 115, 433–441. [Google Scholar] [CrossRef]
  42. Yang, Y.; Chen, X.; Liu, L.; Li, T.; Dou, Y.; Qiao, J.; Wang, Y.; An, S.; Chang, S.X. Nitrogen Fertilization Weakens the Linkage between Soil Carbon and Microbial Diversity: A Global Meta-analysis. Glob. Chang. Biol. 2022, 28, 6446–6461. [Google Scholar] [CrossRef] [PubMed]
  43. Liao, S.; Tan, S.; Peng, Y.; Wang, D.; Ni, X.; Yue, K.; Wu, F.; Yang, Y. Increased Microbial Sequestration of Soil Organic Carbon under Nitrogen Deposition over China’s Terrestrial Ecosystems. Ecol. Process 2020, 9, 52. [Google Scholar] [CrossRef]
  44. Shi, L.; Dech, J.P.; Yao, H.; Zhao, P.; Shu, Y.; Zhou, M. The Effects of Nitrogen Addition on Dissolved Carbon in Boreal Forest Soils of Northeastern China. Sci. Rep. 2019, 9, 8274. [Google Scholar] [CrossRef]
  45. Wang, J.-J.; Liu, Y.; Bowden, R.D.; Lajtha, K.; Simpson, A.J.; Huang, W.-L.; Simpson, M.J. Long-Term Nitrogen Addition Alters the Composition of Soil-Derived Dissolved Organic Matter. ACS Earth Space Chem. 2020, 4, 189–201. [Google Scholar] [CrossRef]
  46. Wang, L.; Luo, Y.; Shi, Y.; Han, X. Long-term fertilization on indicators of soil active organic carbon. Chin. J. Soil Sci. 2008, 39, 752–755. [Google Scholar]
  47. Zhao, L.; Han, X.; Wang, S.; Liu, H.; Li, H.; Miao, S.; Wang, F. Change of crop yield and soil fertility under long-term fertilization and nutrients recycling and reutilization on a black soil: IV. soiil organic carbon and its fractions. Chin. J. Appl. Ecol. 2006, 17, 817–821. [Google Scholar]
  48. Yan, C.; Gong, J.; Zhang, S.; Zhang, W.; Dong, X. Effects of nitrogen addition on soil active organic carbon in a temperate grassland of Nei Mongol. Chin. J. Plant Ecol. 2024, 48, 229. [Google Scholar]
  49. Blair, G.; Lefroy, R.; Lisle, L. Soil Carbon Fractions Based on Their Degree of Oxidation, and the Development of a Carbon Management Index for Agricultural Systems. Aust. J. Agric. Res. 1995, 46, 393–406. [Google Scholar] [CrossRef]
  50. Gai, X.; Zhang, J.; Lv, H.; Huang, Z.; Li, Q. Effects of chicken farming on soil active rrganic carbon and carbon pool management index in the Lei bamboo (Phyllostachys praecox) forest. Sci. Silvae Sin. 2023, 59, 78–86. [Google Scholar]
  51. Guo, B.; Fan, S.; Du, M.; Liu, G.; Su, W. Effect of land-use type on soil labile carbon pool and carbon management index. Chin. J. Ecol. 2014, 33, 723–728. [Google Scholar]
  52. Du, M.; Liu, G.; Fan, S.; Feng, H.; Tang, X.; Mao, C. Effects of Fertilization on the Distribution Patterns of Biomass and Carbon Storage in Moso Bamboo Forest, Western Fujian Province, China. Chin. J. Trop. Crops 2015, 36, 872–877. [Google Scholar]
  53. Lu, Q.; Lin, S.; Liu, S.; Zheng, X.; Bi, Y.; Xiao, Z.; Jiang, J.; Wang, A.; Du, X. Meta-analysis of the effect of fertilization on the yield of Phyllostachys edulis forest. J. Nanjing For. Univ. (Nat. Sci. Ed.) 2024, 48, 88–96. [Google Scholar]
  54. Chu, H.; Ni, H.; Su, W.; Fan, S.; Long, Y.; Sun, Y. Enhanced Nitrogen Fertilizer Input Alters Soil Carbon Dynamics in Moso Bamboo Forests, Impacting Particulate Organic and Mineral-Associated Carbon Pools. Forests 2023, 14, 2460. [Google Scholar] [CrossRef]
  55. Su, W. Fertilization Theory and Practice for Phyllostachys Edulis Stand Based on Growth and Nutrient Accumulation Rules. Ph.D. Thesis, Chinese Academy of Forestry, Beijing, China, 2012. [Google Scholar]
  56. Hyvönen, R.; Persson, T.; Andersson, S.; Olsson, B.; Ågren, G.I.; Linder, S. Impact of Long-Term Nitrogen Addition on Carbon Stocks in Trees and Soils in Northern Europe. Biogeochemistry 2008, 89, 121–137. [Google Scholar] [CrossRef]
  57. Zhang, X.L.; Wang, F.C.; Fang, X.M.; He, P.; Zhang, Y.F.; Chen, F.S.; Wang, H.M. Responses of Soil Organic Carbon and Its Labile Fractions to Nitrogen and Phosphorus Additions in Cunninghamia Lanceolata Plantations in Subtropical China. Chin. J. Appl. Ecol. 2017, 28, 449–455. [Google Scholar]
  58. Lu, X.; Vitousek, P.M.; Mao, Q.; Gilliam, F.S.; Luo, Y.; Turner, B.L.; Zhou, G.; Mo, J. Nitrogen Deposition Accelerates Soil Carbon Sequestration in Tropical Forests. Proc. Natl. Acad. Sci. USA 2021, 118, e2020790118. [Google Scholar] [CrossRef]
  59. Chen, Z.J.; Geng, S.C.; Zhang, J.H.; Setälä, H.; Gu, Y.; Wang, F.; Zhang, X.; Wang, X.X.; Han, S.J. Addition of Nitrogen Enhances Stability of Soil Organic Matter in a Temperate Forest. Eur. J. Soil. Sci. 2017, 68, 189–199. [Google Scholar] [CrossRef]
  60. Li, Y.; Zhang, J.; Chang, S.X.; Jiang, P.; Zhou, G.; Fu, S.; Yan, E.; Wu, J.; Lin, L. Long-Term Intensive Management Effects on Soil Organic Carbon Pools and Chemical Composition in Moso Bamboo (Phyllostachys Pubescens) Forests in Subtropical China. For. Ecol. Manag. 2013, 303, 121–130. [Google Scholar] [CrossRef]
  61. Qi, P.; Chen, J.; Wang, X.; Zhang, R.; Cai, L.; Jiao, Y.; Li, Z.; Han, G. Changes in Soil Particulate and Mineral-Associated Organic Carbon Concentrations under Nitrogen Addition in China—A Meta-Analysis. Plant Soil 2023, 489, 439–452. [Google Scholar] [CrossRef]
  62. Gao, G.; Li, Z.; Ge, X.; Huang, R.; LI, A. Effects of nitrogen addition on biomass and root morphology of phyllostachys edulis assdlings under drough stress. Chin. J. Ecol. 2022, 41, 858–864. [Google Scholar]
  63. Ye, C.; Chen, D.; Hall, S.J.; Pan, S.; Yan, X.; Bai, T.; Guo, H.; Zhang, Y.; Bai, Y.; Hu, S. Reconciling Multiple Impacts of Nitrogen Enrichment on Soil Carbon: Plant, Microbial and Geochemical Controls. Ecol. Lett. 2018, 21, 1162–1173. [Google Scholar] [CrossRef]
  64. Pold, G.; Domeignoz-Horta, L.A.; Morrison, E.W.; Frey, S.D.; Sistla, S.A.; DeAngelis, K.M. Carbon Use Efficiency and Its Temperature Sensitivity Covary in Soil Bacteria. mBio 2020, 11, e02293-19. [Google Scholar] [CrossRef]
  65. Ma, X.; Zhou, Z.; Chen, J.; Xu, H.; Ma, S.; Dippold, M.A.; Kuzyakov, Y. Long-Term Nitrogen and Phosphorus Fertilization Reveals That Phosphorus Limitation Shapes the Microbial Community Composition and Functions in Tropical Montane Forest Soil. Sci. Total Environ. 2023, 854, 158709. [Google Scholar] [CrossRef] [PubMed]
  66. Fang, X.-M.; Zhang, X.-L.; Chen, F.-S.; Zong, Y.-Y.; Bu, W.-S.; Wan, S.-Z.; Luo, Y.; Wang, H. Phosphorus Addition Alters the Response of Soil Organic Carbon Decomposition to Nitrogen Deposition in a Subtropical Forest. Soil. Biol. Biochem. 2019, 133, 119–128. [Google Scholar] [CrossRef]
  67. Li, J.H.; Cheng, B.H.; Zhang, R.; Li, W.J.; Shi, X.M.; Han, Y.W.; Ye, L.F.; Ostle, N.J.; Bardgett, R.D. Nitrogen and Phosphorus Additions Accelerate Decomposition of Slow Carbon Pool and Lower Total Soil Organic Carbon Pool in Alpine Meadows. Land. Degrad. Dev. 2021, 32, 1761–1772. [Google Scholar] [CrossRef]
  68. Chu, H.; Su, W.; Zhou, Y.; Wang, Z.; Long, Y.; Sun, Y.; Fan, S. Enzyme Activity Stoichiometry Suggests That Fertilization, Especially Nitrogen Fertilization, Alleviates Nutrient Limitation of Soil Microorganisms in Moso Bamboo Forests. Forests 2024, 15. [Google Scholar] [CrossRef]
  69. Wu, J.; Liu, W.; Zhang, W.; Shao, Y.; Duan, H.; Chen, B.; Wei, X.; Fan, H. Long-Term Nitrogen Addition Changes Soil Microbial Community and Litter Decomposition Rate in a Subtropical Forest. Appl. Soil. Ecol. 2019, 142, 43–51. [Google Scholar] [CrossRef]
  70. Jian, S.; Li, J.; Chen, J.; Wang, G.; Mayes, M.A.; Dzantor, K.E.; Hui, D.; Luo, Y. Soil Extracellular Enzyme Activities, Soil Carbon and Nitrogen Storage under Nitrogen Fertilization: A Meta-Analysis. Soil Biol. Biochem. 2016, 101, 32–43. [Google Scholar] [CrossRef]
  71. Qu, X.; Wang, X.; Wu, J.; He, P. Both Carbon Sequestration and Yield Are Related to Particulate Organic Carbon Stability Affected by Organic Amendment Origins in Mollisol. J. Soils Sediments 2021, 21, 3044–3056. [Google Scholar] [CrossRef]
  72. Li, J.; Pan, W.; Wang, J.; Xue, L.; Zhang, X.; Li, S. Response of active organic carbon and carbon pool management index of karst soil to rocky desertification control measures. For. Res. 2022, 35, 156–163. [Google Scholar]
  73. Jin, B.; Derrick Yuk Fo, L.; Gao, D.; Tong, C.; Zeng, C. Changes in Soil Organic Carbon Dynamics in a Native C4 Plant-Dominated Tidal Marsh Following Spartina Alterniflora Invasion. Pedosphere 2017, 27, 856–867. [Google Scholar] [CrossRef]
  74. Li, Q.; Lv, J.; Peng, C.; Xiang, W.; Xiao, W.; Song, X. Nitrogen-Addition Accelerates Phosphorus Cycling and Changes Phosphorus Use Strategy in a Subtropical Moso Bamboo Forest. Environ. Res. Lett. 2021, 16, 024023. [Google Scholar] [CrossRef]
  75. Rezaei, S.; Gilkes, R.; Andrews, S.; Arzani, H. Soil Quality Assessment in Semiarid Rangeland in Iran. Soil. Use Manag. 2005, 21, 402–409. [Google Scholar] [CrossRef]
  76. Yakovlev, A.; Gendugov, V.; Glazunov, G.; Evdokimova, M.; Shulakova, E. Methodology for the Environmental Assessment of the Soil State and Regulation of the Soil Quality. Eurasian Soil. Sci. 2009, 42, 916–925. [Google Scholar] [CrossRef]
Figure 1. (AE) indicates the characteristics of the changes in SOC, POC, MBC, DOC, and ROC under different N application treatments, respectively. Different lowercase letters indicate differences between treatments in the same soil layer (p < 0.05). Note: Values are means ± standard error (n = 3).
Forests 15 01483 g001
Figure 2. (AD) indicate the characteristics of the changes in L, LI, CPI, and CPMI under different N application treatments, respectively. Different lowercase letters indicate differences between treatments in the same soil layer (p < 0.05). Note: Values are means ± standard error (n = 3).
Forests 15 01483 g002
Figure 3. (AC) represents the correlation between soil organic carbon, active organic carbon, and carbon pool management index in the 0~10 cm, 10~20 cm, and 20~30 cm soil layers, respectively. * p < 0.01; ** p < 0.05; *** p < 0.001.
Forests 15 01483 g003
Figure 4. (A,B) represents the principal component analysis and comprehensive evaluation of soil organic carbon, reactive organic carbon, and soil carbon pool management index of Moso bamboo forest under different N application treatments, respectively.
Forests 15 01483 g004
Table 1. Proportion of soil active organic carbon under different nitrogen application treatments.
Soil DepthNitrogen Application TreatmentsPOC/SOC (%)MBC/SOC (%)DOC/SOC (%)ROC/SOC (%)
0~10 cmCK6.47 ± 0.35 cd1.73 ± 0.06 b1.38 ± 0.07 b53.5 ± 1.64 ab
N05.41 ± 0.1 d2.06 ± 0.08 a1.38 ± 0.06 b50.66 ± 4.75 ab
N112.89 ± 0.6 a0.85 ± 0.03 c1.69 ± 0.11 a58.32 ± 3.99 a
N210.49 ± 0.61 b1.06 ± 0.11 c1.46 ± 0.11 ab44.98 ± 3.25 b
N37.85 ± 1.03 c1.86 ± 0.09 ab0.9 ± 0.06 c28.34 ± 3.04 c
10~20 cmCK8.6 ± 0.94 b1.07 ± 0.11 c1.18 ± 0.06 b50.07 ± 4.65 a
N08.64 ± 1.1 b2.49 ± 0.19 a1.13 ± 0.11 b49.42 ± 2.88 a
N110.82 ± 0.14 ab1.05 ± 0.11 c1.41 ± 0.07 a58.64 ± 5.27 a
N211.66 ± 0.23 a1.4 ± 0.05 bc1.23 ± 0.01 ab50.14 ± 1.07 a
N310.01 ± 0.96 ab1.69 ± 0.16 b0.65 ± 0.04 c29.64 ± 3.83 b
20~30 cmCK10.75 ± 1 a0.85 ± 0.12 a1.15 ± 0.07 b48.97 ± 2.64 b
N011.45 ± 1.74 a2.47 ± 0.28 b1.09 ± 0.11 b56.88 ± 3.64 ab
N110.81 ± 0.97 a1.37 ± 0.09 b1.19 ± 0.06 ab63.48 ± 1.06 a
N210.71 ± 1.24 a2.07 ± 0.13 a1.45 ± 0.09 a64.95 ± 2.81 a
N310.32 ± 1.24 a2.45 ± 0.14 a0.81 ± 0.07 c47.47 ± 5.35 b
Lowercase letters in each column indicate significant (p < 0.05) differences between different N application treatments. SOC: soil organic carbon, POC: particulate organic carbon, MBC: microbial biomass carbon, ROC: readily oxidizable organic carbon. Note: Values are means ± standard error (n = 3).
Disclaimer/Publisher’s Note: The statements, opinions and data contained in all publications are solely those of the individual author(s) and contributor(s) and not of MDPI and/or the editor(s). MDPI and/or the editor(s) disclaim responsibility for any injury to people or property resulting from any ideas, methods, instructions or products referred to in the content.

