Article

Interplay of Environmental Shifts and Anthropogenic Factors with Vegetation Dynamics in the Ulan Buh Desert over the Past Three Decades

1
College of Desert Control Science and Engineering, Inner Mongolia Agricultural University, Hohhot 010019, China
2
Horqin District Forestry Workstation of Tongliao, Tongliao 028000, China
3
Inner Mongolia Academy of Forestry Sciences, Hohhot 010010, China
4
Key Laboratory of Desert Ecosystem Conservation and Restoration, State Forestry and Grassland Administration of China, Hohhot 010018, China
5
Yinshanbeilu National Field Research Station of Steppe Eco-Hydrological System, China Institute of Water Resources and Hydropower Research, Beijing 100038, China
6
Geological Survey Academy of Inner Mongolia Autonomous Region, Hohhot 010020, China
*
Author to whom correspondence should be addressed.
Forests 2024, 15(9), 1583; https://doi.org/10.3390/f15091583
Submission received: 10 May 2024 / Revised: 14 August 2024 / Accepted: 3 September 2024 / Published: 10 September 2024

Abstract

:
In arid and semiarid regions, vegetation provides essential ecosystem services, especially retarding the desertification process. Vegetation assessment through remote sensing data is crucial in understanding ecosystem responses to climatic factors and large-scale human activities. This study analyzed vegetation cover changes in the Ulan Buh Desert from 1989 to 2019, focusing on the impacts of human activities and key meteorological factors. The results showed that both climatic and human activities contributed to an increasing trend in vegetation cover (normalized difference vegetation index (NDVI)) over the 30-year period. Temperature and precipitation significantly affected the NDVI in the desert, with temperature having a more substantial influence. The combined impact of average temperature and precipitation on the NDVI was notable. Human activities and meteorological factors caused the vegetation restoration area in the desert to be approximately 35% from 1989 to 2019. Human activities were the primary influencers, responsible for about 60% of vegetation restoration across the study area. Especially from 2004 to 2019, the conversion to farmland driven by human activities dominated the region’s NDVI increase. The research underscores the importance of considering both climatic and human factors in understanding and managing ecosystem dynamics in arid areas like the Ulan Buh Desert. By integrating these factors, policymakers and land managers can develop more effective strategies for sustainable ecosystem management and combating desertification.

1. Introduction

Desert ecosystems are fragile and essential to human well-being and the global ecology and economy [1]. The Ulan Buh Desert is one of the eight major deserts in China. It is a typical inland arid region with fragile desert ecosystems and unique geographical characteristics [2]. The eastern edge of the desert (from Sanshenggong to the Wuhai water control hub of the Yellow River) is one of the hotspot areas where sandstorms occur in the Yellow River Basin. In the Ulan Buh Desert area, vegetation is crucial in preventing wind from blowing sand into the Yellow River. Vegetation cover change in this area is correlated to natural factors and human activities [3,4,5]. Many human efforts, e.g., afforestation, have been made globally to increase vegetation cover and inhibit desertification [6,7]. Meanwhile, desert ecosystems’ meteorological factors (e.g., temperature, precipitation, wind speed, and sunshine time) also affect the vegetation cover [8]. Therefore, monitoring the vegetation cover dynamics in arid and semiarid regions and studying their influencing mechanisms are significant in guiding desertification prevention and control [6,9].
The satellite-derived normalized difference vegetation index (NDVI) is a commonly used indicator in observing vegetation changes and their response to influencing factors since it can be used for quantifying vegetation growth and cover [7,10]. By applying NDVI, Wang et al. [11] found that precipitation has a more significant impact on vegetation growth in the arid region of northwest China. Moreover, based on a drought analysis over China, precipitation is a critical meteorological factor that controls NDVI changes [12]. Nevertheless, Guo et al. [13] discovered that temperature is the primary influencing factor of the growth of the northeast permafrost region during the growing season. Similar results were also found in Nepal, where the vegetation changes are more sensitive to temperature changes than precipitation changes [14]. The correlation between vegetation spatiotemporal dynamics and meteorological driving factors exhibited significant spatiotemporal nonstationary and aggregation in the Wuwei area, which is the most ecologically fragile arid region in Northwest China [15]. Additionally, they highlighted that the impact of wind speed on vegetation in desert areas and grassland ecosystems should be paid more attention [15]. Other studies have shown that wind-driven sand hinders the growth of vegetation, which, in turn, affects retarding desertification in arid areas [16]. Extreme temperature and precipitation are two properties of climate change that affect ecosystem health. However, the factors affecting the increase in vegetation coverage are still unknown in different regions of Ulan Buh and the desert.
Apart from the factors of climate, human activities can influence vegetation dynamics in the arid areas as well [15]. Few vegetation changes can be observed in uninhabited areas and those with infrequent human activities, which indicates that vegetation changes are more pronounced in areas where there are more human activities [17,18]. Driven by government policy, afforestation was implemented in desert areas in China, which led to a compromise in achieving environmental policy objectives due to the inappropriate use of species despite observed positive effects [19]. Since its inception in 1978, the three-north shelterbelt program (TNSP) has emerged as a pioneering endeavor in China’s ambitious ecological initiatives [20]. Afforestation supported by TNSP is the main factor behind vegetation changes in the semi-arid regions of northern China [21]. Similar results were also found in Qinba Mountain in China [22]. Ulan Buh Desert is one of the critical areas of the TNSP. Apart from afforestation, previous studies also found the critical role of farmland in improving the vegetation cover [21]. However, the interannual changes in land use type during the combat of desertification have yet to be known.
Many approaches were applied to identify the impact of human activities and meteorological factors on NDVI dynamics in arid/semi-arid areas. Most studies used statistical models to quantify the contribution of the vegetation dynamics’ driving factors, such as correlation analysis, linear regression model, residual analysis, partial correlation analysis, and multiple statistical tests [23,24,25,26]. Besides, Wang et al. [27] introduced the geographical detector model (GDM) according to the theory of spatial (global) hierarchical heterogeneity. This model is designed to assess the spatial hierarchical heterogeneity of response variables and uncover the impact of driving factors. The GDM was applied to study the explanatory power of different factors on vegetation changes in the Sichuan, Shaanxi, Mongolia, and Heihe River basins [10,28,29,30]. Many scholars have applied geographically and temporally weighted regression (GTWR) [31,32]. Wavelet analysis has achieved the best balance between time and frequency resolution levels [33]. It can decompose time series into different components, and the resolution of each element matches its size. Meanwhile, wavelet analysis is a more suitable and widely used method for climatological research [34].
Specifically, the objectives of this study are to (1) examine the vegetation cover dynamics of the Ulan Buh Desert; (2) identify whether temperature or precipitation affects the vegetation dynamics more in the Ulan Buh Desert; (3) explore the dynamics of human activities and land use during the combat of desertification; and (4) investigate the dynamic changes and internal connections among climate, vegetation, and human activities in the Ulan Buh Desert. The study intends to hold considerable implications for informing desert management strategies and guiding policy formulation aimed at ecological restoration and sustainable development in arid/semi-arid areas.

2. Materials and Methods

2.1. Study Area

The Ulan Buh Desert (39°40′–41°00′ N; 106°00′–107°20′ E) is situated in the northwest region of Inner Mongolia, China, covering an area of 14,000 km2 (Figure 1). The northern boundary of the desert borders Langshan, while its eastern edge is adjacent to the Yellow River, marking the division from the Ordos Plateau. To the northeast, it merges with the Hetao Plain, while its southern reaches extend to the northern base of Helan Mountain. To the west is the Jilantai Salt Pond. The diverse landscape primarily consists of eroded mountains, piedmont alluvial fans, clusters of dunes, and the expansive Yellow River alluvial plain, among other features. The topography of the study area is low in the middle and high in the surrounding regions. The plant type is temperate desert shrubs. The dominant plant species in this ecosystem is Nitraria tangutorum. The common psammophytic vegetation includes Agriophyllum squarrosum, Salsola collina, Artemisia desertorum, Achnatherum splendens, Phragmites australlis, and Sophora alopecuroides.

2.2. Data Sources and Processing

Based on the USGS Data Center (http://glovis.usgs.gov/, accessed on 13 December 2021) and the Geospatial Data Cloud (http://www.gscloud.cn/search, accessed 21 December 2021), the annual remote sensing images of the vigorous growth period of vegetation from 1989 to 2019 (June to September) were selected: 1989–2012 for Landsat-5 satellite data and 2013–2019 for Landsat-LOI8 satellite data. The satellite data images’ resolution was 30 m × 30 m and were either cloudless or had few clouds. Maximum value combination (MVC) was utilized to preprocess all NDVI data, aiming to reduce the impacts of residual clouds, atmospheric disturbances, shadows, solar zenith angle, and aerosol scattering within the ENVI environment [35]. The NDVI was obtained using the MVC method due to its stable performance in assessing interannual vegetation changes. Following image preprocessing, which included radiometric calibration, atmospheric correction, mosaicking, and clipping using ENVI 5.3 software, the NDVI was calculated. NDVI data are sourced from 124 satellite image data, with 4 satellite image data per year for 31 years. Except for some drawing processes where contrast and visual needs require the use of NDVI mean (the average value during the observation period), NDVImax (the maximum value during the growing season) is used in other calculation processes.
We ensured the comparability of the vegetation growth in different periods by closing the gap between the differences in vegetation phenology and seasonal solar elevation angle. Given the limitations of the remote sensing system’s space, time, spectrum, and radiation resolution, it was not easy to accurately record the information on the complex surface through the remote sensing images. Hence, the inevitable errors required radiation and geometric correction before use. We used the relative radiation correction technique to normalize the regression analysis and the intensity of other temporal remote sensing data to the reference image in August 2004, giving them the same radiation level as the reference image for the following comparative analysis. We also used a linear polynomial correction model for the geometric correction of each scene image.
The land use data are mainly based on Landsat TM/OLI remote sensing images. After image fusion, geometric correction, image enhancement, and stitching, the land use types in the study area are divided into 8 types of land use through human–computer interaction and visual interpretation methods: 1. Saline–alkali land; 2. Sandy land; 3. Construction land; 4. Cultivated land; 5. Forest land; 6. Grasslands; 7. Other unused land; 8. Waters. Human–computer interaction and visual interpretation methods involve techniques and tools that enable users to interact with and interpret visual data through computer interfaces. These methods are particularly important in fields such as remote sensing, where large volumes of visual data need to be processed and understood [36,37,38].
Meteorological data were sourced from the China Meteorological Science Data Sharing Service Network (https://www.cma.gov.cn/, accessed on 20 April 2022). According to each meteorological station’s longitude and latitude information, we applied the ordinary Kriging method [39] with ArcGIS 10.7 for spatial interpolation, generating grid images of annual accumulated precipitation, average temperature, average wind speed, and sunshine hours from 1989 to 2019 (Table 1). The ordinary Kriging method can be applied to various types of spatial data, including those with unevenly distributed data points, and it can handle data with different spatial variation structures [40,41,42]. Seven years of population distribution raster data were used: 1990, 1995, 2000, 2005, 2010, 2015, and 2019. Data comes from the kilometer grid dataset of China’s population spatial distribution. Data from 1995 to 2019 were acquired from the Resource and Environmental Science and Data Center (http://www.resdc.cn/Default.aspx, accessed on 26 April 2022). Using the multifactor weight distribution method, we spatialized the 1990 population data by distributing it onto a grid, with administrative regions as the foundational statistical units.

2.3. Statistical Analysis

The monadic linear regression analysis was employed to simulate the vegetation (NDVI) change characteristics of the study area (Ulan Buh Desert) on a per-pixel basis using a 95% dominance test. We conducted a correlation analysis to determine the relationship between NDVI and climatic factors. Additionally, we utilized a partial correlation coefficient to examine whether two factors simultaneously correlate with a third factor while controlling for the correlation between the two factors. This allows for assessing the correlation of the third factor while excluding the influence of the other two factors. Multiple regression analysis methods were applied to study the joint impact of temperature and precipitation meteorological factors on the NDVI [43]. We superimposed the maps of the NDVI trends, NDVI–precipitation–temperature complex correlation coefficients, and residual trends to investigate how climate change and human activities affect vegetation.

2.4. Formula Application

We evaluated the impact of climate variables on vegetation dynamics by calculating the Pearson correlation coefficient between N D V I and the annual average temperature precipitation. The formula is given in Equation (1) as follows:
R x y = i = 1 n x i x - y i y - i = 1 n x i x - 2 i = 1 n y i y - 2 ,
where R x y is the correlation coefficient between two variables ( x and y ), with a value ranging from −1 to 1 (the higher the absolute value, the stronger the correlation); i is the year from 1 to 31 in the study period; and n is the number of years in the period (i.e., 31 years in this study). In addition, x i is the growing season N D V I in the i t h year; y i is the growing-season temperature or precipitation in the i t h year; and x - and y - are the mean N D V I and temperature or precipitation, respectively, in the 1989–2019 growing season. If the correlation coefficient is more significant than 0, then the two variables are positively correlated, and vice versa.
The partial correlation coefficient can be further derived through simple linear correlation calculations. This is expressed by the partial correlation coefficient (Equation (2)):
R x y z = r x y r x z r y z ( 1 r x z 2 ) ( 1 r y z 2 ) ,
where R x y z represents the partial correlation coefficient of x and y after excluding factor z , and r x y , r x z , r y z represent the simple correlation coefficients between factors x and y , factors x and z , and factors y and z , respectively. The range and meaning of R are the same as those of r . The significance test of the partial correlation coefficient generally adopts the T test method shown in Equation (3):
t = R x y z 1 R x y z 2 n m 1 ,
where t is the statistics of the significance test of the partial correlation coefficient, R x y z represents the partial correlation coefficient of factors x , y , n represents the sample size, and m represents the number of independent variables.
We used multiple regression analysis methods (multiple correlation analysis, Equation (4)) to study the joint influence of temperature and precipitation meteorological factors on the NDVI [22]. In addition, we used the F test to test the significance of a multiple regression equation, as shown in Equation (5):
F x y z = 1 1 R x y z 2 1 R x z y 2 ,
where x is the dependent variable, and y and z are independent variables. In addition, F x y z is the multiple correlation coefficient is given by:
F m = F x y z 2 1 F x y z 2 n k 1 k ,
where F m is the test of significant statistics, F x y z is the multiple correlation coefficient, n is the number of samples, and k represents the number of independent variables.

3. Results

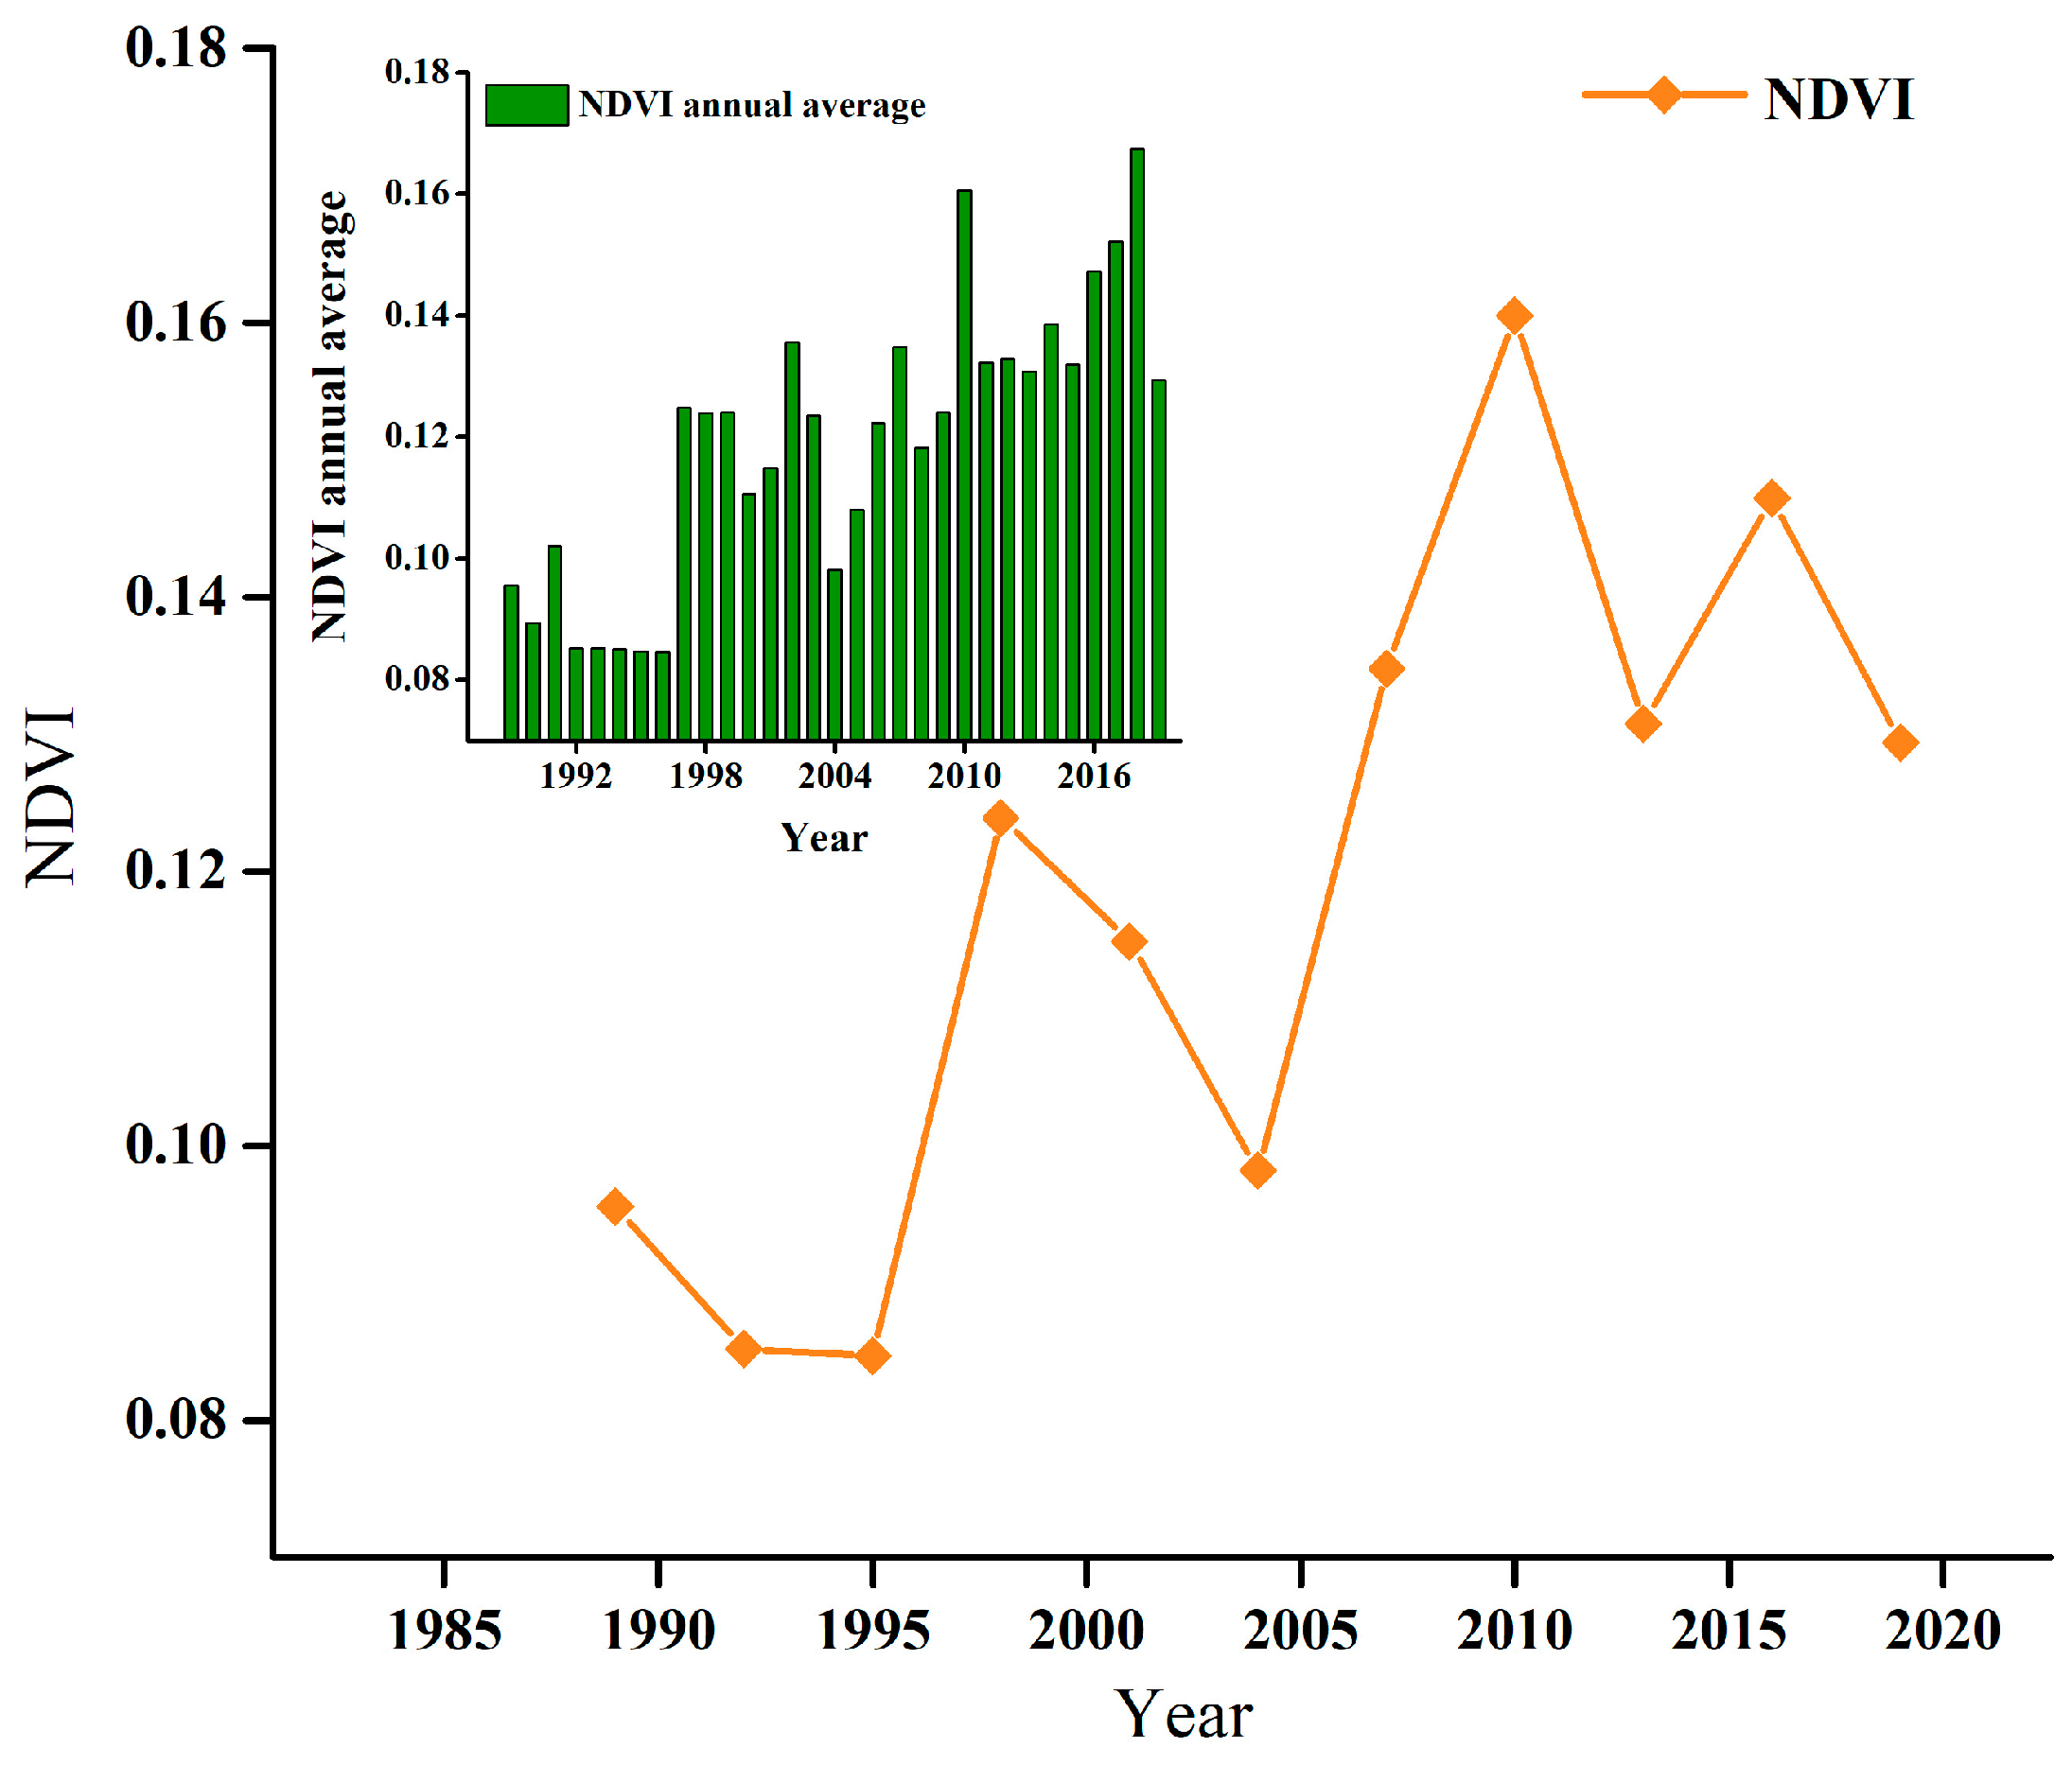
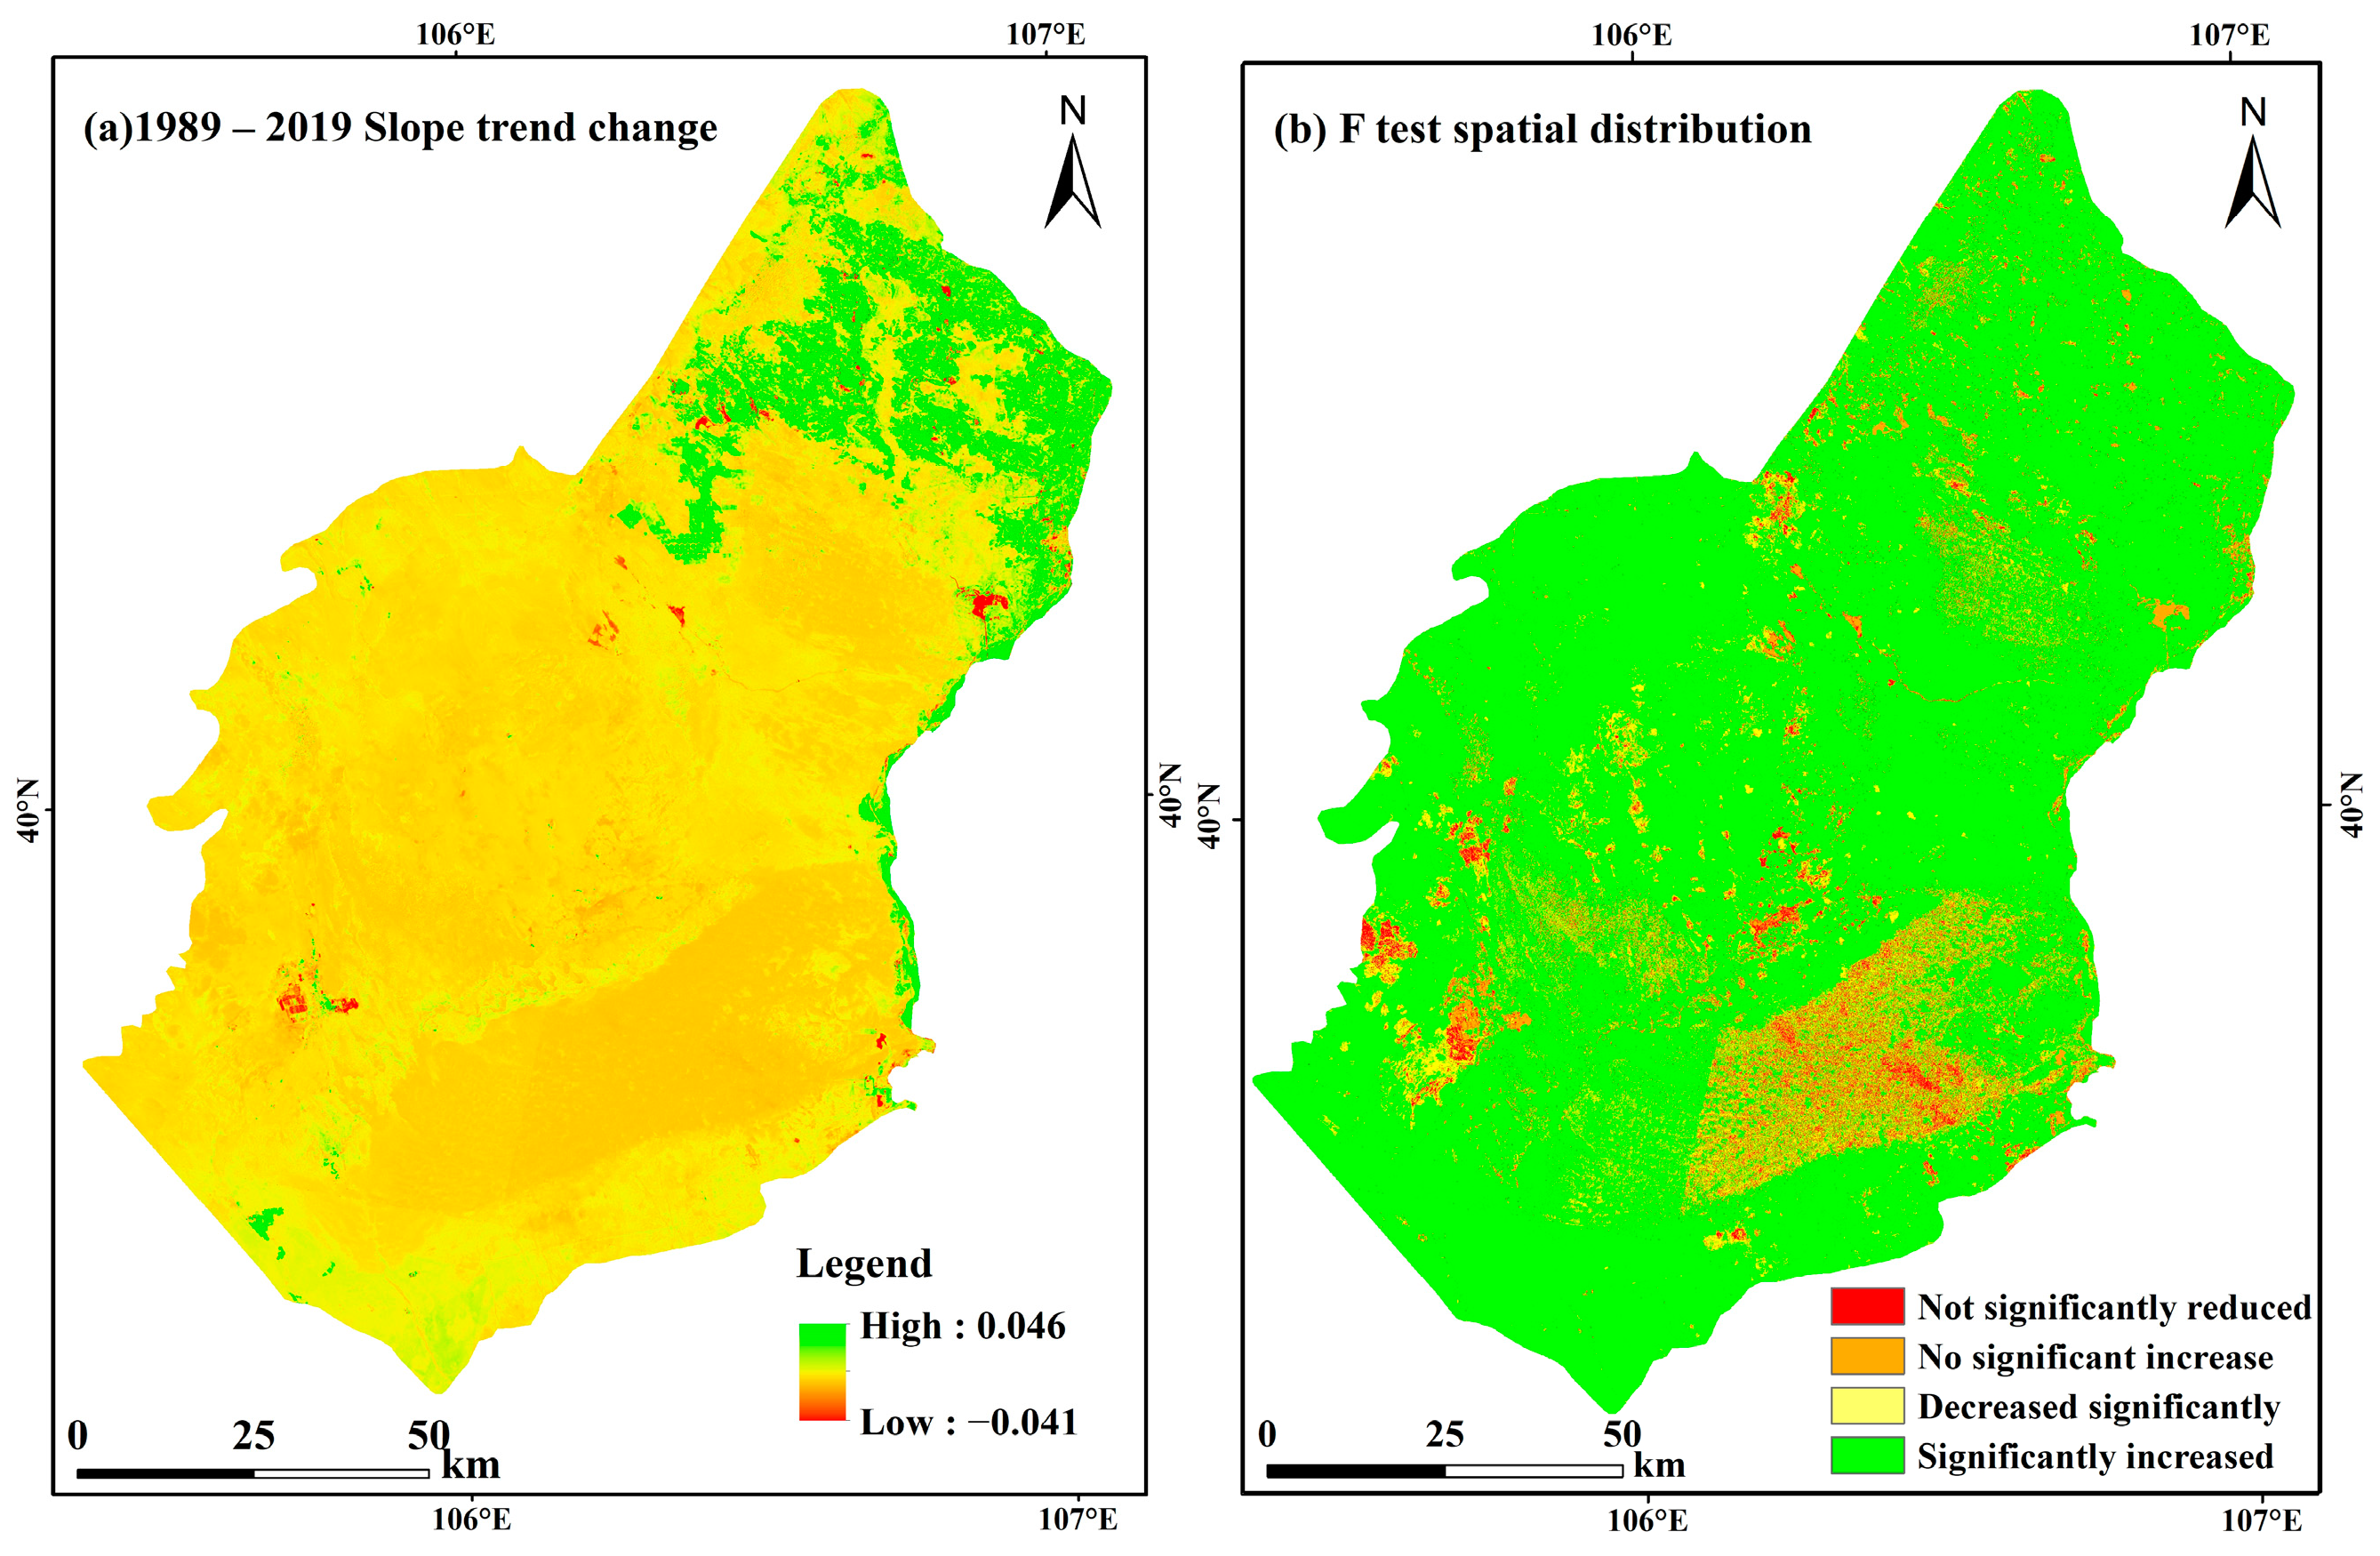
3.1. Annual NDVI from 1989 to 2019

The NDVI presents a significant upward trend in the desert (Figure 2). From 1989 to 2019, the vegetation cover grew amid fluctuations. The lowest NDVI value (0.0847) was recorded in 1995. However, the highest NDVI (0.1605) was in 2010. From 1995 to 1998, vegetation coverage increased rapidly from 0.0847 to 0.1239. However, from 1998 to 2004, the vegetation cover decreased significantly to 0.0982. Another significant increase period was from 2004 to 2010. From 1989 to 2019, vegetation cover expanded considerably in 85% of the desert area (p < 0.05) (Figure 3). Areas with substantial vegetation cover expansion were primarily located in the north, while vegetation reduction mainly occurred in the southeast edge of the Ulan Buh Desert.

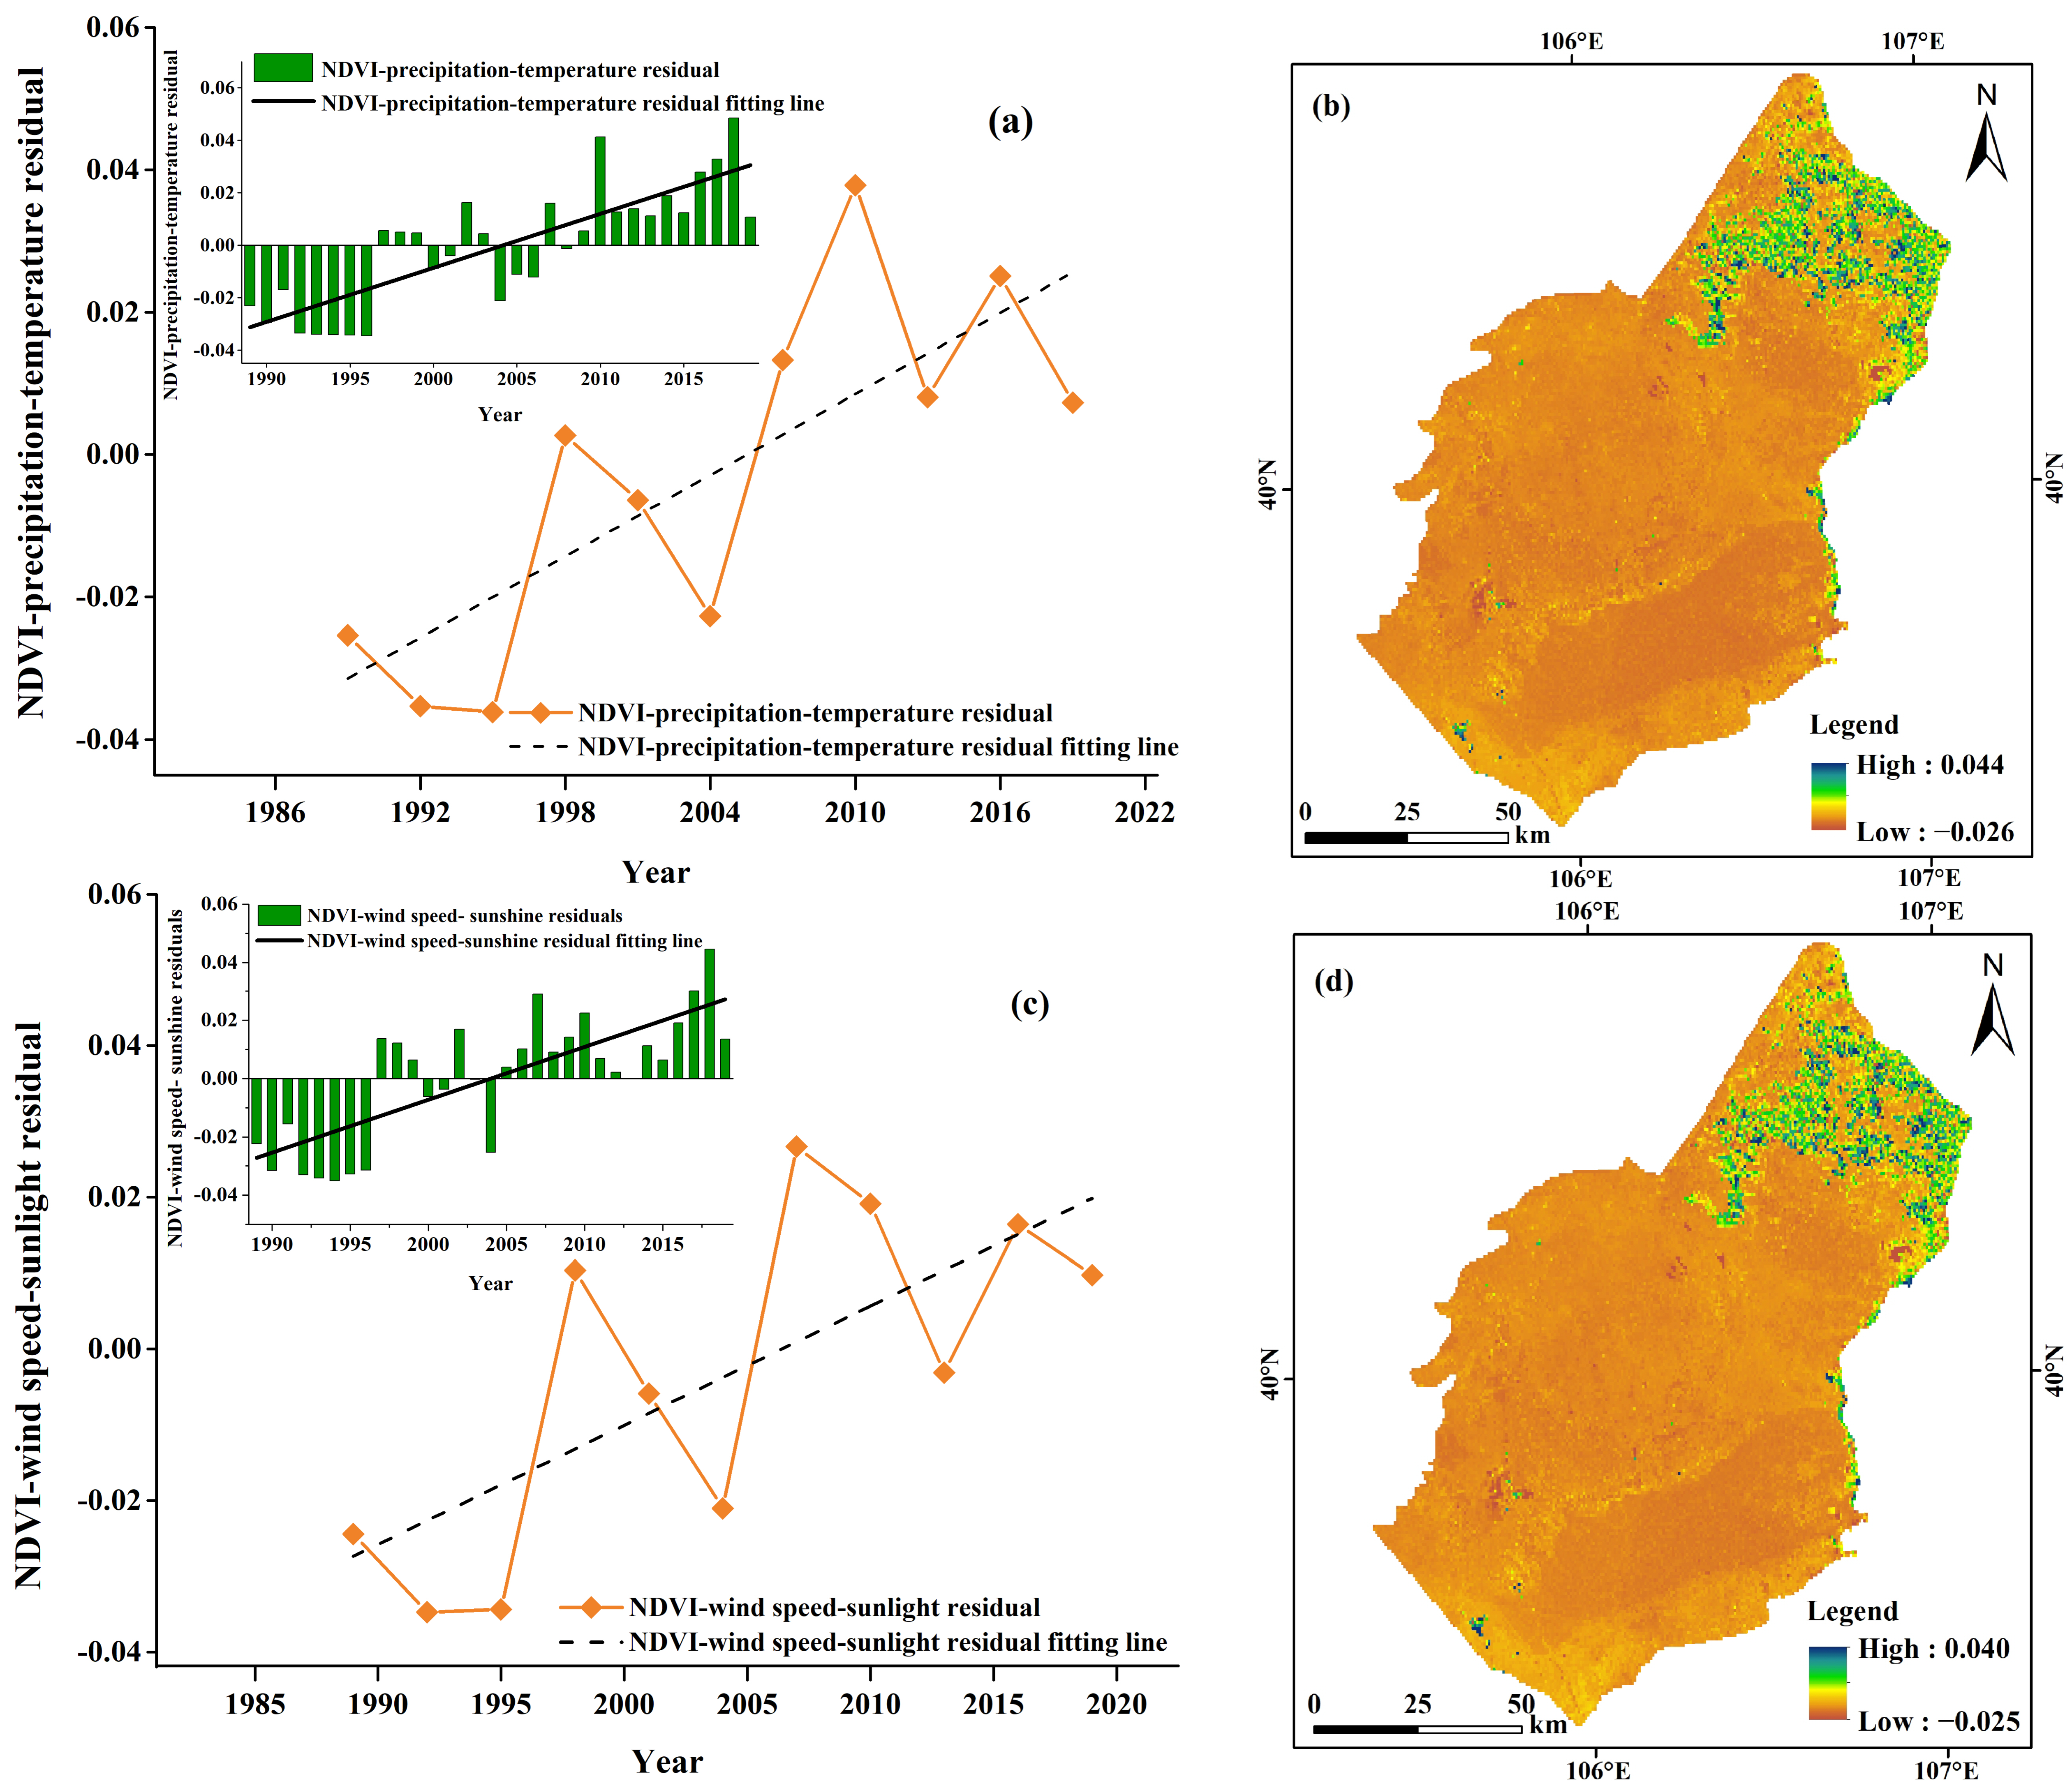
3.2. Correlations between NDVI and Climatic Factors

Regional vegetation dynamics are significantly related to climate change. The correlation between NDVI and precipitation is from −0.706 to 0.629 (−0.038 on average) (Figure 4a), with 79% of the region exhibiting a positive correlation, especially for the northeastern region (Figure 4b). For NDVI and temperature, the coefficient ranged from −0.687 to 0.902 (0.228 on average) (Figure 4c), with 80% of the Ulan Buh Desert exhibiting a positive correlation, primarily in the southern part of the desert (Figure 4d).
We further explored the relative importance of climate factors through partial correlation analysis and found temperature significantly influences vegetation change more than precipitation. The partial correlation coefficient between NDVI and precipitation ranged from −0.714 to 0.660 (−0.020 on average) (Figure 4e), with 80% of the Ulan Buh Desert showing a positive correlation, primarily in the northeast region (Figure 4f). For NDVI and average temperature, the coefficient ranged from −0.695 to 0.930 (0.225 on average) (Figure 4g), with 79% of the study area demonstrating a positive correlation, primarily in the southeast region (Figure 4h).
Lastly, the multiple correlation coefficient of the NDVI with precipitation and temperature ranged from 0 to 0.958 (0.284 on average) (Figure 4i), where 34% of the area showed significantly positive correlations (Figure 4j). Furthermore, the multiple correlation coefficient was higher than the partial correlation coefficient, indicating that climatic factors significantly influenced vegetation growth.
Both residuals of NDVI–precipitation–temperature (R2 = 0.6587, p < 0.05) and NDVI–sunshine–wind speed (R2 = 0.5806, p < 0.05) showed the same upward trend and changed from negative to positive (Figure 5a,c). It indicated that the impact of human activities on the vegetation changed from negative to positive in the Ulan Buh Desert from 1989 to 2004. Approximately 94% and 95% of the desert area exhibited rising trends in NDVI–precipitation–temperature and NDVI–sunshine–wind speed residuals, respectively (Figure 5b,d). In addition, the increasing residual values are mostly located in the northeast area of the desert and the Yellow River coast (eastern edge) due to the vegetation represented by the agricultural land shelterbelt areas.

3.3. Human Activities and Land Use Changes

The vegetation restoration caused by human activities and climatic factors accounted for approximately 35% of the total area (Figure 6). In particular, vegetation restoration caused by human activities and climatic factors comprised 60% and 1% of the study area, respectively. The extent of vegetation degradation accounted for a small proportion (2%) of the total area, mainly due to human activities. Therefore, vegetation cover is influenced by both human activities and climate, with human activities having a more significant impact on vegetation cover in the Ulan Buh Desert.
The sand and saline–alkali land areas gradually decreased from 1989 to 2019, while grasslands and cultivated lands significantly increased (Table 2). Besides, construction, unused, and forest lands had slightly increased. These trends indicate that the series of human activities played an important role in restoring the Ulan Buh Desert. Considering the national Three-North Forestation Project and the increase of cultivated lands, 2004 was set as a dividing point for transferring land use in the Ulan Buh Desert. From 1989 to 2004, grasslands, cultivated lands, and forestland increased significantly, whereas the area of sandy land decreased significantly. The construction land areas, other unused lands, water areas, and saline–alkali lands changed slightly. The transformed sandy lands, cultivated lands, and other unused lands contributed to the increase of grassland area, while the growth in cultivated land was primarily due to the transformed sandy lands and grasslands. From 2004 to 2019, grasslands and cultivated land area significantly increased in the desert region, while sandy lands and saline–alkali land decreased significantly. Slight area changes were observed in construction lands, other unused lands, forest lands, and water areas. The expanding cultivated land was primarily due to the transformed saline–alkali lands, sandy lands, grasslands, and other unused lands. The cultivated land in the Ulan Buh Desert was expanding while the population and the development of urbanization were increasing. The overlay analysis of the population density and NDVI change trend maps shows the scarce population in most Ulan Buh Desert areas (Figure 7).

4. Discussion

4.1. Climate Change and Vegetation Cover Dynamics

Climate change has profound impacts on vegetation cover dynamics in desert ecosystems [44]. Extreme temperature and precipitation are two climate change aspects that substantially impact ecological systems, especially for fragile desert ecosystems. Projections indicate that both the intensity and frequency of extremely hot temperatures and precipitation events are expected to increase [9]. As temperatures rise and precipitation patterns shift, deserts experience significant plant distribution, density, and composition alterations. One major consequence of climate change in deserts is the alteration of precipitation patterns [45]. Changes in rainfall timing, intensity, and frequency directly affect plant growth and survival. Increased drought conditions decrease vegetation cover as plants struggle to obtain sufficient water.
Conversely, vegetation cover may expand in areas experiencing increased precipitation as plants capitalize on the additional moisture. Temperature changes also play a crucial role in shaping vegetation dynamics in deserts. Rising temperatures can exacerbate water stress on plants, leading to reduced growth rates and increased mortality [46]. Furthermore, higher temperatures can alter the distribution of plant species, favoring those adapted to warmer conditions while potentially displacing others. Climate change and vegetation cover dynamics in deserts have broader ecological implications. Changes in vegetation cover can influence soil stability, nutrient cycling, and habitat availability for desert fauna. Additionally, alterations in plant communities may impact ecosystem services such as carbon sequestration and water infiltration, with potential consequences for global climate regulation.
Past studies have shown a forceful correlation between precipitation and NDVI, particularly in arid/semi-arid regions [47,48]. The results from the Mu Us Desert indicated that each county’s average temperature of the growing season and NDVI show a significant positive correlation [49]. Nevertheless, the relative impact of precipitation and temperature on vegetation cover in arid areas varies between regions. In the Ferghana basin, temperature and precipitation have varying effects on vegetation NDVI growth across seasons, with spring seeing positive contributions from both, summer showing temperature’s negative impact countered by precipitation, and fall experiencing inhibiting effects from both factors [50].
Altitude and season can also influence the relative contribution to vegetation between precipitation and temperature. For example, it was observed in Gilgit Baltistan that vegetation exhibits a more pronounced response to precipitation than to temperature during summer at lower elevations, while the reverse is true during spring [51]. At the national scale, it was found that NDVI has a strong positive correlation with temperature, whereas its correlation with precipitation is weakly positive [1]. In the current study, temperature significantly impacts vegetation change more than precipitation (Figure 4). This might be because the increase in vegetation cover was mainly due to the northern and eastern parts of the desert, where the Yellow River could provide water. Therefore, temperature could be a plant-growth-limiting factor in the region compared to precipitation. Understanding the intricate interactions between vegetation dynamics and climate change in desert ecosystems is essential for effective conservation and management strategies. By monitoring and predicting shifts in vegetation cover, policymakers and land managers can develop adaptive measures to reduce the effects of climate change on deserts and enhance their resilience in the face of ongoing environmental changes.

4.2. Human Activities and Vegetation Cover Dynamics

Human activities had a more crucial role in increasing vegetation cover in arid/semi-arid areas compared to the climatic factors. Residents’ activities and national policy have dramatic impacts on the vegetation cover. Since the turn of the millennium, China has pursued numerous ecological restoration initiatives, including programs such as “Returning Farmland to Forest”, “Natural Forest Protection”, and the establishment of the “Three-North” Shelterbelt [52,53]. These afforestation projects are crucial in desertification control. Following the implementation of the first large-scale restoration program in 1978, 46% of China’s drylands exhibited significant land improvement or increased vegetation greenness [20]. Vegetation (NDVI) in the Ferghana Basin was influenced by climate change at a rate of 62.32% and human activities at a rate of 93.29% [50]. As a result of comprehensive desertification control measures [7,20], this desert area continued to decrease in size from 1989 to 2019 (Table 2). Furthermore, saline–alkali land decreased between 2004 and 2019 (Table 2) due to good vegetation restoration and soil improvement [20]. Thus, human-activity-driven land use change can be considered one of the main factors of vegetation change [1,54]. The policy of returning grazing lands to grasslands also played a role in vegetation restoration. Introduced in 2003, this policy prohibited grazing and introduced regional rotational grazing measures. Clearly, the results showed that the introduction of this policy has promoted vegetation restoration [55].
Population migration can also change land use and vegetation [1]. An appropriate population density can maintain the stable growth of vegetation, whereas excessive density will have a destructive effect on it. Large-scale urbanization converts previously cultivated land, grasslands, and forest lands into construction lands. High population migration tends to increase the construction land area for economically developed regions; thus, human activities inhibit the regional NDVI in areas with rapid economic development [7]. However, this study found that population increase is positive for increasing vegetation coverage (Figure 6). The trends in population and vegetation distributions are similar, with most of the population concentrated in the northeastern part of the desert. The high vegetation coverage in this area indicates that people tend to live in areas with good vegetation conditions. The farmland and grassland area increased due to the population growth. The findings showed that between 1990 and 2006, 43% of the enhancement of the local vegetation was attributed to human activities, a figure that surged to 90.9% from 2007 to 2022 in the Ulan Buh Desert [2].
Afforestation is the primary human activity in combating desertification, and while often lauded for its environmental benefits, it can also have significant implications for water resource management. Establishing a new tree cover requires substantial water inputs, particularly during the initial establishment phase. This demand for water may exacerbate existing water scarcity issues, especially in regions already facing water½ stress or drought conditions [56,57]. Consequently, diversifying water for afforestation purposes may lead to conflicts with other sectors dependent on the same water sources, such as agriculture or municipal supply systems. Therefore, it is important to choose suitable tree species to avoid the impacts on the local water resources. In Ulan Buh Desert, Haloxylon ammodendron (C.A.Mey.) Bunge ex Fenzl and A. desertorum are drought- and salt-tolerant and were planted to confront desertification. Currently inoculating the roots of H. ammodendron with Cistanche deserticola Ma, a valuable Chinese medicine herb, has generated remarkable economic and social benefits to local agriculture [58]. Driven by the profit, the H. ammodendron and C. deserticola production area has increased significantly, which has also increased the vegetation cover in the area. Therefore, while afforestation holds promise as a tool for ecological restoration, careful consideration should be addressed in selecting suitable crops, mobilizing local people’s enthusiasm, and providing integrated environmental, economic, and social benefits.

4.3. Land Planning and Management Implications

The findings from this study highlight the critical role of land planning and management in sustaining ecosystem health and combating desertification in arid regions like the Ulan Buh Desert. The research underscores the necessity of integrating both climatic factors and human activities into land management strategies to enhance vegetation cover. Effective land use planning that considers the spatial and temporal impacts of temperature and precipitation on vegetation can help maintain the delicate balance required for ecosystem stability [59,60,61]. By prioritizing areas with favorable climatic conditions for afforestation and vegetation restoration, policymakers can optimize the use of limited resources and ensure long-term ecological benefits [62,63].
Moreover, the study’s results indicate that human activities, particularly those driven by government policies and individual land-use practices, are the primary drivers of vegetation changes in the Ulan Buh Desert. This finding suggests that sustainable land management practices, supported by tailored governmental policies, are essential for achieving desired ecological outcomes [64]. For instance, the success of China’s afforestation programs in increasing vegetation cover from 1989 to 2004 highlights the potential of well-designed policies to promote positive environmental change [65]. To sustain these gains, it is crucial for land managers to continue encouraging afforestation and reforestation efforts while carefully regulating agricultural expansion to prevent over-exploitation of the land [66].
Finally, the study emphasizes the importance of balancing economic development with environmental conservation in land planning. The significant role of farmland reclamation in driving vegetation restoration between 2004 and 2019 demonstrates the potential for agricultural activities to contribute positively to ecosystem health when managed sustainably [63]. However, to ensure that agricultural expansion does not lead to long-term degradation, land planners and policymakers must develop strategies that support sustainable farming practices [67]. This includes incentivizing farmers to adopt practices that enhance vegetation cover, such as agroforestry, and ensuring that agricultural policies align with broader environmental goals [68]. By doing so, land planning and management can achieve a dual purpose: supporting economic development while preserving the ecological integrity of arid and semiarid regions [69].

4.4. Limitations and Reflections on Future Research

The current study investigated how climate conditions and human activities have influenced the vegetation cover in the Ulan Buh Desert. Although the present study has made progress in understanding vegetation cover in the Ulan Buh Desert, there are limitations to consider. First, due to data constraints, only vegetation responses were analyzed during the vigorous growth period, leaving other growth stages unexplored. Second, the study focused solely on the influences of meteorological parameters and human activities on vegetation cover without considering other potential factors such as soil texture, vegetation types, etc. Furthermore, the study did not delve deeply into the complex relationship between vegetation and land use change due to technical and resource limitations.
Reflecting on the limitations identified in this study opens avenues for future research to deepen our understanding of the vegetation dynamics in the Ulan Buh Desert. First, expanding the temporal scope of analysis beyond the vigorous growth period could offer insights into vegetation responses across various growth stages, shedding light on seasonal fluctuations and long-term trends. Second, future investigations could adopt a more holistic approach by considering additional factors such as soil texture, vegetation types, and ecological interactions, thereby providing a more comprehensive understanding of the drivers of vegetation cover change. Moreover, delving into the intricate relationship between vegetation and land use change, albeit challenging due to technical and resource constraints, holds promise for elucidating the complex dynamics shaping desert ecosystems. By addressing these limitations, future research endeavors can contribute to more robust assessments and informed management strategies for sustaining desert biodiversity and ecosystem services.

5. Conclusions

The current study quantitatively investigated the impacts of several climatic factors and some human activities on vegetation changes at spatiotemporal scales to discover the driving factors of vegetation cover change in the Ulan Buh Desert. Both climatic and human activities positively increased vegetation cover in the Ulan Buh Desert. Afforestation, which was dominated by government policy, played an essential role in increasing the vegetation cover from 1989 to 2004. However, farmland reclamation, which was motivated by the farmers’ private interests, played an important role from 1989 to 2019. Overall, the vegetation cover changes in the Ulan Buh Desert exhibited a positive trend, with human activities serving as the main driving factors. This study confirms the effectiveness of China’s afforestation policies in combating land desertification. It emphasizes the importance of farmers’ sustainable land management practices in increasing vegetation cover. Tailored governmental policies are necessary to support the appropriate agricultural expansion in the Ulan Buh Desert, ensuring both economic benefits and improved vegetation coverage.

Author Contributions

Y.L.; conceptualization, methodology, software, writing—original draft preparation, and writing—review and editing. F.Q.: conceptualization, methodology, writing-review and editing, and supervision. P.T.; methodology and writing—review and editing. Z.Y.; methodology and software. L.L.; writing—review and editing and supervision. L.Y.; writing—review and editing and supervision. T.T.; writing—review and editing. All authors have read and agreed to the published version of the manuscript.

Funding

Funding was provided by the the Accurate identification of ecological restoration space and intelligent soil and water conservation technology in ten Kongdui basins of the Yellow River (Funder: Inner Mongolia Autonomous Region Science and Technology Bureau, Hohhot, China, 2021GG0052), The project of Evaluation of carbon sequestration capacity of typical ecological restoration model in Ordos City and study on improving quality and efficiency technology (Funder: Agricultural, Livestock and Water Resources Business Development Centre, Kangbashi District, Ordos City, China, Funding number: 2022EEDSKJXM003), The impact mechanism of the exposed bedrock patterns on soil erosion of Gully steep slopes in the Area of complex Erosion by Wind and Water (Funder: Open project of Key Laboratory of Soil and Water Conservation on Loess Plateau, Ministry of Water Resources, Beijing, China, WSCLP202302), The Inner Mongolia Unveils Leading Technology Innovation Project (Funder: Department of Science and Technology of Inner Mongolia Autonomous Region, Hohhot, China, Funding number: 2024JBGS0021-4-2), The Inner Mongolia Autonomous Region Youth Science Foundation (Funder: Department of Science and Technology of Inner Mongolia Autonomous Region, Hohhot, China, Funding number: 2024QN03062).

Data Availability Statement

The original contributions presented in the study are included in the article, further inquiries can be directed to the corresponding author or first author.

Conflicts of Interest

The authors declare no conflicts of interest.

References

  1. Du, J.; Quan, Z.; Fang, S.; Liu, C.; Wu, J.; Fu, Q. Spatiotemporal changes in vegetation coverage and its causes in China since the Chinese economic reform. Environ. Sci. Pollut. Res. 2020, 27, 1144–1159. [Google Scholar] [CrossRef]
  2. Yan, Y.; Zhou, J.; Feng, W.; Li, X.; Xin, Z.; Xie, J.; Xi, J.; Cheng, Y. Study of Changes in the Ulan Buh Desert under the Dual Impacts of Desert Farmland Development and Climate Change. Plants 2023, 12, 3510. [Google Scholar] [CrossRef]
  3. Li, X.; Tan, H.; He, M.; Wang, X.; Li, X. Patterns of shrub species richness and abundance in relation to environmental factors on the Alxa Plateau: Prerequisites for conserving shrub diversity in extreme arid desert regions. Sci. China Ser. D Earth Sci. 2009, 52, 669–680. [Google Scholar] [CrossRef]
  4. Tong, S.; Zhang, J.; Bao, Y.; Wurina; Terigele; Weilisi; Lianxiao. Spatial and temporal variations of vegetation cover and the relationships with climate factors in Inner Mongolia based on GIMMS NDVI3g data. J. Arid. Land. 2017, 9, 394–407. [Google Scholar] [CrossRef]
  5. Zhao, P.; Qu, J.; Xu, X.; Yu, Q.; Jiang, S.; Zhao, H. Desert vegetation distribution and species-environment relationships in an oasis-desert ecotone of northwestern China. J. Arid. Land. 2019, 11, 461–476. [Google Scholar] [CrossRef]
  6. Ma, L.; Wang, J.; Liu, T.; Huang, X.; Liu, D.; Li, H. Response relationship between vegetation and climate factors in horqin sandy land from 2000 to 2012. Trans. Chin. Soc. Agric. Mach 2016, 47, 162–172. [Google Scholar]
  7. Wang, H.; Yao, F.; Zhu, H.; Zhao, Y. Spatiotemporal variation of vegetation coverage and its response to climate factors and human activities in arid and semi-arid areas: Case study of the Otindag Sandy Land in China. Sustainability 2020, 12, 5214. [Google Scholar] [CrossRef]
  8. Zhou, P.; Zhao, D.; Liu, X.; Duo, L.; He, B.-J. Dynamic change of vegetation index and its influencing factors in alxa league in the arid area. Front. Ecol. Evol. 2022, 10, 922739. [Google Scholar] [CrossRef]
  9. Li, C.; Zwiers, F.; Zhang, X.B.; Li, G.L.; Sun, Y.; Wehner, M. Changes in Annual Extremes of Daily Temperature and Precipitation in CMIP6 Models. J. Clim. 2021, 34, 3441–3460. [Google Scholar] [CrossRef]
  10. Meng, X.; Gao, X.; Li, S.; Lei, J. Spatial and temporal characteristics of vegetation NDVI changes and the driving forces in Mongolia during 1982–2015. Remote Sens. 2020, 12, 603. [Google Scholar] [CrossRef]
  11. Wang, H.; Li, Z.; Cao, L.; Feng, R.; Pan, Y. Response of NDVI of natural vegetation to climate changes and drought in China. Land 2021, 10, 966. [Google Scholar] [CrossRef]
  12. Du, Z.; Zhang, X.; Xu, X.; Zhang, H.; Wu, Z.; Pang, J. Quantifying influences of physiographic factors on temperate dryland vegetation, Northwest China. Sci. Rep. 2017, 7, 40092. [Google Scholar] [CrossRef]
  13. Guo, J.; Hu, Y.; Xiong, Z.; Yan, X.; Ren, B.; Bu, R. Spatiotemporal variations of growing-season NDVI and response to climate change in permafrost zone of Northeast China. Chin. J. Appl. Ecol. 2017, 28, 2413–2422. [Google Scholar]
  14. Baniya, B.; Tang, Q. Vegetation Dynamics in Response to Climate Change Based on Satellite Derived NDVI in Nepal. In EGU General Assembly Conference Abstracts; 2018; p. 91. Available online: https://meetingorganizer.copernicus.org/EGU2018/EGU2018-91.pdf (accessed on 9 May 2024).
  15. Li, X.; Yang, L. Accelerated restoration of vegetation in Wuwei in the arid region of Northwestern China since 2000 driven by the Interaction between climate and human beings. Remote Sens. 2023, 15, 2675. [Google Scholar] [CrossRef]
  16. He, Y.; Yan, H.; Ma, L.; Zhang, L.; Qiu, L.; Yang, S. Spatiotemporal dynamics of the vegetation in Ningxia, China using MODIS imagery. Front. Earth Sci. 2020, 14, 221–235. [Google Scholar] [CrossRef]
  17. Ding, M.; Shen, Z.; Zhang, Y.; Liu, L.; Zhang, W.; Wang, Z.; Bai, W. Vegetation change along the Qinghai-Xizang highway and railway from 1981 to 2001. Resour. Sci. 2005, 27, 128–133. [Google Scholar]
  18. Sun, J.; Hou, G.; Liu, M.; Fu, G.; Zhan, T.; Zhou, H.; Tsunekawa, A.; Haregeweyn, N. Effects of climatic and grazing changes on desertification of alpine grasslands, Northern Tibet. Ecol. Indic. 2019, 107, 105647. [Google Scholar] [CrossRef]
  19. Cao, S.; Chen, L.; Shankman, D.; Wang, C.; Wang, X.; Zhang, H. Excessive reliance on afforestation in China’s arid and semi-arid regions: Lessons in ecological restoration. Earth-Sci. Rev. 2011, 104, 240–245. [Google Scholar] [CrossRef]
  20. Li, C.; Fu, B.; Wang, S.; Stringer, L.C.; Wang, Y.; Li, Z.; Liu, Y.; Zhou, W. Drivers and impacts of changes in China’s drylands. Nat. Rev. Earth Environ. 2021, 2, 858–873. [Google Scholar] [CrossRef]
  21. Wang, F.; An, P.; Huang, C.; Zhang, Z.; Hao, J. Is afforestation-induced land use change the main contributor to vegetation dynamics in the semiarid region of North China? Ecol. Indic. 2018, 88, 282–291. [Google Scholar] [CrossRef]
  22. Liu, Y.; Lei, H. Responses of natural vegetation dynamics to climate drivers in China from 1982 to 2011. Remote Sens. 2015, 7, 10243–10268. [Google Scholar] [CrossRef]
  23. Tang, R.; Zhao, X.; Zhou, T.; Jiang, B.; Wu, D.; Tang, B. Assessing the impacts of urbanization on albedo in Jing-Jin-Ji Region of China. Remote Sens. 2018, 10, 1096. [Google Scholar] [CrossRef]
  24. Liu, Z.; Liu, Y.; Li, Y. Anthropogenic contributions dominate trends of vegetation cover change over the farming-pastoral ecotone of northern China. Ecol. Indic. 2018, 95, 370–378. [Google Scholar] [CrossRef]
  25. Li, G.; Yu, L.; Liu, T.; Bao, Y.; Yu, J.; Xin, B.; Bao, L.; Li, X.; Chang, X.; Zhang, S. Spatial and temporal variations of grassland vegetation on the Mongolian Plateau and its response to climate change. Front. Ecol. Evol. 2023, 11, 1067209. [Google Scholar] [CrossRef]
  26. Han, J.-C.; Huang, Y.; Zhang, H.; Wu, X. Characterization of elevation and land cover dependent trends of NDVI variations in the Hexi region, northwest China. J. Environ. Manag. 2019, 232, 1037–1048. [Google Scholar] [CrossRef]
  27. Wang, J.F.; Li, X.H.; Christakos, G.; Liao, Y.L.; Zhang, T.; Gu, X.; Zheng, X.Y. Geographical detectors-based health risk assessment and its application in the neural tube defects study of the Heshun Region, China. Int. J. Geogr. Inf. Sci. 2010, 24, 107–127. [Google Scholar] [CrossRef]
  28. Nie, T.; Dong, G.; Jiang, X.; Lei, Y. Spatio-temporal changes and driving forces of vegetation coverage on the loess plateau of Northern Shaanxi. Remote Sens. 2021, 13, 613. [Google Scholar] [CrossRef]
  29. Peng, W.; Kuang, T.; Tao, S. Quantifying influences of natural factors on vegetation NDVI changes based on geographical detector in Sichuan, western China. J. Clean. Prod. 2019, 233, 353–367. [Google Scholar] [CrossRef]
  30. Zhu, L.; Meng, J.; Zhu, L. Applying Geodetector to disentangle the contributions of natural and anthropogenic factors to NDVI variations in the middle reaches of the Heihe River Basin. Ecol. Indic. 2020, 117, 106545. [Google Scholar] [CrossRef]
  31. Yang, L.; Guan, Q.; Lin, J.; Tian, J.; Tan, Z.; Li, H. Evolution of NDVI secular trends and responses to climate change: A perspective from nonlinearity and nonstationarity characteristics. Remote Sens. Environ. 2021, 254, 112247. [Google Scholar] [CrossRef]
  32. He, Q.; Huang, B. Satellite-based mapping of daily high-resolution ground PM2. 5 in China via space-time regression modeling. Remote Sens. Environ. 2018, 206, 72–83. [Google Scholar] [CrossRef]
  33. Gallegati, M. A systematic wavelet-based exploratory analysis of climatic variables. Clim. Chang. 2018, 148, 325–338. [Google Scholar] [CrossRef]
  34. Lin, Y.; Franzke, C.L. Scale-dependency of the global mean surface temperature trend and its implication for the recent hiatus of global warming. Sci. Rep. 2015, 5, 12971. [Google Scholar] [CrossRef]
  35. Telesca, L.; Lasaponara, R. Discriminating dynamical patterns in burned and unburned vegetational covers by using SPOT-VGT NDVI data. Geophys. Res. Lett. 2005, 32, 1–4. [Google Scholar] [CrossRef]
  36. Shang, H.; Zhan, H.Z.; Ni, W.K.; Liu, Y.; Gan, Z.H.; Liu, S.H. Surface Environmental Evolution Monitoring in Coal Mining Subsidence Area Based on MultiSource Remote Sensing Data. Front. Earth Sci. 2022, 10, 790737. [Google Scholar] [CrossRef]
  37. Qin, P.; Zhang, Z.H. RETRACTED ARTICLE: Evolution of wetland landscape disturbance in Jiaozhou Gulf between 1973 and 2018 based on remote sensing. Eur. J. Remote Sens. 2021, 54 (Suppl. S2), 145–154. [Google Scholar] [CrossRef]
  38. Zheng, Y.; Liu, H.; Zhuo, Y. Dynamic changes and driving factors of wetlands in Inner Mongolia Plateau, China. PLoS ONE 2019, 14, e0221177. [Google Scholar] [CrossRef]
  39. McGrath, D.; Zhang, C.; Carton, O.T. Geostatistical analyses and hazard assessment on soil lead in Silvermines area, Ireland. Environ. Pollut. 2004, 127, 239–248. [Google Scholar] [CrossRef]
  40. Ozturk, D.; Kilic, F. Geostatistical Approach for Spatial Interpolation of Meteorological Data. An. Acad. Bras. Cienc. 2016, 88, 2121. [Google Scholar] [CrossRef]
  41. Felix, M.L.; Jung, K. Impacts of Spatial Interpolation Methods on Daily Streamflow Predictions with SWAT. Water 2022, 14, 3340. [Google Scholar] [CrossRef]
  42. Fagandini, C.; Todaro, V.; Tanda, M. Missing Rainfall Daily Data: A Comparison Among Gap-Filling Approaches. Math. Geosci. 2023, 56, 191–217. [Google Scholar] [CrossRef]
  43. Liu, X.; Pan, Y.; Zhu, X.; Li, S. Spatiotemporal variation of vegetation coverage in Qinling-Daba Mountains in relation to environmental factors. Acta Geogr. Sin. 2015, 70, 705–716. [Google Scholar]
  44. Bai, X.; Zhao, W.; Luo, W.; An, N. Effect of climate change on the seasonal variation in photosynthetic and non-photosynthetic vegetation coverage in desert areas, Northwest China. Catena 2024, 239, 107954. [Google Scholar] [CrossRef]
  45. Li, F.; Zhao, W.Z.; Liu, H. Productivity responses of desert vegetation to precipitation patterns across a rainfall gradient. J. Plant Res. 2015, 128, 283–294. [Google Scholar] [CrossRef]
  46. Hantson, S.; Huxman, T.E.; Kimball, S.; Randerson, J.T.; Goulden, M.L. Warming as a Driver of Vegetation Loss in the Sonoran Desert of California. J. Geophys. Res. Biogeosci. 2021, 126, e2020JG005942. [Google Scholar] [CrossRef]
  47. Lamchin, M.; Wang, S.W.; Lim, C.-H.; Ochir, A.; Pavel, U.; Gebru, B.M.; Choi, Y.; Jeon, S.W.; Lee, W.-K. Understanding global spatio-temporal trends and the relationship between vegetation greenness and climate factors by land cover during 1982–2014. Glob. Ecol. Conserv. 2020, 24, e01299. [Google Scholar] [CrossRef]
  48. Nanzad, L.; Zhang, J.; Tuvdendorj, B.; Nabil, M.; Zhang, S.; Bai, Y. NDVI anomaly for drought monitoring and its correlation with climate factors over Mongolia from 2000 to 2016. J. Arid Environ. 2019, 164, 69–77. [Google Scholar] [CrossRef]
  49. Sun, Z.; Mao, Z.; Yang, L.; Liu, Z.; Han, J.; Wanag, H.; He, W. Impacts of climate change and afforestation on vegetation dynamic in the Mu Us Desert, China. Ecol. Indic. 2021, 129, 108020. [Google Scholar] [CrossRef]
  50. Zhang, H.; Li, L.; Zhao, X.; Chen, F.; Wei, J.; Feng, Z.; Hou, T.; Chen, Y.; Yue, W.; Shang, H.; et al. Changes in Vegetation NDVI and Its Response to Climate Change and Human Activities in the Ferghana Basin from 1982 to 2015. Remote Sens. 2024, 16, 1296. [Google Scholar] [CrossRef]
  51. Satti, Z.; Naveed, M.; Shafeeque, M.; Li, L. Investigating the impact of climate change on trend shifts of vegetation growth in Gilgit Baltistan. Glob. Planet. Chang. 2024, 232, 104341. [Google Scholar] [CrossRef]
  52. Dai, L.; Li, S.; Zhou, W.; Qi, L.; Zhou, L.; Wei, Y.; Li, J.; Shao, G.; Yu, D. Opportunities and challenges for the protection and ecological functions promotion of natural forests in China. For. Ecol. Manag. 2018, 410, 187–192. [Google Scholar] [CrossRef]
  53. Li, W.; Chen, J.; Zhang, Z. Forest quality-based assessment of the Returning Farmland to Forest Program at the community level in SW China. For. Ecol. Manag. 2020, 461, 117938. [Google Scholar] [CrossRef]
  54. Zhang, J.; Niu, J.; Bao, T.; Buyantuyev, A.; Zhang, Q.; Dong, J.; Zhang, X. Human induced dryland degradation in Ordos Plateau, China, revealed by multilevel statistical modeling of normalized difference vegetation index and rainfall time-series. J. Arid. Land. 2014, 6, 219–229. [Google Scholar] [CrossRef]
  55. Wang, T.; Xue, X.; Zhou, L.; Guo, J. Combating aeolian desertification in northern China. Land. Degrad. Dev. 2015, 26, 118–132. [Google Scholar] [CrossRef]
  56. Wang, H.; Liu, Y.; Wang, Y.; Yao, Y.; Wang, C. Land cover change in global drylands: A review. Sci. Total Environ. 2023, 863, 160943. [Google Scholar] [CrossRef] [PubMed]
  57. Jia, X.; Shao, M.; Zhu, Y.; Luo, Y. Soil moisture decline due to afforestation across the Loess Plateau, China. J. Hydrol. 2017, 546, 113–122. [Google Scholar] [CrossRef]
  58. Li, J. Life Cycle Sustainability Assessment on the Cistanche Deserticola Industry in the Ulan Buh Desert; Inner Mongolia Agricultural University: Hohhot, China, 2023. [Google Scholar]
  59. Machiwa, H.; Tian, B.; Sengupta, D.; Chen, Q.; Meadows, M.; Zhou, Y. Vegetation dynamics in response to human and climatic factors in the Tanzanian Coas. Front. Earth Sci. 2021, 15, 595–605. [Google Scholar] [CrossRef]
  60. Ning, C.; Subedi, R.; Hao, L. Land Use/Cover Change, Fragmentation, and Driving Factors in Nepal in the Last 25 Years. Sustainability 2023, 15, 6957. [Google Scholar] [CrossRef]
  61. Vieira, R.M.D.; Tomasella, J.; Barbosa, A.A.; Martins, M.A.; Rodriguez, D.A.; Rezende, F.S.; Carriello, F.; Santana, M.D. Desertification risk assessment in Northeast Brazil: Current trends and future scenarios. Land Degrad. Dev. 2020, 32, 224–240. [Google Scholar] [CrossRef]
  62. Liu, Y.; Qin, F.; Li, L.; Dong, X.; Liu, L.; Yang, L. The Long-Term Effects of Barren Land Afforestation on Plant Productivity, Soil Fertility, and Soil Moisture in China: A Meta-Analysis. Plants 2024, 13, 1614. [Google Scholar] [CrossRef]
  63. Yang, G.; Li, J.; Zhou, L. Considerations on Forest Changes of Northwest China in Past Seven Decades. Front. Environ. Sci. 2021, 9, 589896. [Google Scholar]
  64. Yan, Q.; Zhu, J.; Hu, Z.; Sun, O. Environmental impacts of the shelter forests in horqin sandy land, northeast china. J. Environ. Qual. 2011, 40, 815. [Google Scholar] [CrossRef] [PubMed]
  65. Zheng, L.; Lu, J.; Liu, H.; Chen, X.; Yesou, H. Evidence of vegetation greening benefitting from the afforestation initiatives in China. Geo-Spat. Inf. Sci. 2023, 27, 683–702. [Google Scholar] [CrossRef]
  66. Yan, H.; Lai, C.; Akshalov, K.; Qin, Y.; Zhen, L. Social institution changes and their ecological impacts in kazakhstan over the past hundred years. Environ. Dev. 2020, 34, 100531. [Google Scholar] [CrossRef]
  67. Ma, D.; He, Z.; Ju, W.; Zhao, W.; Zhao, P.; Wang, W.; Lin, P. Long-term conventional cultivation after desert reclamation is not conducive to the improvement of soil carbon pool and nutrient stocks, a case study from northwest China. Geoderma 2024, 445, 116893. [Google Scholar] [CrossRef]
  68. Chen, H.; Lopez-Carr, D.; Tan, Y.; Xi, J.; Liang, X. China’s Grain for Green policy and farm dynamics: Simulating household land-use responses. Reg. Environ. Chang. 2016, 16, 1147–1159. [Google Scholar] [CrossRef]
  69. Mao, D.; Wang, Z.; Wu, B.; Zeng, Y.; Luo, L.; Zhang, B. Land degradation and restoration in the arid and semiarid zones of China: Quantified evidence and implications from satellites. Land. Degrad. Dev. 2018, 29, 3841–3851. [Google Scholar] [CrossRef]
Figure 1. Geographical location of the Ulan Buh Desert (http://www.gscloud.cn/search (accessed on 11 February 2022).
Forests 15 01583 g001
Figure 2. NDVI in the Ulan Buh Desert from 1989 to 2019.
Forests 15 01583 g002
Figure 3. Spatial distributions of slope trend changes (a) and F test (b) in the Ulan Buh Desert from 1989 to 2019.
Forests 15 01583 g003
Figure 4. NDVI–precipitation correlation analysis and significance test (a,b), NDVI–temperature correlation analysis and significance test (c,d), NDVI–precipitation partial correlation analysis and significance test (e,f), NDVI–temperature partial correlation analysis and significance test (g,h), and NDVI–precipitation-temperature complex correlation analysis and significance test (i,j). The above picture represents data for the period 1989–2019.
Forests 15 01583 g004
Figure 5. NDVI–temperature-precipitation residual change trend time distribution (a), NDVI–precipitation-temperature residual spatial variation trend (b), NDVI–wind speed-sunlight residual change trend time distribution (c), and NDVI–sunshine–wind speed residual spatial variation trend (d).
Forests 15 01583 g005
Figure 6. Spatial distribution of the driving factors of vegetation restoration and degradation in the Ulan Buh Desert.
Forests 15 01583 g006
Figure 7. The average population density during 1990–2019 (a) and population density variation during 1990–2019 (b), inhabitants /km2.
Forests 15 01583 g007
Table 1. Properties of used meteorological and population data.
DataDateTemporal ResolutionNo. ImagesProduct Name
NDVI1989–201916 days124Landsat 4-5TM and Landsat 8 OLI_TIRS Satellite digital products
Precipitation1989–2019Monthly372Basic Meteorological Observation Data on the Ground in China
Temperature1989–2019Monthly372Basic Meteorological Observation Data on the Ground in China
Wind speed1989–2019Monthly372Basic Meteorological Observation Data on the Ground in China
Sunshine1989–2019Monthly372Basic Meteorological Observation Data on the Ground in China
DEMPhase IPhase I9ASTER GDEM 30M resolution digital elevation data
Land cover1989–2019Annually124Landsat 4-5TM and Landsat 8 OLI_TIRS Satellite digital products
Population1995–2019-6China Population Spatial Distribution Kilometer Grid Dataset
Table 2. Land use transfer matrix in the Ulan Buh Desert from 1989 to 2019 (Unit: km2).
PeriodTypes12345678
1187.47181.31220.00182.31030.00271.838719.3410.0081
29.85956470.11620.021630.631516.5411114.17854.312812.2472
198930.00090.015357.25350.35730.00720.05670.01080.0036
41.61285.11291.1016441.56790.26124.08670.30963.7755
200450.06660.06840.40320.7713107.12612.15550.03150.828
67.437615.18930.484230.94650.93781748.4813118.12686.2316
74.96260.4410.01538.07392.2779129.24994337.58421.4679
81.51836.86790.00360.96120.28084.82850.6012244.584
179.173924.56015.575574.89260.764117.79845.65474.5108
23.32735289.643835.5545290.623535.3403427.7034381.93335.0082
200430.00630.209725.433125.68420.05044.08420.30783.5091
40.87214.51891.4598495.12780.53828.63013.78450.6966
201950.071110.32840.16026.662793.589213.4821.90171.2402
613.7732.34248.82984.01687.40341811.920551.862514.7312
73.94299.923414.210138.04213.4767370.56064035.11225.0508
82.41115.23711.33228.27890.107111.652327.8037192.3237
Note: 1. Saline-alkali land; 2. Sandy land; 3. Construction land; 4. Cultivated land; 5. Forest land; 6. Grasslands; 7. Other unused land; 8. Waters.
Disclaimer/Publisher’s Note: The statements, opinions and data contained in all publications are solely those of the individual author(s) and contributor(s) and not of MDPI and/or the editor(s). MDPI and/or the editor(s) disclaim responsibility for any injury to people or property resulting from any ideas, methods, instructions or products referred to in the content.

