Article

Characterizing Roughness of Wooden Mortise and Tenon Considering Effects of Measured Position and Assembly Condition

1
Co-Innovation Center of Efficient Processing and Utilization of Forest Resources, Nanjing Forestry University, Nanjing 210037, China
2
College of Furnishing and Industrial Design, Nanjing Forestry University, Nanjing 210037, China
*
Author to whom correspondence should be addressed.
Forests 2024, 15(9), 1584; https://doi.org/10.3390/f15091584
Submission received: 20 August 2024 / Revised: 7 September 2024 / Accepted: 9 September 2024 / Published: 10 September 2024
(This article belongs to the Section Wood Science and Forest Products)

Abstract

:
The surface roughness of wood mortise and tenon seriously influence the strength of mortise-and-tenon joints. However, it is difficult to obtain the whole surface roughness of mortise and tenon due to the limitation in measuring range of most profilometers. Therefore, the selection of measured position is critical to measuring the roughness of mortise and tenon. This study mainly aimed to investigate the effects of measured position in the thickness direction (T1, T2, and T3) and length direction (L1, L2, and L3), and assembly condition (unassembled and assembled) on the surface roughness of wood mortise and tenon to characterize their surface roughness. Roughness profile results showed that the average roughness of mortise (4.53 µm) was greater than that of tenon (3.89 µm), and the roughness of unassembled ones was greater than that of assembled ones. The roughness at all measured positions of unassembled mortise was nearly identical, while for unassembled tenon, roughness in the thickness direction varied. T2 was significantly greater than those of T1 and T3. Statistical analysis results showed that for an unassembled sample, sample type and measured position in the thickness direction significantly influenced roughness, but measured position in the length direction was not significant. Assembly condition significantly influenced the roughness of tenon; the roughness of assembled tenon decreased significantly compared with unassembled tenon. The roughness at T2L1 decreased so much compared with T2L2 and T2L3. It can be concluded that the roughness of mortise was mainly dominated by its grain orientation of the measured surface, which was perpendicular to the grain. The roughness of unassembled tenon varied and resulted from the tangential feeding speed of the machine changing during the manufacturing of the curved part of the tenon. The cutting speed at T2 of wood tenon was faster than those of T1 and T3, so the roughness at T2 was greater than those of T1 and T3.

1. Introduction

The mortise-and-tenon (M-T) joint is widely used in solid wood frame furniture from ancient times to nowadays due to its satisfactory strength, low cost, and invisible appearance of joints [1,2]. The narrow concept of the M-T joint is that it is composed of mortise and tenon without using glue. The strengths of M-T joints mainly depend on the fictional force or interlocks between mortise and tenon. Round-end M-T joints are the most commonly used joint in modern solid wood frame furniture for their satisfactory strength and easy manufacture by modern wood processing machineries [3,4,5]. In this context, the strength of round-end M-T joints is mainly dominated by the frictional force generated by interference fit and the frictional coefficient between mortise and tenon. Although previous studies had investigated the effects of many factors, such as wood species, moisture content, tenon fit, shape of tenon, and strength of the M-T joints [6,7,8], all these factors ultimately impacted the fit and frictional coefficient between mortise and tenon.
Concerning the effect of tenon fit on the strength of M-T joints, previous studies had reached an agreement that a larger interference fit brought stronger M-T joints [9,10]. Additionally, in practice, some [11,12] used the theory of dry shrinkage and wet expansion of wood to make the moisture content of tenon less than mortise; once the moisture content of tenon increased, then the interference fit between mortise and tenon increased, causing the increasing strength of M-T joints. It is known that the friction coefficient depends on the roughness of frictional pairs. For natural wood materials, previous studies mainly focused on the effects of the manufacturing parameters of machines, such as feeding rate, cutting speed, grit of sand paper, and sanding process [13,14,15,16,17,18,19,20], on the roughness of wood. Some investigated the grain orientations of wood, wood species, and moisture content on the roughness of wood [21,22,23,24,25]. Roughness was mainly dominated by manufacturing machinery except for additional treatments. For treated or coated wood surfaces, the roughness of the wood surface influenced the aesthetic appearance and feeling of touch, as well as subsequent processing processes; many studies focused on this topic [26,27,28,29,30,31,32,33,34,35]. However, for roughness of mortise and tenon, limited studies were observed. With respect to the roughness of wood and wood products, Zhong et al. [36] measured the surface roughness of 15 types of wood-based panels and 12 types of solid wood commonly used in furniture manufacturing for quality control of wood furniture and improving manufacturing steps. Hu and Guan [37] proposed a method for measuring the friction coefficient between mortise and tenon for numerical modeling of the mechanical behavior of the M-T joint. Furthermore, the effects of moisture content [38] and tenon fit [8] on the strength of M-T joints were investigated considering the friction coefficient between mortise and tenon. Villar-García et al. [39] investigated moisture content and grain orientation on Chestnut timber-to-timber and timber-to-steel friction. The results provided an experimental database for numerical simulations and highlighted the influence of moisture on the stick–slip. Here, it must be declared that, according to the connecting technique of round-end M-T joints used in the China furniture industry, the fit between the width of mortise and thickness of tenon (straight part) was clearance, and the fit between the length of mortise and width of tenon (curve part) was interference. This connecting technique made the M-T joints have a satisfactory strength and easy assembly. The interference (curve) part of the M-T joint played a more important role than the clearance (straight) part in strength.
However, the roughness of mortise and tenon and their profiles have never been studied, especially from angles of mechanical strength and connecting technique. Therefore, this study mainly aimed to investigate the effects of the selected factors, namely measured position and assembly condition, on the curved part of mortise and tenon to characterize their surface profiles and provide references for wood M-T joint design and manufacture.

2. Materials and Methods

2.1. Materials

The wood material used to prepare samples was beech (Fagus sylvatica L.), which is commonly used in manufacturing solid wood furniture. Beech wood timbers were bought from a local wood merchant (Jiayi Timber, Nanjing, China) and stored in a wood manufacturing lab under an air-dry condition. The air-dry density was 0.7 g/cm2 with moisture content at 12%.

2.2. Experimental Design

2.2.1. Effect of Measured Positions on the Roughness of Mortise and Tenon

A complete three-factor 3 × 3 × 2 factorial experiment with 10 samples was designed to investigate the effects of measured position in the thickness direction (T1, T2, and T3) and length direction (L1, L2, and L3), and sample type (mortise and tenon) on roughness. Figure 1a,b present the measured positions of mortise and tenon, respectively. Therefore, a total of 180 measurements were tested. Figure 1a,b also indicate the grain orientation of tenon and mortise. The tenon length is parallel to the grain, and the depth of mortise is perpendicular to the grain. The mean width of the annual ring is about 2.5 mm with a coefficient of variation of 18%.

2.2.2. Assembly Condition Effect on the Roughness of Tenon

The effects of measured position in the thickness direction (T1, T2, and T3) and length direction (L1, L2, and L3), and assembly condition (unassembled and assembled) on the roughness of wood tenon were investigated using a complete three-factor 3 × 3 × 2 factorial experiment with 10 samples. A total of 180 measurements were performed again. Samples were measured as described in 2.2.1 and were assembled and disassembled and measured again in the same way (Figure 1a). Hereinafter, the unassembled condition meant that the mortise and tenon samples were not mounted, keeping the initial status after manufacturing. The assembled condition indicated that the mortise and tenon experienced a one-time assembly and disassembly process.

2.3. Sample Preparation

Figure 2 shows the main procedure for manufacturing samples for measuring the roughness of mortise and tenon. First, the tenons were processed using a computer numerical control (CNC) tenon machine (MDK3113B, New MAS Woodworking Machinery & Equipment Co., Ltd., Foshan, China), while the mortises were machined using a CNC horizontal double-end mortise machine (MS3112, New MAS Woodworking Machinery & Equipment Co., Ltd., Foshan, China). Then, the mortise and tenon were cut off from the corresponding samples. Finally, the mortise and tenon were cut open into two equal parts.
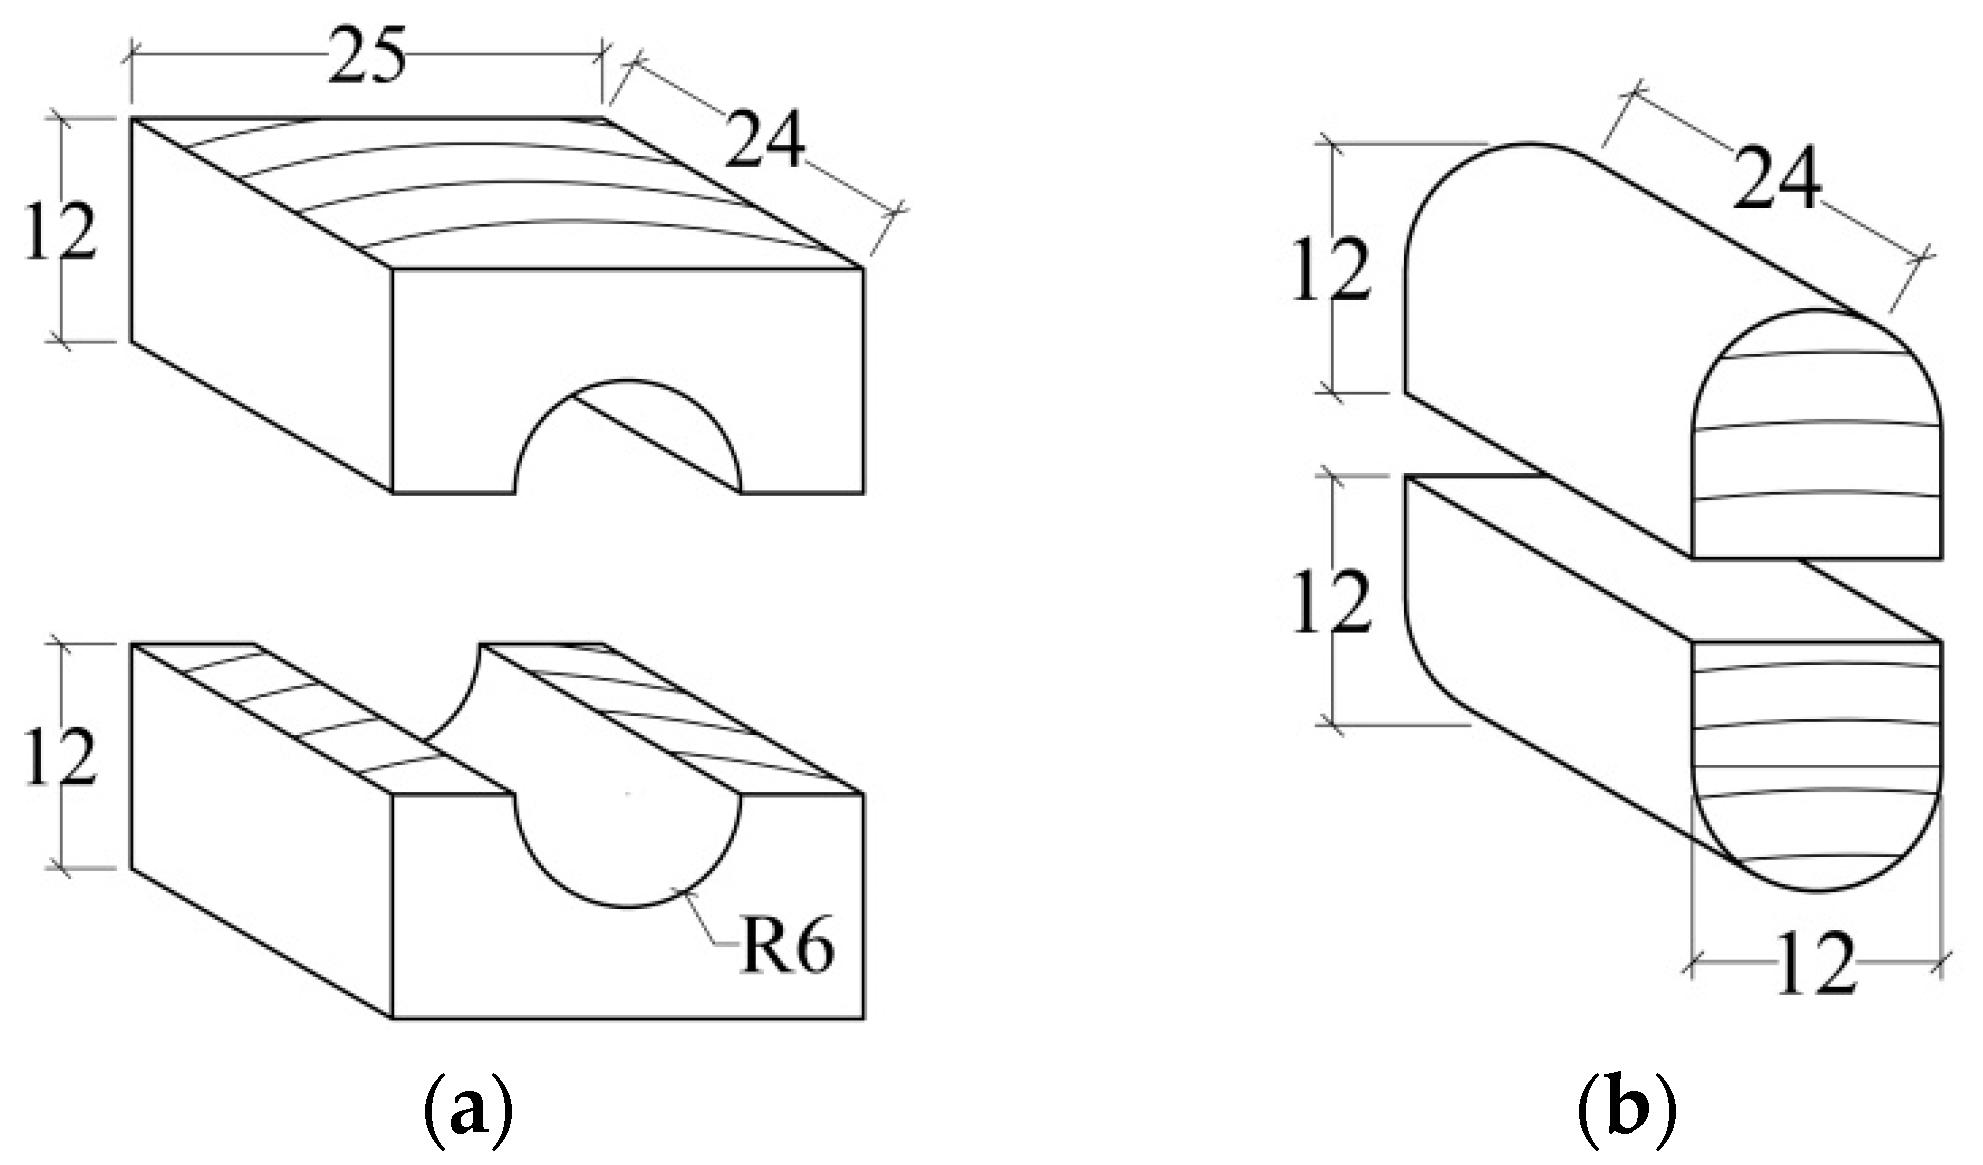
Figure 3 shows the final dimensions of samples for measuring the roughness of mortise and tenon. The mortise and tenon were constructed with a 0.3 mm interference fit.
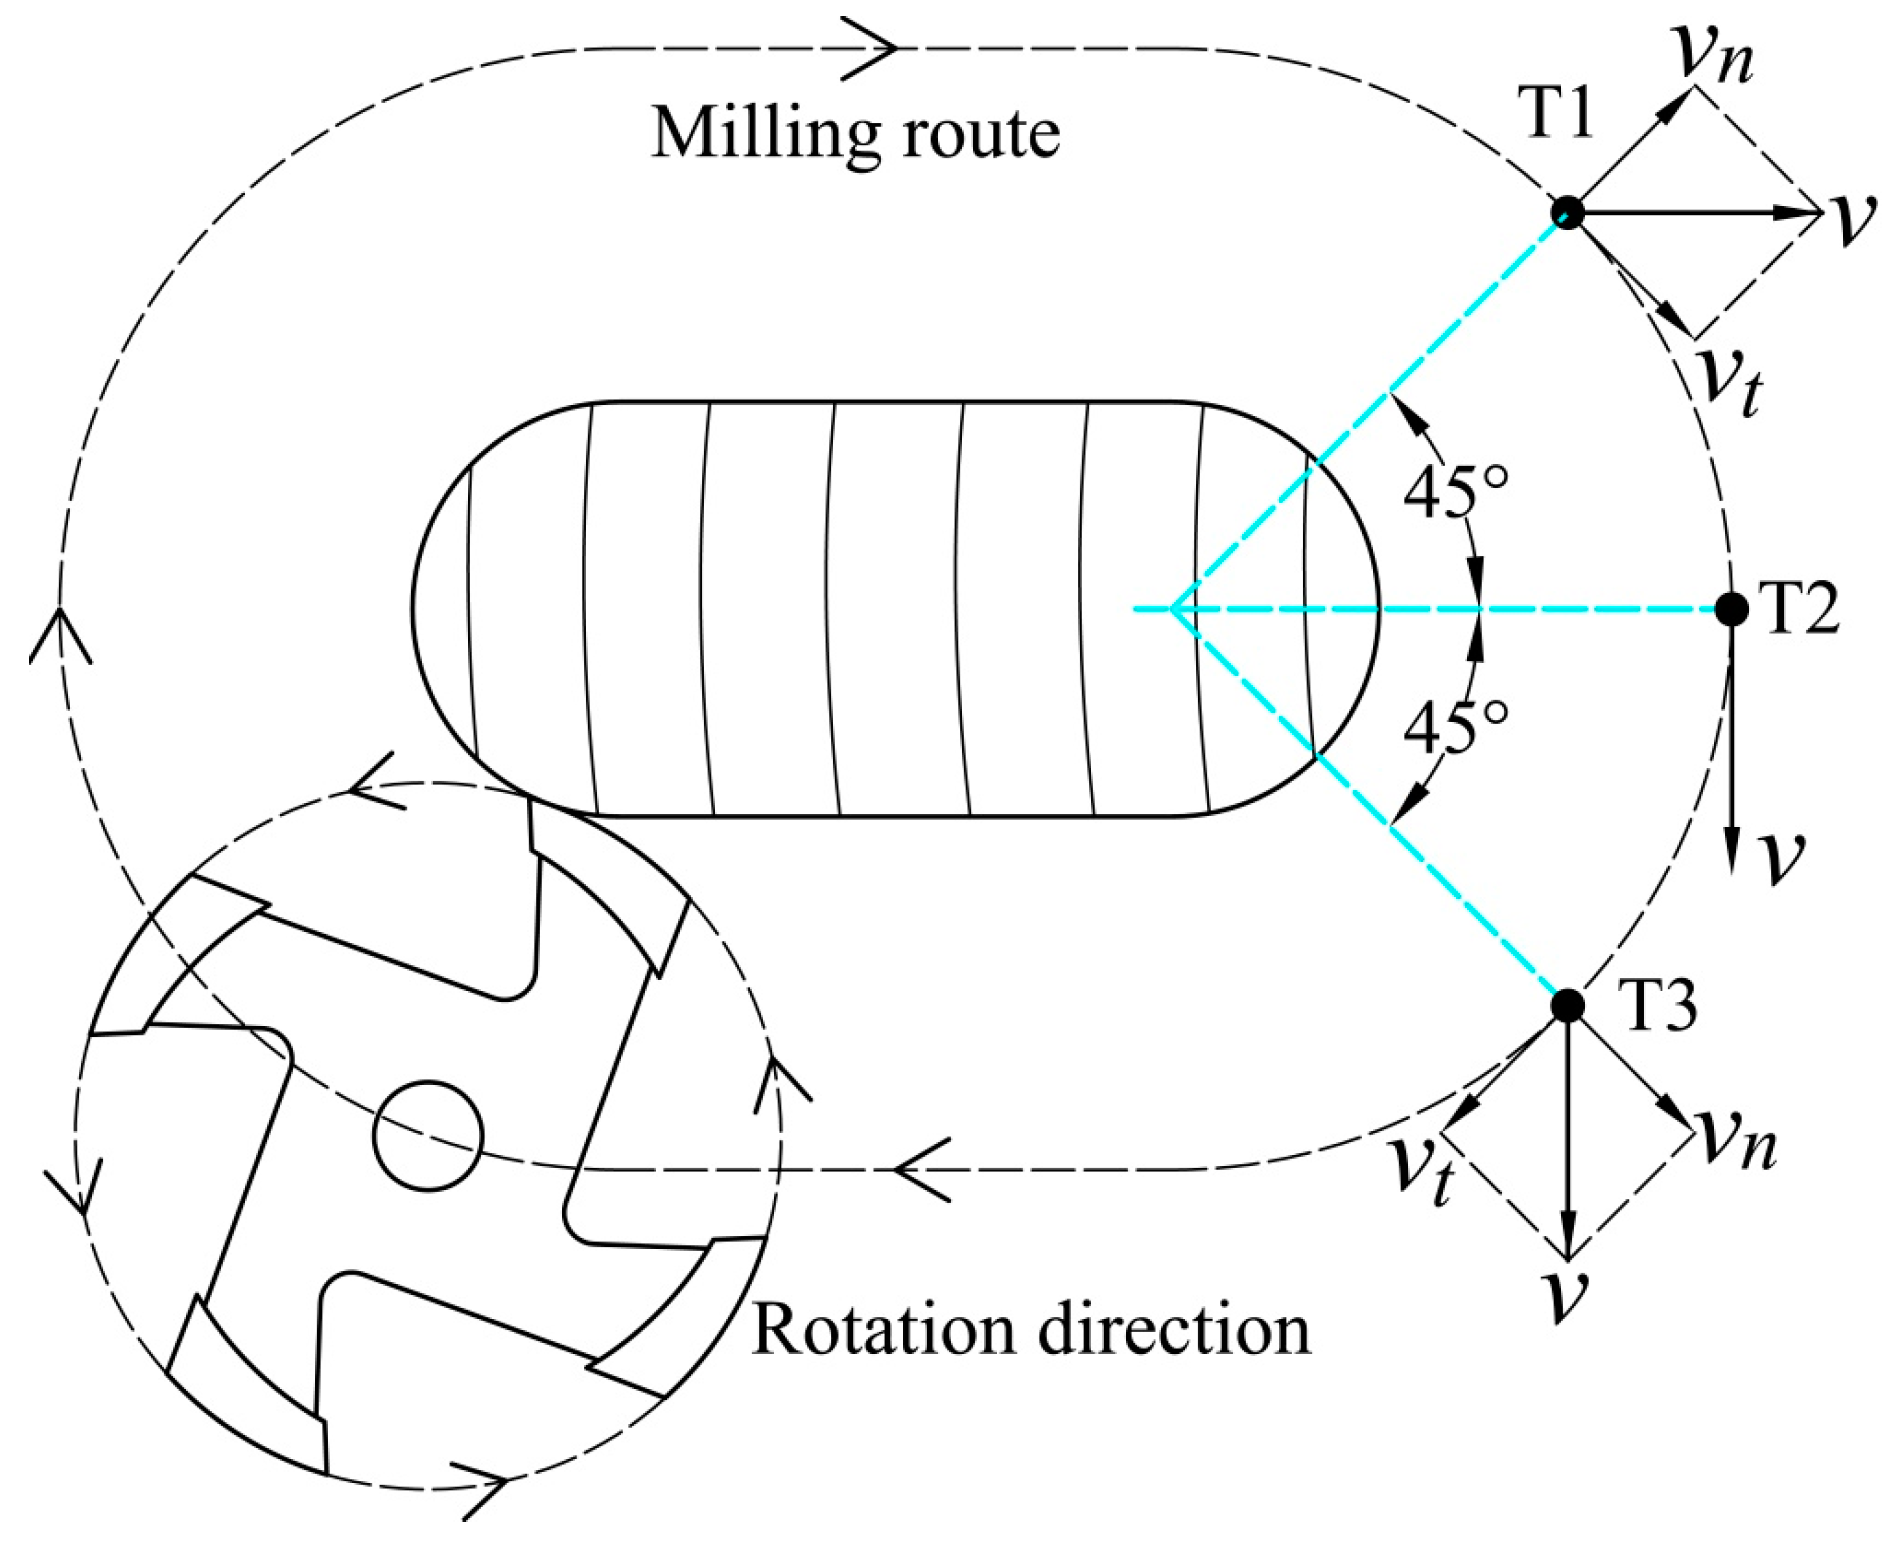
Figure 4 shows the machine scheme for manufacturing tenon, which was used to analyze the effects of cutting speed on the roughness of tenon. The rotation speed of the cutter was 6700 r/min, and the linear feeding speed was 5000 mm/min.

2.4. Testing Methods

Figure 5 shows the setup for measuring the roughness of mortise and tenon using a profilometer (JB-4C, Shanghai Zhongheng Instrument Co., Ltd., Shanghai, China). It was mainly composed of a probe, control plate, and a computer with data analysis software built in. Upon conducting tests, fix the tested samples on the measuring plate first (Figure 5b). Then, adjust the sample to make it slightly contact the probe, and use a control plate to calibrate the initial condition to zero. Finally, start measuring. Repeat the same procedure for all measured positions according to the experimental design. The output data of Ra were commonly used as an index to evaluate the roughness [19,20] of mortise and tenon. To get a close look at the surfaces of mortise and tenon, the roughness of mortise and tenon were measured by atomic force microscopy (AFM) (Dimension Edge, Bruker, Bremen, Germany).

2.5. Statistical Analysis

The normality of all data was checked by the Shapiro–Wilk test. The effects of the selected factors on the roughness of mortise and tenon were analyzed by the univariate multivariate analysis of variance (UNIANOVA) generalized linear model (GLM) procedure. If any significant factor was identified, a post-comparison was performed using the protected least significant difference (LSD) multiple comparison procedure. All statistical analyses were conducted at a 5% significance level using SPSS (version 22.0, IBM, Armonk, NY, USA).

3. Results and Discussion

3.1. Typical Roughness Profile, Morphologies, and Color Contours of Mortise and Tenon

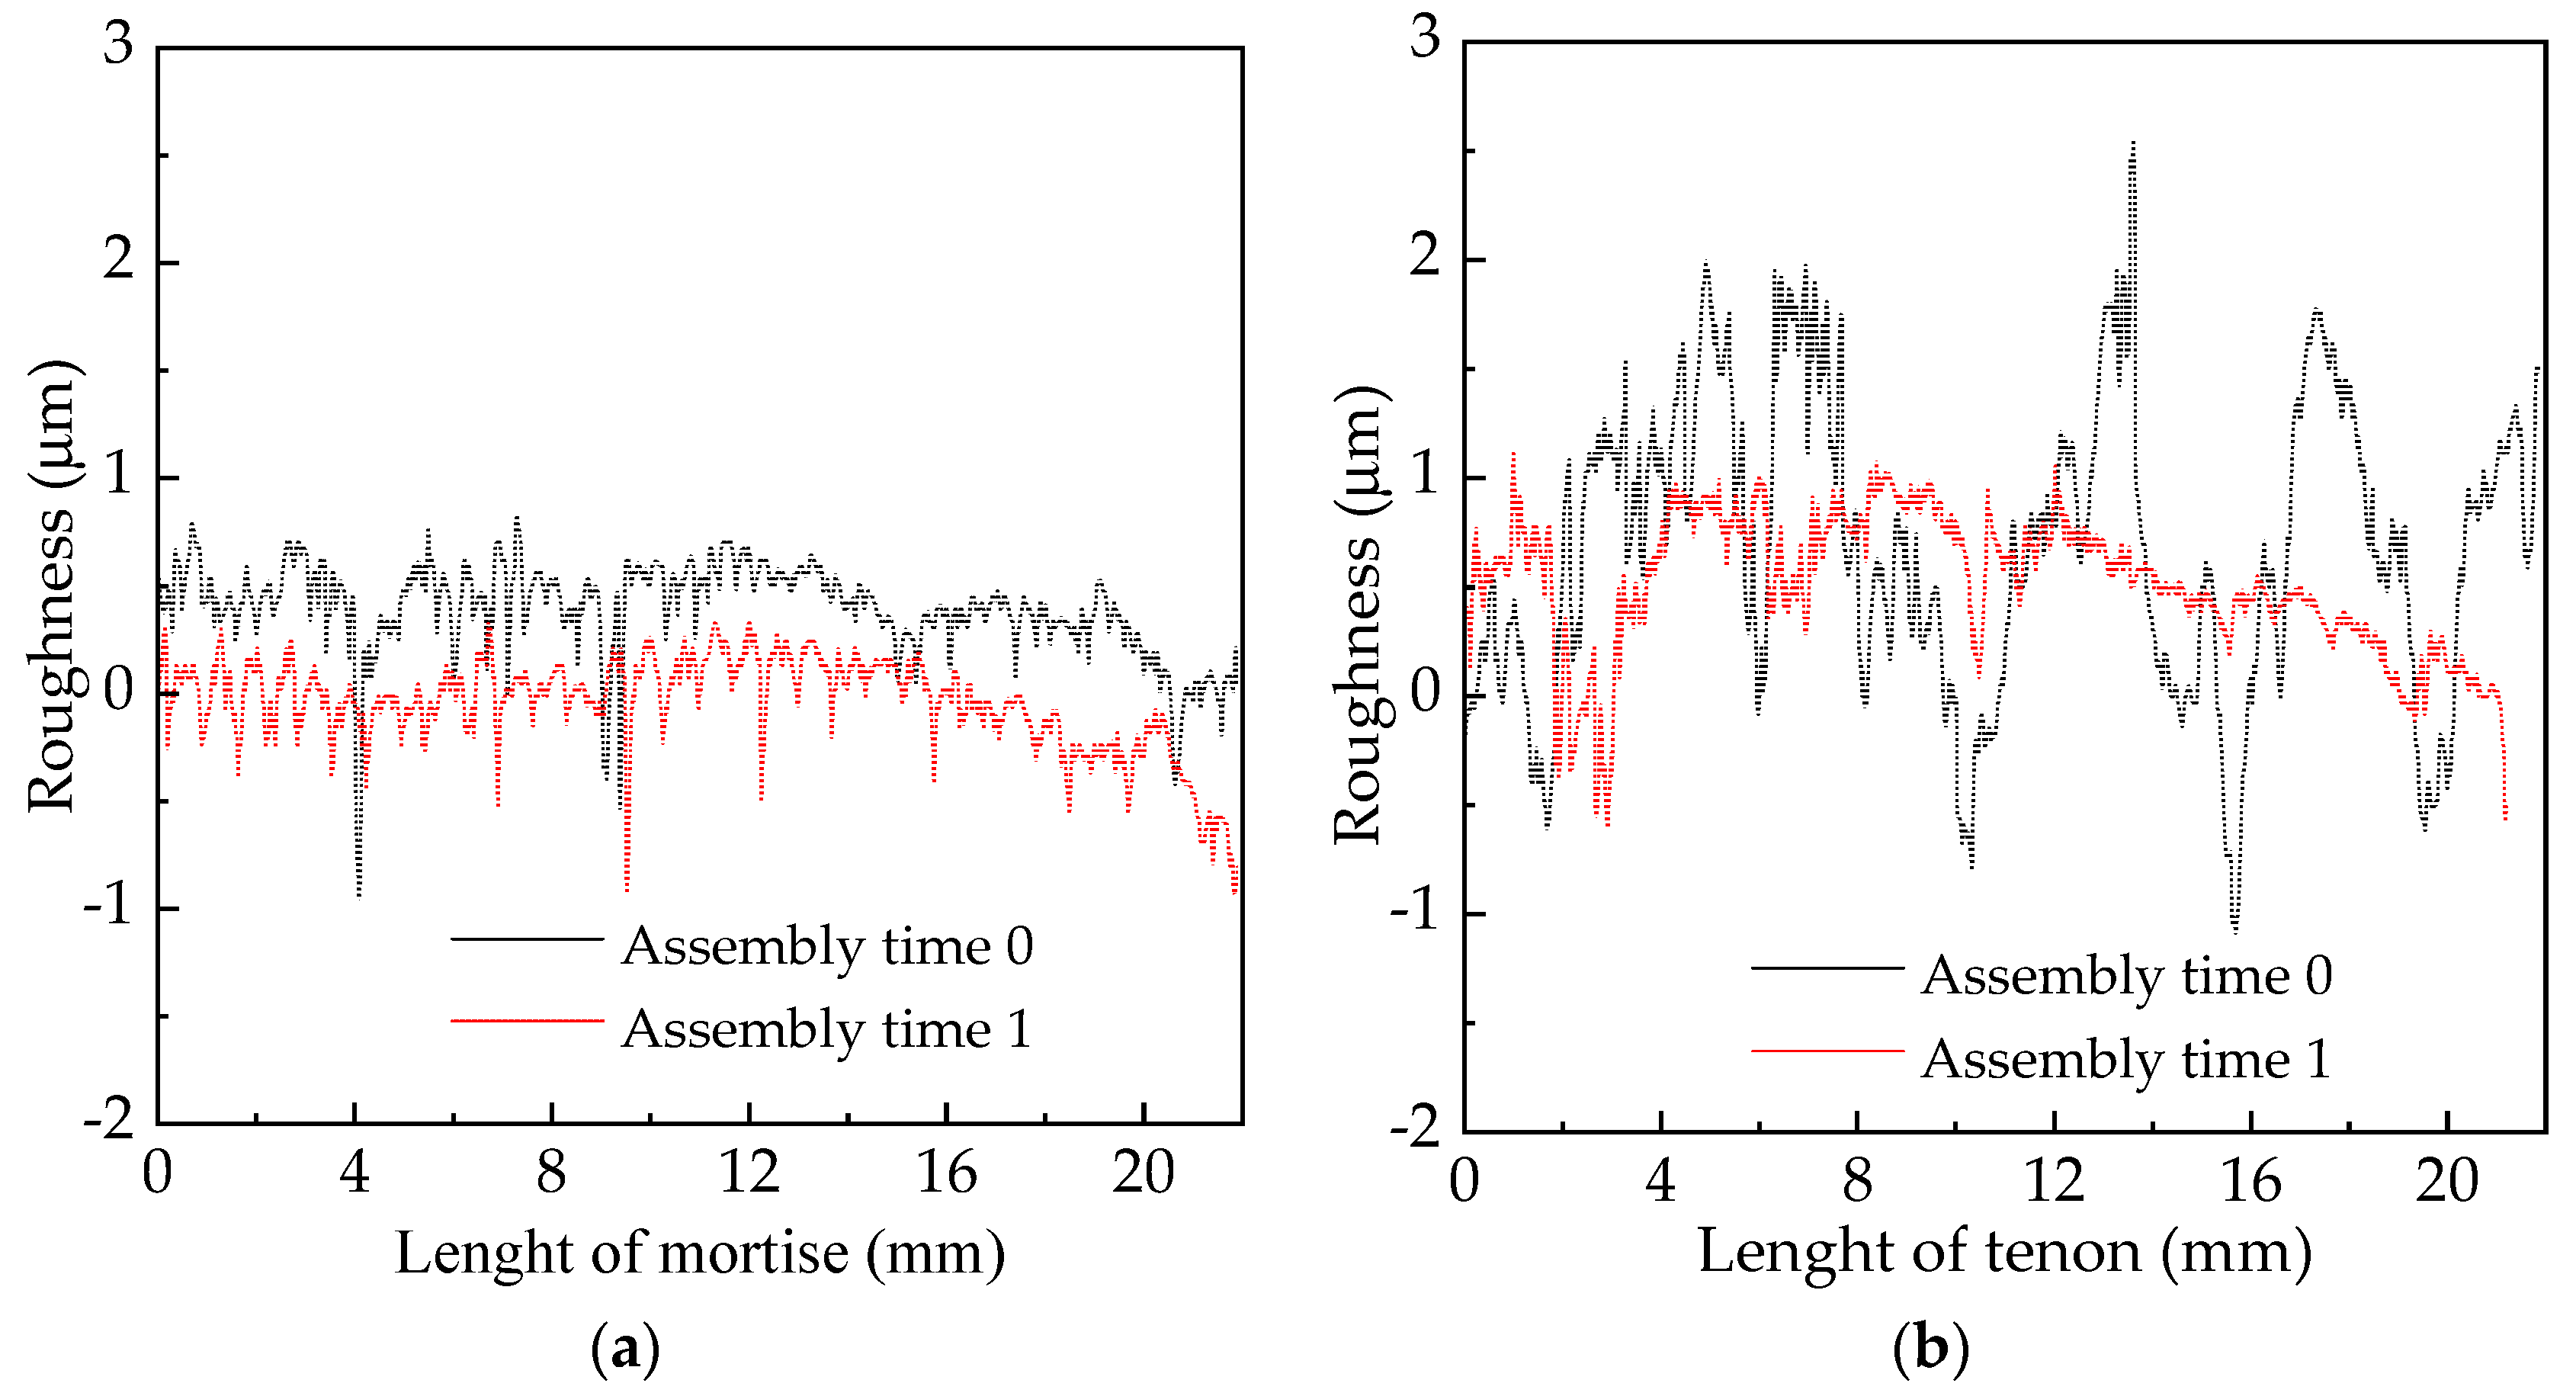
Figure 6 shows typical roughness profiles of one mortise and one tenon in the length direction based on Ra, which were composed of several continuous measurements due to the limitation in the measuring range of the profilometer. From the whole trend, it was observed that the roughness of mortise and tenon decreased after assembly and disassembly. The variation of mortise was lower that of tenon. The average roughness of mortise and tenon, with the coefficient of variation in parentheses, was 4.53 (2.4) μm and 3.89 (23.8) μm, respectively.
Figure 7 shows one example of the surface morphologies of mortise and tenon measured by AFM, which further indicated that the roughness of mortise was greater than that of tenon. The variation of surface roughness of mortise was lower than that of tenon.
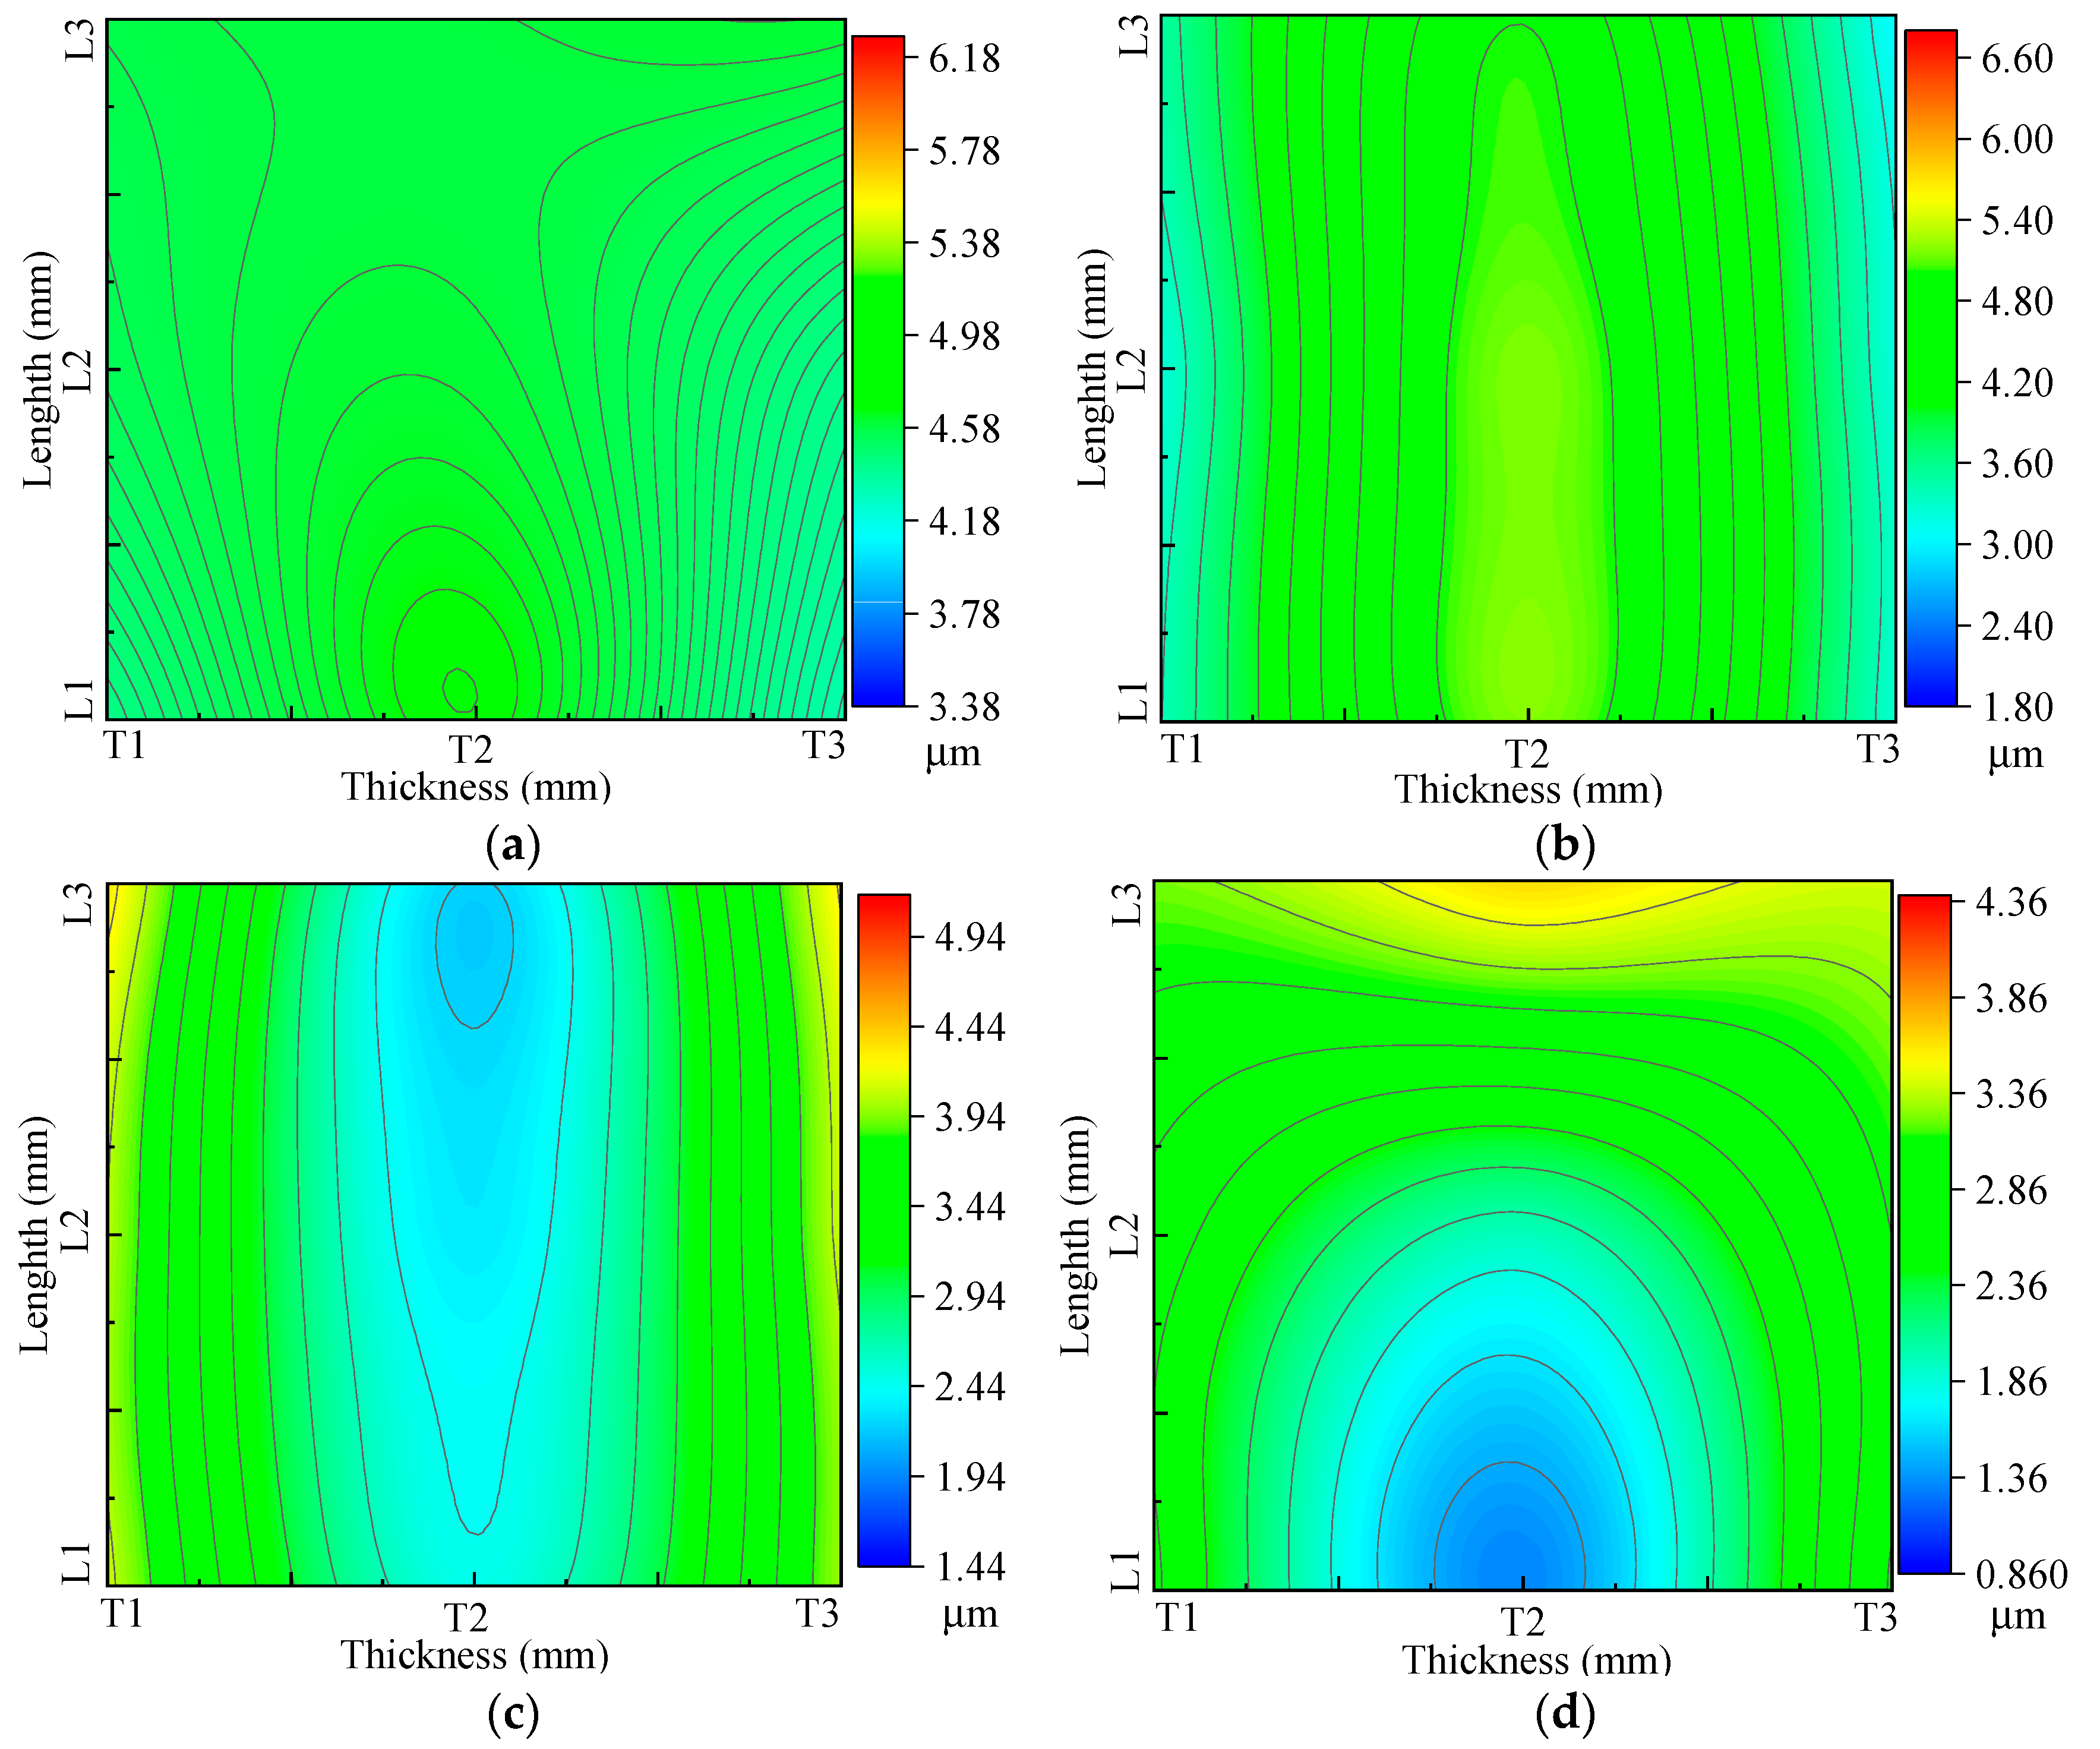
The mean values of roughness (Ra) of all measured positions of mortise and tenon were plotted using color contours. Figure 8a shows that the roughness of all measured positions of unassembled mortise is nearly identical. While the roughness of unassembled tenon in the middle line of the thickness direction (T2) was higher than the other two sides, T1 and T3, (Figure 8b). For assembled mortise, the roughness at T2 was lower than those of T1 and T3 (Figure 8c). However, for assembled tenon, roughness in the middle line of the thickness direction (T2) increased along the length direction from L1 to L3 (Figure 8d). Thus, it can be initially concluded that the roughness of mortise and tenon varied and were influenced by measured positions and assembly condition.

3.2. Effect of Measured Position on the Roughness of Mortise and Tenon

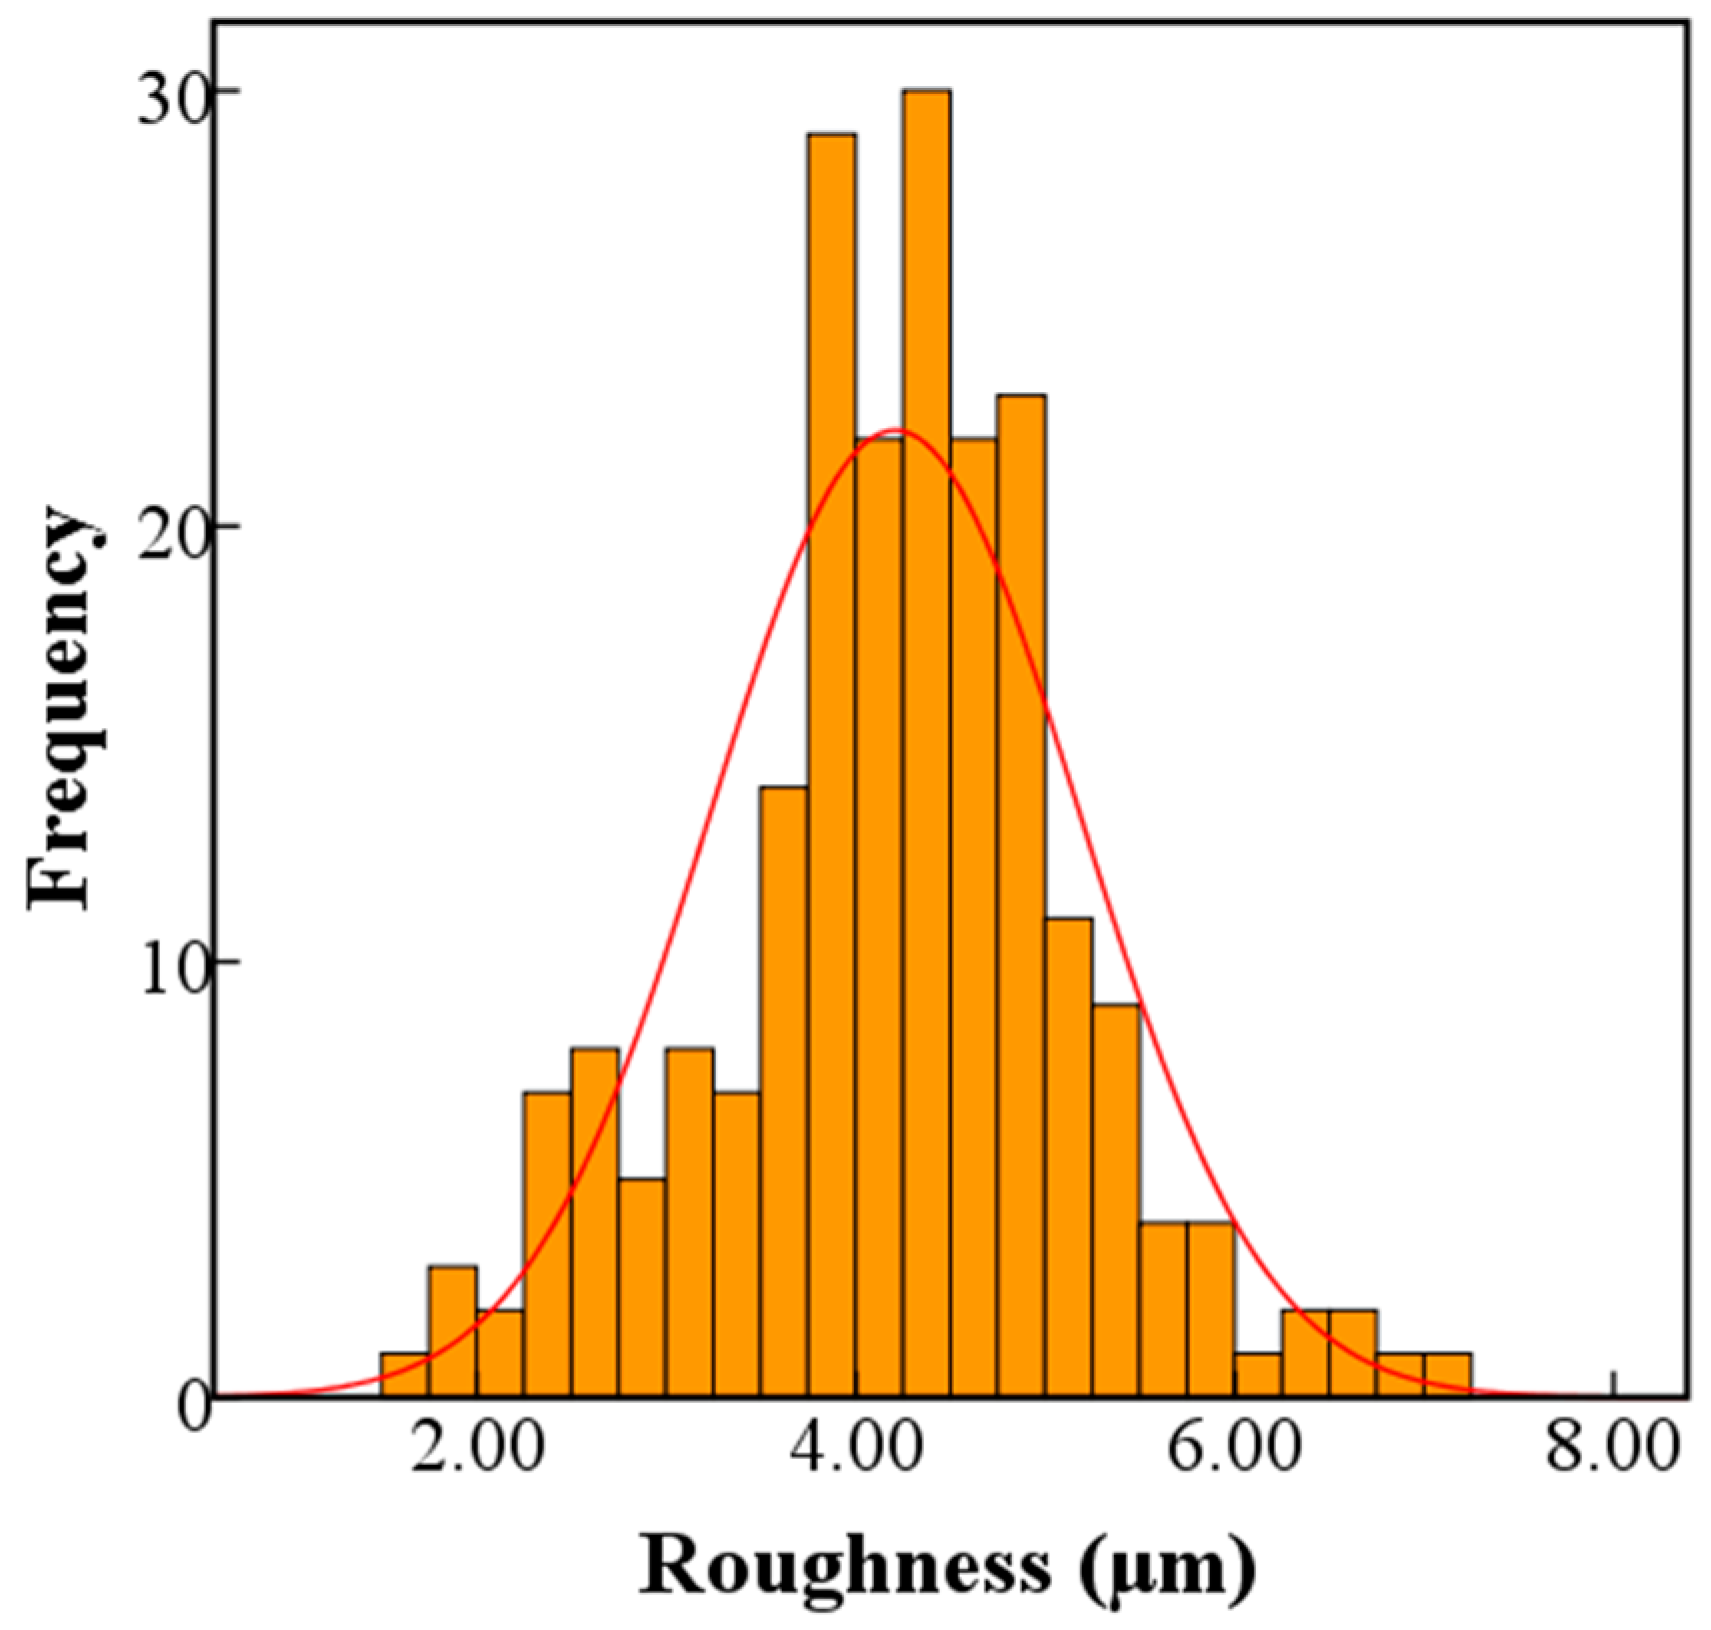
Figure 9 shows the result of a normal distribution test of the roughness of mortise and tenon measured at different positions based on 180 measurements. It indicates that the evaluated data were suited to a normal distribution. Additionally, the significance was less than 0.05, suggesting that the data can be further examined by UNIANOVA analysis.
Table 1 shows the result of a three-way UNIANOVA of factors influencing the roughness (Ra) of mortise and tenon. It indicated that sample type, measured position in the thickness direction, and their interaction had significant effects on roughness at a 5% significance level. However, others had no significant effects. Furthermore, a multi-comparison was conducted to investigate the interaction effect (S × T) of sample type and measured position in the thickness direction on the roughness of mortise and tenon.
Table 2 summarizes the mean values of all roughness data with each combination of sample type and measured position. In the case of sample type, the roughness of mortise was significantly greater than that of tenon, except for combinations of L1T2 and L3T2. In measured position in the thickness direction, for the tenon sample, roughness measured at T2 was significantly larger than those of T1 and T3 within the same measured length. However, for the mortise sample, there was no significant difference among all measured positions.
Regarding the abovementioned results, the roughness of unassembled mortise at all measured positions was nearly identical, while those of tenon varied. Additionally, the COV of roughness of tenons were larger than those of mortise. These may result from the measured position of mortise being perpendicular to the grain and the macro structures of wood, such as annual ring, vessels, and rays, dominating the roughness [24,25]. By contrast, for unassembled tenon, the measured positions were parallel to the grain. The roughness was mainly dominated by machinery parameters. Figure 4 shows a milling routine for manufacturing tenon. The rotation speed of the cutter and linear feeding speed (v) were constants. The feeding speed, v, had two components in the curved part of the tenon: they were tangential (vt) and perpendicular (vn) to the manufactured surface of tenon, respectively. The roughness of the wood surface depended on the feeding speed vt, and the faster the feeding speed was, the rougher the surface was [13,14,17]. Based on this context, it was obvious that the feeding speed at T2 (v) was much greater than those at T1 and T3.

3.3. Effect of Assembly Condition on the Roughness of Tenon

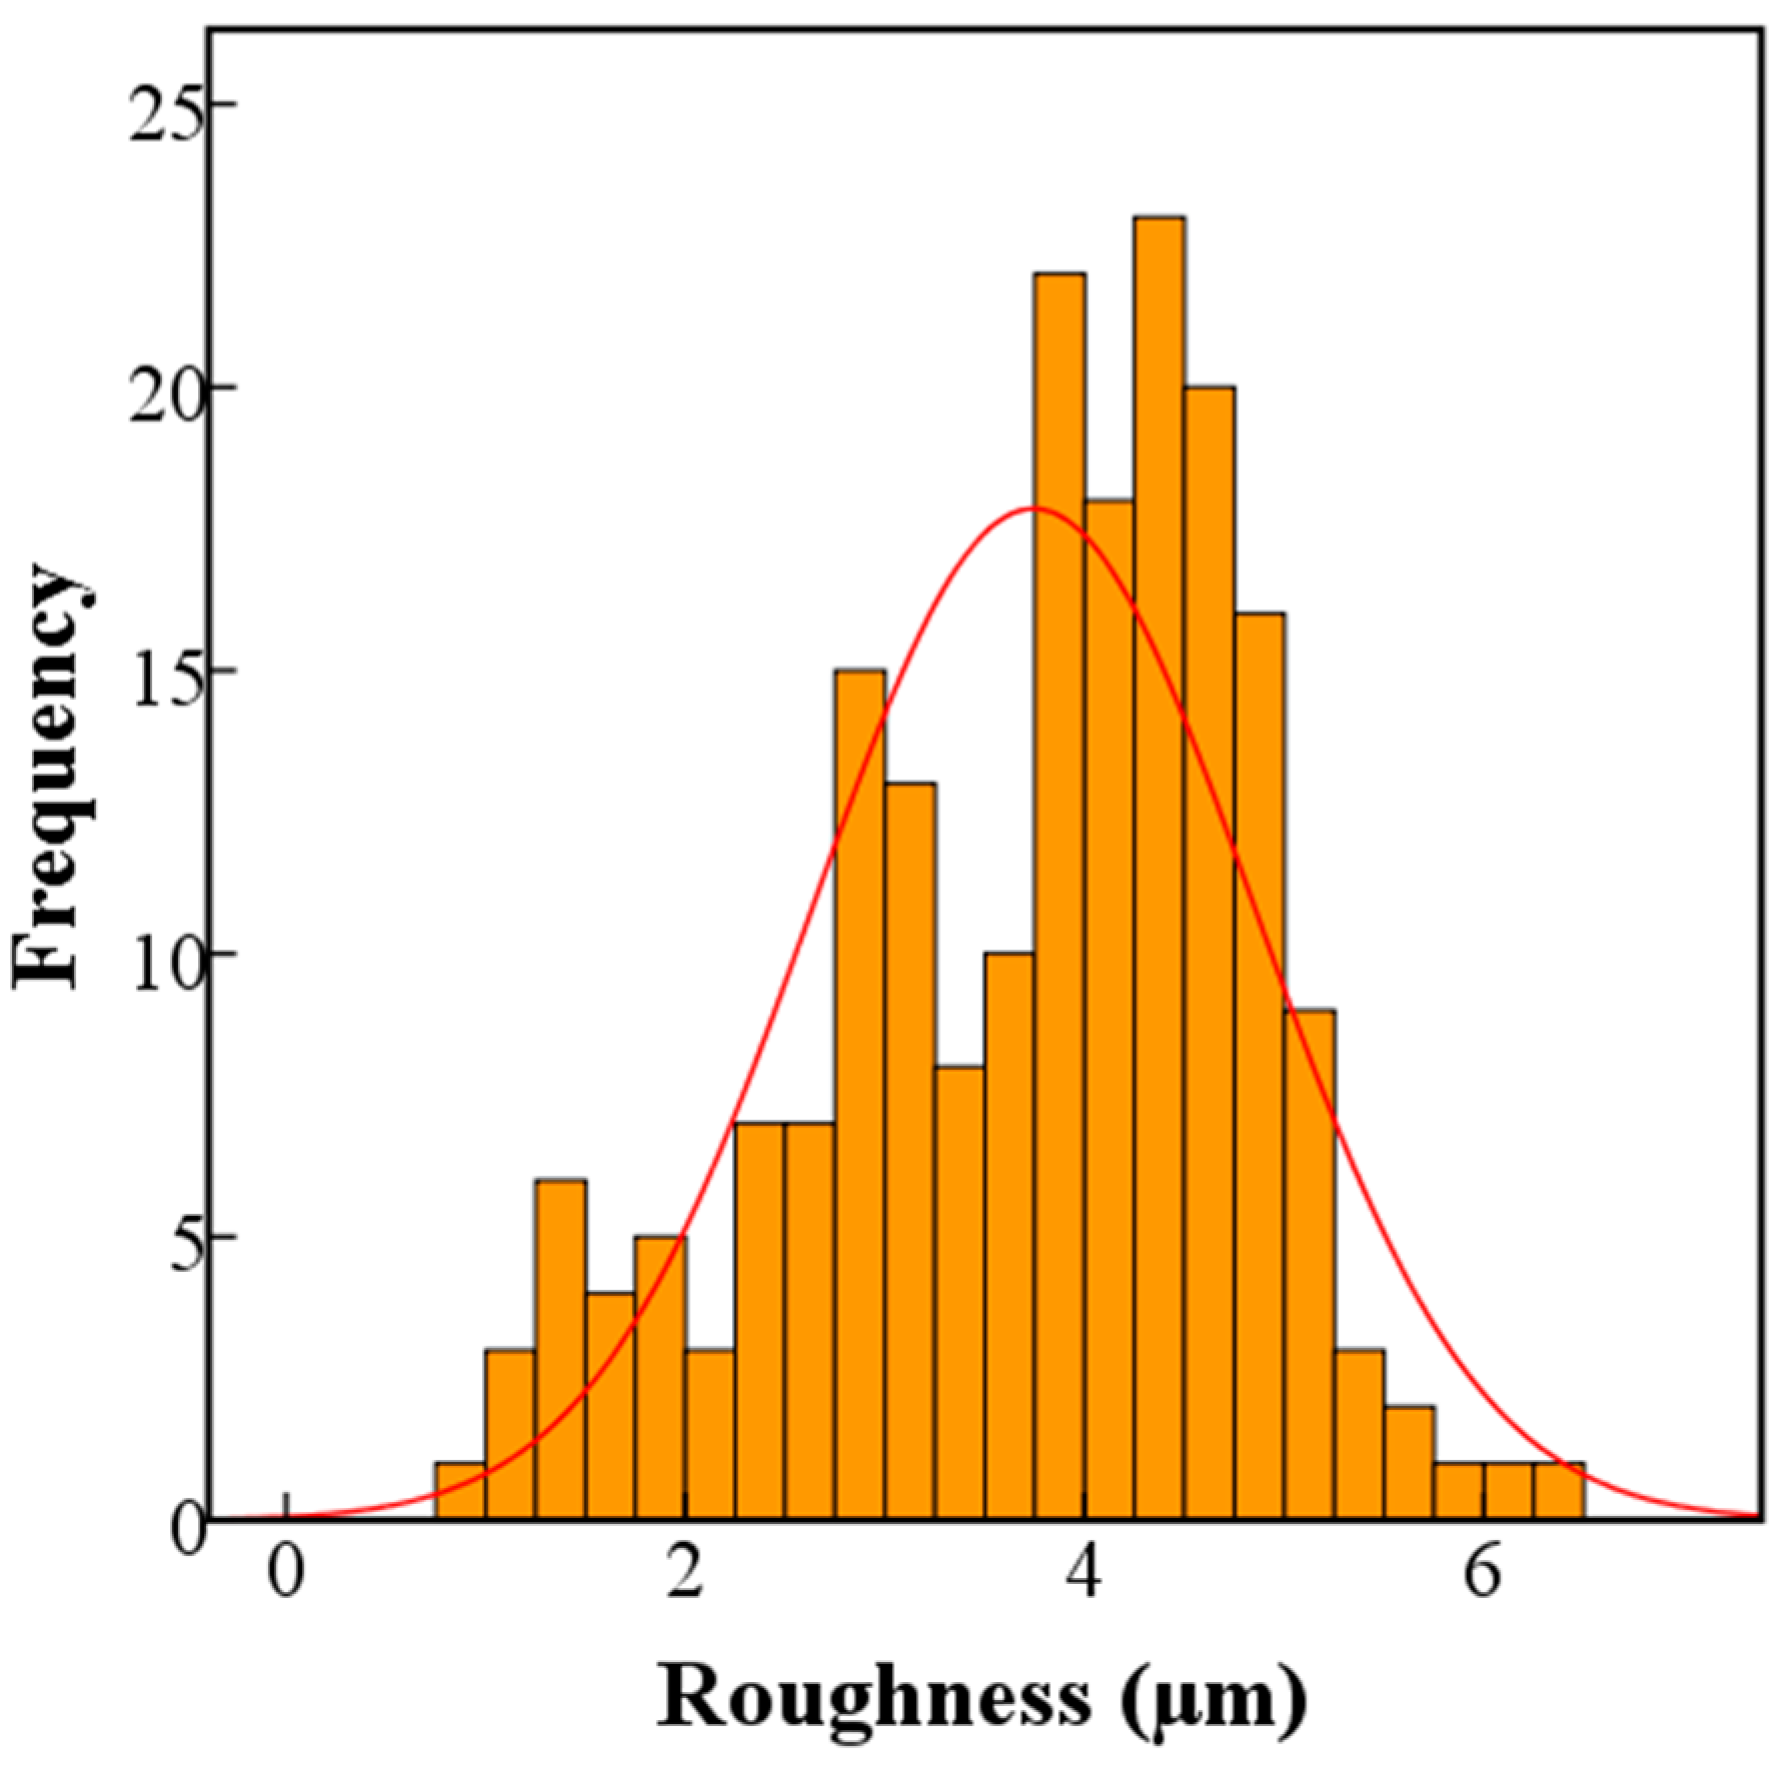
Figure 10 shows the results of a normal distribution test of roughness involving unassembled and assembled tenons based on 180 measurements. It indicated that all evaluated data fitted in the normal distribution and can be used to further conduct data analysis.
Table 3 shows the UNIANOVA results of factors influencing the roughness of tenon, which indicates that all evaluated factors and their interactions have significant effects on the roughness of tenon. Therefore, a three-way interaction multi-comparison was further conducted to compare the differences between each level.
Table 4 summarizes all means of the evaluated combinations of all factors. In the case of the assembly condition, the roughness of tenon decreased significantly after assembly compared with unassembled ones for all measured positions. For measured positions in the thickness direction, compared with unassembled tenon, the roughness distribution trends of assembled tenons changed. The roughness at T2 was significantly lower than those at T1 and T3 within the same length direction, except for L3. These decreasing ratios at T2 were much higher than those of T1 and T3 regardless of the length direction. Additionally, the COV of roughness of assembled tenon were higher than those of unassembled tenon, which was caused by the wear of tenon.
Table 5 further compares the roughness of tenon in the length direction. For unassembled tenon, there was no significant difference among L1, L2, and L3 within the same measured positions in the thickness direction. In the case of assembled tenon, the roughness of tenon at L3 was significantly greater than those at L1 and L2 within the same thickness direction, especially for T2. However, no significant change was observed in the length direction for T3 after assembly.
Considering the results of the effect of assembly condition on the roughness of tenon, the main reason why the roughness of assembled tenon at T2 changed to be significantly lower than those at T1 and T3 within the same length direction was that the top (T2) of the tenon bore the most compression pressure when it was assembled and disassembled with mortise [9,10]. It caused much wear and tear, and made the roughness at T2 decrease so much compared with T1, T3, and unassembled samples. For the length direction, L3 was the root of the tenon; when the tenon was assembled and disassembled, its frictional path was much shorter than those of L1 and L2. The wear and tear of tenon at L3 was the least, which resulted in the roughness of assembled tenon at L3 being greater than those at L1 and L2, and the roughness of assembled tenon at L3 did not significantly decrease.

4. Conclusions

This study characterized the surface roughness of beech wood mortise and tenon through investigating the effects of measured position in the thickness direction (T1, T2, and T3) and length direction (L1, L2, and L3), and assembly condition (unassembled and assembled). The following conclusions were drawn:
(1)
The roughness of mortise (4.53 µm) was greater than that of tenon (3.89 µm), and the roughness of unassembled ones was greater than that of assembled ones based on the roughness in multiscale, including profiles, morphologies, and contours.
(2)
The roughness of mortise and tenon were significantly influenced by measured position and assembly condition, which made it important to understand the roughness distribution of mortise and tenon.
(3)
For the unassembled tenon sample, the roughness at T2 (5.10 µm) was greater than those at T1 (3.04 µm) and T3 (3.32 µm). The roughness of the assembled sample at T2L1 decreased so much compared with T2L2 and T2L3 in the length direction. T2 was suggested as a critical measured position for evaluating mortise and tenon.
(4)
It can be concluded that the roughness of mortise was mainly dominated by being perpendicular to the grain, while tangential feeding speed mainly determined the roughness of the tenon surface.

Author Contributions

Conceptualization, W.-G.H.; methodology, W.-G.H. and R.-Z.Y.; software, R.-Z.Y.; validation, R.-Z.Y. and P.Y.; formal analysis, W.-G.H.; investigation, R.-Z.Y. and P.Y.; resources, W.-G.H.; data curation, R.-Z.Y.; writing—original draft preparation, W.-G.H.; writing—review and editing, W.-G.H. and R.-Z.Y.; supervision, W.-G.H.; funding acquisition, W.-G.H. All authors have read and agreed to the published version of the manuscript.

Funding

This work is partially supported by the National Natural Science Foundation of China (32201488), and partially supported by the Postgraduate Research & Practice Innovation Program of Jiangsu Province (SJCX23-0325).

Data Availability Statement

The data are not publicly available due to restrictions on privacy.

Acknowledgments

The authors would like to show their gratitude to Mengyao Luo and Yuan Zhao from Nanjing Forestry University (NJFU) for their help during sample processing and experimental tests.

Conflicts of Interest

The authors declare no conflicts of interest.

References

  1. Yan, Y.; Xu, Z.; Zhu, L.; Lv, J. Innovative design model for the mortise and tenon structure. BioResources 2024, 19, 5413–5434. [Google Scholar] [CrossRef]
  2. Zhou, C.; Guo, J.; Zhang, Y.; Huang, T.; Kaner, J. A home health management app designed in the post-epidemic era using empirical evidence based on the demand collection of elderly users. Humanit. Soc. Sci. Commun. 2024, 11, 619. [Google Scholar] [CrossRef]
  3. Hang, J.; Zhang, B.; Fan, H.; Yan, X.; Li, J. Effect of two types of chitosan thermochromic microcapsules prepared with syringaldehyde and sodium tripolyphosphate crosslinking agents on the surface coating performance of basswood board. Coatings 2024, 14, 1118. [Google Scholar] [CrossRef]
  4. Xu, X.; Xiong, X.; Yue, X.; Zhang, M. A parametric optimized method for three-dimensional corner joints in wooden furniture. Forests 2023, 14, 1063. [Google Scholar] [CrossRef]
  5. Wang, Y.; Yan, X. Preparation of Toddalia asiaticas (L.) Lam. extract microcapsules and their effect on optical, mechanical and antibacterial performance of waterborne topcoat paint films. Coatings 2024, 14, 655. [Google Scholar] [CrossRef]
  6. Likos, E.; Haviarova, E.; Eckelman, C.A.; Erdil, Y.Z.; Özcifci, A. Effect of tenon geometry, grain orientation, and shoulder on bending moment capacity and moment rotation characteristics of mortise and tenon joints. Wood Fiber Sci. 2012, 44, 462–469. [Google Scholar]
  7. Miao, Y.; Pan, S.; Xu, W. Staple holding strength of furniture frame joints constructed of plywood and solid wood. Forests 2022, 13, 2006. [Google Scholar] [CrossRef]
  8. Záborský, V.; Boruvka, V.; Kašicková, V.; Ruman, D. Effect of wood species, adhesive type and annual ring directions on the stiffness of rail to leg mortise and tenon furniture joints. BioResources 2017, 12, 7016–7031. [Google Scholar] [CrossRef]
  9. Chen, B.; Guan, H. A novel method and validation for obtaining the optimal interference fit of round-end mortise-and-tenon joint. Wood Mater. Sci. Eng. 2023, 18, 1619–1629. [Google Scholar] [CrossRef]
  10. Hu, W.; Yu, R. Study on the strength mechanism of the wooden round-end mortise-and-tenon joint using the digital image correlation method. Holzforschung 2024, 78, 519–530. [Google Scholar] [CrossRef]
  11. Renbutsu, T.; Koizumi, A. Withdrawal properties of glued, round, mortise and tenon joints using greenwood shrinkage as a clamping pressure. Mokuzai Gakkaishi 2018, 64, 187–194. [Google Scholar] [CrossRef]
  12. Wu, X.; Xu, L.; Hao, J.; Liu, T.; Liu, W. One pre-stressed methodology named as swelling-fit for binderless dowels joint of wood. Compos. Struct. 2023, 314, 116969. [Google Scholar] [CrossRef]
  13. Korkut, I.; Donertas, M.A. The influence of feed rate and cutting speed on the cutting forces, surface roughness and tool–chip contact length during face milling. Mater. Des. 2007, 28, 308–312. [Google Scholar] [CrossRef]
  14. Jiang, S.; Buck, D.; Tang, Q.; Guan, J.; Wu, Z.; Guo, X.; Zhu, Z.; Wang, X. Cutting force and surface roughness during straight-tooth milling of Walnut wood. Forests 2022, 13, 2126. [Google Scholar] [CrossRef]
  15. Đukić, I.; Merhar, M.; Jovanović, J. Analysis of theoretical machined surface roughness profile after sawing solid oak wood (Quercus robur L.) along the grain with a circular saw. Wood Mater. Sci. Eng. 2023, 18, 1534–1544. [Google Scholar] [CrossRef]
  16. Fujiwara, Y.; Fujii, Y.; Okumura, S. Relationship between roughness parameters based on material ratio curve and tactile roughness for sanded surfaces of two hardwoods. J. Wood Sci. 2005, 51, 274–277. [Google Scholar] [CrossRef]
  17. Kilic, M.; Hiziroglu, S.; Burdurlu, E. Effect of machining on surface roughness of wood. Build. Environ. 2006, 41, 1074–1078. [Google Scholar] [CrossRef]
  18. Luo, B.; Zhang, J.; Bao, X.; Liu, H.; Li, L. The effect of granularity on surface roughness and contact angle in wood sanding process. Measurement 2022, 165, 108133. [Google Scholar] [CrossRef]
  19. Adamčík, L.; Dzurenda, L.; Banski, A.; Kminiak, R. Comparison of surface roughness of beech wood after sanding with an eccentric and belt sander. Forests 2023, 15, 45. [Google Scholar] [CrossRef]
  20. Yu, Y.; Buck, D.; Yang, H.; Du, X.; Song, M.; Wang, J.; Zhu, Z. Cutting power, temperature, and surface roughness, a multiple target assessment of beech during diamond milling. Forests 2023, 14, 1163. [Google Scholar] [CrossRef]
  21. Fu, W.; Guan, H.; Chen, B. Investigation on the influence of moisture content and wood section on the frictional properties of beech wood surface. Tribol. Trans. 2021, 64, 830–840. [Google Scholar] [CrossRef]
  22. Karlinasari, L.; Lestari, A.T.; Priadi, T. Evaluation of surface roughness and wettability of heat-treated, fast-growing tropical wood species sengon (Paraserianthes falcataria (L.) I.C.Nielsen), jabon (Anthocephalus cadamba (Roxb.) Miq), and acacia (Acacia mangium Willd.). Int. Wood Prod. J. 2018, 9, 142–148. [Google Scholar] [CrossRef]
  23. Pelit, H.; Arısüt, U. Roughness, wettability, and morphological properties of impregnated and densified wood materials. BioResources 2023, 18, 429–446. [Google Scholar] [CrossRef]
  24. Kang, C.W.; Hashitsume, K.; Jang, E.; Kolya, H. Relationship between wood anatomical features and surface roughness characteristics. Wood Res. 2023, 68, 455–464. [Google Scholar] [CrossRef]
  25. Thoma, H.; Peri, L.; Lato, E. Evaluation of wood surface roughness depending on species characteristics. Maderas Cienc. Y Tecnol. 2015, 17, 285–292. [Google Scholar] [CrossRef]
  26. Zou, Y.; Pan, P.; Zhang, N.; Yan, X. Effect of nano-silver solution microcapsules mixed with rosin-modified shellac microcapsules on the performance of water-based coating on andoung wood (Monopetalanthus spp.). Coatings 2024, 14, 286. [Google Scholar] [CrossRef]
  27. Yang, Y.; Xu, W.; Liu, X.; Wang, X. Study on permeability of cunninghamia lanceolata based on steam treatment and freeze treatment. Wood Res. 2021, 66, 721–731. [Google Scholar] [CrossRef]
  28. Xia, Y.; Li, W.; Yan, X. Effect of shellac microcapsules blended with carbonyl iron powder and carbon nanotubes on the self-healing and electromagnetic wave absorption properties of waterborne coatings on fiberboard surface. Coatings 2023, 13, 1572. [Google Scholar] [CrossRef]
  29. Sang, R.; Yang, S.; Fan, Z. Effects of MDF substrate surface coating process on UV inkjet print quality. Coatings 2023, 13, 970. [Google Scholar] [CrossRef]
  30. Wu, Q.; Li, W.; Yan, X. Effect of microcapsules on mechanical, optical, self-healing and electromagnetic wave absorption in waterborne wood paint coatings. Coatings 2023, 13, 1478. [Google Scholar] [CrossRef]
  31. Xia, Y.; Yan, X. Preparation of UV topcoat microcapsules and their effect on the properties of UV topcoat paint film. Polymers 2024, 16, 1410. [Google Scholar] [CrossRef] [PubMed]
  32. Xia, L.; Han, Y.; Yin, T.; Zhu, Y.; Yan, X.; Li, J. Effects of mixed microcapsules in different proportions on aging resistance and self-healing properties of waterborne coatings for Tilia europaea L. Coatings 2024, 14, 1042. [Google Scholar] [CrossRef]
  33. Liu, Q.; Gao, D.; Xu, W. Effect of paint process on the performance of modified poplar wood antique. Coatings 2021, 11, 1174. [Google Scholar] [CrossRef]
  34. Ding, T.; Yan, X. Preparation process optimization for melamine resin covered pomelo peel flavonoid antibacterial microcapsules and their effect on waterborne paint film performance. Coatings 2024, 14, 654. [Google Scholar] [CrossRef]
  35. Fu, Y.; Chen, J. Reversibly photochromic wood constructed by electric field-assisted self-assembled chitosan and tungsten trioxide coatings. Wood Mater. Sci. Eng. 2024, 19, 1–9. [Google Scholar] [CrossRef]
  36. Zhong, Z.; Hiziroglu, S.; Chan, C. Measurement of the surface roughness of wood based materials used in furniture manufacture. Measurement 2013, 46, 1428–1487. [Google Scholar] [CrossRef]
  37. Hu, W.; Guan, H. A finite element model of semi-rigid mortise-and-tenon joint considering glue line and friction coefficient. J. Wood Sci. 2019, 65, 14. [Google Scholar] [CrossRef]
  38. Fu, W.; Guan, H. Numerical and theoretical analysis of the contact force of oval mortise and tenon joints concerning outdoor wooden furniture structure. Wood Sci. Technol. 2022, 56, 1205–1237. [Google Scholar] [CrossRef]
  39. Villar-García, J.R.; Moya Ignacio, M.; Vidal-López, P.; Rodríguez-Robles, D. Frictional behavior of chestnut (Castanea sativa Mill.) sawn timber for carpentry and mechanical joints in service class 2. Sustainability 2024, 16, 3886. [Google Scholar] [CrossRef]
Figure 1. Diagram of positions for roughness tests of (a) mortise and (b) tenon.
Forests 15 01584 g001
Figure 2. Main procedure for manufacturing samples of mortise (a) and tenon (b) for measuring roughness of mortise and tenon.
Forests 15 01584 g002
Figure 3. Dimensions of cut-open mortise (a) and tenon (b) samples for measuring roughness.
Forests 15 01584 g003
Figure 4. Machine scheme of tenon depicting a diagram of feeding speed along the milling path.
Forests 15 01584 g004
Figure 5. Setup for measuring roughness of mortise and tenon: (a) close-look of measuring condition, and (b) devices of setup.
Forests 15 01584 g005
Figure 6. Typical roughness profile of one mortise (a) and one tenon (b) in the length direction.
Forests 15 01584 g006
Figure 7. Surface morphologies of one tenon (a) and one mortise (b) measured by AFM.
Forests 15 01584 g007
Figure 8. Color contour plots of surface roughness of unassembled mortise (a), unassembled tenon (b), assembled mortise (c), and assembled tenon (d).
Forests 15 01584 g008
Figure 9. Normal distribution test of roughness data considering effects of measured positions.
Forests 15 01584 g009
Figure 10. Normal distribution test of roughness data of 180 measurements considering effects of assembly condition.
Forests 15 01584 g010
Table 1. Three-way UNIANOVA of factors influencing roughness of mortise and tenon.
SourcesF-Valuep-Value
Sample type (S)45.6<0.001 *
Thickness direction (T)48.0<0.001 *
Length direction (L)0.0130.987
S × T35.2<0.001 *
S × L0.4210.657
T × L0.2560.906
S × T × L0.3810.822
* means the factor has significant effects at the 5% significance level.
Table 2. Mean comparisons of roughness of mortise and tenon considering measured position in thickness direction and sample type.
Length
Direction
Thickness
Direction
Sample Type
TenonMortise
L1T13.39 (18.7) Bb4.43 (8.3) Aa
T25.17 (16.1) Aa4.67 (11.3) Aa
T33.27 (27.1) Bb4.33 (13.1) Aa
L2T13.24 (20.2) Bb4.54 (9.6) Aa
T25.16 (20.4) Ba4.60 (13.6) Aa
T33.22 (25.7) Bb4.42 (12.5) Aa
L3T13.50 (22.5) Bb4.57 (9.29) Aa
T24.99 (19.0) Aa4.59 (15.0) Aa
T33.04 (23.8) Bb4.61 (13.5) Aa
Note: The mean values in the same row not followed by a common uppercase letter are significantly different from one another at the 5% significance level. The mean values in the same column not followed by a common lowercase letter are significantly different from one another at the 5% significance level. The values in the parentheses are coefficients of variance (COV).
Table 3. UNIANOVA of the selected factors influencing the roughness of tenon.
SourcesF-Valuep-Value
Assembly condition (A)527.2<0.001 *
Thickness direction (T)7.6<0.001 *
Length direction (L)21.7<0.001 *
A × T16.5<0.001 *
A × L14.5<0.001 *
T × L4.40.002 *
A × T × L7.9<0.001 *
* It means significant at 5% significance level.
Table 4. Comparison of roughness of tenon for assembly condition with each combination of length and thickness measured position.
Length
Direction
Thickness
Direction
Assembly ConditionReducing
Ratio (%)
UnassembledAssembled
L1T13.39 (18.7) Ab2.69 (19.6) Ba20.7
T25.17 (16.1) Aa1.33 (15.1) Bb74.3
T33.27 (27.1) Ab3.09 (18.3) Ba5.7
L2T13.24 (20.2) Ab2.78 (21.4) Ba14.1
T25.16 (20.4) Aa1.97 (22.0) Bb61.8
T33.22 (25.7) Ab3.06 (14.5) Ba4.9
L3T13.50 (22.5) Ab3.23 (16.7) Ba7.9
T24.99 (19.0) Aa3.63 (15.9) Ba27.1
T33.04 (23.8) Ab2.90 (10.5) Ba4.6
Note: The mean values in the same row not followed by a common uppercase letter are significantly different from one another at the 5% significance level. The mean values in the same column not followed by a common lowercase letter are significantly different from one another at the 5% significance level. The values in the parentheses are coefficients of variance (COV).
Table 5. Comparison of roughness of tenon for measured position in length direction with each combination of assembly condition and measured position in thickness direction.
Thickness
Direction
Assembly
Condition
Length Direction
L1L2L3
T1Unassembled3.39 (18.7) A3.24 (20.2) A3.50 (22.5) A
Assembled2.69 (19.6) B2.78 (21.4) B3.23 (16.7) A
T2Unassembled5.17 (16.1) A5.16 (20.4) A4.99 (19.0) A
Assembled1.33 (15.1) C1.97 (22.0) B3.63 (15.9) A
T3Unassembled3.27 (27.1) A3.22 (25.7) A3.04 (23.8) A
Assembled3.09 (18.3) A3.06 (14.5) A2.90 (10.5) A
Note: The mean values in the same row not followed by a common uppercase letter are significantly different from one another at the 5% significance level. The values in the parentheses are coefficients of variance (COV).
Disclaimer/Publisher’s Note: The statements, opinions and data contained in all publications are solely those of the individual author(s) and contributor(s) and not of MDPI and/or the editor(s). MDPI and/or the editor(s) disclaim responsibility for any injury to people or property resulting from any ideas, methods, instructions or products referred to in the content.