Article

Spatiotemporal Dynamics Effects of Green Space and Socioeconomic Factors on Urban Agglomeration in Central Yunnan

1
Faculty of Architecture and City Planning, Kunming University of Science and Technology, Kunming 650500, China
2
Shangri-La Housing and Urban-Rural Development Bureau, Shangri-La 674400, China
3
Campus Greening Center, Kunming University of Science and Technology, Kunming 650500, China
4
Yunnan Provincial Archives of Surveying and Mapping, Kunming 650034, China
*
Author to whom correspondence should be addressed.
Forests 2024, 15(9), 1598; https://doi.org/10.3390/f15091598
Submission received: 25 July 2024 / Revised: 7 September 2024 / Accepted: 8 September 2024 / Published: 11 September 2024
(This article belongs to the Section Forest Ecology and Management)

Abstract

:
In the current context of urbanization, urban agglomerations face complex challenges in maintaining an ecological balance. This study uses remote sensing images of the Central Yunnan urban agglomeration from 2000 to 2020, along with socioeconomic data, to analyze the spatiotemporal characteristics of the green space evolution. Utilizing dynamic geographically weighted regression analysis based on principal components (PCA-GWR), we identify the key socioeconomic factors influencing these changes and quantitatively analyze the driving forces in each stage. Our findings reveal a continuing trend of decreasing total green space alongside increasing individual forest types and pronounced regional disparities in green space dynamics. The results indicate that socioeconomic factors exert both positive facilitative effects and negative pressures, with evident spatial and temporal variability. Urbanization and economic development promote forest expansion in certain areas, while contributing to the reduction in farmland and shrub–grass lands. Significant variations are influenced by factors such as the urbanization rate, the agricultural population, the industrial composition, and fiscal revenue. This study enhances the in-depth understanding of the relationship between the spatiotemporal dynamics of green spaces and socially driven mechanisms, offering significant insights for sustainable urban planning and landscape management and harmonizing urban agglomeration development.

1. Introduction

Green spaces, which include natural or semi-natural ecosystems such as urban forests, gardens, vertical greening, urban farmland, and wetlands [1,2], play a critical role in urban ecosystems through providing vital ecosystem services [3]. These services encompass climate regulation, carbon sequestration, biodiversity conservation, the removal of pollutants, recreational areas, and the enhancement of urban aesthetics, which, in turn, can increase property values and contribute to human well-being [4,5,6,7,8,9,10]. Green spaces are also essential for public health [11,12], urban sustainability [13,14], and environmental resilience [15]. However, rapid urbanization poses significant threats to green spaces, leading to their reduction and subsequent negative impacts on regional ecological systems [16,17]. Urban agglomerations, as the epicenters of urbanization and economic development, face unique challenges in green space management due to rapid population growth, infrastructure expansion, and land use changes [18,19].
Research on the spatiotemporal dynamics of green spaces can help to identify and conserve areas experiencing green space loss or degradation, which is crucial in targeting conservation efforts and ensuring sustainable urban planning and management [20,21,22]. This has emerged as a key aspect of sustainable urban agglomeration development [3,23,24,25,26,27,28]. Most of the studies on domestic urban agglomerations have focused on the characteristics of green space changes in urban agglomerations in developed regions, such as the Yangtze River Delta region [29], the Guangdong–Hong Kong–Macao Greater Bay Area [30,31,32,33], Beijing–Tianjin–Hebei [17,18], and the middle reaches of the Yangtze River [34,35]. Few studies have systematically analyzed the differences in green space changes in urban agglomerations in the less-developed region of Southwest China [18]. Due to the significant differences in socioeconomic development between different urban agglomerations, the dynamics of their green spaces also show great variation.
The current research focuses on investigating the impact of urbanization on the evolution of green spaces, with a particular emphasis on the changing patterns, processes, and drivers that influence their distribution, composition, and quality within urban landscapes [36,37,38]. Various data and quantitative methods have been employed to research the spatial–temporal trends and related driving mechanisms of urban green spaces [39,40,41,42,43]. Remote sensing and land use data, characterized by long time series and high resolutions, are frequently utilized as foundational datasets. The 3S technology has become a cornerstone in monitoring these dynamics, allowing for a deeper understanding of the impact of urbanization on the quality and distribution of green spaces, especially in rapidly expanding cities [44]. Statistical datasets, including the GDP and population, are commonly employed to examine the correlations with green space changes [45,46]. Quantitative analysis is performed based on area changes, land use type transitions, and the examination of landscape patterns and morphology [47,48]. Methods for the quantitative analysis of drivers include mathematical statistics and spatial statistical models, such as correlation analysis, stepwise regression analysis, random forest analysis, geodetectors, and geographically weighted regression [49,50,51,52]. Through calculating and comparing the q-values of each individual factor with the q-value of the combination of two factors, a geodetector can determine whether there is an interaction between the two factors and assess the nature of this interaction (i.e., whether it is strong, weak, directional, linear, or non-linear). The geodetector method is widely used for detecting spatial interactions. Zheng et al. (2023) apply it to assess green space equity in China [50], Wang et al. (2021) evaluate thermal benefits [53], Yang et al. (2021) analyze green space quality and heterogeneity [54], and Ben Messaoud et al. (2024) study green space dynamics in Tunis [55]. It is also used by local governments and planners in the Guangdong–Hong Kong–Macau Greater Bay Area to address regional and socio-environmental variations [32]. This demonstrates the method’s crucial role in understanding spatial interactions and drivers of green space dynamics. Changes in green spaces are mainly driven by natural environment and socioeconomic factors [3,56,57]. The natural environment encompasses factors such as the altitude, slope, rainfall, temperature, and soil type [58,59,60,61], while socioeconomic factors mainly include population migration, economic growth, and urban expansion [29,59,62]. Recent studies have highlighted the importance of exploring the driving mechanisms behind these changes and have shown that socioeconomic factors play a significant role in the spatiotemporal dynamics of green spaces [15,63]. Despite these findings, many studies have overlooked the influence of socioeconomic determinants, focusing mainly on the geographical impact on the environment.
In summary, focusing on the urban agglomeration of Central Yunnan, this study aims to explore the spatiotemporal dynamics and socioeconomic drivers of the green spaces in this region, seeking to provide insights into the complex interplay between human activities and policy interventions that shape the evolution of green spaces. This research fills a gap in the study of less-developed regions in Southwest China. Additionally, it contributes to the understanding of the spatiotemporal dynamics of green spaces in urban agglomerations through the lens of socioeconomic mechanisms. This study primarily addresses the following two research questions: 1. How do green spaces within the Central Yunnan urban agglomeration change over time, both spatially and temporally? and 2. What are the socioeconomic factors driving the dynamics of the green spaces within the Central Yunnan urban agglomeration? Addressing these questions can improve the understanding of green space changes and their driving mechanisms in different areas, informing strategies for sustainable urban development, environmental management, and the promotion of resilient and high-quality urban landscapes in Central Yunnan.

2. Materials and Methods

2.1. Study Area

The Yunnan Central Urban Agglomeration is located in the mid-eastern region of Yunnan Province and includes Kunming, Qujing, Yuxi, Chuxiong, and seven counties of Honghe, comprising a total of 49 counties and districts (Figure 1). The region’s topography is characterized by high elevation in the north and lower elevation in the south, with altitudes ranging from 116 to 4282 m. The terrain is primarily mountainous with intermountain basins, containing 67% of the dam area resources in the province.
This study area is situated at the intersection of the “Belt and Road” initiative and the Yangtze River Economic Belt in China. It is the most-developed region in Yunnan and one of the 19 national key cultivated urban agglomerations. Additionally, it is a crucial part of the urbanization strategic “two horizontal and three vertical” layout, and serves as a core area facing South and Southeast Asia.

2.2. Methodological Framework

Green space changes are spatially heterogeneous processes, with the quality and transformation of green spaces being closely linked to varying levels of urbanization and city development [39,54]. Accordingly, this study is divided into two main parts: the temporal changes in green space across multiple scales, and the spatiotemporal heterogeneity of the driving factors. Figure 2 illustrates the framework proposed in this study. Firstly, the green space classification of the study area was derived from multi-temporal image data. A comprehensive analysis of dynamic changes across various temporal and spatial scales was then conducted, focusing on the overall scale as well as the district (county)scales. The analysis encompasses five periods: 2000–2005, 2005–2010, 2010–2015, 2015–2020, and 2000–2020. Secondly, principal component analysis was employed to identify the primary drivers for each period, based on extensive socioeconomic data. Utilizing these data, spatiotemporal geographically weighted regression (GWR) methods were applied to investigate the spatial and temporal variations in the driving mechanisms at the district (county) levels.

2.3. Data Collection and Research Methods

2.3.1. Data Collection and Processing

The study image data came from a geospatial data cloud platform (http://www.gscloud.cn/, accessed on 10 January 2020), and ENVI 5.3 was used to preprocess the Landsat images to obtain remote sensing images for four periods (2000, 2005, 2010, 2020) in the study area. Referring to the standard of land use status classification (GB/T21010-2017) [64] and the research of relevant scholars [29,65,66,67], green spaces and non-green spaces are regarded as the first-level classification and forest spaces, farmland spaces, shrub and grass spaces, and water spaces are regarded as the second-level classification of green spaces.
Relevant driving factors were collected from the social economy [68,69,70]. A total of 14 driving factors, including the population, industry, and economy, were selected. In particular, the population density, the agricultural population, the urbanization rate, the GDP, the proportion of the primary industry (encompassing agriculture, forestry, fishing, and mining), the proportion of the second industry (encompassing manufacturing, construction, and mining), the gross output value of agriculture, the grain output, the fiscal revenue, the fiscal expenditure, the per capita net income of farmers, the per capita urban disposable income, the gross fixed asset formation (such as buildings, machinery, and equipment), and the tourism income were obtained from the historical statistical yearbooks of 49 districts and counties in the study area, and the driver database was established using ArcGIS 10.8.
Geographically weighted regression analysis based on principal components (PCA-GWR) was adopted [71]. Firstly, the principal components of the original variables were extracted, and the multicollinearity was removed. Then, the extracted principal components were used as the input independent variables of the geographically weighted regression (GWR) model for analysis. In the GWR, several local regression sample groups were constructed for each center in the whole study area to estimate the regression coefficients, and the spatial influence distribution of the principal components in each period was analyzed.

2.3.2. Extraction of Principal Components

(1) Principal component analysis (PCA): PCA is a common method used to solve the multicollinearity problem in multiple linear regression [72]. This study conducted a KMO test of the original variables based on principal component analysis, and the results showed that the KMO statistics in each period were above 0.8 (Table 1), indicating that the selected driving factors were suitable for PCA.
(2) Contribution rate: The higher the contribution rate, the stronger the original variable information contained in the PCA. The statistics showed that the first three principal components in each period met the requirements of an eigenvalue > 1 and a contribution rate > 70%. Therefore, only the first, second, and third principal components were selected to reflect the original variable information, revealing the main socioeconomic driving factors in each period. The principal component factor load reflects the correlation between the original variables and the principal components, which represent the weights of the original variables in the principal components. The absolute value of the loadings indicates the degree of correlation between the variables and the principal components. A larger absolute value indicates a stronger correlation, whereas a negative value indicates a negative correlation (Table 2).

2.3.3. Geographically Weighted Regression

Geographically weighted regression models can reflect the spatial heterogeneity and spatial interactions between independent variables and dependent variables [32,73]. The main driving factors of the social economy in the corresponding period for 49 districts and counties in the Central Yunnan urban agglomeration were taken as independent variables, and the geographically weighted regression model of ArcGIS 10.8 was used to analyze the spatial differences. The kernel type was ADAPTIVE (ADAPTIVE method) and the kernel bandwidth was the AIC (the optimal bandwidth was determined by the minimum information criterion).
Standardized residual rendering was used to measure the reliability of each coefficient estimate. The fitting effect was considered suboptimal when the value exceeded 2.5 times the standard deviation. Among the 49 districts (counties) in the study area, only 1 district (county) had a standard deviation greater than 2.5 times in each period, indicating that the selected main driving factors had a relatively good fitting effect with the single type of area of each green space.

3. Dynamics of Green Spaces in Central Yunnan Urban Agglomeration

3.1. Green Space Differences Based on Overall Spatiotemporal Scale

From 2000 to 2020, the total green space area and the individual green space types in the Central Yunnan urban agglomeration changed to varying degrees. The overall green space area decreased from 110,792.89 km2 to 107,994.41 km2, exhibiting a continuous decline. The rate of reduction was −2.53% over the period of 20 years, with the specific periods showing rates of −0.43%, −0.46%, −0.93%, and −0.72% for 2000–2005, 2005–2010, 2010–2015, and 2015–2020, respectively.
From a classification perspective, the area of forest spaces increased by 24,091.19 km2 from 2000 to 2020, with a change rate of 51.08%. The respective increases for the other periods were 4388.39 km2, 5406.35 km2, 7478.48 km2, and 6817.97 km2, with rates of change of 9.3%, 10.49%, 13.13%, and 10.58%, respectively. The area of farmland decreased by 16,994 km2 from 2000 to 2020, with a change rate of −47.11% and specific period reductions of −7.4%, −15.48%, −20.3%, and −15.20%. The area of shrub and grass spaces decreased by 9955.3 km2 from 2000 to 2020, with a change rate of −37.23% and period rates of −8.24%, −3.09%, −11.71%, and −20.05%. The area of water spaces increased by 59.64 km2 from 2000 to 2020, with a change rate of 7.32% and period rates of 0.99%, 1.44%, 1.84%, and 2.86% (Table 3).

3.2. Green Space Differences Based on District (County) Scale

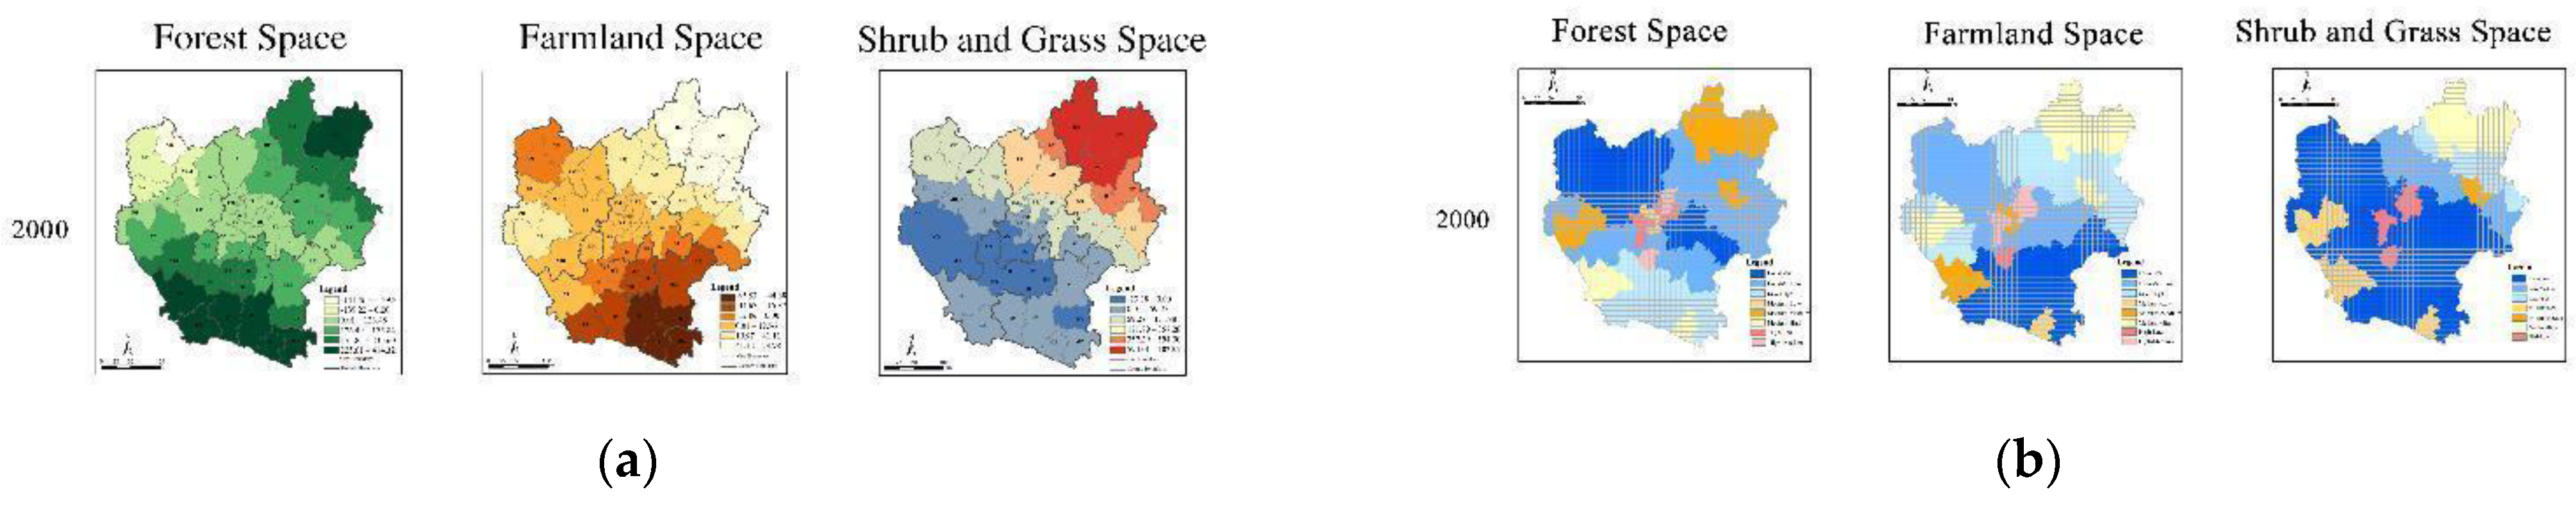
3.2.1. Temporal Variations in Green Spaces: A Comprehensive Analysis

Due to minor variations in water spaces, the analysis concentrated on the dynamics of forest spaces, farmland spaces, and shrub and grass spaces. From 2000 to 2020, the area of forest land demonstrated a consistent upward trajectory across all districts and counties within the study region. However, this growth was less pronounced in the central urban agglomeration, while significant expansion was observed in all peripheral districts and counties. By contrast, the area of cropland demonstrated an inverse trend, with a decline across all districts and counties. The peripheral districts showed a more pronounced decline, while the central districts exhibited a slight decline. There was a decrease in cultivated land in 43 of the 49 districts and counties. In line with this trend, the external districts and counties exhibited the most pronounced decline. Conversely, three districts and counties have seen an increase in Kunming and Honghe (Figure 3a).

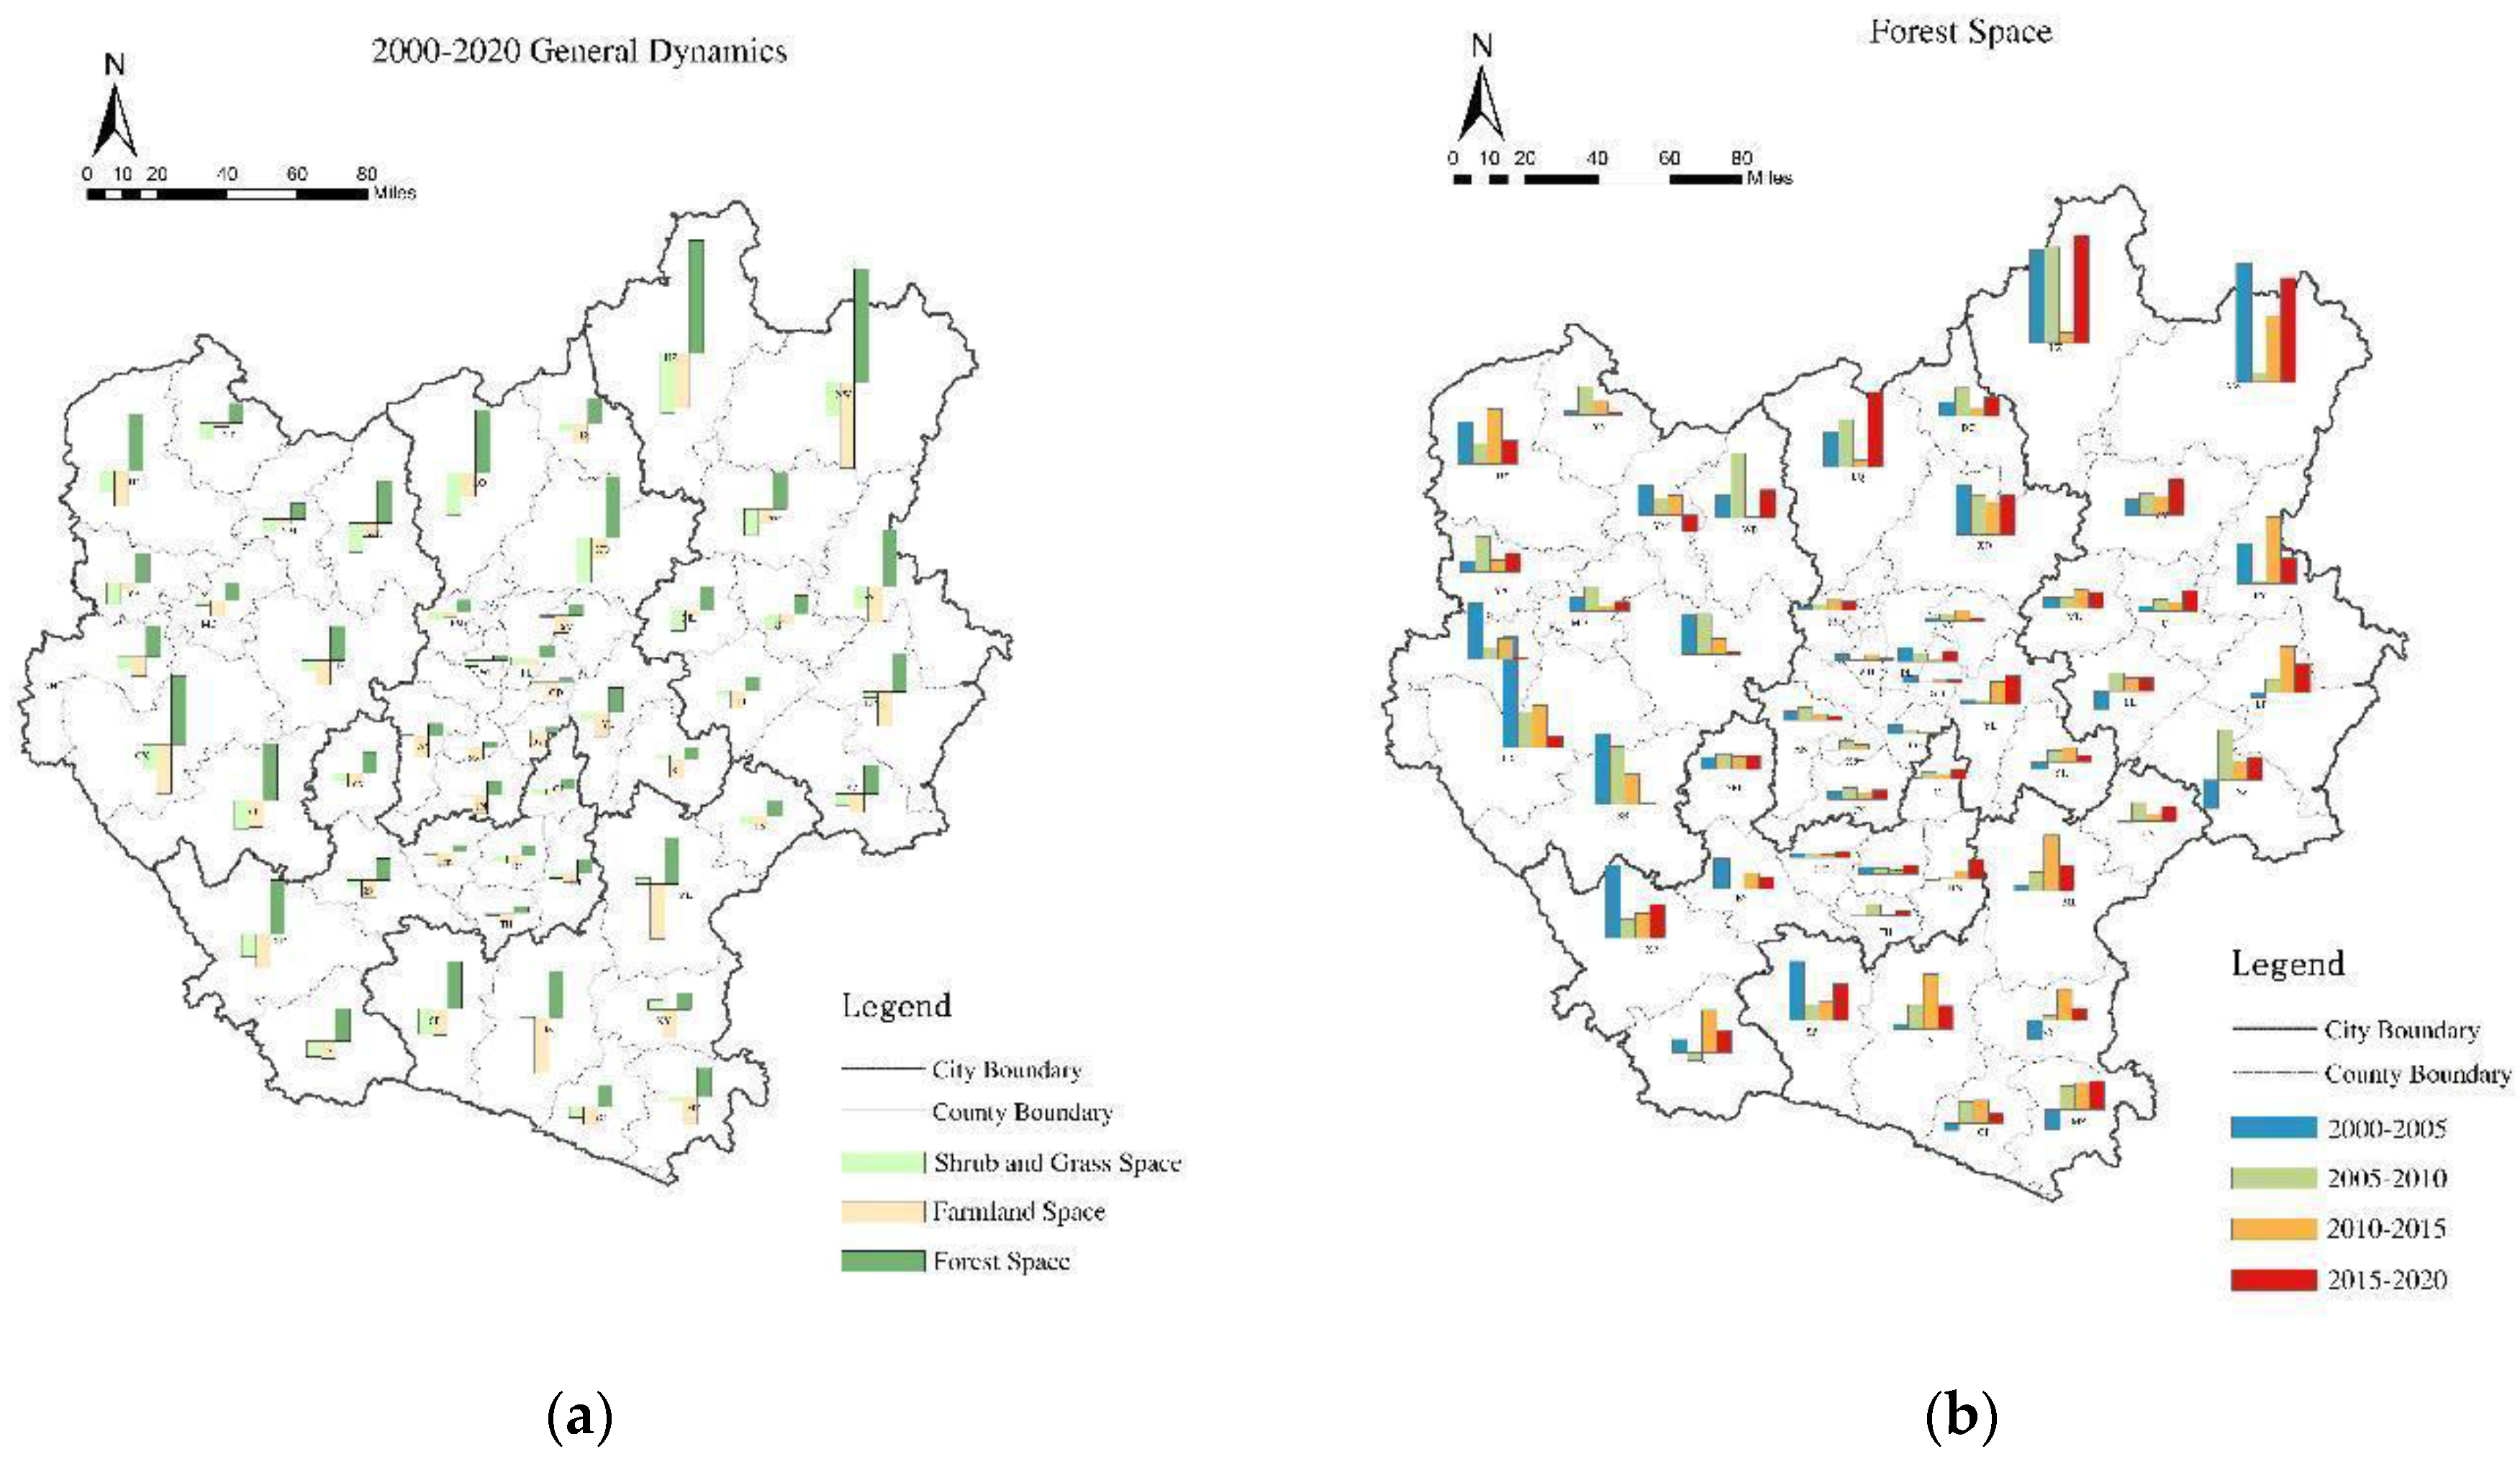
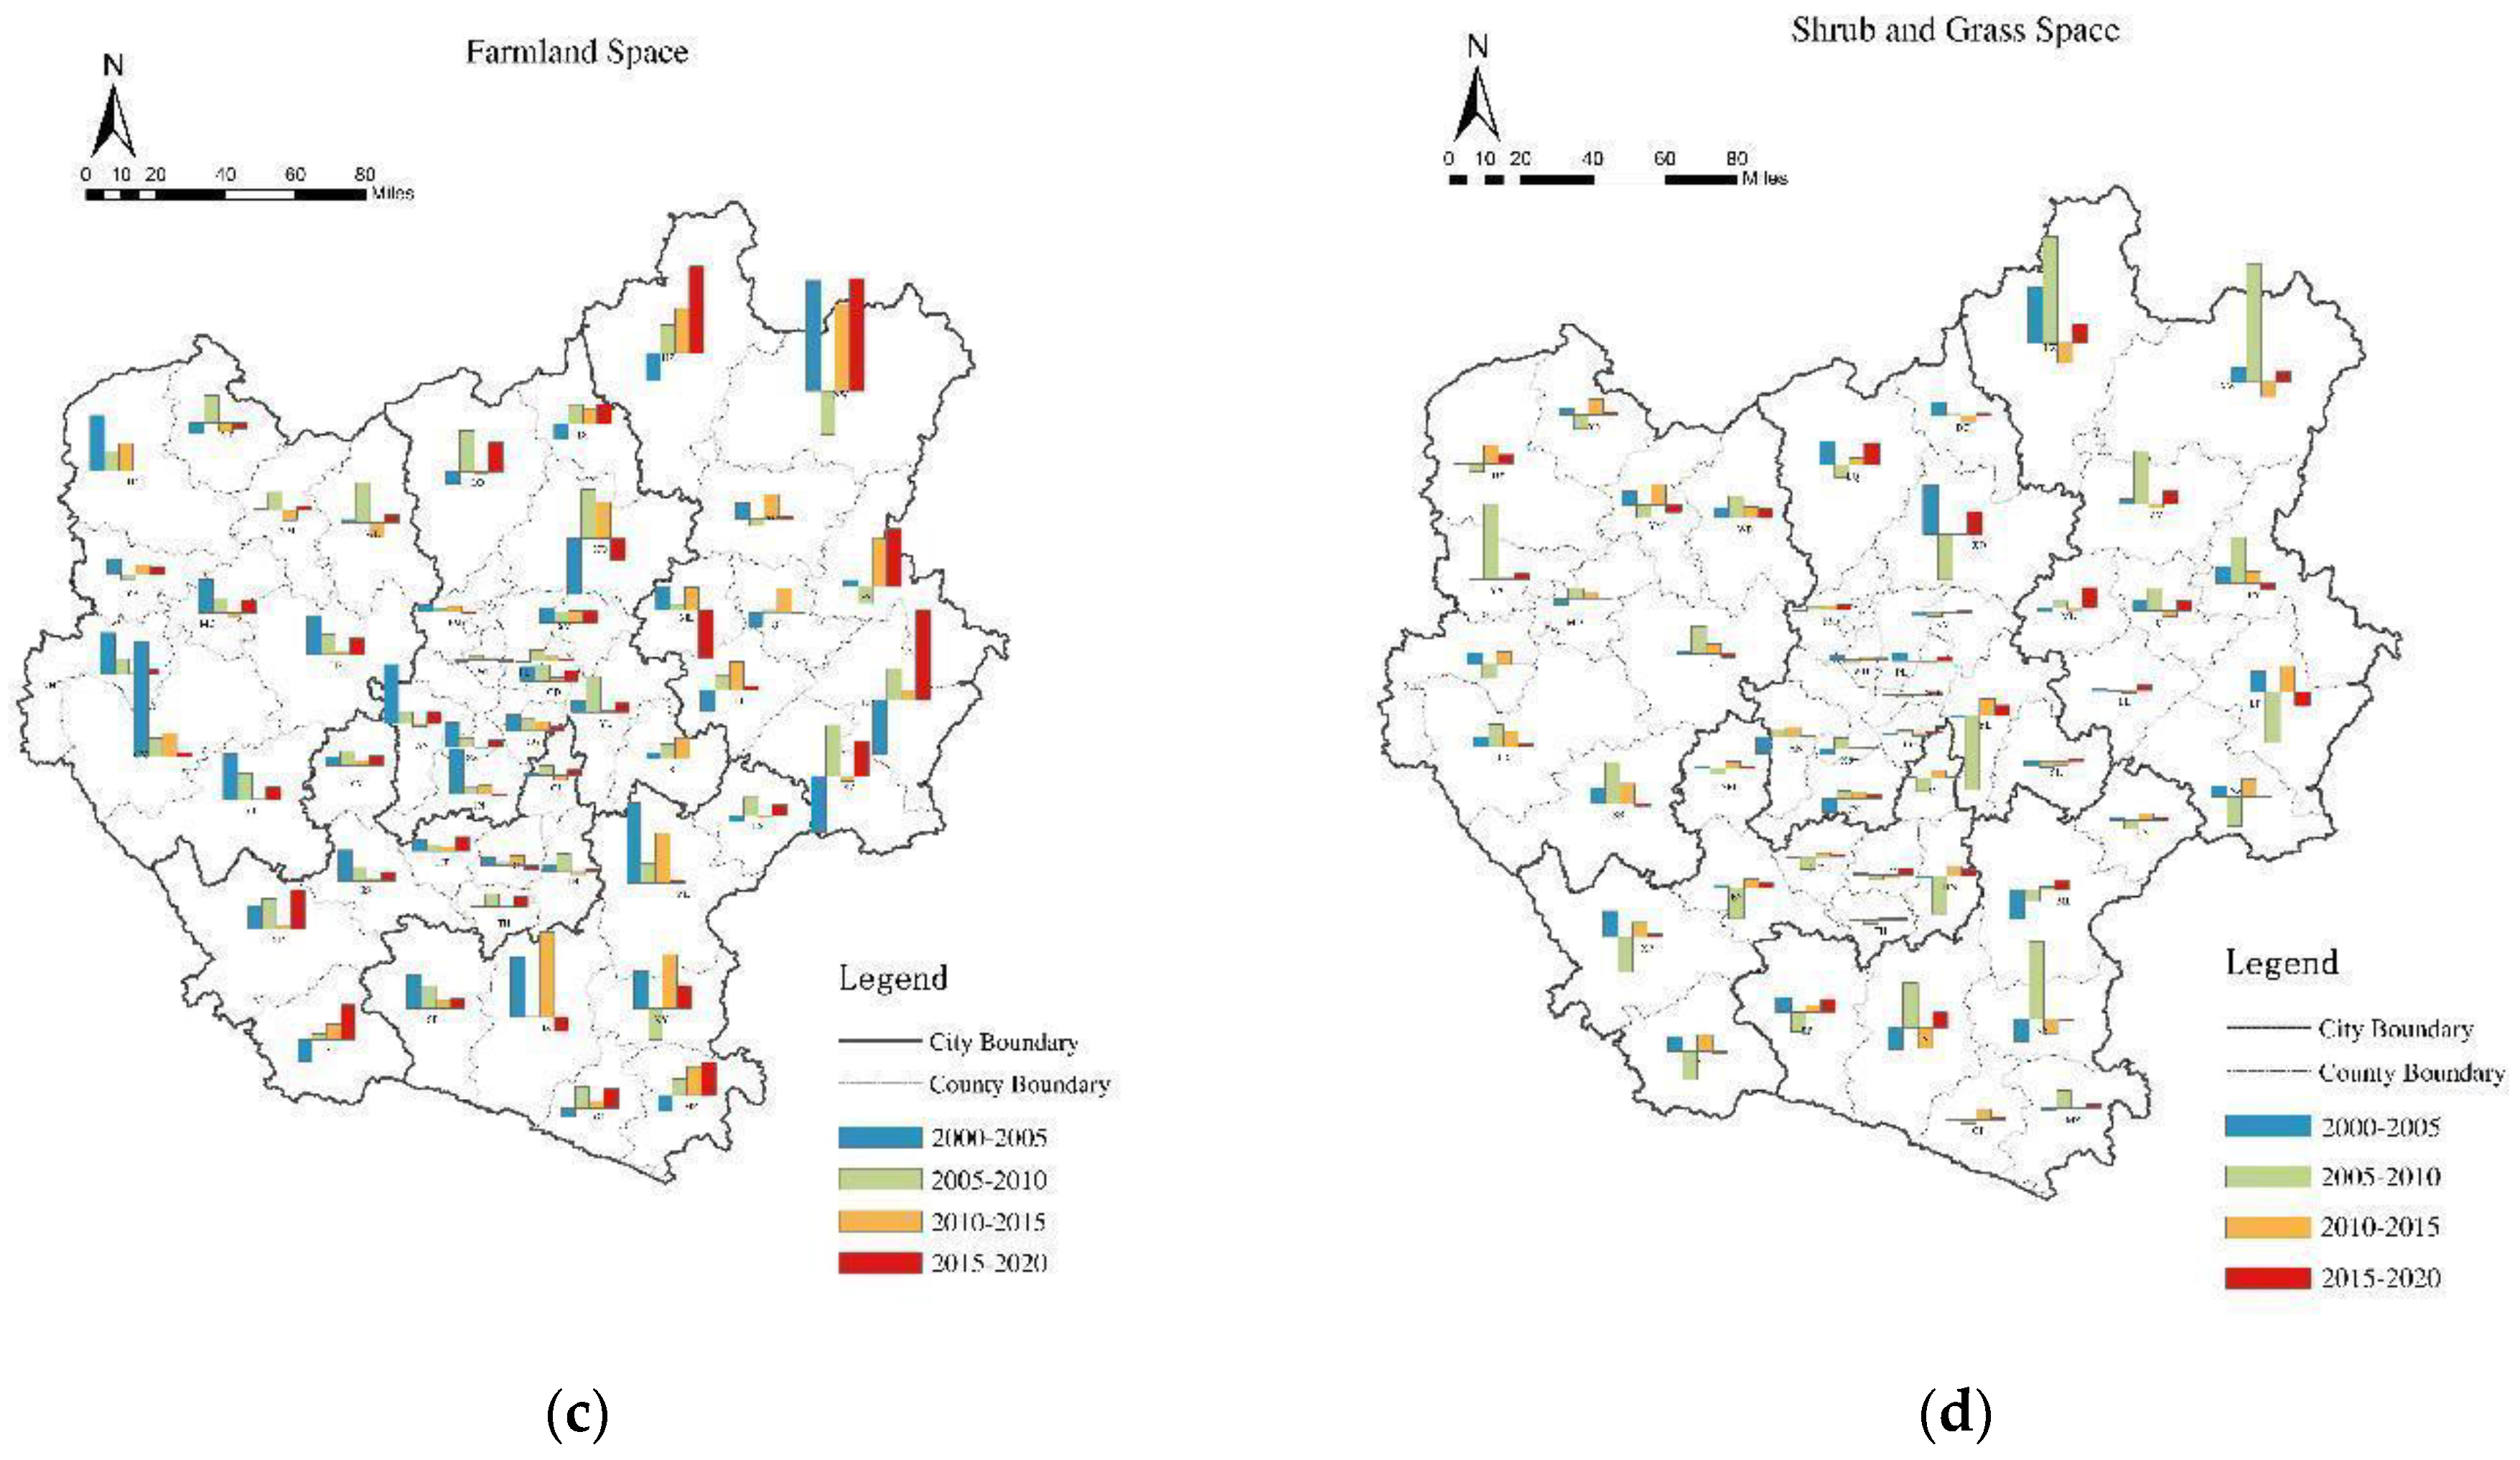
3.2.2. Variability in Green Space across Multiple Temporal Scales

From a specific multi-temporal perspective, the spatial vegetation dynamics of forest land reveal distinct growth patterns. From 2000 to 2005, higher growth was concentrated in the peripheral districts and counties of the Central Yunnan city cluster, including Luquan, Xuanwei, Huize, and Chuxiong, while 11 out of 49 districts and counties—mainly on the western and southwestern edges—experienced negative growth. From 2005 to 2010, Chuxiong, Qujing, and northern Kunming recorded higher growth rates, with negative growth limited to the western mountainous areas of Kunming and Yuanjiang County in Yuxi. The period from 2010 to 2015 saw significant improvements across most peripheral districts and counties, with no areas experiencing negative growth. However, from 2015 to 2020, only Yuanmou County in western Chuxiong Prefecture showed negative growth, while peripheral counties continued to experience sustained growth. Overall, across the four periods, most counties exhibited an upward trend, with only a few areas declining. The central city region of Central Yunnan consistently showed a modest positive growth trend throughout all periods (Figure 3b).
In contrast, the spatiotemporal dynamics of arable land area exhibit trends opposite to those of forest land. Most counties show a decreasing trend in arable land, with only a few areas experiencing increases. From 2000 to 2005, 34 districts and counties, primarily in the eastern and southern regions, saw a reduction in arable land area, while 15 districts and counties, mainly in Kunming and Honghe Prefecture, experienced an increase. From 2005 to 2010, the number of districts and counties with declining arable land area rose to 44, largely concentrated in urban agglomerations. This trend persisted in the periods 2010–2015 and 2015–2020, with 37 and 38 districts and counties, respectively, continuing to decrease in arable land area. The most significant reductions occurred in districts and counties on the periphery of Central Yunnan, especially in the northeast, with Xuanwei experiencing the largest decrease in area (Figure 3c).
Scrub and grassland areas fluctuated significantly, with periods of increase and decrease across various districts and counties. However, most areas exhibited a general downward trend. From 2000 to 2005, 30 districts and counties experienced a decrease in scrub and grassland areas, particularly in Qujing, Chuxiong, Yuxi in Central Yunnan, and in the northern marginal districts and counties of Kunming. Conversely, some districts and counties in southern Honghe Prefecture and the main urban area of Kunming showed an increasing trend. Between 2005 and 2010, the smallest decrease in both the number of districts and counties and the overall area was recorded, with only 21 districts and counties experiencing declines, mainly in the peripheral areas of Central Yunnan. During this period, most of the central region, including districts and counties in Kunming Municipality, experienced growth. From 2010 to 2015, 33 districts and counties saw a decrease, mainly in Chuxiong Prefecture in central-eastern Yunnan and Yuxi City in southeastern Yunnan, while increases were observed in the central area of Kunming and some central districts and counties in the eastern and southern parts of the city. The period from 2015 to 2020 witnessed the largest decline, with 40 districts and counties experiencing decreases, most notably in the Kunming region and around urban centers across the provinces (Figure 3d).

4. Socioeconomic Factors Associated with Spatial–Temporal Differences in Green Space Evolution

4.1. Influence of Socioeconomic Factors

Dynamic geographically weighted regression (GWR) analysis was employed to assess the relationship between the socioeconomic factors and the evolution of forest land, farmland, and shrub and grass spaces from 2000 to 2020. The analysis revealed notable spatial variations in the impact of different socioeconomic driving factors on green space areas, showing both positive and negative effects. Additionally, significant spatial differences in the influence of the same factor on green space types were observed across different periods.
As shown in Table 4, the urbanization rate and total grain output had a long-term influence on green space heterogeneity throughout all stages. Fiscal revenue impacted green spaces until 2010, while the agricultural population and the proportion of the secondary industry had a sustained effect from 2005 to 2020. The total investment in fixed assets significantly influenced green spaces during the intermediate period of 2005–2015. In contrast, GDP showed a significant effect only after 2015, whereas the gross output value of agriculture, forestry, animal husbandry, and fishery, along with fiscal expenditure, only had an effect in 2000.

4.2. Spatial Impact Differences for Major Socioeconomic Factors

4.2.1. Urbanization Rate

The urbanization rate emerged as a primary driver from 2000 to 2020 (Figure 4a). Initially, it negatively impacted forest spaces across the study area from 2000 to 2015. However, a distinctive positive correlation with forest spaces emerged in 2020. For farmland spaces, the negative impacts gradually diminished from northeast to southwest from 2000 to 2020, with low positive effects observed in the southwest before 2010 and overall negative effects after 2015. Similarly, shrub and grass land spaces exhibited negative impacts from 2000 to 2015, with slight positive effects in the south in 2000 and 2015, transitioning to entirely positive impacts across the region by 2020, mirroring the forest space trends.
High urbanization positively impacted forest spaces, particularly in Kunming’s main urban areas (Figure 4b). Conversely, low urbanization had a disproportionately negative impact on forest spaces, primarily in northeastern Central Yunnan in 2000. Moderate urbanization exerted consistently negative effects on forest spaces from 2005 to 2015, while high urbanization negatively affected farmland and shrub and grass land spaces during this period. By 2020, high urbanization had the most pronounced negative impact on farmland spaces, particularly in the northeast, while moderate urbanization positively influenced shrub and grass land spaces.

4.2.2. Fiscal Revenue

From 2000 to 2010, the fiscal revenue played a pivotal role in driving the evolution of green spaces within the Central Yunnan urban agglomeration (Figure 5a). For forest spaces, it initially exhibited a negative impact (except the eastern and northern regions) in 2000, followed by a positive effect from 2005 to 2010, concentrated in the southwest. Conversely, its impact on farmland spaces was partially negative in the west in 2000 and the northwest in 2010, with an overall positive effect observed in 2005. Regarding shrub and grass land spaces, the fiscal revenue initially showed positive effects in the central and western regions but had negative effects elsewhere in 2000. Subsequently, from 2005 to 2010, it exerted a uniform positive impact, predominantly in the eastern, northern, and southwestern regions.
Low fiscal revenue positively influenced forest spaces from 2005 to 2010, mainly in the western region, whereas it negatively affected farmland spaces in 2000 and 2010, particularly in the western region. In 2000, low fiscal revenue had a notably adverse impact on shrub and grass land spaces, primarily in the northeast (Figure 5b).

4.2.3. Agricultural Population

The agricultural population dynamics were influential from 2005 to 2020 (Figure 6a). During this period, positive impacts on forest spaces were evident in the eastern and northeastern regions until 2015, extending across the entire study area by 2020. Conversely, the impacts on farmland spaces exhibited the opposite trend, with positive effects in the west and negative effects in the east and northeast from 2005 to 2015, expanding to encompass the entire study area by 2020, with stronger effects observed in the north than in the south. Meanwhile, the impacts on shrub and grass land spaces grew increasingly positive from south to north.
From 2000 to 2020, the large agricultural population positively affected forest spaces, primarily in the northeast. However, the correlations with farmland and shrub and grass land spaces were less pronounced from 2005 to 2015, with a notable negative impact on farmland spaces in the east by 2020, countered by positive impacts on shrub and grass land spaces, particularly in the northeastern region (Figure 6b).

4.2.4. Proportion of Secondary Industry

The proportion of secondary industry exhibited varied impacts from 2005 to 2020 (Figure 7a). For forest spaces, positive and negative effects were observed from 2005 to 2015, with the positive effects concentrated in the west in 2005, southeast in 2010, and across most regions with the exception of a few northern cities in 2015, transitioning to overall positive impacts in 2020. Farmland spaces saw concentrated positive impacts in eastern cities in 2005, expanding to eastern, northern, and central counties in 2010 and to western and southern counties in 2015. The negative impacts were concentrated in western cities in 2005, central and southwestern cities in 2010, southeastern cities in 2015, and the entire region by 2020, with significantly stronger negative effects in the north than in the south. Shrub and grass land spaces consistently exhibited positive effects in eastern and southern cities and negative effects in western counties from 2005 to 2010, transitioning to a pattern of increased effects extending from the east toward the northeast (2015) and entirely positive effects across the region (2020).
Low proportions of secondary industry negatively impacted forest land spaces, primarily in the northwest. Medium and high proportions of secondary industry negatively impacted farmland spaces in all periods, particularly in the northeast. A high proportion of secondary industry positively influenced shrub and grass land spaces, mainly in the northeast (Figure 7b).

4.2.5. Fiscal Expenditure

The fiscal expenditure exhibited significant impacts only in 2000 (Figure 8a). For forest spaces, the positive impacts were concentrated in the northeast and southern regions, with notable effects in Xinping, Yuanjiang, Shiping, Jianshui, Gejiu, and Mengzi within Mengzi City. Conversely, the negative impacts were concentrated in the northwestern regions of Yunnan. Regarding farmland spaces, negative impacts were prevalent in the central, northwestern, and southern regions, with Hongta, Jiangchuan, and seven districts and counties of Mengzi experiencing the most significant negative impacts. The positive impacts were mainly concentrated in the northeast and west. Shrub and grass land spaces exhibited negative impacts in the central, western, and southern regions, with the most substantial negative impacts in Shuangbai, Yimen, and Jinning. Positive impacts were concentrated in the northeast and north.
Medium and low fiscal expenditure positively impacted forest land spaces, primarily in the southwest. Farmland and shrub and grass land spaces experienced negative impacts with low fiscal expenditure, mainly in the west and south (Figure 8b).

4.2.6. Total Output Value of Agriculture, Forestry, Animal Husbandry, and Fishery Industries

The output value of the agriculture, forestry, animal husbandry, and fishery industries was the main driving force in 2000 only (Figure 9a). It had a positive effect on the forest spaces and the farmland spaces in the whole region, mainly concentrated in the southwest, with the greatest effect in Yuxi for the former and in the western and eastern regions, with the greatest effect in Chuxiong, Nanhua, for the latter. For the shrub and grass land spaces, most of the regions had positive effects and the northwestern region had the largest one. However, a negative effect axis was formed in the northeast region. In 2000, the low, medium, and high output of the agricultural, forestry, animal husbandry, and fishery industries had the same effect on each single type of green space (Figure 9b).

5. Discussion

5.1. Spatiotemporal Characteristics of Green Space Evolution

The multi-scale analysis from 2000 to 2020 reveals that the total area of green spaces, as well as individual types of green spaces at different scales within the Central Yunnan urban agglomeration, have undergone significant changes to varying degrees. At different scales, there is a noticeable trend of gradual shrinkage in urban and rural green spaces, accompanied by the expansion of non-green spaces. Specifically, this is reflected in the growth of forest spaces, the shrinkage of farmland and shrub–grass land spaces, and the slow growth of water spaces. However, the spatial differences in the dynamic changes in green spaces are also highly significant. Analyzing the overall trend in green space changes across district and county scales reveals a comprehensive reduction in the green space area, primarily due to increased forest and water spaces, alongside continuous declines in farmland and shrub–grass land spaces. The most substantial reductions occur in the central areas of the urban agglomeration, contrasting with the minimal reductions in peripheral areas.
The urban agglomeration in Central Yunnan has transitioned from a “single-core” model centered around Kunming to a “main city and four secondary cities” structure. However, the continuous expansion of non-green spaces poses a significant threat to the overall green space integrity. These findings align closely with research on other major urban agglomerations in China, underscoring the common challenges associated with urban expansion and its impact on green spaces. An analysis across five temporal scales reveals minimal spatial dynamics in water bodies yet indicates a consistent upward trend. Effective ecological governance, exemplified by initiatives such as the Dianchi Lake wetland ecological restoration project, has played a crucial role in safeguarding the water system environment throughout Central Yunnan’s urban agglomeration [30,31,73]. These efforts reflect broader strategies aimed at mitigating the adverse effects of urban expansion on regional green spaces and water systems.

5.2. Analysis of Driving Factors of Greenspace

The interactions between socioeconomic factors continue to drive the dynamic evolution of green spaces in the urban agglomeration of Central Yunnan, marked by positive and negative feedback adjustments [50,51,52]. Socioeconomic factors prominently shape the dynamic changes in green spaces, with significant spatial variations observed across different periods. Notably, the urbanization rate, the agricultural population, and the proportion of secondary industry exert substantial and enduring impacts on the green spaces within Central Yunnan’s urban agglomeration.
The analysis of the socioeconomic factors indicates that the positive drivers of forest land expansion include the urbanization rate, agricultural population, fiscal income, and proportion of secondary industry. Conversely, the negative drivers contributing to the farmland space reduction include the urbanization rate, agricultural population, fiscal revenue, and proportion of secondary industry. Shrub and grass land space reductions are primarily driven by the urbanization rate and agricultural population.
Urbanization emerges as the primary catalyst for dynamic changes in green spaces within Central Yunnan’s urban agglomeration, facilitating industrial structure upgrades and optimizing the production structures through resource integration and infrastructural improvements. The period from 2005 to 2015 witnessed socioeconomic factors exhibiting mismatches with the development levels of individual green space types, a disparity that was significantly mitigated by 2020. This evolution reflects the shifting urban development paradigms, promoting coordinated economic and ecological development across the study area.
During the period from 2000 to 2020, social and economic factors exhibited significant disparities across each type of green space in the study area, highlighting a lack of coordinated development between economic growth and ecological construction in the urban agglomeration of Central Yunnan [18,19,53]. This disparity is largely attributed to the diverse levels of development among the 49 districts and counties within the agglomeration. While local governments’ financial support plays a pivotal role in the evolution of green space, the uneven distribution of financial resources has hindered development in certain regions. Specifically, both financial revenue and expenditure have shown limited effectiveness in driving green space initiatives, reflecting systemic challenges. Local governments’ efforts in ecological protection have been influential, albeit constrained by a historical bias favoring rapid, short-cycle projects over long-term environmental management. This approach poses challenges to achieving coordinated green space development, particularly in underdeveloped areas.

5.3. Potential Applications and Limitations

With the ongoing advancement of urban development, policy planning plays a crucial role in guiding the dynamic changes in green spaces within the urban agglomeration of Central Yunnan. Positioned as a pivotal province for national ecological restoration and the construction of an ecological civilization, Yunnan’s provincial governments at various levels have introduced numerous policies and plans tailored to each type of green space. Empirical evidence demonstrates that these policy measures have significantly influenced the evolution of the urban and rural green space patterns in Central Yunnan’s urban agglomeration [52,53]. Importantly, these policies exhibit distinct spatial characteristics, with variations not only in their strategic orientation across different states, cities, districts, and counties, but also in the effectiveness of their implementation, thereby contributing to the spatial diversity observed in the region’s green space patterns.
It should be noted that this study was subject to certain limitations in the selection of the driving factors. Central Yunnan’s urban agglomeration comprises 49 districts and counties, some of which lack comprehensive yearbooks and show variations in statistical indicators. In addition, as an emerging urban agglomeration, Central Yunnan has relatively few specific planning policies to address its unique development needs. As a result, the analysis of the policy planning factors remained primarily qualitative, based on broader national and provincial planning frameworks. Future research should take a more comprehensive approach by integrating natural and socioeconomic factors into the analysis of the drivers. A particular emphasis should be placed on the influence of policy planning to better understand its impact on the development of the region.

6. Conclusions

This study attempts to explore the relationship between socioeconomic driving factors and the spatial and temporal heterogeneity of green spaces, in order to find out the main driving factors for the development of green spaces in spatial and temporal scale. Analysis of green space dynamics in the Central Yunnan urban agglomeration from 2000 to 2020 revealed a consistent reduction in both urban and rural green spaces at the scale of the urban agglomeration, while forest areas continued to expand. Notable spatial disparities in green space dynamics were observed across various districts, with central districts experiencing the least increase in forest space, whereas outlying districts faced more significant reductions in farmland and shrub–grass areas. Despite the pronounced green space advantages within the Central Yunnan urban agglomeration, the rapid expansion of non-green areas poses an increasing threat to existing green spaces. Utilizing PCA-GWR, the results indicate that each factor has both positive and negative implications. In general, the influence of the same factor on different types of green spaces showed significant spatiotemporal variation across various time periods and regions. The urbanization rate exerted a long-lasting and highly significant impact on green spaces, followed by influences from the agricultural population, the proportion of the secondary industry, and financial income.
The results confirm the influence of socioeconomic factors on the dynamics of green patterns in underdeveloped urban agglomerations in the southwest. Future research should integrate natural and policy-driven factors to deepen our understanding of the mechanisms governing the dynamic succession of green spaces. For effective sustainable management, it is crucial to consider socioeconomic disparities across spatial and temporal contexts and to develop targeted optimization strategies accordingly.

Author Contributions

Conceptualization, M.L. and X.W.; methodology, M.L., J.L. and X.W.; software, J.L.; validation, D.S., J.D. and D.R.; formal analysis, D.S.; investigation, J.L., D.S., J.D. and D.R.; resources, M.L. and X.W.; data curation, M.L., J.L. and D.S.; writing—original draft preparation, M.L. and J.L.; writing—review and editing, D.S. and X.W.; visualization, D.S., J.D. and D.R.; supervision, X.W.; project administration, M.L.; funding acquisition, M.L. and X.W. All authors have read and agreed to the published version of the manuscript.

Funding

This research was funded by the National Natural Science Foundation of China, grant numbers 52268014 and 42061074; the Yunnan Basic Research Project, grant number 202401AT070357; and the Science and Technology Talent and Platform Program, grant number 202405AD350057.

Data Availability Statement

The data presented in this study are available on request from the corresponding author.

Acknowledgments

The authors express their gratitude to Yunnan Provincial Archives of Surveying and Mapping for providing data collecting.

Conflicts of Interest

The authors declare no conflicts of interest.

References

  1. Taylor, L.; Hochuli, D.F. Defining greenspace: Multiple uses across multiple disciplines. Landsc. Urban Plan. 2017, 158, 25–38. [Google Scholar] [CrossRef]
  2. Hunter, A.J.; Luck, G.W. Defining and measuring the social-ecological quality of urban greenspace: A semi-systematic review. Urban Ecosyst. 2015, 18, 1139–1163. [Google Scholar] [CrossRef]
  3. Weng, H.; Gao, Y.; Su, X.; Yang, X.; Cheng, F.; Ma, R.; Liu, Y.; Zhang, W.; Zheng, L. Spatial-Temporal Changes and Driving Force Analysis of Green Space in Coastal Cities of Southeast China over the Past 20 Years. Land 2021, 10, 537. [Google Scholar] [CrossRef]
  4. Chang, J.; Qu, Z.; Xu, R.; Pan, K.; Xu, B.; Min, Y.; Ren, Y.; Yang, G.; Ge, Y. Assessing the ecosystem services provided by urban green spaces along urban center-edge gradients. Sci. Rep. 2017, 7, 11226. [Google Scholar] [CrossRef]
  5. Maraja, R.; Jan, B.; Teja, T. Perceptions of cultural ecosystem services from urban green. Ecosyst. Serv. 2016, 17, 33–39. [Google Scholar]
  6. Moon, S.Y.; Kim, J.; Chong, W.K.O.; Ariaratnam, S.T. Urban green space layouts and urban heat island: Case study on apartment complexes in South Korea. J. Urban Plan. Dev. 2018, 144, 04018004. [Google Scholar] [CrossRef]
  7. Rupprecht, C.D.; Byrne, J.A.; Garden, J.G.; Hero, J. Informal urban green space: A trilingual systematic review of its role for biodiversity and trends in the literature. Urban For. Urban Green. 2015, 14, 883–908. [Google Scholar] [CrossRef]
  8. Schebella, M.; Weber, D.; Schultz, L.; Weinstein, P. The Wellbeing Benefits Associated with Perceived and Measured Biodiversity in Australian Urban Green Spaces. Sustainability 2019, 11, 802. [Google Scholar] [CrossRef]
  9. Song, P.; Kim, G.; Mayer, A.; He, R.; Tian, G. Assessing the Ecosystem Services of Various Types of Urban Green Spaces Based on i-Tree Eco. Sustainability 2020, 12, 1630. [Google Scholar] [CrossRef]
  10. Alkama, R.; Cescatti, A. Biophysical climate impacts of recent changes in global forest cover. Science 2016, 351, 600–604. [Google Scholar] [CrossRef]
  11. Staykova, D.; Rangelov, V.; University, S.; Ohridski, S.K. Urban green space and its impact on human health. Int. J. Environ. Res. Public Health 2021, 15, 445. [Google Scholar]
  12. Ekkel, E.D.; de Vries, S. Nearby green space and human health: Evaluating accessibility metrics. Landsc. Urban Plan. 2017, 157, 214–220. [Google Scholar] [CrossRef]
  13. Viniece, J.; Lincoln, L.; Jessica, Y. Advancing Sustainability through Urban Green Space: Cultural Ecosystem Services, Equity, and Social Determinants of Health. Int. J. Environ. Res. Public Health 2016, 13, 196. [Google Scholar] [CrossRef]
  14. Badiu, D.L.; Iojă, C.I.; Pătroescu, M.; Breuste, J.; Artmann, M.; Niță, M.R.; Grădinaru, S.R.; Hossu, C.A.; Onose, D.A. Is urban green space per capita a valuable target to achieve cities’ sustainability goals? Romania as a case study. Ecol. Indic. 2016, 70, 53–66. [Google Scholar] [CrossRef]
  15. Haaland, C.; Bosch, C.K.V.D. Challenges and strategies for urban green-space planning in cities undergoing densification: A review. Urban For. Urban Green. 2015, 14, 760–771. [Google Scholar] [CrossRef]
  16. Wu, Z.; Chen, R.; Meadows, M.E.; Sengupta, D.; Xu, D. Changing urban green spaces in Shanghai: Trends, drivers and policy implications. Land Use Policy 2019, 87, 104080. [Google Scholar] [CrossRef]
  17. Tang, H.; Liu, W.; Yun, W. Spatiotemporal Dynamics of Green Spaces in the Beijing-Tianjin-Hebei Region in the Past 20 Years. Sustainability 2018, 10, 2949. [Google Scholar] [CrossRef]
  18. Chu, M.; Lu, J.; Sun, D. Influence of urban agglomeration expansion on fragmentation of green space: A case study of Beijing-Tianjin-Hebei urban agglomeration. Land 2022, 11, 275. [Google Scholar] [CrossRef]
  19. Colding, J.; Gren, Å.; Barthel, S. The incremental demise of urban green spaces. Land 2020, 9, 162. [Google Scholar] [CrossRef]
  20. Zhou, X.; Wang, Y.-C. Spatial–temporal dynamics of urban green space in response to rapid urbanization and greening policies. Landsc. Urban Plan. 2011, 100, 268–277. [Google Scholar] [CrossRef]
  21. Li, Y.-Y.; Ren, B.-T.; Chen, Y.-S.; Huang, L.-C.; Sun, C.-G. Multiscale spatiotemporal dynamics analysis of urban green space: Implications for green space planning in the rapid urbanizing Hefei City, China. Front. Ecol. Evol. 2022, 10, 998111. [Google Scholar] [CrossRef]
  22. Wu, S.; Wang, D.; Yan, Z.; Wang, X.; Han, J. Spatiotemporal dynamics of urban green space in Changchun: Changes, transformations, landscape patterns, and drivers. Ecol. Indic. 2023, 147, 109958. [Google Scholar] [CrossRef]
  23. Rutt, R.L.; Gulsrud, N.M. Green justice in the city: A new agenda for urban green space research in Europe. Urban For. Urban Green. 2016, 19, 123–127. [Google Scholar] [CrossRef]
  24. Chakraborty, S.; Maity, I.; Patel, P.P.; Dadashpoor, H.; Pramanik, S.; Follmann, A.; Novotný, J.; Roy, U. Spatio-temporal patterns of urbanization in the Kolkata Urban Agglomeration: A dynamic spatial territory-based approach. Sustain. Cities Soc. 2021, 67, 102715. [Google Scholar] [CrossRef]
  25. Serret, H.; Raymond, R.; Foltête, J.-C.; Clergeau, P.; Simon, L.; Machon, N. Potential contributions of green spaces at business sites to the ecological network in an urban agglomeration: The case of the Ile-de-France region, France. Landsc. Urban Plan. 2014, 131, 27–35. [Google Scholar] [CrossRef]
  26. De la Barrera, F.; Henríquez, C. Vegetation cover change in growing urban agglomerations in Chile. Ecol. Indic. 2017, 81, 265–273. [Google Scholar] [CrossRef]
  27. Sperandelli, D.I.; Dupas, F.A.; Dias Pons, N.A. Dynamics of urban sprawl, vacant land, and green spaces on the metropolitan fringe of São Paulo, Brazil. J. Urban Plan. Dev. 2013, 139, 274–279. [Google Scholar] [CrossRef]
  28. Degefu, M.A.; Argaw, M.; Feyisa, G.L.; Degefa, S. Dynamics of urban landscape nexus spatial dependence of ecosystem services in rapid agglomerate cities of Ethiopia. Sci. Total Environ. 2021, 798, 149192. [Google Scholar] [CrossRef]
  29. Wang, J.; Zhang, Y.; Zhang, X.; Song, M.; Ye, J. The spatio-temporal trends of urban green space and its interactions with urban growth: Evidence from the Yangtze River Delta region, China. Land Use Policy 2023, 128, 106598. [Google Scholar] [CrossRef]
  30. Jiang, H.; Peng, J.; Dong, J.; Zhang, Z.; Xu, Z.; Meersmans, J. Linking ecological background and demand to identify ecological security patterns across the Guangdong-Hong Kong-Macao Greater Bay Area in China. Landsc. Ecol. 2021, 36, 2135–2150. [Google Scholar] [CrossRef]
  31. Lian, Z.; Feng, X. Urban green space pattern in core cities of the greater bay area based on morphological spatial pattern analysis. Sustainability 2022, 14, 12365. [Google Scholar] [CrossRef]
  32. Li, Y.; Zhang, X.; Xia, C. Towards a greening city: How does regional cooperation promote urban green space in the Guangdong-Hong Kong-Macau Greater Bay Area? Urban For. Urban Green. 2023, 86, 128033. [Google Scholar] [CrossRef]
  33. Feng, R.; Wang, F.; Wang, K.; Xu, S. Quantifying influences of anthropogenic-natural factors on ecological land evolution in mega-urban agglomeration: A case study of Guangdong-Hong Kong-Macao greater Bay area. J. Clean. Prod. 2021, 283, 125304. [Google Scholar] [CrossRef]
  34. Dai, X.; Wang, L.; Huang, C.; Fang, L.; Wang, S.; Wang, L. Spatio-temporal variations of ecosystem services in the urban agglomerations in the middle reaches of the Yangtze River, China. Ecol. Indic. 2020, 115, 106394. [Google Scholar] [CrossRef]
  35. Chen, C.; Bi, L.; Zhu, K. Study on Spatial-Temporal Change of Urban Green Space in Yangtze River Economic Belt and Its Driving Mechanism. Int. J. Environ. Res. Public Health 2021, 18, 12498. [Google Scholar] [CrossRef]
  36. Wu, W.-B.; Ma, J.; Meadows, M.E.; Banzhaf, E.; Huang, T.-Y.; Liu, Y.-F.; Zhao, B. Spatio-temporal changes in urban green space in 107 Chinese cities (1990–2019): The role of economic drivers and policy. Int. J. Appl. Earth Obs. Geoinf. 2021, 103, 102525. [Google Scholar] [CrossRef]
  37. Norton, B.A.; Evans, K.L.; Warren, P.H. Urban biodiversity and landscape ecology: Patterns, processes and planning. Curr. Landsc. Ecol. Rep. 2016, 1, 178–192. [Google Scholar] [CrossRef]
  38. Xiao, C.; Shi, Q.; Gu, C.-J. Assessing the spatial distribution pattern of street greenery and its relationship with socioeconomic status and the built environment in Shanghai, China. Land 2021, 10, 871. [Google Scholar] [CrossRef]
  39. Wang, H.; Lin, C.; Ou, S.; Feng, Q.; Guo, K.; Xie, J.; Wei, X. Evolutionary Characteristics and Driving Forces of Green Space in Guangzhou from a Zoning Perspective. Forests 2024, 15, 135. [Google Scholar] [CrossRef]
  40. Yu, Z.; Wang, Y.; Deng, J.; Shen, Z.; Wang, K.; Zhu, J.; Gan, M. Dynamics of hierarchical urban green space patches and implications for management policy. Sensors 2017, 17, 1304. [Google Scholar] [CrossRef]
  41. Wang, J.; Zhou, W.; Qian, Y.; Li, W.; Han, L. Quantifying and characterizing the dynamics of urban greenspace at the patch level: A new approach using object-based image analysis. Remote Sens. Environ. 2018, 204, 94–108. [Google Scholar] [CrossRef]
  42. Sathyakumar, V.; Ramsankaran, R.; Bardhan, R. Geospatial approach for assessing spatiotemporal dynamics of urban green space distribution among neighbourhoods: A demonstration in Mumbai. Urban For. Urban Green. 2020, 48, 126585. [Google Scholar] [CrossRef]
  43. Xu, F.; Yan, J.; Heremans, S.; Somers, B. Pan-European urban green space dynamics: A view from space between 1990 and 2015. Landsc. Urban Plan. 2022, 226, 104477. [Google Scholar] [CrossRef]
  44. Kourtit, K.; Elmlund, P.; Nijkamp, P. The urban data deluge: Challenges for smart urban planning in the third data revolution. Int. J. Urban Sci. 2020, 24, 445–461. [Google Scholar] [CrossRef]
  45. Richards, D.R.; Passy, P.; Oh, R.R. Impacts of population density and wealth on the quantity and structure of urban green space in tropical Southeast Asia. Landsc. Urban Plan. 2017, 157, 553–560. [Google Scholar] [CrossRef]
  46. Zhao, J.; Chen, S.; Jiang, B.; Ren, Y.; Wang, H.; Vause, J.; Yu, H. Temporal trend of green space coverage in China and its relationship with urbanization over the last two decades. Sci. Total Environ. 2013, 442, 455–465. [Google Scholar] [CrossRef] [PubMed]
  47. Teimouri, R.; Yigitcanlar, T. An approach towards effective ecological planning: Quantitative analysis of urban green space characteristics. Glob. J. Environ. Sci. Manag. 2018, 4, 195–206. [Google Scholar]
  48. Chen, B.; Nie, Z.; Chen, Z.; Xu, B. Quantitative estimation of 21st-century urban greenspace changes in Chinese populous cities. Sci. Total Environ. 2017, 609, 956–965. [Google Scholar] [CrossRef]
  49. Hu, Y.; Zhang, Y. Spatial–temporal dynamics and driving factor analysis of urban ecological land in Zhuhai city, China. Sci. Rep. 2020, 10, 16174. [Google Scholar] [CrossRef]
  50. Zheng, X.; Zhu, M.; Shi, Y.; Pei, H.; Nie, W.; Nan, X.; Zhu, X.; Yang, G.; Bao, Z. Equity Analysis of the Green Space Allocation in China’s Eight Urban Agglomerations Based on the Theil Index and GeoDetector. Land 2023, 12, 795. [Google Scholar] [CrossRef]
  51. Kim, Y.; Newman, G.; Güneralp, B. A Review of Driving Factors, Scenarios, and Topics in Urban Land Change Models. Land 2020, 9, 246. [Google Scholar] [CrossRef] [PubMed]
  52. Pourmohammadi, P.; Strager, M.P.; Dougherty, M.J.; Adjeroh, D.A. Analysis of Land Development Drivers Using Geographically Weighted Ridge Regression. Remote Sens. 2021, 13, 1307. [Google Scholar] [CrossRef]
  53. Wang, X.; Meng, Q.; Zhang, L.; Hu, D. Evaluation of urban green space in terms of thermal environmental benefits using geographical detector analysis. Int. J. Appl. Earth Obs. Geoinf. 2021, 105, 102610. [Google Scholar] [CrossRef]
  54. Yang, Z.; Fang, C.; Mu, X.; Li, G.; Xu, G. Urban green space quality in China: Quality measurement, spatial heterogeneity pattern and influencing factor. Urban For. Urban Green. 2021, 66, 127381. [Google Scholar] [CrossRef]
  55. Ben Messaoud, K.; Wang, Y.; Jiang, P.; Ma, Z.; Hou, K.; Dai, F. Spatial-Temporal Dynamics of Urban Green Spaces in Response to Rapid Urbanization and Urban Expansion in Tunis between 2000 and 2020. Land 2024, 13, 98. [Google Scholar] [CrossRef]
  56. Li, X.; Ma, X.; Hu, Z.; Li, S. Investigation of urban green space equity at the city level and relevant strategies for improving the provisioning in China. Land Use Policy 2021, 101, 105144. [Google Scholar] [CrossRef]
  57. Xu, Z.; Zhang, Z.; Li, C. Exploring urban green spaces in China: Spatial patterns, driving factors and policy implications. Land Use Policy 2019, 89, 104249. [Google Scholar] [CrossRef]
  58. Liu, H.; Jiao, F.; Yin, J.; Li, T.; Gong, H.; Wang, Z.; Lin, Z. Nonlinear relationship of vegetation greening with nature and human factors and its forecast–a case study of Southwest China. Ecol. Indic. 2020, 111, 106009. [Google Scholar] [CrossRef]
  59. Liu, W.; Li, H.; Xu, H.; Zhang, X.; Xie, Y. Spatiotemporal distribution and driving factors of regional green spaces during rapid urbanization in Nanjing metropolitan area, China. Ecol. Indic. 2023, 148, 110058. [Google Scholar] [CrossRef]
  60. Tao, J.; Xu, T.; Dong, J.; Yu, X.; Jiang, Y.; Zhang, Y.; Huang, K.; Zhu, J.; Dong, J.; Xu, Y.; et al. Elevation-dependent effects of climate change on vegetation greenness in the high mountains of southwest China during 1982–2013. Int. J. Climatol. 2018, 38, 2029–2038. [Google Scholar] [CrossRef]
  61. Gao, Y.; Li, J.; Liu, R.; Wang, Z.; Wang, H.; Liu, Y. Temporal and spatial evolution of greenspace system and evaluation of ecosystem services in the core area of the Yangtze River Delta. Chin. J. Ecol. 2020, 39, 956–968. [Google Scholar]
  62. Hu, M.; Xia, B. A significant increase in the normalized difference vegetation index during the rapid economic development in the Pearl River Delta of China. Land Degrad. Dev. 2019, 30, 359–370. [Google Scholar] [CrossRef]
  63. Bürgi, M.; Hersperger, A.M.; Schneeberger, N. Driving forces of landscape change-current and new directions. Landsc. Ecol. 2005, 19, 857–868. [Google Scholar] [CrossRef]
  64. GB/T 21010-2017; Classification of Current Land Use Status. China Standard Press: Beijing, China, 2017.
  65. Sun, C.G.; Li, X.J.; Zhong, K.W.; Liu, X.L.; Liu, W.S.; Peng, L.J. Landscape Pattern Analysis of Green Space in Central Urban Area of Zhuhai City. In Proceedings of the 4th International Workshop on Earth Observation and Remote Sensing Applications (EORSA), Guangzhou, China, 4–6 July 2016. [Google Scholar]
  66. Wang, X.S.; Chen, E.X.; Li, Z.Y.; Yao, W.Q.; Wang, L. Study on Urban Green Space Extracting and Dynamic Monitoring Method. In Proceedings of the 1st International Conference on Agro-Geoinformatics (Agro-Geoinformatics), Shanghai, China, 2–4 August 2012; pp. 14–17. [Google Scholar]
  67. Wu, W.T.; Zhao, H.Y.; Ren, Y.; Tian, M.M.; Shen, D. Investigation on Shading Effect of Urban Green Space in Summer in Hangzhou. In Proceedings of the 2nd International Conference on Engineering Materials, Energy, Management and Control, Wuhan, China, 17–18 March 2012; pp. 916–919. [Google Scholar]
  68. Zhang, Y.Y.; Li, Y.B.; Luo, G.J.; Bai, X.Y.; Huang, J.; Tang, F.; Yu, M. Analysis of the Land Use Dynamics of Different Rural Settlement Types in the Karst Trough Valleys of Southwest China. Land 2022, 11, 1572. [Google Scholar] [CrossRef]
  69. Wang, Z.L.; Ye, H.; Zhang, L.Y. Understanding the characteristics and mechanism of land use transition in mountainous economic zone: A case study of the Chengdu-Chongqing region in southwestern China. Front. Environ. Sci. 2022, 10, 963197. [Google Scholar] [CrossRef]
  70. Mu, H.; Li, X.; Ma, H.; Du, X.; Huang, J.; Su, W.; Yu, Z.; Xu, C.; Liu, H.; Yin, D.; et al. Evaluation of the policy-driven ecological network in the Three-North Shelterbelt region of China. Landsc. Urban Plan. 2022, 218, 104305. [Google Scholar] [CrossRef]
  71. Luo, Y.W.; Ren, Z.P.; Ge, Y. Analysis on spatio-temporal patterns and drivers of poverty at village Level based on PCA-GWR. J. Geo-Inf. Sci. 2020, 22, 231–245. [Google Scholar]
  72. Li, C.; Zhao, J.; Xu, Y. Examining spatiotemporally varying effects of urban expansion and the underlying driving factors. Sustain. Cities Soc. 2017, 28, 307–320. [Google Scholar] [CrossRef]
  73. Wang, Z.; Wang, X.; Xie, X.; Xiao, M.; Wu, Y.; Liu, X. Evolution of Landscape Pattern of Green Space in Fujian Province: Influencing Factors and Spatial Differences Based on GWR Model. J. Northwest For. Univ. 2022, 37, 242–250. [Google Scholar]
Figure 1. Scope of the study area.
Forests 15 01598 g001
Figure 2. The analysis framework.
Forests 15 01598 g002
Figure 3. Area variations in green spaces at county scale in Central Yunnan urban agglomeration from 2000 to 2020: (a) general dynamics; (b) forest spaces; (c) farmland spaces; and (d) shrub and grass spaces (Please refer to the note in Figure 1 for the abbreviations of the district(county) names in the figures).
Forests 15 01598 g003aForests 15 01598 g003b
Figure 4. Rendering of geographically weighted regression coefficients of urbanization rate (a) and correlation diagram of urbanization rate and regression coefficients (b).
Forests 15 01598 g004
Figure 5. Rendering of geographically weighted regression coefficients of revenue (a) and correlation diagram of revenue and regression coefficients (b).
Forests 15 01598 g005
Figure 6. Rendering of geographically weighted regression coefficients of agricultural population (a) and correlation diagram of agricultural population and regression coefficients (b).
Forests 15 01598 g006
Figure 7. Rendering of geographically weighted regression coefficients of proportion of secondary industry (a) and correlation diagram of secondary industry and regression coefficients (b).
Forests 15 01598 g007
Figure 8. Rendering of geographically weighted regression coefficients of expenditure (a) and correlation diagram of expenditure and regression coefficients (b).
Forests 15 01598 g008
Figure 9. Rendering of geographically weighted regression coefficients of total output value of agriculture, forestry, animal husbandry, and fishery industries (a) and correlation diagram of total output value of agriculture, forestry, animal husbandry, and fishery industries and regression coefficients (b).
Forests 15 01598 g009
Table 1. KMO test of principal component analysis.
Year20002005201020152020
KMO0.8230.8160.8450.8210.826
Table 2. Principal component characteristic, cumulative contribution rate, and factor load.
YearPrincipal Component
F1F2F3
Index 200020052010201520202000200520102015202020002005201020152020
Characteristic value5.6397.1187.1597.4937.0017.0013.1593.2503.2592.9792.0311.2131.2141.1731.175
Contribution rate40.27850.84051.13553.52050.00850.00822.56523.21223.28021.27814.5088.6668.6718.3758.392
Cumulative contribution rate40.27850.84051.13553.52050.00850.00873.40574.34876.80071.28678.18682.07183.01885.17579.678
Principal component factor loadThe population density (People/km2)0.7450.8780.8640.8500.851−0.4010.878−0.0320.0300.0050.3960.3230.3070.2520.283
The agricultural population (Ten thousand people)−0.336−0.155−0.177−0.279−0.3250.703−0.1550.9610.9190.8840.5810.0680.0610.0340.093
The urbanization rate (%)0.9380.9130.9360.9290.931−0.1440.913−0.0870.0070.0360.056−0.062−0.0720.0000.062
GDP (100 m ¥)0.3810.8800.9120.8980.9240.6320.8800.1610.2110.213−0.326−0.1150.0770.0570.025
The proportion of the primary industry (%)−0.803−0.852−0.835−0.856−0.847−0.312−0.852−0.0940.0310.1230.2330.4300.4850.4320.280
The proportion of the second industry (%)0.1710.4780.4300.4510.2760.6650.4780.3250.0640.085−0.501−0.765−0.760−0.856−0.901
The gross output value of agriculture, forestry, animals, husbandry, and fishery (100 m ¥)−0.267−0.033−0.209−0.286−0.4310.787−0.0330.8530.8130.8170.4150.2480.177−0.0150.073
The grain output (Ton)−0.258−0.206−0.232−0.359−0.3460.749−0.2060.9530.9030.8820.4770.1320.0850.0190.014
The fiscal revenue (100 m ¥)0.9290.9150.9290.8910.8360.1830.9150.1880.2580.1820.1890.1410.007−0.070−0.066
The fiscal expenditure (100 m ¥)0.8640.7900.6640.4300.4770.3060.7900.6600.8420.7630.208−0.0730.006−0.033−0.181
The per capita net income of farmers (¥)0.1330.7630.7830.8660.8560.5110.763−0.178−0.095−0.036−0.6750.049−0.0430.0860.084
The per capita urban disposable income (¥)0.2860.3920.5190.7930.5930.1210.392−0.170−0.2240.083−0.3430.122−0.0880.0750.323
The gross fixed asset formation (100 m ¥)0.8470.9150.9130.8980.8240.1540.9150.0100.2240.2250.1600.1790.3150.136−0.051
The tourism income (100 m ¥)0.8400.8250.8220.8420.814−0.2360.825−0.1000.0670.0890.2090.4030.3810.3840.187
Table 3. Changes in green spaces of Central Yunnan urban agglomeration from 2000 to 2020.
Space Type2000–20052005–20102010–20152015–20202000–2020
Variation (km2)Rate (%)Variation (km2)Rate (%)Variation (km2)Rate (%)Variation (km2)Rate (%)Variation (km2)Rate (%)
Forest space4388.399.305406.3510.497478.4813.136817.9710.5824091.1951.08
Farmland space−2673.08−7.40−5169.54−15.48−5731.02−20.30−3420.37−15.20−16994−47.11
Shrub and grass space−2203.59−8.24−757.63−3.09−2785.53−11.71−4208.55−20.05−9955.30−37.23
Water space8.10.9911.851.4415.361.8424.332.8659.647.32
Total−480.18−0.43−508.97−0.46−1022.71−0.93−786.62−0.72−2798.48−2.53
Table 4. The main driving factors of the social economy and the geographically weighted regression coefficients in each period.
IndexSpace Type20002005201020152020
The urbanization rate (%)Forest Space−13.1319–4.0796−19.3958–−2.0827−33.3873–−5.0104−37.0711–−0.28082.9251–5.9905
Farmland Space−12.8042–3.7064−4.5062–2.9857−2.3849–1.3735−2.2220–−0.9833−3.5311–−2.3438
Shrub and Grass Space−25.2151–3.1706−10.8551–−4.6006−12.5874–−6.2374−12.4789–−2.15103.5917–5.1496
The fiscal revenue (100 m¥)Forest Space−343.1094–2.900150.6141–115.833819.9197–86.2058//
Farmland Space−98.3310–86.609636.4033–50.2526−3.2252–11.2031//
Shrub and Grass Space−335.3480–75.11978.3318–67.88540.6135–34.9135//
The agricultural population (Ten thousand people)Forest Space/−24.3812–22.6900−58.5472–19.3194−75.5039–34.74903.7913–9.8237
Farmland Space/−1.8352–20.2867−7.72654–7.3484−7.0282–3.0375−4.7447–−3.1965
Shrub and Grass Space/−10.9227–26.6632−6.3868–12.49246.6471–18.99986.4108–12.0216
The proportion of the second industry (%)Forest Space/−1.9342–7.6482−9.3467–5.1960−3.6480–11.03267.8051–11.3485
Farmland Space/−2.6475–2.8789−0.3757–2.4278−0.8002–0.3315−2.3659–−2.1027
Shrub and Grass Space/−1.4429–4.6132−3.3660–3.84943.1295–9.64440.1863–1.2050
The fiscal expenditure (100 m¥)Forest Space−89.1533–337.7821////
Farmland Space−63.9269–68.2230////
Shrub and Grass Space−47.6008–676.7216////
The gross output value of agriculture, forestry, animals, husbandry, and fishery (100 m¥)Forest Space6.7490–256.7503////
Farmland Space4.4851–179.2803////
Shrub and Grass Space−62.1863–176.1302////
The total grain output (ton)Forest Space0.0010–1.0084−0.0010–0.0104−0.0003–0.0177−0.0027–0.01900.0026–0.0030
Farmland Space0.0005–0.00770.0010–0.00460.0026–0.00520.0020–0.00310.0019–0.0020
Shrub and Grass Space−0.0007–0.0029−0.0046–0.0041−0.0015–0.0027−0.0020–0.0008−0.003–0.0004
The per capita net income of farmers (¥)Forest Space−0.5487–−0.1676///−0.2065–−0.1888
Farmland Space−0.3072–−0.0838///0.0035–0.0096
Shrub and Grass Space−0.3062–−0.1365///−0.0622–−0.0497
The gross fixed asset formation (100 m¥)Forest Space/−12.8087–−2.4448−1.7009–1.8126−0.6252–4.9805/
Farmland Space/−8.7307–−4.5463−0.8249–0.65730.1620–0.4512/
Shrub and Grass Space/−4.7865–0.2507−1.0086–1.20480.3759–0.7916/
GDP (100 m¥)Forest Space///−1.5233–0.69620.4422–0.5535
Farmland Space///−0.2600–−0.0453−0.0551–−0.0145
Shrub and Grass Space///−0.3737–0.1425−0.0165–0.0058
Disclaimer/Publisher’s Note: The statements, opinions and data contained in all publications are solely those of the individual author(s) and contributor(s) and not of MDPI and/or the editor(s). MDPI and/or the editor(s) disclaim responsibility for any injury to people or property resulting from any ideas, methods, instructions or products referred to in the content.

