Article

Strength Grading of Full-Scale Chinese Fast-Growing Poplar Wood for Structural Building Applications

1
College of Civil Engineering, Nanjing Tech University, Nanjing 211800, China
2
College of Materials Science and Engineering, Central South University of Forestry and Technology, Changsha 410018, China
*
Author to whom correspondence should be addressed.
Forests 2024, 15(9), 1602; https://doi.org/10.3390/f15091602
Submission received: 30 July 2024 / Revised: 9 September 2024 / Accepted: 10 September 2024 / Published: 11 September 2024
(This article belongs to the Special Issue Wood Quality and Mechanical Properties)

Abstract

:
China boasts the world’s largest plantation forest of fast-growing poplar trees. However, the wood from these plantations typically exhibits high moisture content, leading to issues such as cracking and warping upon drying. The primary objective of this study was to evaluate the statistical suitability of Weibull, normal, and log-normal distributions for modeling the modulus of elasticity (MOE) of timber and to classify the strength of fast-growing poplar wood based on its strength characteristics to facilitate standardized utilization. Visual grading was employed to remove wood having apparent defects, thus mitigating the influence of wood defects and drying processes on strength. Subsequently, machine grading was conducted using static bending tests to assess the applicability of normal, log-normal, and Weibull distributions to the modulus of elasticity (MOE) distribution. Additionally, the study utilized a correlation matrix to explore the impact of density and moisture content on MOE. The findings suggest that both normal and Weibull distributions are suitable for characterizing the MOE of Chinese fast-growing poplar wood, while the log-normal distribution is not. The mean characteristic values of the MOE and density were 12.21 GPa and 521 kg/m3, respectively. The sampled poplar wood was categorized as C30 grade. Both density and moisture content were found to exert significant influences on the MOE (p < 0.01). However, density alone is not a reliable predictor for estimating MOE (R2 = 0.511).

1. Introduction

Wood is generally regarded as a sustainable and eco-friendly building material [1]. With the increasing emphasis on modern timber structures in the construction industry, there is a growing demand for high-quality laminated timber products for structural purposes. However, ensuring a consistent supply of high-quality timber poses significant challenges.
Fast-growing species, such as poplar, present a promising solution. Known for its rapid growth, poplar has an average annual increment between 5 and 40 m3/hm2 [2]. China, possessing the largest poplar plantation forest globally [3], primarily uses poplar for paper, sawn timber, cardboard, insulation boards, and furniture. Despite its advantages, fast-growing poplar is often considered suboptimal for direct structural applications [4], due to its low density, brittleness, high prevalence of flaws, and susceptibility to deformation during drying [5,6]. Addressing these limitations is critical for the broader application of fast-growing poplar wood in the construction and timber industries [7].
Recent advancements in modification techniques have significantly enhanced the mechanical properties of fast-growing poplar wood, addressing some of its inherent drawbacks. For example, thermal modification in a nitrogen atmosphere significantly improved the compressive strength and stiffness of poplar [8,9,10]. Peng et al. [11] found that the mechanical properties and decay resistance of fast-growing poplar wood were moderately improved following modification with 1,3-dihydroxymethyl-4,5-dihydroxyethylideneurea resin and alkaline lignin. Cheng et al. effectively improved the thermal stability of poplar by combining thermal modification with resin impregnation [12]. Similarly, Candan et al. [13] observed significant improvements in the hardness and surface density of poplar wood through hot pressing.
The inherent variability of wood, influenced by factors such as soil type, climate, tree age, and the specific position within the trunk, limits its broader application in construction [14,15]. Consequently, rigorous testing and evaluation are essential to fully leverage timber’s benefits, ensuring its quality and performance meet specified building requirements. Key properties for structural load-bearing timber include modulus of elasticity (MOE), bending strength, tensile strength parallel to the grain, shear strength, and compressive strength.
Wood grading typically involves both visual grading and machine grading methods. According to the Chinese standard GB/T 26899 [16], laminates for glulam must adhere to specific criteria concerning knots, holes, cracks, and other visual defects, which are closely linked to wood strength and density. Machine grading, a non-destructive testing approach, evaluates lumber using specialized mechanical grading equipment, including techniques such as bending, stress wave vibration, ultrasonic vibration, longitudinal vibration, and transverse vibration [17]. While non-destructive methods primarily measure MOE, it is well established that MOE correlates with other mechanical properties [18]. Thus, machine grading evaluates wood quality and structural attributes, with the MOE being a key determinant of the wood’s strength grade.
The Weibull distribution is frequently used to describe the distribution of strength variables [19,20,21]. For instance, Wang et al. [22] demonstrated that the MOE of spruce-pine-fir (SPF) lumber followed the Weibull distribution, confirming its suitability for defining material strength. Klemenc and Fajdiga [23] used the Weibull distribution to statistically estimate the fatigue strength of Norway spruce, illustrating its utility in analyzing material fatigue parameters. Furthering this research, Xie et al. [24] found that the MOE of laminated veneer lumber (LVL) aligned better with the three-parameter Weibull distribution than with the two-parameter version. These studies underscore the Weibull distribution’s adaptability across various materials and properties, making it a robust statistical tool for examining material strength characteristics.
The construction industry significantly contributes to carbon emissions, largely due to its heavy reliance on traditional building materials like concrete and steel, with the majority of emissions originating from the material production stage. While large-scale use of wood structures can effectively reduce carbon emissions, the long growth cycle of natural forest wood presents a challenge. In contrast, fast-growing wood offers significant advantages [9], but it also faces issues such as high variability and a lack of standardized strength grades. Poplar’s rapid growth results in high moisture content at harvest, necessitating drying before use. This process often leads to cracking and warping, which adversely affect both the aesthetics and mechanical properties of the wood. These defects are particularly undesirable in conventional applications of poplar wood, such as furniture manufacturing.
To address these issues, a comprehensive wood classification method was employed in this study. This method involved visually inspecting and excluding lumbers with defects not compliant with the Chinese standard GB/T 26899 [16], followed by testing the wood’s MOE. The study validated the applicability of three distributions (Weibull, normal, and log-normal) to the MOE of poplar wood. Furthermore, the influence of density and moisture content on the MOE was examined, and regression analysis was conducted to explore the relationship between density and MOE. The objective of this study was to evaluate the applicability of the Weibull, normal, and log-normal distributions for modeling the MOE of poplar wood and to assess the suitability of poplar as a load-bearing material in structural applications.

2. Materials and Methods
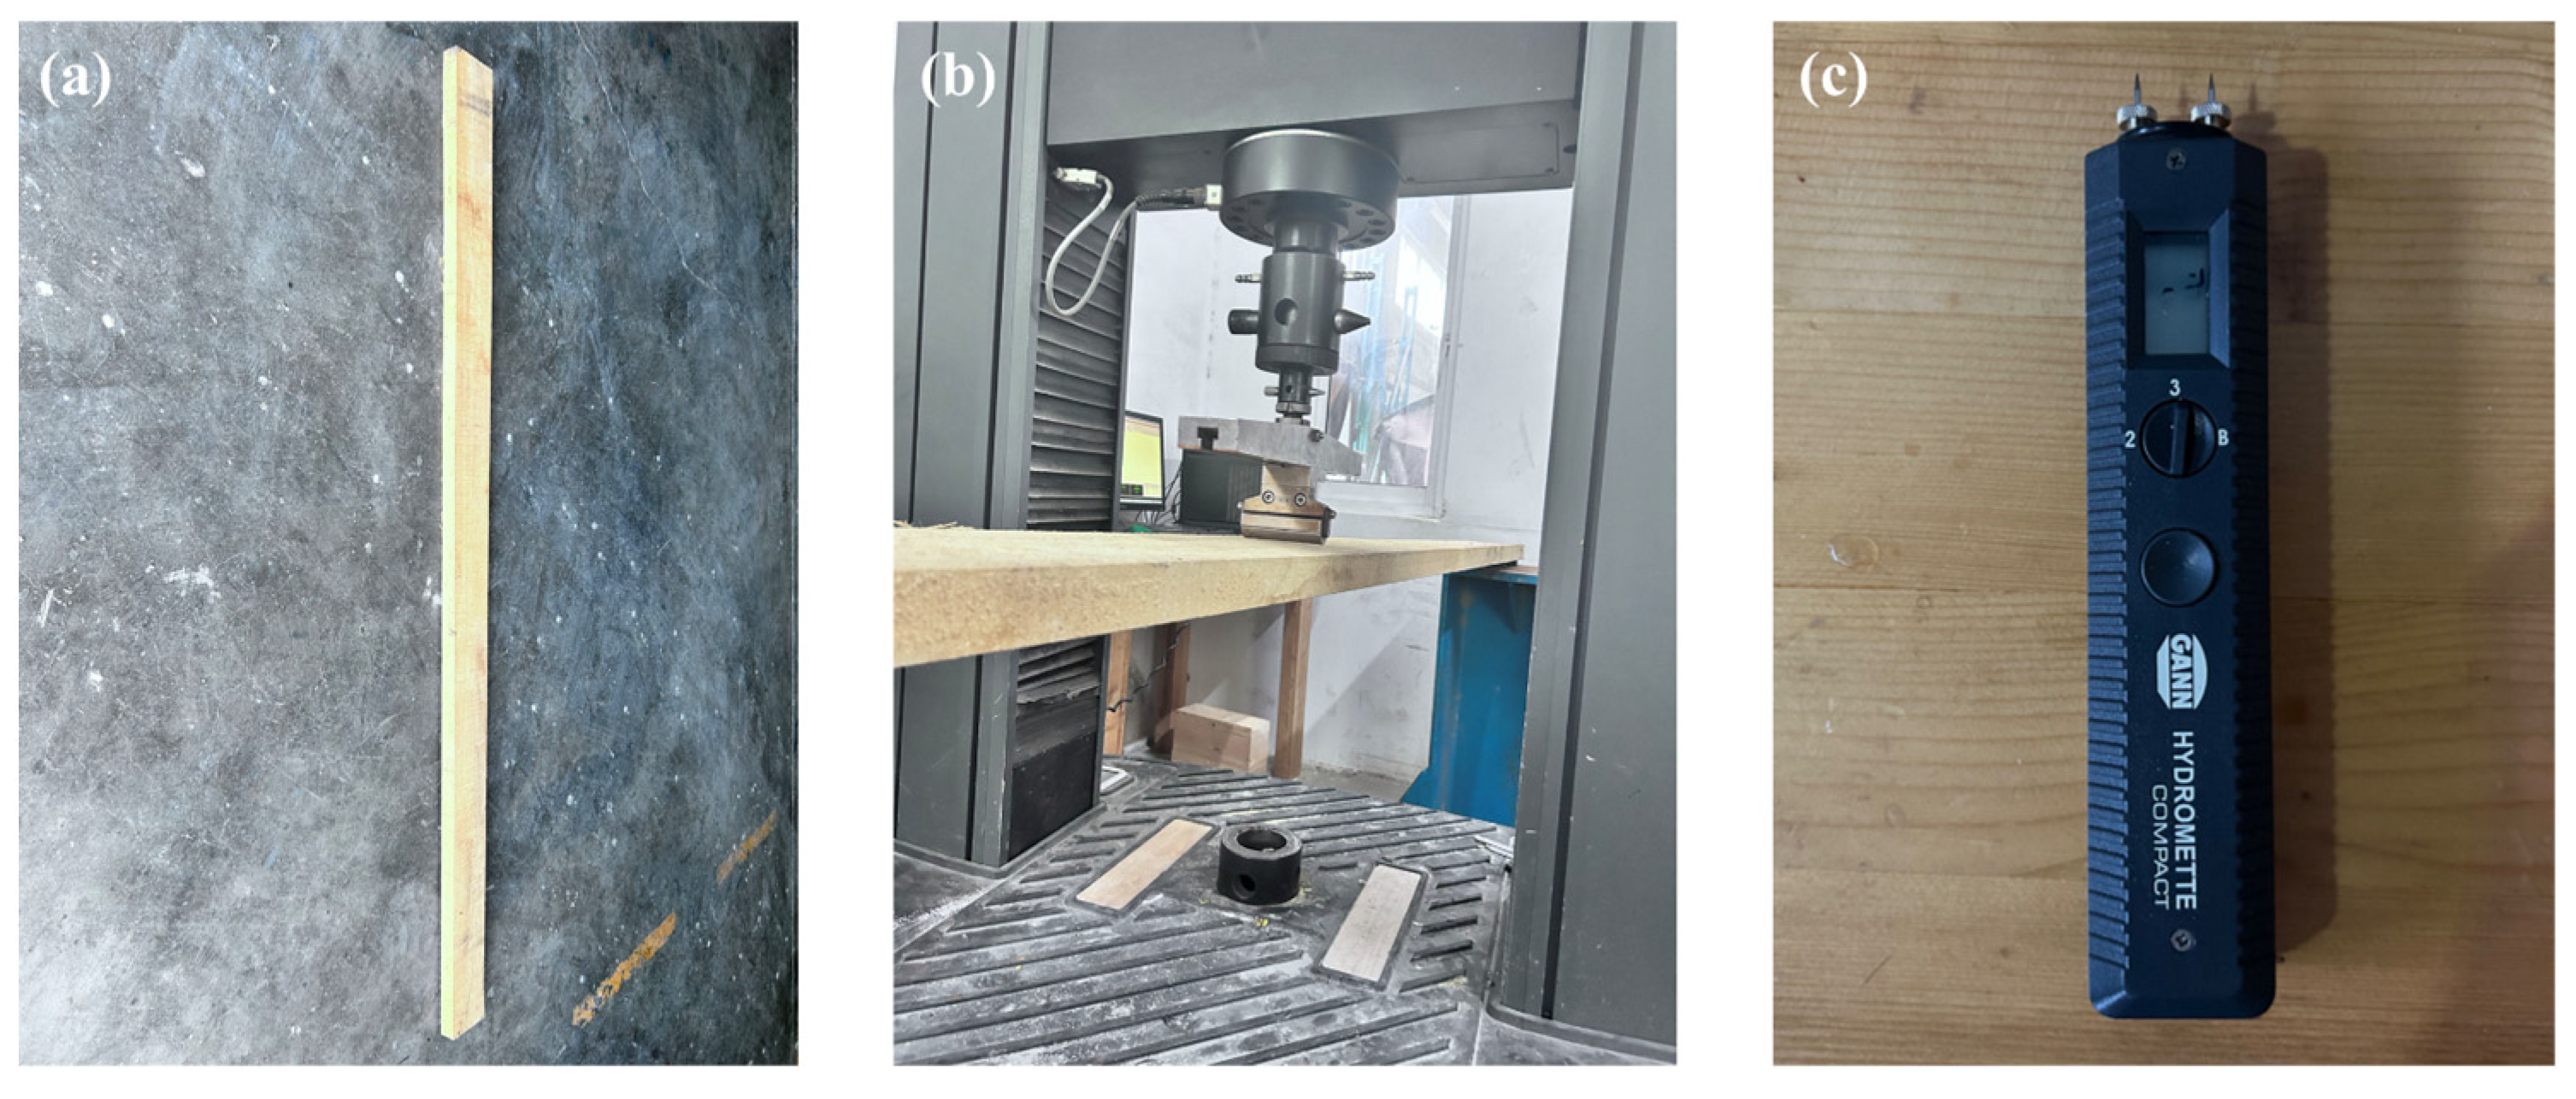
2.1. Materials

A total of 2072 poplar specimens (Populus euramericana cv. ‘San Martina I-72/58’) from 32 trees in Suqian City, Jiangsu Province were selected for this study. The average annual ring width was 10.86 mm, and the latewood percentage was 35.37%. A combination of visual and mechanical grading methods was used to conduct strength grading of the poplar. Specimens that did not meet the appearance requirements specified in GB/T 26899 [16] were excluded. A total of 1043 specimens met the appearance criteria and underwent further machine grading. Each piece had cross-sectional dimensions of 40 mm × 150 mm and a length of 2600 mm (Figure 1a). All the lumber was sourced from poplar trees aged 12 years and above. After sawing, the lumbers underwent industrial drying to achieve a moisture content between 8% and 15%.

2.2. Methods

The wood’s density was determined according to the Chinese standard GB/T 1927.5 [25]. The density was calculated using Equation (1). Visual grading was performed following the Chinese standard GB/T 26899 [16] to select specimens that met appearance quality grades Id, IId, IIId, and IVd. Subsequently, machine grading was performed on these specimens based on their MOE. The MOE was assessed using cyclic loading tests carried out using an MTS machine (MTS Systems Corp., Eden Prairie, MN, USA) (Figure 1b), referring to the Chinese standard GB/T 1927.10 [26]. A three-point bending test was conducted with a loading speed of 2 mm/min and a load range of 10–20 kN, with a span of 2400 mm. The loading process was repeated three times, and the average of the last two tests was used for analysis. The MOE values were calculated using Equation (2). The suitability of normal, log-normal, and Weibull distributions for modeling the MOE was evaluated.
For moisture content measurement, a pen-type moisture detector (Figure 1c) was used, taking readings from any three points on each piece of fast-growing poplar. The average value was recorded as the moisture content for that specific board. Subsequently, the determined MOE values were standardized to a moisture content of 12% using Equation (3) according to the Chinese standard GB/T 1927.10 [26].
ρ w = m w v w
σ 1 = Δ F · l 3 4 b t 3 Δ ω
σ 2 = σ 1 1 + 0.015 W 12
where ρw, mw, and vw represent the density (kg/m3), mass (kg), and volume (m3), respectively, at a moisture content of W. σ1 is the directly determined MOE (GPa); ΔF is the load increment (kN); Δω is the displacement increment corresponding to the load increment (mm); b and t are the width and thickness (mm), respectively; l is the span (mm); σ2 is the MOE at a moisture content of 12% (GPa); and W is the moisture content (%).

2.3. Weibull, Normal, and Log-Normal Distribution Fitting Tests

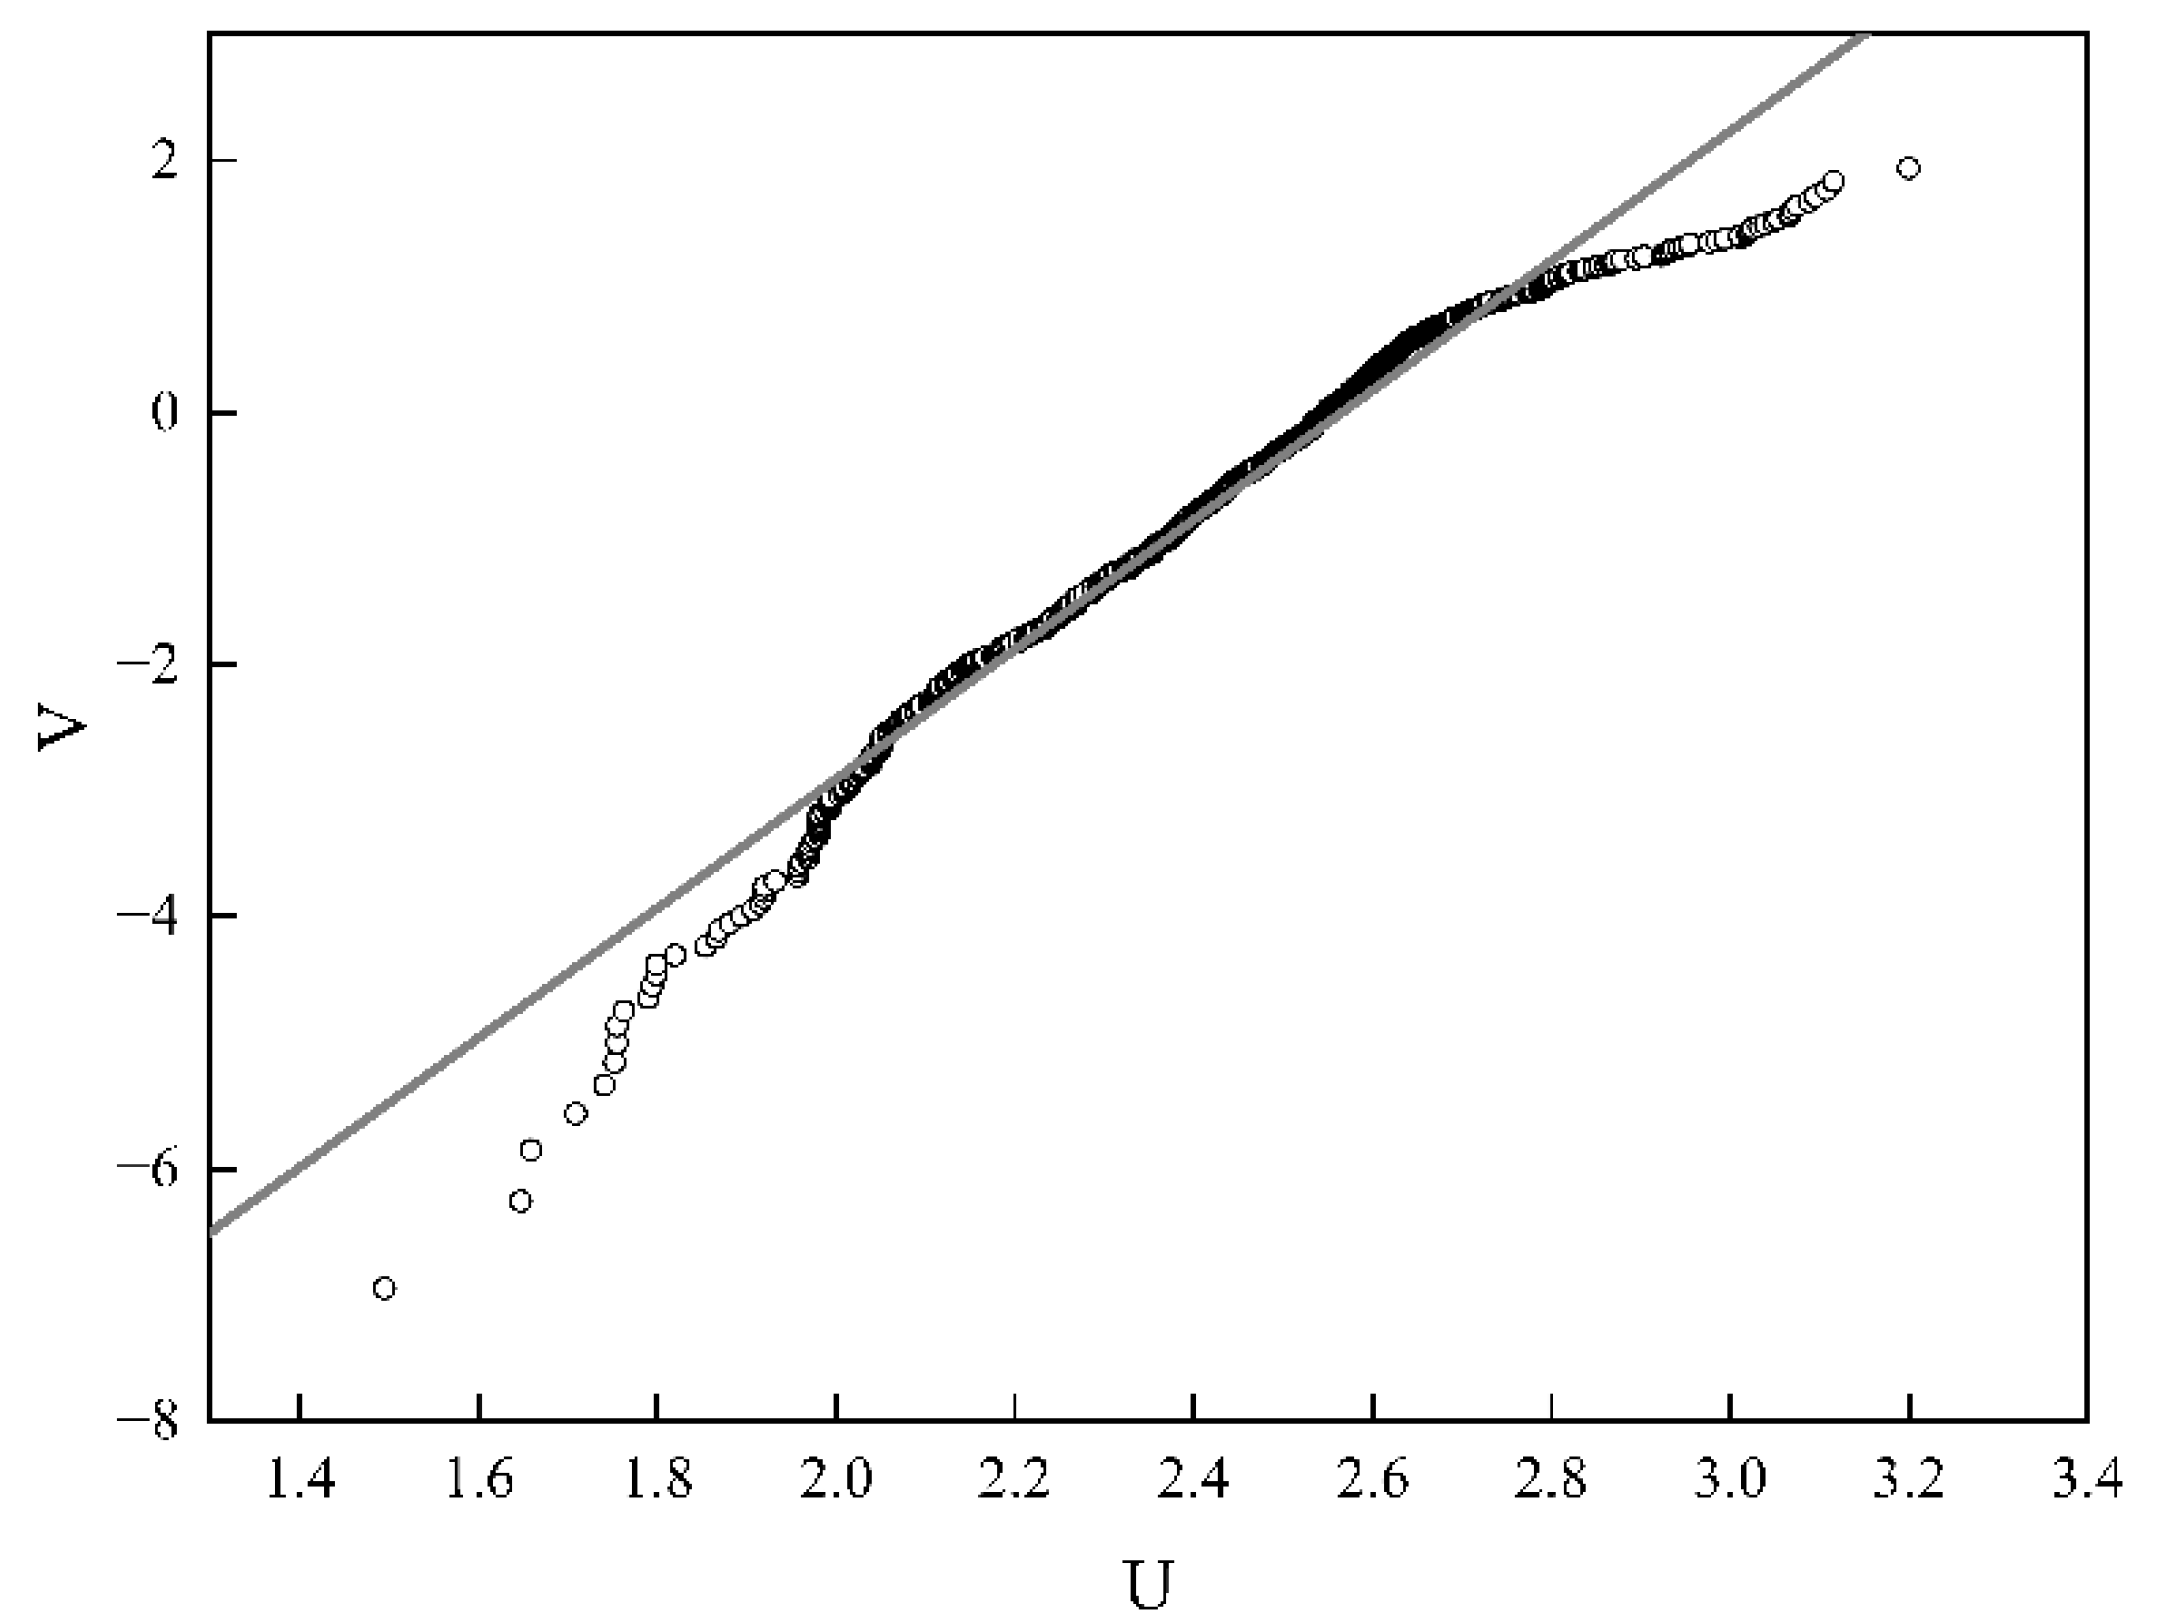
2.3.1. Weibull Distribution

Let X be a random variable representing the poplar’s MOE. The three-parameter Weibull distribution [27] for X is given by:
p X x = 1 exp x x μ x 0 m , x ( 0 , + )
where xμ is the position parameter; x0 is the scale parameter, and m is the shape parameter, also known as the Weibull modulus. Setting xμ = 0 reduces the equation to a two-parameter Weibull distribution:
p X x = 1 exp x x 0 m , x ( 0 , + )
The distribution function F(x) is:
p X x = F x = 1 exp x x 0 m , x ( 0 , + ) , x ( 0 , + )
The probability density function f(x) is:
f x = m x 0 ( x x 0 ) m 1 exp x x 0 m , x ( 0 , + )
The mathematical expectation E(X) and the standard deviation σ can be expressed as:
E X = 0 + x f x d x
σ = 0 + x 2 f ( x ) d x 0 + x f ( x ) d x 2

2.3.2. Weibull Distribution Fitting Test

The MOE of poplar lumber was arranged in ascending order, forming the order statistic xi. The probability was then computed using the following equation [24]:
i n + 1 = 1 exp x i x 0 m
where i is the order of the specimens and n is the number of specimens. Shifting the terms and taking the logarithm twice yields:
m ln x i x 0 = ln ln n + 1 n + 1 i
Assuming U i = ln x i and V i = ln ln n + 1 n + 1 i , the data were fitted to a straight line using the least-squares method. The slope of the straight line represents the Weibull modulus (m), while x0 can be determined by identifying the intercepts with the vertical axis.

2.3.3. Normal and Log-Normal Distribution Fitting Tests

Normal and log-normal distributions were tested using SPSS 26 software to calculate skewness, kurtosis, and their corresponding standard errors. The Z-scores were then computed according to Equation (11) and compared with Z(0.05) = 1.96. For the log-normal distribution, the natural logarithm of the original data was used before performing the above steps, where Z represents the Z-score, h denotes the skewness or kurtosis calculated by the software, and μ1 refers to the standard error.
Z = h μ 1

2.3.4. Parameter Estimation

The parameters of the Weibull distribution were estimated using the method of least squares. The parameter estimation method is shown in Equations (13) and (14) [28]:
m ^ = i = 1 n ( U i U ¯ ) ( V i V ¯ ) i = 1 n ( U i U ¯ ) 2 , x 0 ^ = exp U ¯ V ¯ / m ^
U ¯ = n = 1 n U i ,   V ¯ = n = 1 n V i
where m ^ and x 0 ^ are the parameter estimates for m and x0, respectively.

2.4. Timber Classification

According to EN 338 [29], the grading of wood depends on various material characteristics, such as compressive strength, tensile strength, MOE, and density. However, the literature indicates that the strength grading of poplar is primarily associated with the smaller of the MOE and shear strength [30,31]. In this study, the fast-growing poplar wood was strength-graded solely based on the mean characteristic value of the MOE in bending.
The mean characteristic value of the MOE in bending parallel to the grain was determined following the guidelines of EN 384 [32], and the calculation formula is presented in Equation (15).
E 0 , m e a n = E 0 ¯ / 0.95
where E0,mean is the mean characteristic value of the MOE in bending parallel to the grain and E 0 ¯ is the mean MOE, calculated as the mathematical expectation derived from the fitted Weibull distribution function.

3. Results and Discussion

3.1. Normal Distribution and Log-Normal Distribution Tests

The MOE, density, and moisture content data of 1043 specimens are presented in Table S1 (in Supplementary Materials). According to the central limit theorem, the distribution of sample kurtosis and skewness will tend to approach a normal distribution. The Z-scores for the skewness and kurtosis of the normal distribution are 0.259 and 0.235, respectively. At a significance level of 0.05, both Z-scores are below the threshold of Z(0.05) = 1.96. This indicates that the MOE of poplar conforms well to the normal distribution. However, when the natural logarithm of the MOE (ln(MOE)) was tested for normality, the Z-scores for the skewness and kurtosis were found to be 8.87 and 3.38, respectively, both significantly exceeding the threshold of 1.96. Therefore, the log-normal distribution is not applicable to the MOE of poplar.

3.2. Weibull Distribution Test and Strength Grading of Poplar

Figure 2 shows the fitting test results for the Weibull distribution of the MOE for fast-growing poplar. The coefficient of determination (R2) was determined to be 0.969, indicating a strong fit. The Weibull modulus (m) was calculated as 5.1403 from the slope of the fitted line, and the intercept, −mlnx0, was found to be −13.188, leading to the solution for x0 as 12.936 GPa.
The parameter estimates are m ^ = 5.1403 , x 0 ^ = 12.936 . The model was also subjected to the Kolmogorov–Smirnov (K–S) test, where the parameters were estimated to be:
F i ^ = 1 exp ( x 12.936 ) 5.1403
The obtained Weibull distribution was tested using the K–S test. The test statistic D = max (D1, D2, ⋯⋯, Dk), D i = F i F i ^ . After calculation, the value of D is 0.026. For the significance level α = 0.05, D = 0.026, the probability P that observation data follow the Weibull distribution can be approximated by P = 1.63 n . P was calculated to be 0.051 > α = 0.05, and the null hypothesis was accepted. This result aligns with the previous literature [22,33]. The fitting effects of normal, log-normal and Weibull distributions are shown in Table 1.
Consequently, the distribution function and probability density function of the MOE for this batch of fast-growing poplar can be represented by Equations (17) and (18), respectively:
F ( x ) = 1 exp ( x 12.936 ) 5.1403 , x ( 0 , + )
f ( x ) = 0.397 ( x 12.936 ) 4.1403 exp x 12.936 5.1403 , x ( 0 , + )
By substituting the calculated values of m and x0 into Equations (8) and (9), we obtain the mathematical expectation E(X) and standard deviation σ of 11.604 and 4.63 GPa, respectively.
Figure 3 displays the distribution curve and probability density curve of the MOE of fast-growing poplar. The Weibull modulus m characterizes the dispersion of the data distribution. There is no definitive threshold for the Weibull modulus that distinguishes whether a dataset is dispersed or concentrated. However, based on prior research [22,34], in this study, the calculated m of 5.1403 suggests poor homogeneity and reliability, making fast-growing poplar wood unsuitable for direct use as a structural timber. The probability density curve reveals asymmetry relative to the line where MOE = 12.44 GPa is situated.
The probability of the MOE of fast-growing poplar wood falling within specific intervals can be calculated using Equation (16), and the corresponding results are presented in Table 2.
Therefore, the fast-growing poplar was graded according to the MOE requirements given in the standard [29]. According to the calculation of Equation (15), E0,mean = 12.21 GPa, and the average density characteristic value is 521 kg/m3. The fast-growing poplar can be classified as C30.
In comparison to the previous literature [28], the results of this study demonstrate a significant increase. This difference primarily stems from our strict exclusion of lumbers that did not meet the Chinese wood appearance quality standard GB/T 26899 [16] at the outset of our experiments. By implementing these procedures, we effectively mitigated the impact of wood defects and the drying process on strength grading, thereby achieving results that more closely align with the structural requirements of poplar wood in practical applications.

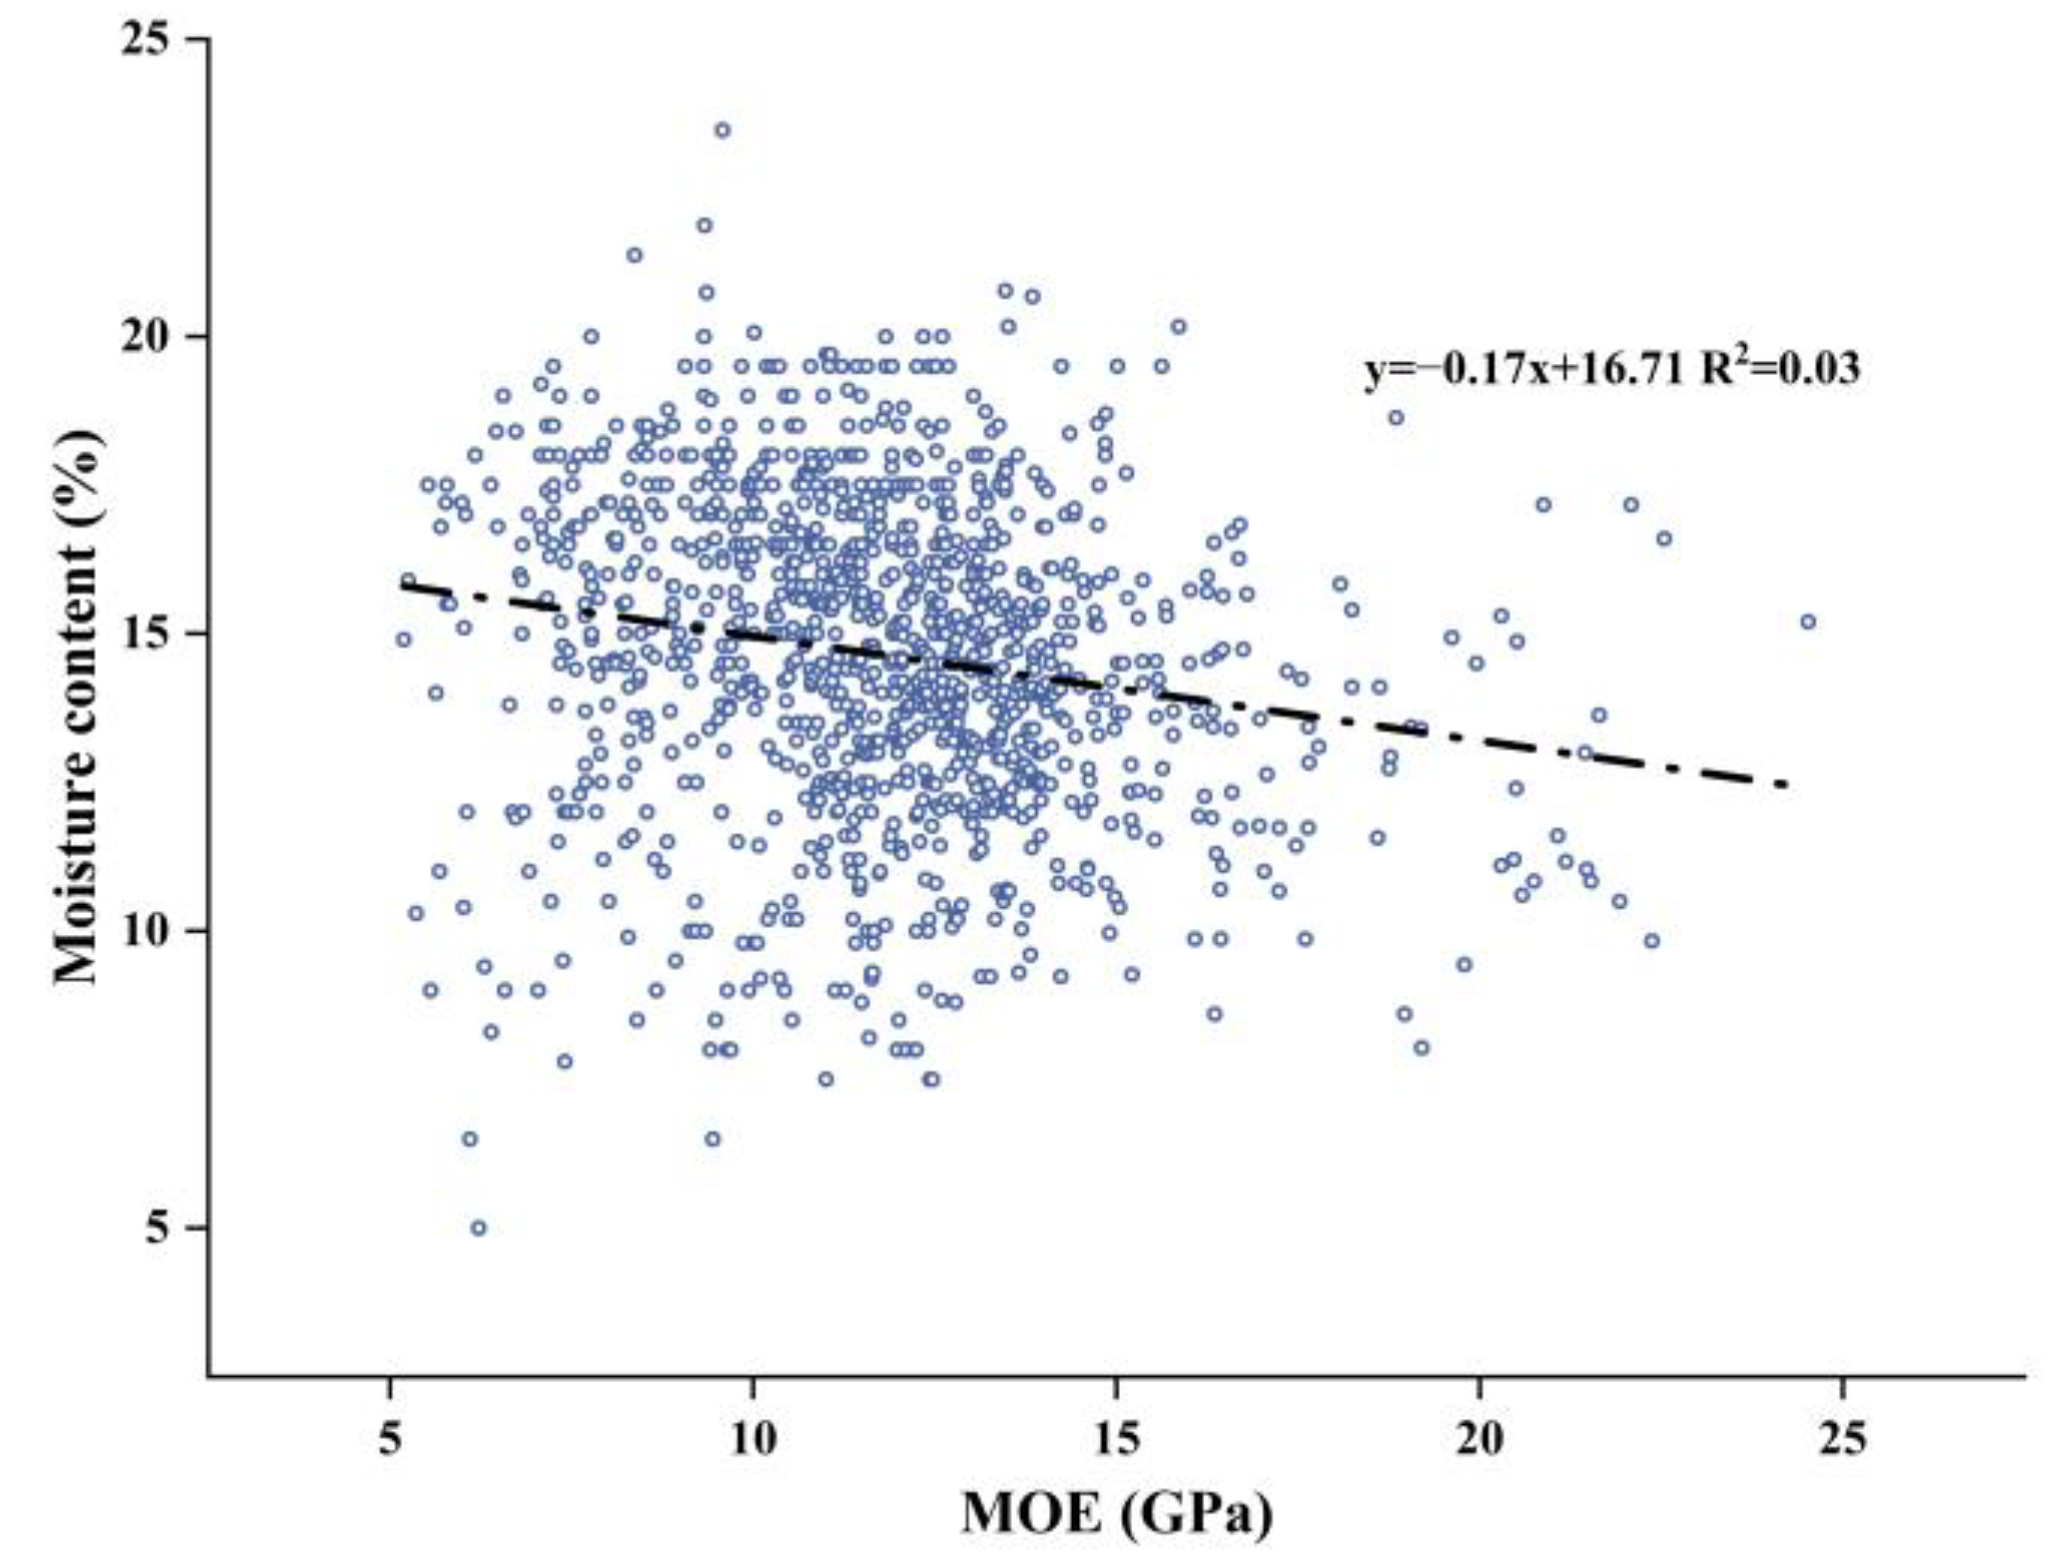
3.3. Effect of Density and Moisture Content on MOE

Spearman correlation analysis was conducted using the obtained moisture content and density values. The results, presented in Figure 4, indicate that both moisture content and density significantly affect the MOE (p < 0.01), consistent with previous findings [30]. To focus on examining the relationship between MOE and density, the influence of moisture content was controlled by converting all the MOE values to the MOE at 12% moisture content using Equation (3), due to the low variation in moisture content of wood under stable environmental conditions.
Based on previous research [35,36], both linear regression and power function regression were employed in this investigation. The results indicated that linear regression greatly outperformed power function regression. The fitted curve, shown in Figure 4, had a coefficient of determination (R2) of 0.511.
The analyses reveal that the wood density significantly influences the MOE of poplar. As density increases, the MOE also shows a gradual increase. However, the coefficient of determination (R2) for the curve fit is relatively low, suggesting that the density alone may not be an accurate predictor of the MOE. This finding is consistent with previous studies reporting low coefficients of determination for density as a predictor of MOE in cedar and eucalyptus [37,38].
The correlation matrix results indicate relatively low correlations between MOE and density (0.62) and between MOE and moisture content (0.033). This suggests that even combinations of density and moisture content do not significantly enhance predictive quality [39]. Furthermore, while direct testing of bending strength was not conducted, previous studies have shown a strong positive correlation between MOE and bending strength [40], indicating that bending strength can be predicted through MOE.
Additionally, there is a significant disparity between the optimal fitting curve for moisture content and MOE (Figure 5) and the moisture content adjustment formula, Equation (3), as stipulated in the standard GB/T 1927.10. The applicability of Equation (3) to the specimens in this study is poor, likely because the formula is designed for smaller specimens. In contrast, the specimens in this study are larger and exhibit a non-uniform moisture content distribution, which complicates accurate moisture content testing. Furthermore, for large-sized specimens, the local MOE of wood lumbers provides a more accurate measurement compared to the overall MOE.

4. Conclusions

This study measured the modulus of elasticity (MOE) values of 1043 specimens of fast-growing poplar and assessed the suitability of normal distribution, log-normal distribution, and Weibull distribution for modeling the MOE of poplar wood.
Both normal (Z-scores for the skewness and kurtosis are 0.259 and 0.235, respectively) and Weibull (R2 = 0.969) distributions demonstrated good fitting effects for the MOE of the poplar wood, while the log-normal distribution was found to be unsuitable. The fast-growing poplar exhibited lower reliability and uniformity (with a Weibull modulus m = 5.1403), rendering it unsuitable for direct structural applications. The E0,mean and the average density characteristic value of the fast-growing poplar were 12.21 GPa and 521 kg/m3, respectively. The assigned grade for the fast-growing poplar wood was determined to be C30. The pre-selection procedure enhanced the overall quality of the timber and minimized potential issues during the subsequent processing. This ensured a more consistent performance of the poplar wood in practical applications.
Additionally, the moisture content and density significantly influenced the MOE of the poplar wood (p < 0.01). However, the fitting coefficient (R2 = 0.511) between the density and the MOE was relatively low, indicating that density alone is insufficient for accurately predicting MOE. Understanding the influence of moisture content and density on MOE is crucial for optimizing the processing and production processes.
While poplar can meet structural requirements to a certain extent, its significant variability in MOE data necessitates adherence to specific density requirements during selection. This study highlights the importance of considering multiple factors beyond density and moisture content for accurately predicting the mechanical properties of fast-growing poplar wood.

Supplementary Materials

The following supporting information can be downloaded at: https://www.mdpi.com/article/10.3390/f15091602/s1, Table S1: Data of density, MOE and moisture content for 1043 lumbers.

Author Contributions

J.Q.: writing—original draft, formal analysis, and investigation. K.Y.: conceptualization, methodology, and supervision. X.L. and Y.P.: project administration. K.C. and P.W.: writing—review and editing. Z.Z.: funding acquisition. All authors have read and agreed to the published version of the manuscript.

Funding

The authors are grateful for the financial support of the Jiangsu Agriculture Science and Technology Innovation Fund (JASTIF) (Grant No. CX(22)3055), the National Natural Science Foundation of China (Grant Nos. 51978331 and 52108220), Jiangsu Science and Technology Project (Grant No. BE2022790), and the Special Fund for Green Building Development in Jiangsu Province (Grant No. (2021) 62-42).

Data Availability Statement

The original contributions presented in the study are included in the article and Supplementary Materials, further inquiries can be directed to the corresponding author.

Conflicts of Interest

The authors declare that they have no known competing financial interests or personal relationships that could have appeared to influence the work reported in this paper.

References

  1. Burawska-Kupniewska, I.; Krzosek, S.; Mankowski, P. Efficiency of visual and machine strength grading of sawn timber with respect to log type. Forests 2021, 12, 1467. [Google Scholar] [CrossRef]
  2. Cossalter, C.; Pye-Smith, C. Fast-Wood Forestry: Myths and Realities; CIFOR: Bogor, Indonesia, 2003. [Google Scholar]
  3. Lu, J.; Xu, K.; Liu, Y.; Wu, Y.; Li, X. Research progresses on reinforced modification of poplar wood from fast-growing plantation. J. Cent. South Univ. For. Technol. 2014, 34, 99–103. [Google Scholar]
  4. David, A.J.; Zasada, J.C.; Gilmore, D.W.; Landhausser, S.M. Current trends in the management of aspen and mixed aspen forests for sustainable production. For. Chron. 2001, 77, 525–532. [Google Scholar] [CrossRef]
  5. Niu, Z.; Li, J.; Zhang, Q.; Zhou, H.; Chen, Z. Achievements in the utilization of poplar wood in north America and guideposts for the future. World For. Res. 2007, 20, 58–62. [Google Scholar]
  6. Xu, B.H.; Wang, B.L.; Yu, K.B.; Bouchair, A. An optional connection material in timber structures: Densified poplar. J. Mater. Sci. 2021, 56, 14114–14125. [Google Scholar] [CrossRef]
  7. Shi, X.L.; Yue, K.; Jiao, X.K.; Zhang, Z.F.; Li, Z. Experimental investigation into lateral performance of cross-laminated timber (CLT) shear walls made from fast-growing poplar wood. Wood Mater. Sci. Eng. 2023, 18, 1212–1227. [Google Scholar] [CrossRef]
  8. Bytner, O.; Drożdżek, M.; Laskowska, A.; Zawadzki, J. Influence of thermal modification in nitrogen atmosphere on the selected mechanical properties of black poplar wood (Populus nigra L.). Materials 2022, 15, 7949. [Google Scholar] [CrossRef]
  9. Yue, K.; Qian, J.; Wu, P.; Jiao, X.K.; Lu, D.; Song, X.L. Experimental analysis of thermally-treated Chinese poplar wood with focus on structural application. Ind. Crop Prod. 2023, 197, 116612. [Google Scholar] [CrossRef]
  10. Yue, K.; Song, X.L.; Jiao, X.K.; Wang, L.; Jia, C.; Chen, Z.J.; Liu, W.Q. An experimental study on flexural behavior of glulam beams made out of thermally treated fast-growing poplar laminae. Wood Fiber Sci. 2020, 52, 152–164. [Google Scholar] [CrossRef]
  11. Peng, Y.; Fan, Q.; Ou, R.; Hao, X.; Guo, C.; Liu, Z.; Liu, T.; Sun, L.; Wang, Q. Modification of poplar wood cells using 1,3-dihydroxymethyl-4,5-dihydroxyethylideneurea/alkaline lignin for enhanced mechanical properties and decay resistance. Constr. Build. Mater. 2023, 368, 130354. [Google Scholar] [CrossRef]
  12. Cheng, X.W.; Lu, D.; Yue, K.; Lu, W.D.; Zhang, Z.F. Fire resistance improvement of fast-growing poplar wood based on combined modification by resin impregnation and compression. Polymers 2022, 14, 3574. [Google Scholar] [CrossRef] [PubMed]
  13. Candan, Z.; Korkut, S.; Unsal, O. Effect of thermal modification by hot pressing on performance properties of paulownia wood boards. Ind. Crop Prod. 2013, 45, 461–464. [Google Scholar] [CrossRef]
  14. Mederski, P.S.; Bembenek, M.; Karaszewski, Z.; Giefing, D.F.; Sulima-Olejniczak, E.; Rosinska, M.; Lacka, A. Density and mechanical properties of scots pine (Pinus sylvestris L.) wood from a seedling seed orchard. Drewno 2015, 58, 117–124. [Google Scholar] [CrossRef]
  15. Zeidler, A.; Boruvka, V.; Schonfelder, O. Comparison of wood quality of Douglas fir and spruce from afforested agricultural land and permanent forest land in the Czech Republic. Forests 2018, 9, 13. [Google Scholar] [CrossRef]
  16. GB/T 26899 2022; Glued Laminated Timber. Standardization Administration of China: Beijing, China, 2022.
  17. Jahedi, S.; Muszynski, L.; Riggio, M.; Blengino, B.B.; Bhandari, S. MOE distribution in visually graded ponderosa pine lumber harvested from restoration programs in southern Oregon and northern California. Wood Fiber Sci. 2022, 54, 90–98. [Google Scholar] [CrossRef]
  18. Green, D.W.; Kretschmann, D.E. Lumber property relationships for engineering design standards. Wood Fiber Sci. 1991, 23, 436–456. [Google Scholar]
  19. Zafeiropoulos, N.E.; Baillie, C.A. A study of the effect of surface treatments on the tensile strength of flax fibers: Part ii. Application of Weibull statistics. Compos. Part. A Appl. 2007, 38, 629–638. [Google Scholar] [CrossRef]
  20. Trustrum, K.; Jayatilaka, A.D. Applicability of Weibull analysis for brittle materials. J. Mater. Sci. 1983, 18, 2765–2770. [Google Scholar] [CrossRef]
  21. Shao, J.X.; Wang, F.; Li, L.; Zhang, J.Q. Scaling analysis of the tensile strength of bamboo fibers using Weibull statistics. Adv. Mater. Sci. Eng. 2013, 2013, 167823. [Google Scholar] [CrossRef]
  22. Wang, Z.; Yang, Y.; Liu, B. Probability distribution of MOE and mechanical properties of SPF dimension lumbers. J. Nanjing For. Univ. Nat. Sci. Ed. 2014, 38, 157–160. [Google Scholar]
  23. Klemenc, J.; Fajdiga, G. Statistical modelling of the fatigue bending strength of Norway spruce wood. Materials 2022, 15, 536. [Google Scholar] [CrossRef] [PubMed]
  24. Xie, W.; Wang, Z.; Zhang, Z.; Wang, Z. Dynamic test of laminated veneer lumber elastic modulus and its probability distribution. Bioresources 2021, 16, 3318–3327. [Google Scholar] [CrossRef]
  25. GB/T 1927.5 2021; Test Methods for Physical and Mechanical Properties of Small Clear Wood Specimens—Part 5: Determination of Density. Standardization Administration of China: Beijing, China, 2021.
  26. GB/T 1927.10 2021; Test Methods for Physical and Mechanical Properties of Small Clear Wood Specimens—Part 10: Determination of Modulus of Elasticity in Bending. Standardization Administration of China: Beijing, China, 2021.
  27. Weibull, W. A statistical distribution function of wide applicability. J. Appl. Mech. 1951, hal-03112318. Available online: https://hal.science/hal-03112318/document (accessed on 9 September 2024). [CrossRef]
  28. Lv, Y. Research on Maintenance Decision Making of Nuclear Power Plant Based on Multi-Objective Optimization. Master’s Thesis, Tsinghua University, Beijing, China, 2016. [Google Scholar]
  29. EN 338 2016; Structural Timber—Strength Classes. CEN: Brussels, Belgium, 2016.
  30. Yue, K.; Li, X.; Jiao, X.; Wu, P.; Song, X. Strength grading of Chinese poplar wood for structural use following thermal modification. Polym. Test. 2023, 123, 108032. [Google Scholar] [CrossRef]
  31. Yue, K.; Lu, D.; Song, X.S. The Influence of Thermal Modification on Poplar Strength Class by Fourier Infrared Spectrum Analysis. Spectrosc. Spect. Anal. 2023, 43, 848–853. [Google Scholar]
  32. EN 384 2016; Structural Timber—Determination of Characteristic Values of Mechanical Properties and Density. CEN: Brussels, Belgium, 2016.
  33. Tian, Z.P.; Xu, J.H.; Li, M.Y.; Wang, Z.H.; Serrano, E.R.; Gong, Y.C.; Ren, H.Q. Characteristic value of the modulus of elasticity (MOE) for natural and planted larch in northeast China. Forests 2021, 12, 883. [Google Scholar] [CrossRef]
  34. Ding, J.; Chen, G.; Huang, W.; Cheng, J.; Li, T.; Cheng, C.; Xu, J. Tensile strength statistics and fracture mechanism of ultrahigh molecular weight polyethylene fibers: On the Weibull distribution. ACS Omega 2024, 9, 12984–12991. [Google Scholar] [CrossRef]
  35. Xia, Y.; Yue, K.; Zhang, W.; Lu, X. Variations in wood density of fast-growing poplar and its relationship with mechanical strengths. J. Northeast For. Univ. 2010, 38, 5–6. [Google Scholar]
  36. Wang, S.Y.; Chen, J.H.; Tsai, M.J.; Lin, C.J.; Yang, T.H. Grading of softwood lumber using non-destructive techniques. J. Mater. Process. Tech. 2008, 208, 149–158. [Google Scholar] [CrossRef]
  37. Wang, S.Y.; Lin, S.H. Effect of plantation spacing with quality of visually graded limber and mechanical properties of Taiwan-growth Japanese cedar. Mokuzai Gakkaishi 1996, 42, 435–444. [Google Scholar]
  38. Burdzik, W.M.; Nkwera, P.D. Transverse vibration tests for prediction of stiffness and strength properties of full size eucalyptus grandis. For. Prod. J. 2002, 52, 63. [Google Scholar]
  39. Hou, J.; Taoum, A.; Nolan, G.; Kotlarewski, N. Study of the relationship between flatwise and edgewise modulus of elasticity of plantation fibre-managed E. nitens sawn boards. Constr. Build. Mater. 2022, 349, 128774. [Google Scholar] [CrossRef]
  40. Wang, X.; Ma, J.; Xu, W.; Fei, B.; Lian, C.; Sun, F. Effect of bending on radial distribution density, MFA and MOE of bent bamboo. Sci. Rep. 2022, 12, 8610. [Google Scholar] [CrossRef] [PubMed]
Figure 1. (a) Image of poplar specimen; (b) MOE measurement; (c) pen-type moisture detector.
Forests 15 01602 g001
Figure 2. Fitting test of fast-growing poplar MOE to Weibull distribution. ( U i = ln x i , V i = ln ln n + 1 n + 1 i ).
Forests 15 01602 g002
Figure 3. (a) Weibull distribution function curve; (b) probability density curve; (c) frequency distribution of MOE.
Forests 15 01602 g003
Figure 4. (a) Spearman correlation coefficient diagram; (b) fitted curves of the relationship between density and MOE; (c) moisture content, density, and MOE correlation matrix.
Forests 15 01602 g004
Figure 5. Fitting curve between moisture content and MOE.
Forests 15 01602 g005
Table 1. Test results of normal, log-normal, and Weibull distributions.
DistributionSkewnessKurtosisR2K–S
Z-Score
Normal0.2590.235//
Log-normal8.873.38//
Weibull//0.9690.051
Note: / indicates that no such tests were carried out.
Table 2. Probability that the MOE of fast-growing poplar wood is in a given interval.
Given MOE RangeProbability
(μ − σ, μ + σ)0.959
(μ − 2σ, μ + 2σ)0.999
(μ − 3σ, μ + 3σ)1
Disclaimer/Publisher’s Note: The statements, opinions and data contained in all publications are solely those of the individual author(s) and contributor(s) and not of MDPI and/or the editor(s). MDPI and/or the editor(s) disclaim responsibility for any injury to people or property resulting from any ideas, methods, instructions or products referred to in the content.

