Article

Integrating Active and Passive Remote Sensing Data for Forest Age Estimation in Shangri-La City, China

1
Faculty of Geography, Yunnan Normal University, Kunming 650050, China
2
GIS Technology Research Center of Resource and Environment in Western China, Ministry of Education, Yunnan Normal University, Kunming 650050, China
*
Author to whom correspondence should be addressed.
Forests 2024, 15(9), 1622; https://doi.org/10.3390/f15091622 (registering DOI)
Submission received: 22 August 2024 / Revised: 11 September 2024 / Accepted: 12 September 2024 / Published: 14 September 2024
(This article belongs to the Section Forest Inventory, Modeling and Remote Sensing)

Abstract

:
The accurate mapping of age structure and access to spatially explicit information are essential to optimal planning and policy-making for forest ecosystems, including forest management and sustainable economic development. Specifically, surveying and mapping the age structure of forests is crucial for calculating the carbon sequestration capacity of forest ecosystems. However, spatial heterogeneity and limited accessibility make forest age mapping in mountainous areas challenging. Here, we present a new workflow using ICESat-2 LiDAR data integrated with multisource remote sensing imagery to estimate forest age in Shangri-La, China. Two methods—a climate-driven exponential model and a random forest algorithm—are compared to infer the age structure of the five dominant species in Shangri-La. The climate-driven model, with an R2 of 0.67 and an RMSE of 12.79 years, outperforms the random forest model. The derived wall-to-wall forest age map at 30 m resolution reveals that nearly all forests in Shangri-La are mature or overmature, especially among the high-elevation species Abies fabri (Mast.) Craib and Picea asperata Mast., compared with Pinus yunnanensis Franch., Quercus aquifolioides Rehd. and E.H. Wils. and Pinus densata Mast., where the age structure is more evenly distributed across different elevation ranges. Younger forests are frequently found around human settlements and along the Jinsha River valley, whereas older forests are located in remote and high-elevation areas that are less disturbed. The combined use of active and passive remote sensing data has resulted in substantial improvements in the spatial detail and accuracy of wall-to-wall age mapping, which is expected to be a cost-effective approach for supporting forest management and carbon accounting in this important ecological region. The method developed here can be scaled to other mountain areas both to understand the age patterns and structure of mountain forests and to provide critical information for forestation, reforestation and carbon accounting in surface-to-high mountain areas, which are increasingly crucial for climate mitigation.

1. Introduction

Forests are the largest terrestrial carbon sinks and are key to achieving global carbon neutrality [1]. Forest age is an important limiting factor that is closely related to forest stock and biomass, and age distribution is particularly important for determining the status of forest ecosystems and the potential for carbon sequestration [2]. Understanding forest age information can improve the prediction of carbon sink changes, which is essential for forest management and policy-making in the global climate change response process.
The current gold standard of age information for forests involves drilling tree cores at breast height and counting annual rings, a slow and arduous process that significantly limits the spatial scale and efficacy of most large-scale forest resource investigations [3]. Combining spectral information with height allows for the evaluation of larger forested regions than the examination of individual trees does, particularly in inaccessible settings and those with more spatially complex terrain, and it is noninvasive (no trees are harmed).
Remote sensing technologies offer a way to invert the age information of large forest scales more efficiently and with lower environmental impacts than inventory-based sampling does [4,5,6]. This is because remote sensing is able to cover a broad scale, repeated sensing is possible, and the change in the area can be measured over time, which can improve the accuracy of the estimation [7,8]. In recent decades, the remote sensing approach for forest age estimation has been developed to include a wider application of both data sources and methods [9,10].
A case in point is Shangri-La city in Yunnan Province, China, which is a mountainous area with highly complex relief, diverse forest types and vertical climate gradients. High topographic complexity (rocky mountains and sharp peaks) and related vertical climate gradients (decreased moisture and elevation) affect tree growth, distribution and forest age structure [11,12]. A better understanding of forest age in mountainous regions is important for the management of these complex ecosystems, climate change considerations, carbon storage (with more complex topography and heterogeneity, more carbon can be stored in mountain forests per unit area), and forestry production (with an age structure dominated by young trees, forestry production will be low over time). Estimating forest age in mountainous areas is challenging, however, because of the irregular relief and high spatial heterogeneity of mountain forests. The application of traditional field-based age estimation methods is limited in mountainous forests because of labor and time inefficiency, as well as terrain accessibility and safety issues [13].
Remote sensing technologies could resolve these challenges by, for example, integrating ICESat-2 LiDAR data and multisource remote sensing imagery to advance age mapping in mountainous forests. ICESat-2’s ATLAS provides dense, highly accurate vegetation canopy height measurements, which are a principal indicator of forest age [2], and combined with the spectral and textural features derived from optical and radar remote sensing data, the spatial structure and composition of vegetation can be described in more detail [10].
Combining the synergistic advantages of ICESat-2 LiDAR with multisource remote sensing datasets could circumvent some of the current limitations, such as canopy spectral-index saturation in high-biomass forests, the inability to accurately measure the vertical tree structure with optical data alone, and the difficulty of obtaining high-quality field data in rugged terrain [9,14]. Complementarity between datasets could enhance the collection of improved and more spatially continuous estimates of forest age and eventually aid in the management of virtual forests in the mountains.
Shangri-La city, which is located in Diqing Tibetan Autonomous Prefecture of Yunnan Province in Southwest China, is predominantly composed of five tree species: Pinus densata Mast., Abies fabri (Mast.) Craib, Picea asperata Mast., Pinus yunnanensis Franch., and Quercus aquifolioides Rehd. and E.H. Wils. P. densata (Sikang pine) is the major coniferous tree species with a distribution area of the eastern Himalaya and the Hengduan Mountains in Southwest China and South China, and it showed great adaptability to cold and dry climates [15]. A. fabri (Faber’s fir) is another dominant coniferous tree species which is widely distributed in most mountainous areas in Southwest China, and it is a hardy coniferous species with low adaptability that is tolerant to low temperature and high humidity [16]. P. asperata, a species of Chinese spruce, is a predominant tree species within the Hengduan coniferous forests, possessing significant ecological and economic value [17]. P. yunnanensis (Yunnan pine) is a species exclusive to Chiantang Mountain in Southwest China, known for its wide distribution and strong environmental adaptability [18]. Q. aquifolioides is an evergreen broadleaf tree native to the Himalayan region, particularly Southwest China’s mixed coniferous and broadleaf forests. This region plays a significant role in preserving biodiversity and supporting the Shangri-La ecosystem’s ecological functions [19,20]. These dominant species in Shangri-La city maintain important ecosystem functions and ecological biodiversity. Trees might be influenced by natural climate changes in terms of growth, changes in age structure and species compositions in different areas. These tree species have been the dominant tree species in the evolution of the landscape of Shangri-La city. Understanding the development changes, age-growth and species compositions of dominant trees is the basis and foundation for maintaining the biodiversity and ecosystem functions of Shangri-La city.
The unclear and highly nonlinear effects of climate factors on forest ecosystems, including those with a long-term memory of past conditions, are important drivers of forest age structure and distribution, particularly in the rugged, mountainous landscape of Shangri-La. The direct effects of climate variables, especially temperature and precipitation, shape tree growth rates, mortality, and regeneration, and thus forest age structure [21]. Biometeorological climate variability also influences plant distribution, phenology, and water-use efficiency, further complicating the relationship between climate and forest age [22].
In Shangri-La, the unique vertical climate zonation, ranging from subtropical to cold temperate conditions, creates a natural laboratory for studying these climate–forest interactions. The region’s average annual temperature of 5.5 °C and significant diurnal temperature variations [23] contribute to a complex microclimatic environment that influences forest growth and age structure. Understanding these relationships is crucial for predicting how climate change may alter forest dynamics and carbon sequestration potential in this ecologically important region [24].
To bypass these issues, we utilize the continuous forest height from ICESat-2 LiDAR data and integrate multisource remote sensing data to assess the variabilities of forest age inversion models. We also develop and examine the forest age model via (1) the forest growth model theory based on the climatic variables, and (2) the random forest machine learning algorithm. We compare these methods to identify the best method for estimating forest age in the highly complex and ecologically important area of Shangri-La city.
Our ultimate goal is to create a high-resolution (30 m) map showing the results of the forest age inversion with the dominant tree species in Shangri-La city. The map will be helpful for municipal forest management and carbon sequestration in Shangri-La city and support our global understanding of tropical mountain forests and their carbon sequestration potential. In addition, by comparing different modeling methods, we expect to gain a better understanding of the benefits and limitations of diverse forest age estimation methods, which could guide future development and applications in tropical mountain forests and similar ecosystems globally.

2. Materials and Methods
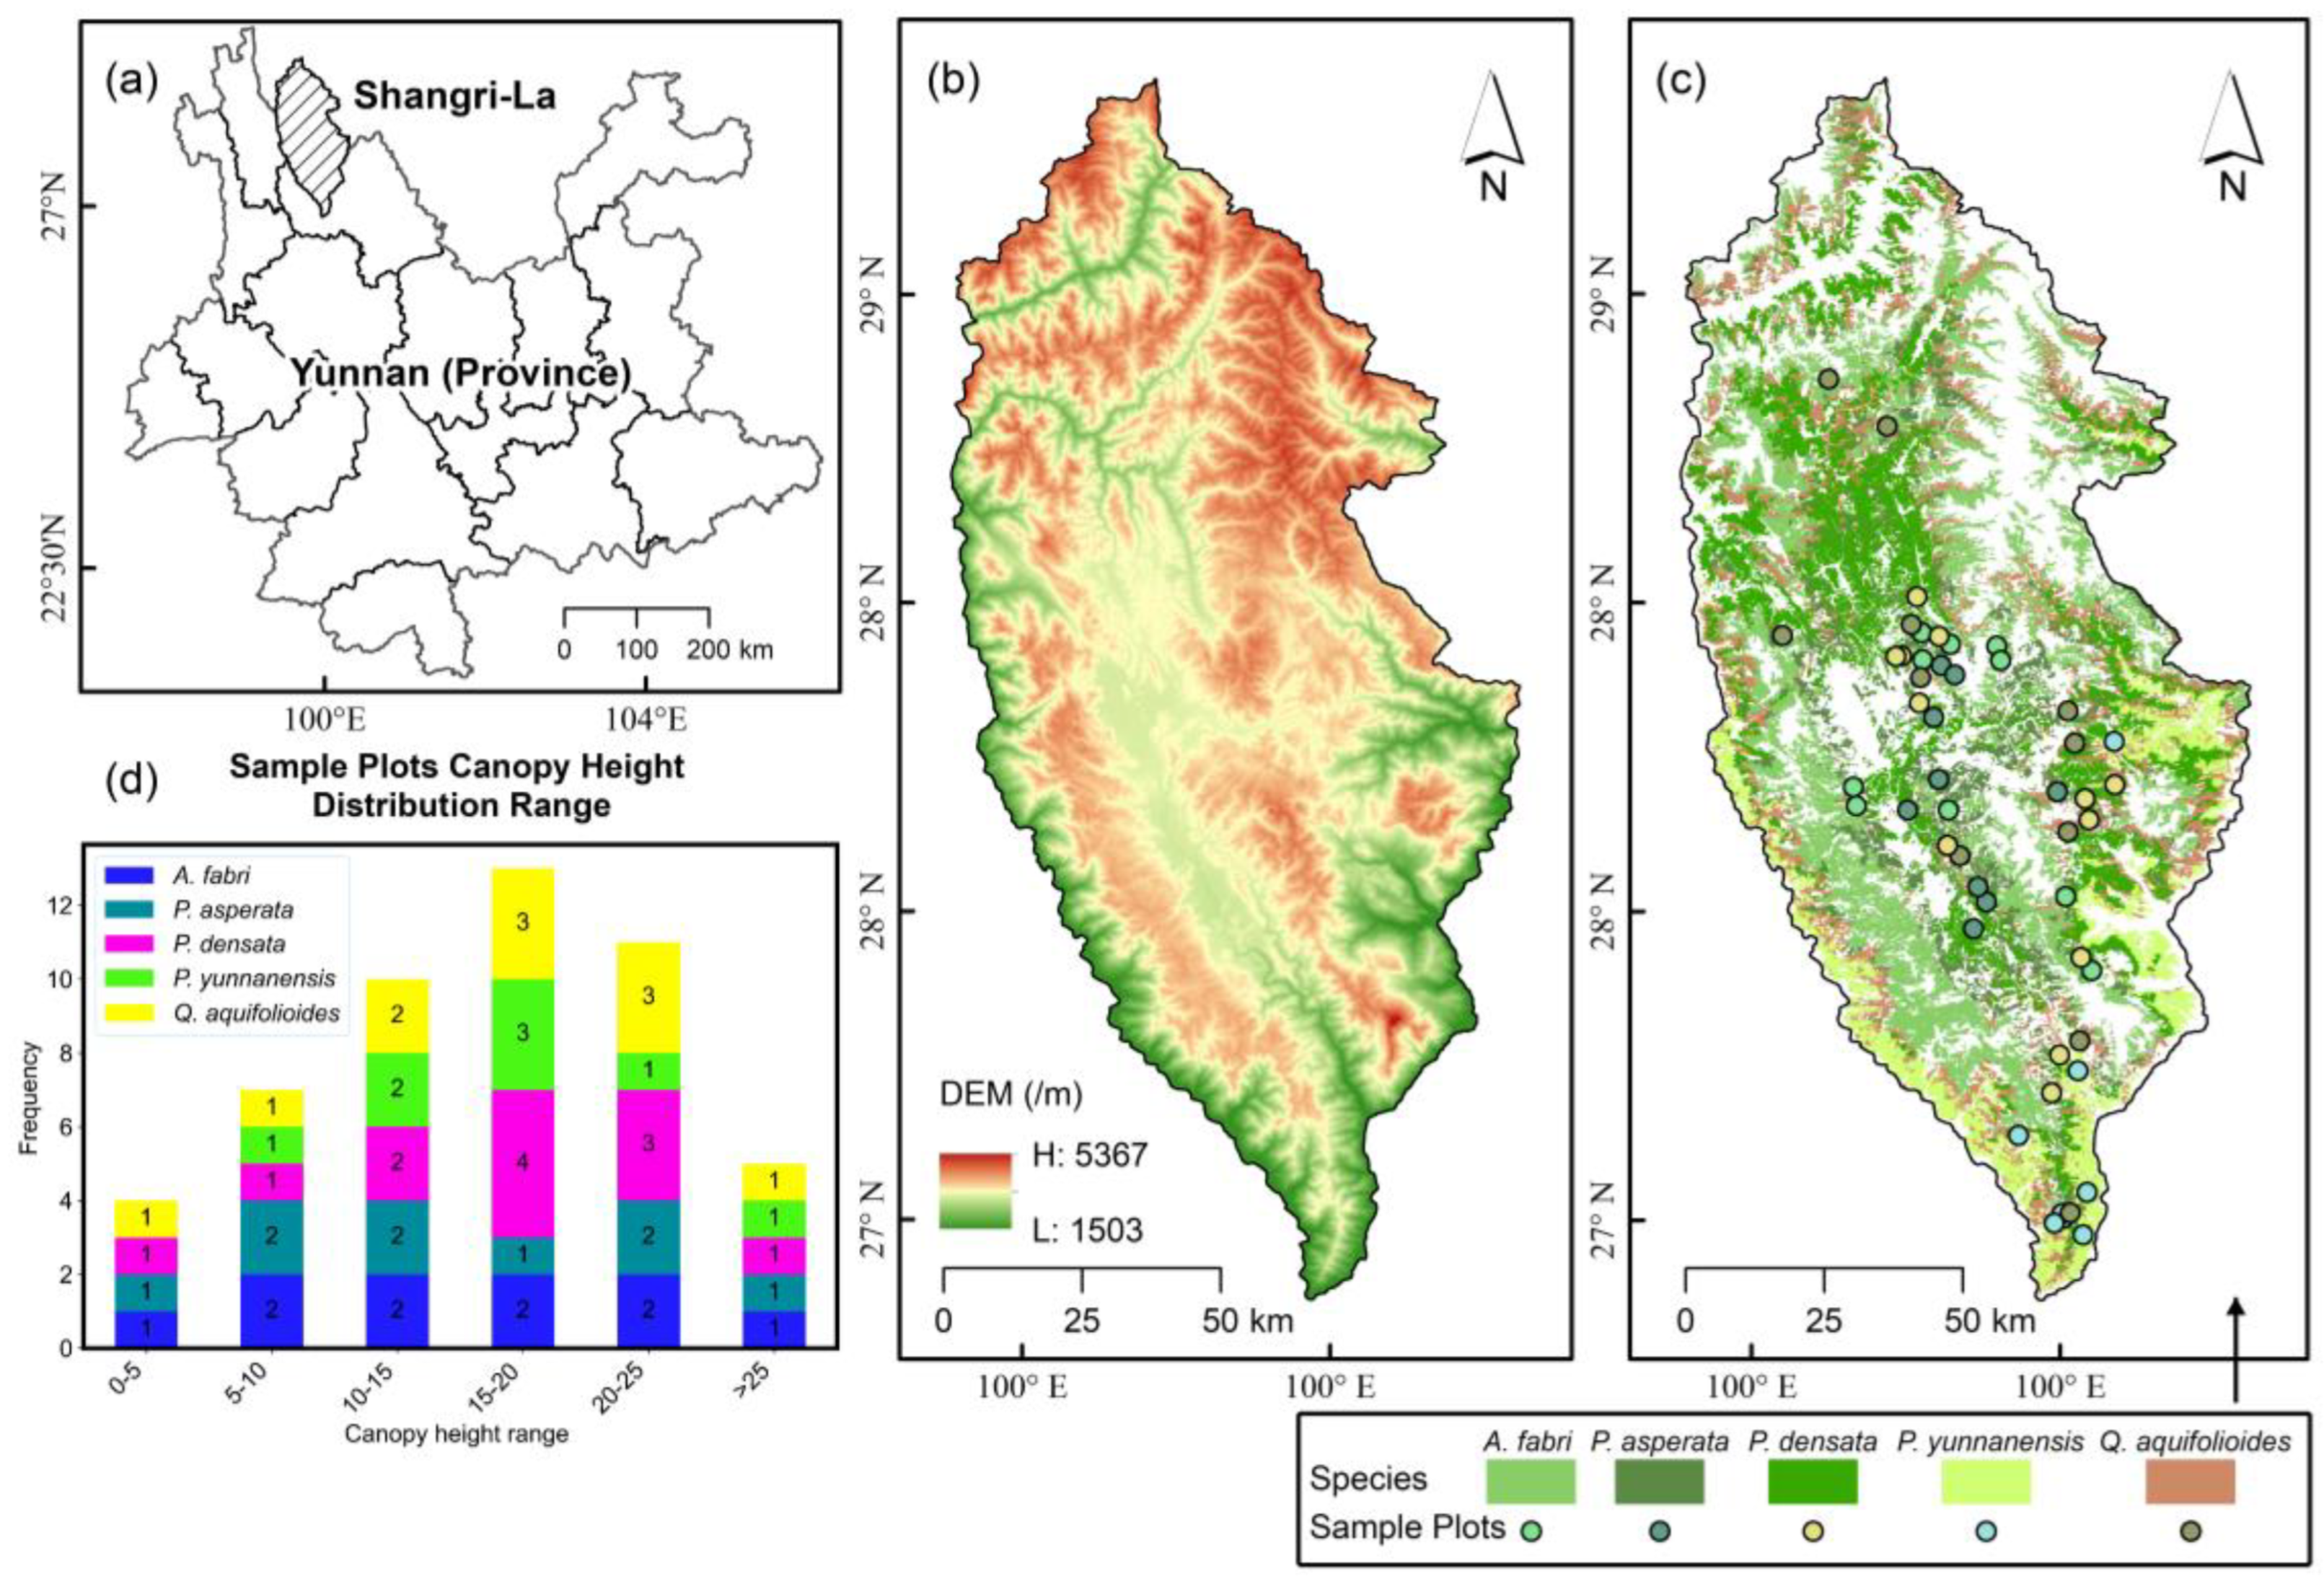
2.1. Study Area

Shangri-La city, located in the Diqing Tibetan Autonomous Prefecture of Yunnan Province, China, spans from 99°22′ E to 100°19′ E and 26°52′ N to 28°52′ N (Figure 1). This region is characterized by its complex topography, which is a result of the tectonic activity of the Himalayas that has given rise to diverse landforms, including mountains, valleys, plateaus, and basins [25].
The terrain gradually decreases in elevation from north to south. The lowest point, situated in Luojijihan, has an elevation of 1503 m above sea level, whereas the highest point, the main peak of Balagezong Snow Mountain, reaches an impressive 5367 m. The average elevation across the city is 3459 m, reflecting the region’s mountainous nature.
Climatically, Shangri-La city experiences an average annual temperature of 5.5 °C, with significant diurnal temperature variations [25]. The region’s vertical climatic zonation is particularly noteworthy, as it transitions from subtropical conditions at lower altitudes through warm temperate and temperate zones to cold temperate climates at higher elevations. This diverse climate significantly influences the distribution and growth patterns of local forest ecosystems.
The forest composition in Shangri-La city is dominated by five tree species: P. densata, A. fabri, P. asperata, P. yunnanensis, and Q. aquifolioides. Together, these species compose more than 90% of the arborvitae forests of the city—both the original forests and immense plantations [23]. As a result, these species are central to gaining an understanding of overall forest age structure and carbon sequestration in this particular context.

2.2. Data Collection and Processing

2.2.1. ICESat-2 Spaceborne LiDAR Data

Height data of the forest canopy come from the laser-based satellite ICESat-2, launched on 15 September 2018, with a multibeam micropulse photon-counting lidar system mounted onboard, called ATLAS, or the Advanced Topographic Laser Altimeter System, with high repetition rates, high densities, and high-precision measurements [26].
Specifically, we utilized the ICESat-2 Level 3 product (referred to as the ATL08 product), which provide land vegetation canopy height. This ICESat (NASA, Washington, DC, USA) product is highly correlated with forest age parameters, as demonstrated in previous studies, and is also commonly utilized for inverting forest canopy heights at different scales [27,28,29]. The abovementioned ATL08 data were obtained from the National Snow and Ice Data Center (NSIDC) portal (https://nsidc.org/data/icesat-2/data (accessed on 1 May 2024)).
This study combined ICESat-2/ATL08 canopy height data from 2019 to 2020 for forest age estimation. We used high-density ICESat-2/ATL08 canopy height data at a 3:7 ratio to obtain validation and training samples. The feature variables and environmental variables calculated from Sentinel-2 data for different dominant tree species were used as feature factors. These factors were ranked by feature importance, and on the basis of the selected feature variables, random forest regression was used to obtain spatially continuous 30 m vegetation canopy height data for Shangri-La city. To validate the accuracy of our canopy height extrapolation, we conducted an independent assessment using 50 field-measured sample plots distributed across the study area. These plots were selected to represent the diversity of tree species and height ranges in Shangri-La, including all five dominant species with heights ranging from. We performed a linear regression analysis between the model-extrapolated canopy heights and the field-measured tree heights. The results showed an R2 of 0.714, indicating a strong correlation between predicted and observed values. This significant relationship validates the reliability of our canopy height extrapolation method.
This approach included filtering nonforest points from the cloud, removing noisy points, and performing detailed quality checks. Next, we interpolated the discrete ICESat-2 measurements into a continuous canopy height model for our study area.

2.2.2. Optical and Radar Remote Sensing Data

To complement the LiDAR data and provide additional spectral and textural information, we included optical and radar remote-sensing data from a variety of sources. All multisource remote sensing image data selected for the experiment were from 2020.
(a)
Sentinel-1A (ESA, Paris, France): We used the synthetic aperture radar (SAR) sensor onboard Sentinel-1A, comprising VV and VH C-band polarizations acquired at 10 m spatial resolution and then resampled at 30 m in line with the specifications of other data sources. Data from Sentinel-1A are ideal because the SAR sensor penetrates cloud cover and provides a complementary data source to optical modalities, enabling a detailed analysis of forest structure [30].
(b)
Landsat 7 and 8 (NASA, Washington, DC, USA): We selected Landsat 8 images with the highest quality in 2020 covering the study area. After cloud removal processing, we mosaicked them and cropped them to the region of interest. Then, we extracted the spectral indices and textural features that are relevant for forest age estimation [6].
(c)
Sentinel-2 (ESA, Paris, France): We use a Sentinel-2 image from 2 June 2016 in the study area. The Level-2A product (atmospherically corrected) was used. All bands were resampled to have a 30 m resolution to be consistent with other sources [31].
Satellite imagery was downloaded via the Google Earth Engine (https://developers.google.cn/earth-engine/ (accessed on 1 May 2024)) and preprocessed via this platform’s cloud-computing capability for handling and carrying out the necessary practical preprocessing steps.

2.2.3. Auxiliary Environmental Data

To account for the deterministic effects of the environment on forest growth and the state equations governing age, we used the following auxiliary data:
(a)
Digital elevation model (DEM): Elevation information and slope data were derived from Advanced Spaceborne Thermal Emission and Reflection Radiometer Global Digital Elevation Model (ASTER GDEM) data. The ASTER GDEM was obtained from the Geospatial Data Cloud platform (https://www.gscloud.cn (accessed on 1 May 2024)) with a spatial resolution of 30 m.
(b)
Climate data: We downloaded data on the annual average temperature and annual precipitation of each grid cell from the Earth Resource Data Cloud platform (http://gis5g.com/ (accessed on 1 May 2024)). We then downscaled these datasets, which were originally at 1 km resolution and were based on the interpolation of data from 2472 meteorological stations across China into a 30 m resolution, to match the other datasets at that resolution. The climate data were resampled to a 30 m spatial resolution via pixel resampling in ArcGIS (Version 10.8, Esri, Redlands, CA, USA).
All auxiliary data were checked for quality and, if needed, resampled in time or reprojected in space to preserve spatial and temporal coherence with the primary remote-sensing products.

2.2.4. Field Survey Data
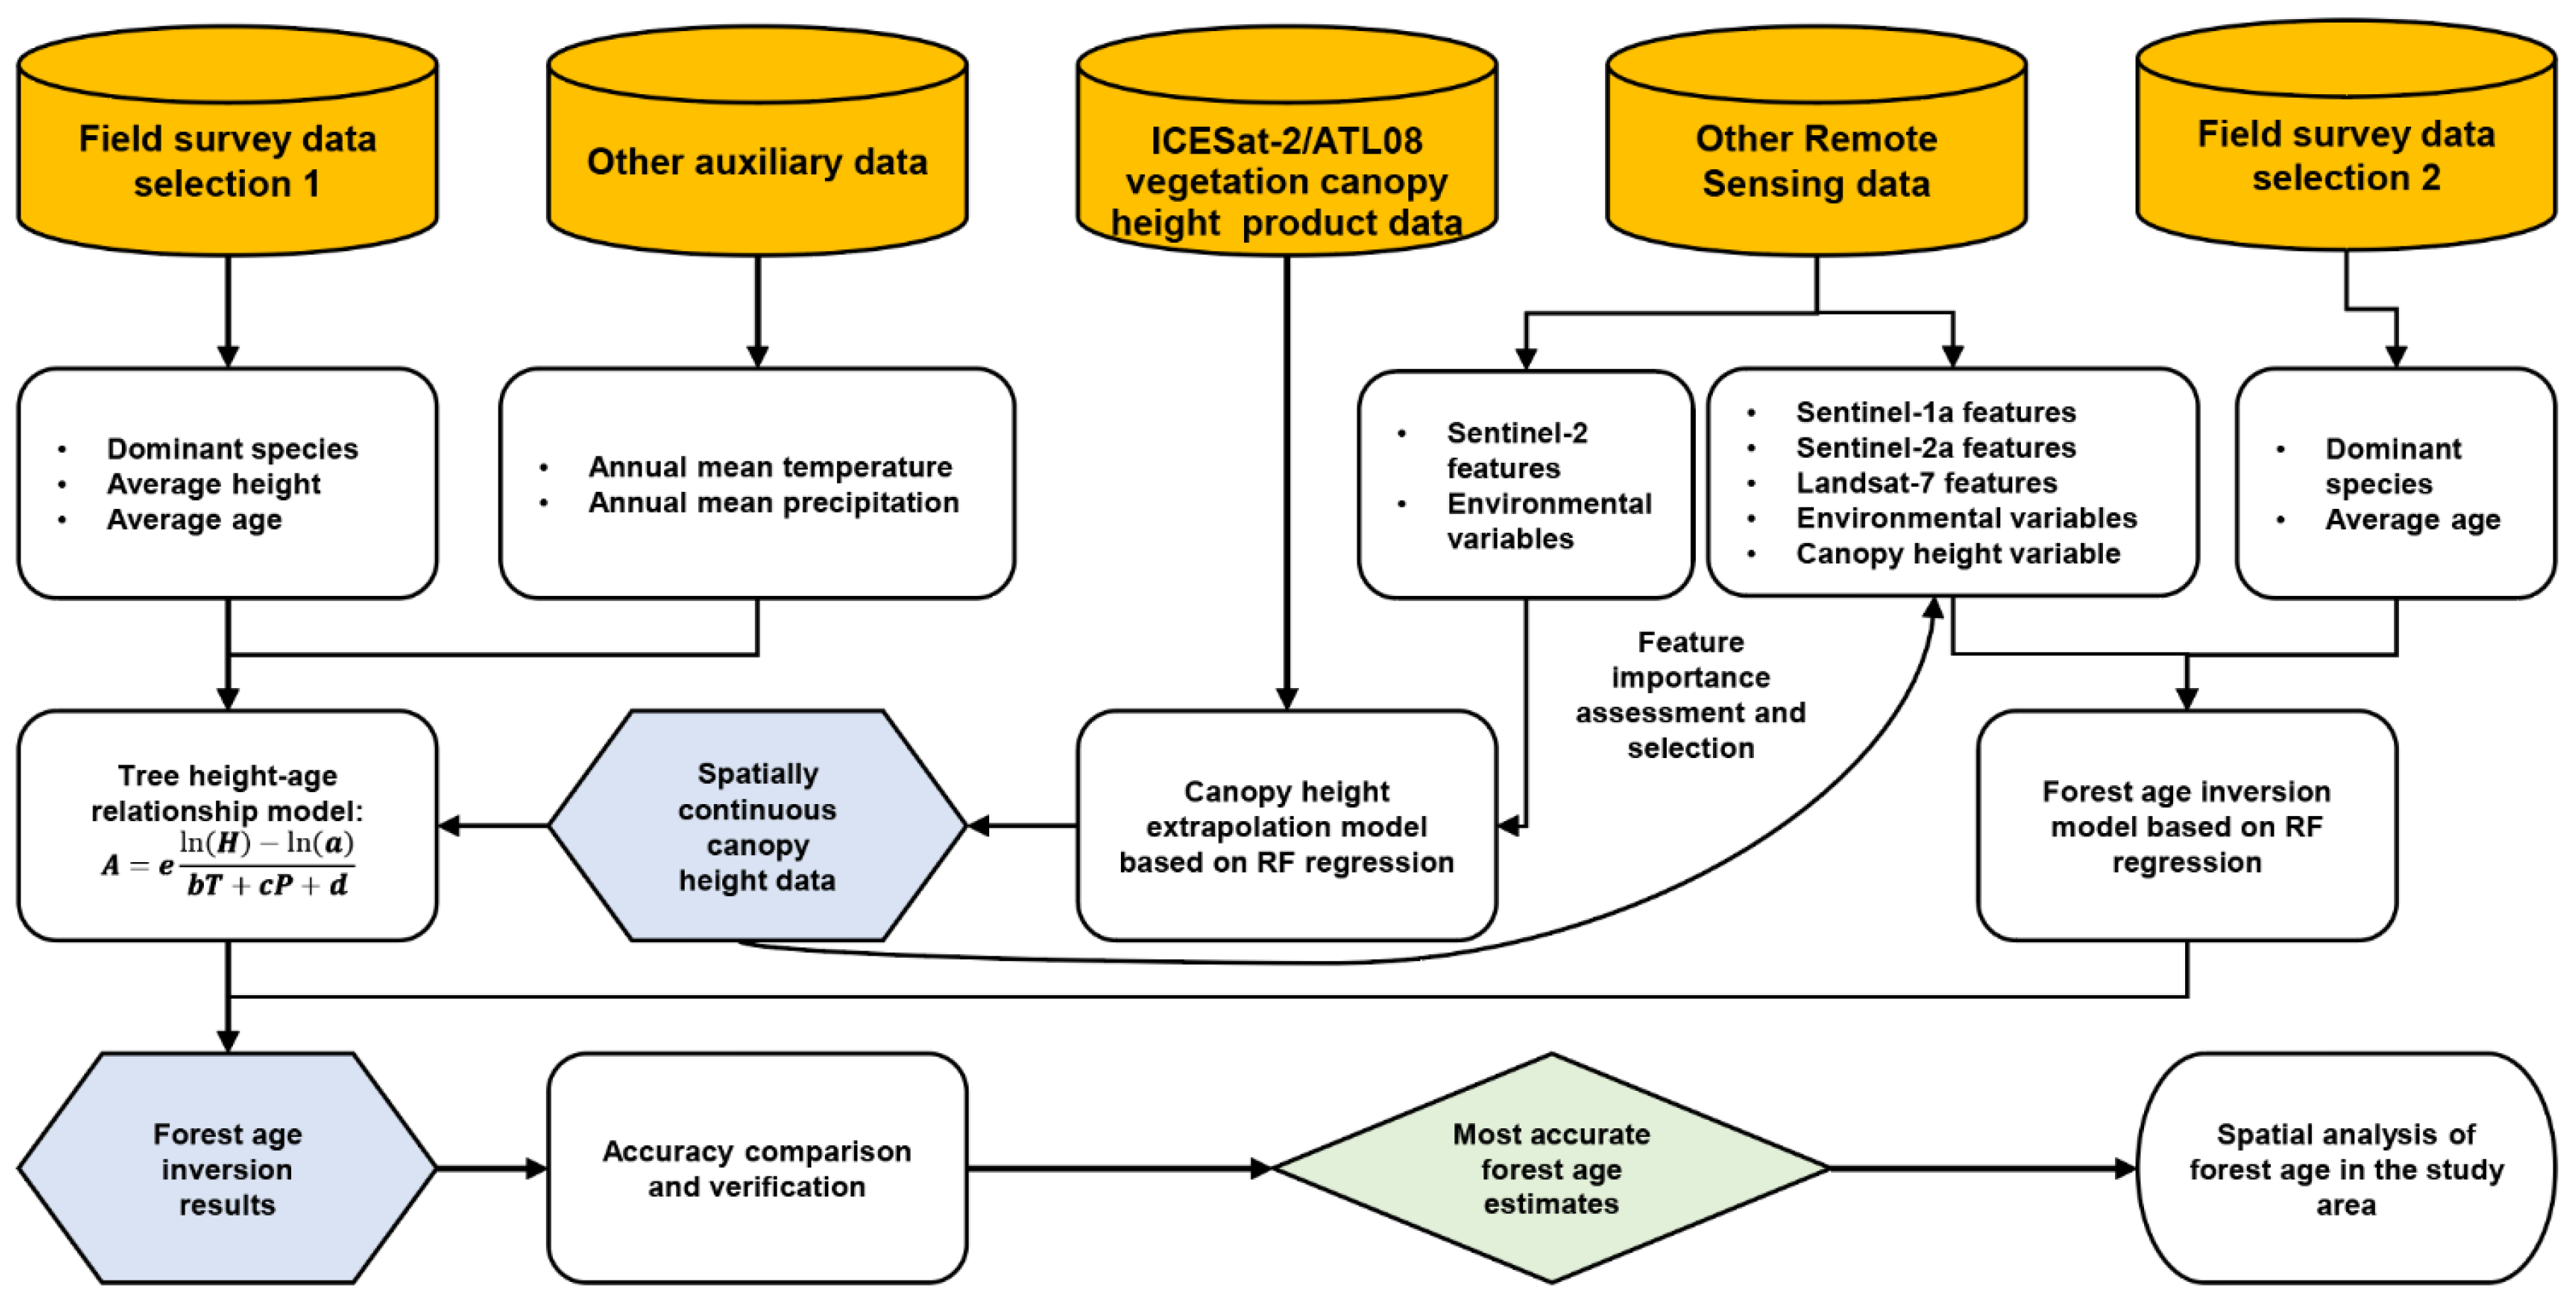
Ground truth data were obtained from forest resource inventory surveys conducted in Shangri-La city. The measured data were from the 2016 Shangri-La City Forest Resource Category II Survey, which had been vectorized. Each vector face contains attributes such as the dominant tree species name, average forest age, age group, and average tree height. There are a total of 32,532 vector faces of varying shapes and sizes, including 8858 P. densata, 9047 A. fabri, 4361 P. asperata, 3948 P. yunnanensis, and 6320 Q. aquifolioides.
For validation purposes, we used forest height measurements from 30 m × 30 m sample plots, as these correspond to the spatial resolution of our remote sensing data. The tree height data used to verify the accuracy of canopy height extrapolation were obtained from field surveys conducted between 2021 and 2022, with tree height being the average forest height within 30 m × 30 m sample plots. These field measurements were crucial for both the model training and independent accuracy assessment of our canopy height extrapolations and age estimations.

2.3. Methodology

Our approach to forest age inversion involved two main steps: (1) the extrapolation of canopy height data from discrete ICESat-2 measurements to a continuous surface and (2) the estimation of forest age via two different modeling approaches. The overall workflow is illustrated in Figure 2.

2.3.1. Canopy Height Extrapolation

We devised a machine learning-based method [32] to generate a continuous canopy height model from these discrete height measurements acquired along the ICESat-2 track, comprising the following steps:
(a)
ICESat-2 Data Preprocessing
First, we filtered the ATL08 product to remove points that were not in the forest and were nonlinear (i.e., noise) signals. Next, we applied quality checks to remove points with undetectable signal-to-noise ratios or impossible measured heights. Finally, we applied a terrain correction to measurements that are known to underestimate true height because of topographic effects.
(b)
Feature Extraction
We used a large set of predictors from different remote sensing and auxiliary sources to increase the robustness of the model: spectral reflectance indices (NDVI, EVI, and NDWI) from the Landsat and Sentinel-2 platforms; textural features from Sentinel-1 SAR data; topographic features (elevation, slope and aspect) derived from the ASTER GDEM; and climatic features (temperature and precipitation).
(c)
Random Forest Regression
Each pixel of the lidar trace was considered both a dependent variable and an independent variable and, hence, separated into two distinct groups (loops). We assigned 70% of the ICESat-2 data points to the training set and 30% to the validation set, to obtain robust estimates and appropriately mitigate the likelihood of overfitting. This meticulously designed feature space was subsequently used to further train the random forest model, which supplies predefined features (extracted from all training loops) as predictors and the ICESat-2 height as a response variable. Moreover, part-by-part model optimization was performed using cross-validation to determine the acting parameters most suitable for improving model prediction accuracy.
(d)
Continuous Canopy Height Prediction
Using the trained random forest model, we predicted canopy height across the whole study area at a 30 m resolution.
(e)
Validation
We tested the extrapolated canopy height model with a subset of 30% of the ICESat-2 data points, independent of those used to train the model, as well as the field-measured tree heights from our 50 samples of tree-measured plots.

2.3.2. Forest Age Estimation Models

We compared two approaches for estimating forest age from the extrapolated canopy height data:
(a)
Climate-dependent Exponential Relationship Model
This model is based on the assumption that forest height (H) is related to forest age (A) through an exponential function that incorporates climatic variables [2]:
H = a A b T + c P + d
where T is the average annual temperature; P is the average annual precipitation; and a, b, c, and d are parameters specific to each forest type.
We rearranged this equation to solve for A:
A = e ln H ln a b T + c P + d
The parameters a, b, c, and d were calibrated for each dominant tree species via field survey data and nonlinear least squares regression.
(b)
Random Forest Regression Model
The random forest model is a combined algorithm based on classification and regression decision trees. It addresses the issue of multicollinearity among different features in optical image data. The model introduces randomness to the training samples and decision features, thereby reducing correlations between prediction values and ultimately avoiding overfitting. Therefore, the use of the random forest regression algorithm for model construction was proposed, and the processing steps are as follows: (i) The number of regression trees in the random forest regression model is set to B, and this paper set the value to 500. Assuming that the current regression tree number is b, let b = 1, 2, 3 …, B to iterate the following (ii) and (iii) processes. (ii) Conduct a resampling bootstrap on the discrete field survey data for forest age with sample size N to obtain the bootstrap sample Sb of the b-th regression tree, while the remaining samples of the bootstrap are considered out-of-bag (OOB) observations. (iii) Build a regression tree Tb on the basis of bootstrap sample Sb and input feature variables Θb. This regression tree predicts the result as Tb (Θb). (iv) When B iterations can be obtained after f (Θb) for the final prediction result, Equation (3) is obtained. The importance of the feature variables described in process (iii) usually needs to be evaluated before being input to improve the efficiency of random forest regression modeling; in this study, the mean decrease accuracy (MDA) metric of the OOB data is used for specific evaluation, and the metric value of the MDA can be estimated according to Equation (4) [33]:
f ( Θ b ) = 1 B b = 1 B T b ( Θ b )
η i = 1 B b = 1 B M S E b i M S E b i = ε b i ε b ε b i = m e a n ( Y b i Y ) 2 , ε b = m e a n ( Y b Y ) 2
In the formula, Y b and Y b i are the predicted values before and after the sequence is shuffled, respectively, whereas Y represents the training sample values. ε b and ε b i denote the mean squared errors between the predicted and actual values before and after the sequence is shuffled, respectively. M S E b i represents the extent to which the feature variable Xi affects the prediction accuracy for the corresponding regression tree Tb. η i is the average measure of feature variable Xi on the prediction accuracy for all regression trees, which is referred to here as the MDA criterion. The larger the MDA is, the more important the feature variable. The MDA evaluates the random forest feature importance by calculating the average contribution of each feature to each tree in the random forest. In this way, each feature variable within all five top dominant tree species can be ranked.
It is important to note that our analysis is based on 30 m × 30 m pixels from satellite data, which represent the finest spatial resolution of our study. These pixels are not equivalent to traditional forest stands, which are typically larger and defined by management practices. The age we derive for each pixel is best interpreted as an average or dominant age for the trees within that 30 m × 30 m area. While this resolution allows for detailed mapping across large areas, it may not capture fine-scale age variations that could exist within a pixel, especially in natural, uneven-aged forests.

2.3.3. Model Comparison and Validation

The accuracy evaluation indices used were the value of goodness of fit (R2) and the root mean square error (RMSE). R2 is usually between 0 and 1, with higher values indicating better fits and an R2 of 0 indicating no better prediction than prediction by the mean model. The RMSE is the square root of the arithmetic mean of the square of the difference between the predicted values and the actual values. The smaller the RMSE is, the more accurate the estimates provided by the model and the more sensitive the model is to outliers in the data [34]. The RMSE has the unit of the response variable, and the final formula for its calculation is as follows:
R 2 = 1 i ( y i y ^ i ) 2 i ( y i y ¯ i ) 2
R M S E = i = 1 n ( y i y ^ i ) n
In this formula, y i represents the actual forest age, y ^ i represents the predicted forest age, and y ¯ i represents the mean of all actual forest ages. Using this model, the final land-use-induced age distribution map of Shangri-La city at a 30 m resolution was obtained. This multisource approach takes full advantage of the distinctive properties of each source of data, with sophisticated models then combining the data to provide a robust estimate of forest age across the varied environments of the urban jungle that is Shangri-La city.

3. Results

3.1. Spatially Continuous Canopy Height Inversion in Shangri-La City

The canopy height extrapolation model developed for each dominant tree species in the study area is based on spatially discrete ICESat-2/ATL08 canopy height products derived from multisource remote sensing data that are independent of each other. The spatial feature importance of each dominant tree species was determined and ranked via the MDA metric with OOB estimation (Table S1). Canopy height serves as a reasonable proxy for forest age. The top 10 features with the strongest relationships with tree age were chosen for further extrapolation modeling. The data analysis revealed that the canopy heights of the dominant tree species were strongly correlated with almost all the environmental factors, which varied by species:
  • P. asperata: slope, SWIR1, and VRE1;
  • P. yunnanensis: precipitation, slope, and S2REP;
  • Q. aquifolioides: slope, elevation, and precipitation;
  • A. fabri: precipitation, elevation, and slope;
  • P. densata: precipitation, temperature, and slope.
These evaluation results are consistent with those reported in the literature [30]. By integrating the high-density ICESat-2/ATL08 canopy height data as training samples with the optimal feature variables for each dominant tree species, a spatially continuous vegetation canopy height distribution at a 30 m resolution was obtained for Shangri-La city via random forest regression. Linear regression between the model-extrapolated canopy height data and the measured tree height data from 50 sample plots revealed a coefficient of determination (R2) of 0.714, indicating a significant correlation and verifying the feasibility of the inversion results.

3.2. Modeling of Tree Height–Age Exponential Function Relationships

The relationships between tree age and height for the dominant tree species were fitted via Equation (1). Parameter ‘a’ controls the growth rate of tree height and showed minimal variation among the dominant tree species in Shangri-La, ranging from 0.5321 (P. asperata) to 1.4825 (A. fabri) (Table 1). The analysis revealed varying degrees of statistical significance for the model parameters (a, b, c, d) across different tree species. For P. densata, P. yunnanensis, and A. fabri, all parameters (a, b, c, d) showed statistical significance (p < 0.01 or p < 0.001), indicating that both temperature and precipitation play significant roles in the height–age relationship for these species. However, for P. asperata and Q. aquifolioides, while parameters a, c, and d were statistically significant (p < 0.01), parameter b, which is associated with temperature, was not significant (p > 0.05). This suggests that for these two species, precipitation may have a more dominant influence on tree growth compared to temperature in the studied region.
Parameters ‘b’ and ‘c’ represent the effects of temperature and precipitation on tree growth rate, respectively. For P. densata and A. fabri, parameter ‘b’, was positive, indicating that relatively high temperatures promote tree height growth in high-altitude ecosystems where growth is limited by low temperatures [15]. In contrast, parameter ‘b’ was negative for P. yunnanensis, Q. aquifolioides, and P. yunnanensis, suggesting that higher temperatures may increase transpiration and evaporation, exacerbating drought stress and limiting growth rates in these species [18].
Parameter ‘c’ was positive for all the dominant tree species, indicating that precipitation promotes tree height growth. Research suggests that growing season precipitation has a positive effect on tree growth for P. asperata [17], A. fabri [16], and P. densata [15]. P. yunnanensis was also positively correlated with water availability across different seasons [18].

3.3. Random Forest Model

3.3.1. Feature Variable Extraction Based on Multisource Remote Sensing Data

The parameters selected for random forest regression modeling included remote sensing indices, biophysical parameters, and other parameters (Table S2). The selected feature variables comprehensively and quantitatively describe the vegetation growth status [35]. Biophysical parameters were calculated from Sentinel-2A L2A-level data via the biophysical quantity processor module of the SNAP software (version 8.0, European Space Agency, Paris, France).
The feature variables were also calculated from the Landsat 7 imagery via tasseled cap transformation and band combination methods (Table S3). The selected features have proven effective for forest age estimation [36,37]. Texture features were extracted using a 3 × 3 window size. Slope, annual average temperature, annual average precipitation, and other environmental factors from auxiliary data were also used to construct the forest age estimation model.

3.3.2. Selection of Characteristic Variables

The importance of 37 feature variables for the five dominant tree species was ranked on the basis of the MDA metric, which calculates the average contribution of each feature to each tree in the random forest (Table S4). Using R2 and RMSE as evaluation metrics, the feature combination yielding the highest accuracy was identified as the optimal combination for each species. Features with high MDA values were then used in the random forest regression model to map forest age in Shangri-La city.

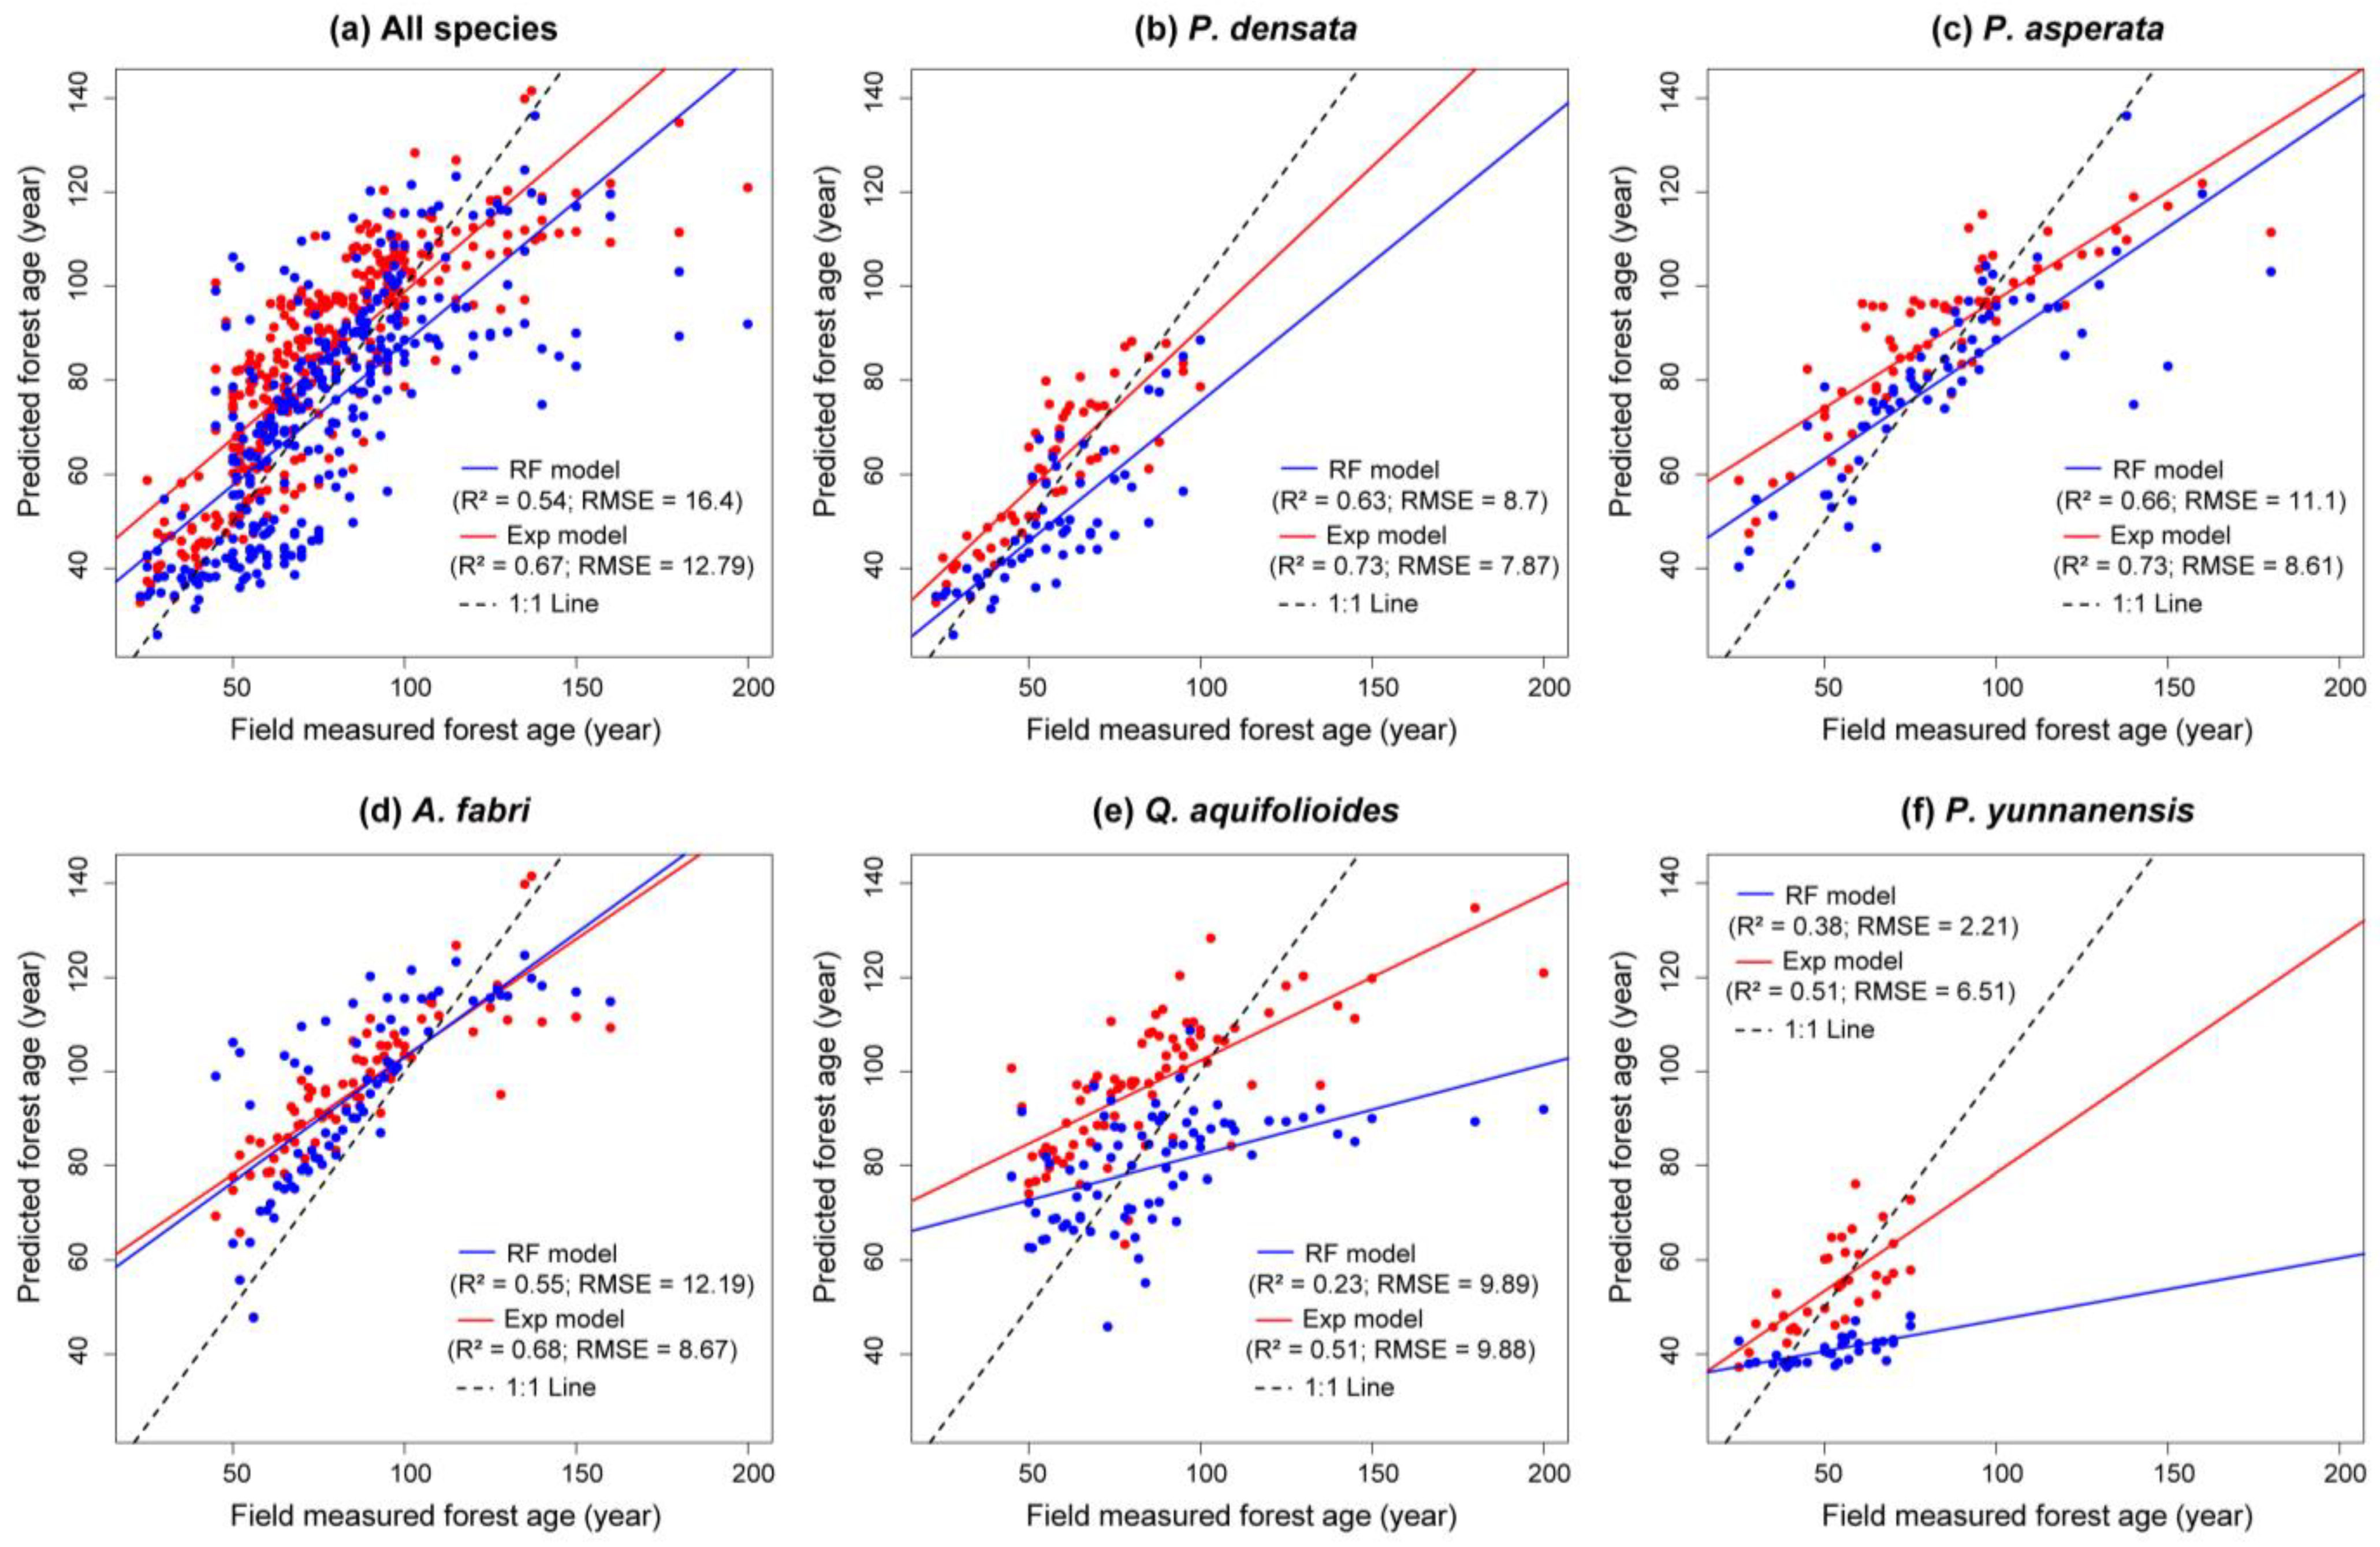
3.4. Accuracy Comparison of the Forest Age Inversion Models

Field survey data containing forest age attributes were converted into vector points, and the forest age results for the corresponding spatial locations were extracted for validation. The field survey data represent average values for forest age. Within the same plot, varying tree heights may lead to different forest age results. We validated the forest age inversion results by averaging them on the basis of the forest ages in the field survey data. To visualize and quantify the relationship between predicted and observed forest ages, we compared the performance of the random forest (RF) model and the climate-dependent exponential (Exp) model in Figure 3. This approach provides an intuitive representation of model performance, with the 1:1 line allowing for an easy assessment of prediction accuracy. The R2 value and RMSE offer comprehensive metrics for evaluating model performance across different age ranges.
As shown in Figure 3a, which combines data from all species, the forest age results obtained via the climate-dependent exponential model revealed an increase in R2 of 0.13 and a decrease in the RMSE of 3.61 years compared with the random forest model results. The Exp model achieved an R2 of 0.67 and RMSE of 12.79 years, while the RF model showed an R2 of 0.54 and RMSE of 16.4 years. This indicates that the Exp model generally outperforms the RF model when considering all species together.
Figure 3b–f show the comparison between the two models for each of the five dominant tree species. The climate-dependent exponential model consistently demonstrated higher R2 values for all five dominant tree species compared to the random forest model, though RMSE values varied. The performance for each species is as follows: For P. densata (Figure 3b), the Exp model achieved an R2 of 0.73 (RMSE = 7.87 years) compared to the RF model’s R2 of 0.63 (RMSE = 8.7 years); P. asperata (Figure 3c) showed significant improvement, with the Exp model achieving an R2 of 0.73 (RMSE = 8.61 years) compared to the RF model’s R2 of 0.66 (RMSE = 11.1 years); A. fabri (Figure 3d) exhibited improvement, with the Exp model reaching R2 of 0.68 (RMSE = 8.67 years) compared to the RF model’s R2 of 0.55 (RMSE = 12.19 years); Q. aquifolioides (Figure 3e) showed the Exp model (R2 = 0.51, RMSE = 9.88 years) outperforming the RF model (R2 = 0.23, RMSE = 9.89 years), with similar RMSE values; and P. yunnanensis (Figure 3f) demonstrated improvement with the Exp model (R2 = 0.51, RMSE = 6.51 years) compared to the RF model (R2 = 0.38, RMSE = 2.21 years), although the RF model showed a lower RMSE.
These results consistently demonstrate that the climate-dependent exponential relationship model provides more accurate forest age estimations in terms of R2 values across all dominant tree species in Shangri-La.

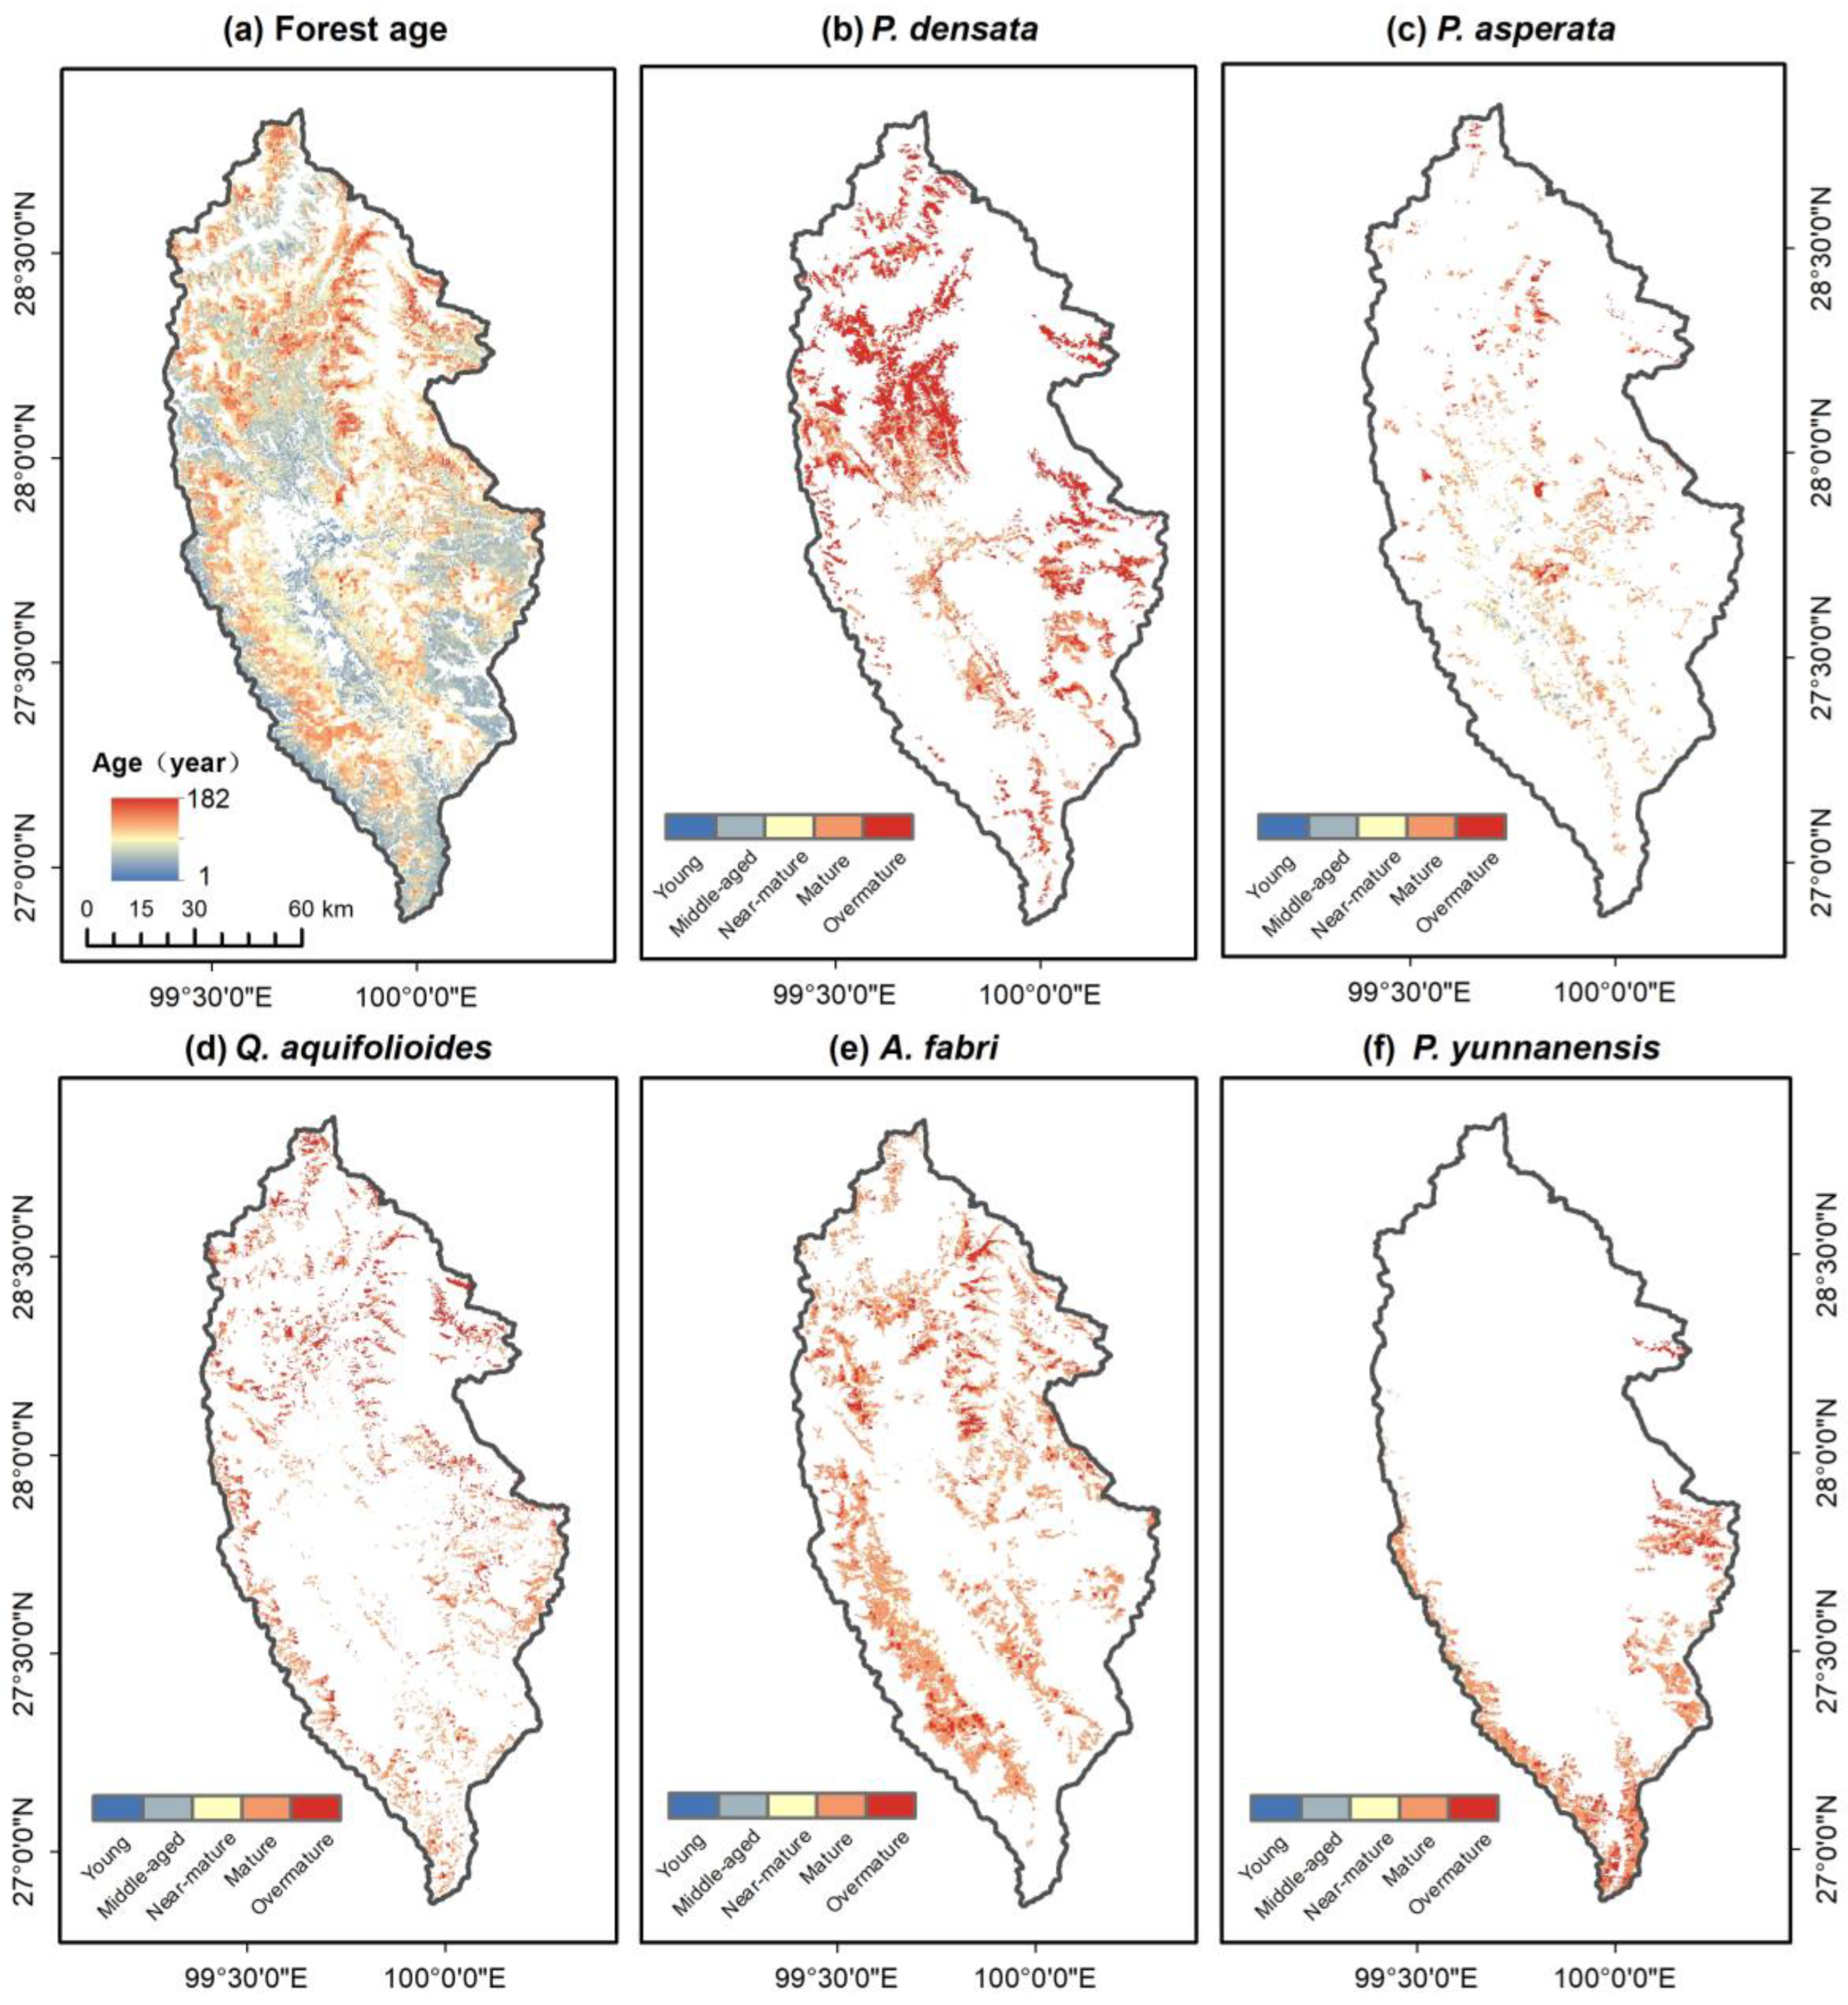
3.5. Mapping and Analysis of Forest Age Inversion Results

Forest age estimates for the Shangri-La region were obtained via the exponential relationship between forest height and age, as illustrated in Figure 4. Regions a through d primarily showed lower forest ages. Regions a and b, which are densely populated by residents of Shangri-La, are characterized by dense agricultural and pastoral activities. Human activities have significantly impacted these areas, resulting in relatively low forest ages for existing stands. Regions c and d lie along the Jinsha River and are characterized by the predominant presence of P. yunnanensis, a species native to the area. In addition to human disturbances, the low forest ages in these areas may also result from significant terrain variations along the Jinsha River Basin. The steep slopes and rocky terrain in this area may hinder the development and rooting of tree systems, thereby affecting tree growth. The Jinsha River Basin experiences unique climatic conditions, where extreme conditions may result in slower tree growth and consequently younger trees.
In this study, the classification of forest ages, including young, middle-aged, near-mature, mature, and overmature forests, followed the standards set by the National Forest Resources Continuous Inventory Technical Regulations [38]. The age thresholds for different groups varied among species, as detailed in Table 2. The coverage areas of different age groups were calculated as depicted in Table 2: (i) P. densata: the majority are overmature forests, distributed mainly in the northwestern and southeastern parts of Shangri-La. (ii) Q. aquifolioides: the majority consist of mature and overmature forests, although their distribution is relatively scattered, primarily in the middle elevation areas of Shangri-La. (iii) A. fabri: most forests are mature and overmature and are predominantly found in high-altitude areas. (iv) P. asperata: most forests are mature and are located primarily in the central part of Shangri-La. (v) P. yunnanensis: the majority consist of mature and overmature forests, with a more pronounced distribution along the Jinsha River.
Overall, the forests in the Shangri-La region are rich in resources and predominantly comprise mature forests, rendering them valuable natural carbon sinks.

4. Discussion

This study utilized ICESat-2 laser altimetry data and multisource remote sensing imagery to estimate and map forest age in the Shangri-La region of Yunnan, China, via two methods: the climate-dependent exponential relationship model and the random forest model. The results revealed that the climate-dependent exponential relationship model had a higher estimation accuracy than the random forest model did, with an R2 of 0.67 and an RMSE of 12.79 years. The climate-dependent exponential relationship model directly incorporates climatic factors into the tree height–age growth equation, which more directly reflects the influence of climatic conditions on tree growth [2]. This may be one of the reasons for its slightly better performance than the random forest model.
Our climate-dependent exponential model achieved R2 values ranging from 0.51 to 0.73 and RMSE values between 6.51 and 9.88 years across different species, which compares favorably with recent forest age estimation studies. For example, Cheng et al. [39] reported R2 values between 0.51 and 0.63, and RMSE values ranging from 2.04 to 7.65 years for their national-scale forest age estimation in China. Given the complex topography and diverse forest types in Shangri-La, we consider our accuracy levels to be acceptable and competitive with the current literature.
Feature importance analysis also indicated that the random forest model captures relationships between climatic and forest aging factors. The rule-based model [39] incorporated relative importance scores for key climatic features in the random forest models across five forest age categories in Shangri-La. Among these features, annual precipitation was ranked highest in importance for most species. For Yunnan pine, annual precipitation was the second most important feature, following the topographic factor of slope. This finding suggests that while the random forest and climate-dependent models conceptualize the processes differently, both highlight hydrothermal conditions as the key factors driving the forest age structure in the Shangri-La region.
While our analysis assumes a certain degree of age uniformity within each 30 m × 30 m pixel, we acknowledge that this may not always reflect the reality of forest structures, particularly in natural, unmanaged forests. This assumption, while necessary for large-scale remote sensing analysis, could lead to some level of error in our age estimates, especially in areas with high within-pixel age heterogeneity.
The observed nonlinear relationship and decreased accuracy in age estimation for trees older than 120–130 years can be attributed to several factors inherent to forest ecosystems and remote sensing limitations. As forests age, they develop more complex structures and compositions, which can lead to the saturation of remote sensing signals [40]. Additionally, environmental factors and disturbance histories accumulate over time, causing trees of the same age to exhibit different characteristics [41]. These factors present significant challenges to accurately estimating the age of older forests using remote sensing techniques. This underscores the need for more advanced methods that integrate ecological processes and multi-source data to enhance the accuracy of age estimation in old-growth forests.
These complex interactions between tree biology, climate, and age are further reflected in the spatial distribution of forest age across Shangri-La’s mountainous landscape. The spatial distribution of the main tree species in Shangri-La was analyzed, revealing that the proportion of old-growth forests was relatively high in alpine species such as Likiang spruce (P. asperata) and fir (A. fabri), while the age structure was relatively balanced in adaptable species such as Yunnan pine (P. yunnanensis), Q. aquifolioides (Q. aquifolioides) and Pinus densata (P. densata). Likiang spruce and fir are alpine species that are distributed mainly above an elevation range of 3500 m. However, Yunnan pine has a relatively balanced distribution across the four age classes and are widely scattered at elevations ranging from 2000 to 3500 m. These differences may be related to the growth rate, regeneration strategy and environmental stress tolerance of the tree species [42]. The alpine species is naturally slow growing, and the main distribution of mature alpine trees is in high-altitude areas with a low degree of human disturbance and a relatively stable climatic environment, as these conditions are conducive to old-growth forest formation. Species with overall greater flexibility grow fast and therefore become part of the overall environmental conditions with high frequency (including at lower elevations and in areas where greater damage is caused by human activities) and are more evenly spread across the four age classes [43].
The high proportions of mature and overmature forests in Shangri-La are ecologically meaningful. Other than being biodiversity hotspots, old-growth forests possess biological characteristics, such as providing a critical habitat for many species. Globally, old-growth forests are worldwide centers of species richness and endemism [44,45], and they represent important carbon sinks that accumulate a large amount of carbon in aboveground biomass and soil horizons. Additionally, they experience a low disturbance in biotic and abiotic environments, and they have become important sources of ecosystem stability [43].
From a biometeorological perspective, these findings reveal the complex relationships between climate factors and forest age structure in Shangri-La. These unique spatial patterns observed in different groups of tree species across different elevation zones clearly reflect the influence of climate on tree growth, survival and regeneration. For example, the observation of a greater proportion of old-growth alpine forests at higher elevation ranges, including species such as Likiang spruce (P. asperata) and fir (A. fabri), may be related to a potential climate-driven trade-off between growth rate and longevity [12,21].
The fact that a climate-dependent exponential relationship model can explain more variance in the measured temperature-controlled forest age, shows how climate-driven age structure is important in modeling forest age. These findings are consistent with those of previous studies that revealed strong relationships between climate and tree growth rates, which determines the type of age structure in the forest [12]. The findings of greater differences in age structure among species with a different level of environmental adaptability (e.g., P. yunnanensis and P. asperata) suggest that species composition and forest age structure will be affected by future climate change [46].
Our findings can also help interpret shifts in the provision of ecosystem services from forests under climate change; specifically, because climate change affects the forest age structure, the extent and drivers of changes in ecosystem services such as forest carbon sequestration, water regulation, and biodiversity support depend on shifts in forest age. Future research in Shangri-La will help reveal these and other effects of changing climates on forest dynamics [47]. Improved, finer-scale climate data and climate-sensitive phenological data should make such forecasts of forest age possible at localized, montane ecological sites such as Shangri-La. In conclusion, our study indicates that forests in Shangri-La are predominantly shifting towards more advanced age classes.
Climate and forest age relationships derived from the present study were remarkably consistent with results from other studies reporting the relationship in similar alpine environments. Bi et al. [17] reported the positive impact of growing season precipitation at the Jade Dragon Snow Mountain of Southwest China on the Likiang spruce (Picea likiangensis) growth. Panthi et al. [16] reported that the radial growth of fir Abies georgei was correlated with precipitation in the Hengduan Mountains. These studies demonstrate that moisture availability was a primary factor for tree growth in high-elevation ecosystems. Together with the environmental drivers and correlative relationships identified from the above three studies, our understanding of the shift of age structures in alpine mountains such as Shangri-La is considerably improved. However, deciphering the intricate relationships among climate, topography and tree species to explain the alpine forest dynamics in a range of environments at different elevations still requires intensive work.
The complementation of the ATL08 data product derives from its synergetic value, which mitigates the limitations of individual data sources. To quantitatively demonstrate the synergetic benefit of data fusion for the inference of the estimation of stand parameters based on the data integration of multisensor information through the data ablation experiments, we proposed and conducted a series of experiments, the results of which indicated the improved estimation accuracy when leveraging both ICESat-2 data and multisource optical imagery, providing unambiguous evidence of the synergism of the fusion of multisensor information across laser altimetry and optical remote sensing [28,48,49,50]. The results characterize this forest feature on two axes—vertical structure and horizontal distribution—in a complementary manner. Such multiangle information can provide complementary robust evidence that is more comprehensive, robust and reliable in nature, and has the potential to support the data-driven inference of stand parameters. However, the complex terrain condition is restrictive for a remote sensing-based age estimation of forests, and uncertainty analysis has indicated topographic effects, data-scale mismatches and the representativeness of field samples as the main uncertainties in the estimation process. The variance decomposition found that the dominant factors constraining estimation accuracy were topographic effects and data-scale mismatches [33]. The dominant factors constraining forest age estimation accuracy are the topographic effects and data-scale mismatches. This finding suggests that in future studies, we need to further strengthen the radiometric correction and scale transformation methods in complex terrain conditions, develop more robust topographic correction algorithms and scale extrapolation models, increase the number of field samples, optimize the spatial distribution of samples, and improve the representativeness of the validation data.
Although the current estimation results are in good agreement with field measurements, due to time and cost constraints, this study conducted only single-period forest age mapping. Considering the dynamic nature of forest age, it is necessary to utilize multitemporal remote sensing data in the future to continuously monitor forest age and reveal the evolutionary patterns of regional forest age structure [39,51,52]. In addition, with the launch of new-generation laser altimetry systems such as the GEDI and the widespread application of SAR data, a multisensor collaborative forest monitoring system is being rapidly developed [53]. Future research should actively explore the complementary advantages of different types of sensors to further improve the spatiotemporal resolution and coverage of forest mapping.
From a regional application perspective, accurate and timely forest age information is highly valuable for the refined management of forest resources and the assessment of ecosystem service functions in Shangri-La. These research results can provide a scientific basis for formulating sustainable management plans, optimizing stand structure, and strengthening biodiversity protection. Relevant departments should make full use of the research results, adjust reforestation and regeneration strategies according to the growth characteristics and site condition differences in the main tree species, strengthen the tending and management of young and middle-aged forests, promote a balanced age structure of different tree species, and enhance the stability of forest ecosystems [54,55]. Moreover, forests in Shangri-La play an irreplaceable role in regulating the regional water and heat balance, conserving water sources, sequestering carbon, and releasing oxygen. Accurate forest age information can lay the foundation for assessing the ecosystem service functions of forests [25]. In the future, the application of this research approach should be further expanded to evaluate forest carbon sequestration potential and identify biodiversity hotspots to provide decision-making support for regional ecological civilization construction.
In general, this study achieved 30 m resolution forest age mapping in the Shangri-La region, providing important data support for refined forest management. Research has shown that collaborative estimation via ICESat-2 laser altimetry and multisource optical remote sensing imagery can significantly improve the estimation accuracy of forest parameters. Although the climate-dependent exponential relationship model and the random forest model differ slightly in how they integrate climatic factors, they both reveal the decisive role of climatic conditions in tree growth and forest age distribution. The application of these models shows that accurately characterizing the forest age structure in complex mountainous environments requires full consideration of the interactive influence of multiple factors, such as climate, topography, and tree species. In the future, we should further explore the linkage mechanism among forest age, tree height, and remote sensing factors, expand the application of regional carbon sink assessment, and utilize cutting-edge technologies such as artificial intelligence to empower forest monitoring and management. Only by continuously improving technical methods, expanding application fields, and strengthening scientific decision-making can remote sensing-based forest age mapping better serve the sustainable development of Shangri-La and contribute wisdom and strength to the construction of a world-class ecological civilization highland.

5. Conclusions

In this study, we estimated and mapped forest age in the Shangri-La region of Yunnan, China, via ICESat-2 laser altimetry data and multisource remote sensing imagery. We compared two methods: the climate-dependent exponential relationship model and the random forest model. Compared with the random forest model, the climate-dependent exponential relationship model had greater estimation accuracy, with an R2 of 0.67 and an RMSE of 12.79 years. Both models consistently indicated that climatic conditions, particularly precipitation, are key factors influencing the forest age structure in the region.
The spatial analysis of forest age for the five dominant tree species in Shangri-La revealed distinct patterns. Alpine species such as Likiang spruce (P. asperata) and fir (A. fabri) had a greater proportion of old-growth forests, which were mainly distributed in high-elevation areas with less human disturbance. In contrast, adaptable species such as Yunnan pine (P. yunnanensis), Q. aquifolioides, and Pinus densata exhibited a more balanced age structure across different elevations and environmental conditions.
The integration of ICESat-2 laser altimetry height data with multisource optical imagery significantly enhanced the accuracy of the estimated forest parameters, providing a new perspective for mapping forest age through information fusion in complex mountainous environments. Compared with the use of a single data source, the data fusion approach improved the overall accuracy of forest age mapping, enabling the classification of forests at a fine scale.
The 30 m resolution forest age map produced in this study has significant value for refined forest management and ecosystem service assessments in Shangri-La. These findings can support the optimization of stand structure, biodiversity conservation, and the evaluation of carbon sequestration potential. To further advance the field of remote sensing-based forest age mapping, future research should focus on deepening the understanding of the linkages among forest age, tree height, and remote sensing factors, expanding applications in regional ecological assessments, and harnessing cutting-edge technologies such as artificial intelligence. Moreover, future research could also address the limitation of assuming age uniformity within pixels by incorporating measures of within-pixel structural heterogeneity. This could be achieved through the use of very high-resolution imagery or LiDAR data, providing a more nuanced understanding of forest age distributions at finer scales.
To further enhance the accuracy of forest age estimates, particularly for older forests where our model’s accuracy decreases, we propose several approaches for future research: (1) incorporating high-resolution LiDAR data to capture detailed forest structure [30,33]; (2) utilizing multi-temporal satellite imagery to track forest changes over time [53]; (3) increasing ground truth data, especially for older forests [39]; and (4) applying advanced machine learning techniques such as deep learning to capture more complex relationships between forest age and remote sensing data [30,33]. Implementing these approaches could potentially improve the accuracy of forest age estimates, particularly in complex mountainous environments like Shangri-La.
In conclusion, this study demonstrates the importance of integrating advanced remote sensing techniques for understanding forest dynamics in complex mountain environments. By continuously improving methodologies, expanding application domains, and strengthening scientific decision-making, remote sensing-based forest age mapping can significantly contribute to sustainable development and ecological civilization construction in regions such as Shangri-La.

Supplementary Materials

The following supporting information can be downloaded at: https://www.mdpi.com/article/10.3390/f15091622/s1, Table S1: A list of feature variables used in the canopy height extrapolation model derived from multisource remote sensing data; Table S2: The extraction of feature variables from Sentinel-2A data; Table S3: Spectral indices and texture measures derived from Landsat 7 data used as feature variables in the random forest model for forest age estimation; Table S4: A ranking of feature variable importance for estimating the forest age of the dominant tree species in Shangri-La based on the mean decrease accuracy (MDA) metric.

Author Contributions

F.C.: Conceptualization, Investigation, Methodology, Writing—Original Draft, Writing—Review and Editing, Formal Analysis, Data Curation, Funding Acquisition. R.Y.: Investigation, Methodology, Visualization, Writing—Original Draft. J.W.: Methodology, Supervision, Visualization, Formal Analysis, Data Curation, Writing—Review and Editing, Funding acquisition. All authors have read and agreed to the published version of the manuscript.

Funding

This study was supported by the National Natural Science Foundation of China (32160280, 42361065), the Natural Science Foundation of Yunnan Province (202201AT070040), the Xingdian Talent Support Program–Special for Young Talent (XDYC-QNRC-2022-0012), the Yunnan Province Innovation Team Project (202305AS350003), the Open Funding from the CAS Key Laboratory of Tropical Forest Ecology (22-CAS-TFE-04), and the Graduate Research and Innovation Fund of Yunnan Normal University (YJSJJ23-B99, YJSJJ23-B96).

Data Availability Statement

Data will be available on appropriate request.

Acknowledgments

We thank MN Liu from the Institutional Centre for Shared Technologies and Facilities of Xishuangbanna Tropical Botanical Garden, CAS.

Conflicts of Interest

The authors declare no conflicts of interest.

References

  1. Shang, R.; Chen, J.M.; Xu, M.; Lin, X.; Li, P.; Yu, G.; He, N.; Xu, L.; Gong, P.; Liu, L.; et al. China’s current forest age structure will lead to weakened carbon sinks in the near future. Innovation 2023, 4, 100515. [Google Scholar] [CrossRef] [PubMed]
  2. Zhang, Y.; Yao, Y.; Wang, X.; Liu, Y.; Piao, S. Mapping spatial distribution of forest age in China. Earth Space Sci. 2017, 4, 108–116. [Google Scholar] [CrossRef]
  3. Racine, E.B.; Coops, N.C.; St-Onge, B.; Bégin, J. Estimating forest stand age from LiDAR-derived predictors and nearest neighbor imputation. For. Sci. 2014, 60, 128–136. [Google Scholar] [CrossRef]
  4. Baghdadi, N.; Le Maire, G.; Fayad, I.; Bailly, J.S.; Nouvellon, Y.; Lemos, C.; Hakamada, R. Testing different methods of forest height and aboveground biomass estimations from ICESat/GLAS data in eucalyptus plantations in Brazil. IEEE J. Sel. Top. Appl. Earth Obs. Remote Sens. 2014, 7, 290–299. [Google Scholar] [CrossRef]
  5. Fayad, I.; Baghdadi, N.; Guitet, S.; Bailly, J.S.; Hérault, B.; Gond, V.; El Hajj, M.; Minh, D.H.T. Aboveground biomass mapping in French Guiana by combining remote sensing, forest inventories and environmental data. Int. J. Appl. Earth Obs. Geoinf. 2016, 52, 502–514. [Google Scholar] [CrossRef]
  6. Yang, X.; Liu, Y.; Wu, Z.; Yu, Y.; Li, F.; Fan, W. Forest age mapping based on multiple-resource remote sensing data. Environ. Monit. Assess. 2020, 192, 734. [Google Scholar] [CrossRef]
  7. Xie, Y.; Sha, Z.; Yu, M. Remote sensing imagery in vegetation mapping: A review. J. Plant Ecol. 2008, 1, 9–23. [Google Scholar] [CrossRef]
  8. Zhang, X.; Liu, L.; Chen, X.; Gao, Y.; Xie, S.; Mi, J. GLC_FCS30: Global land-cover product with fine classification system at 30 m using time-series Landsat imagery. Earth Syst. Sci. Data 2021, 13, 2753–2776. [Google Scholar] [CrossRef]
  9. Champion, I.; Germain, C.; Da Costa, J.P.; Alborini, A.; Dubois-Fernandez, P. Retrieval of forest stand age from SAR image texture for varying distance and orientation values of the gray level co-occurrence matrix. IEEE Geosci. Remote Sens. Lett. 2014, 11, 5–9. [Google Scholar] [CrossRef]
  10. Lin, X.; Xu, M.; Cao, C.; Dang, Y.; Bashir, B.; Xie, B.; Huang, Z. Estimates of forest canopy height using a combination of ICESat-2/ATLAS data and stereo-photogrammetry. Remote Sens. 2020, 12, 3649. [Google Scholar] [CrossRef]
  11. Zhu, Z.; Piao, S.; Xu, Y.; Bastos, A.; Ciais, P.; Peng, S. The effects of teleconnections on carbon fluxes of global terrestrial ecosystems. Geophys. Res. Lett. 2017, 44, 3209–3218. [Google Scholar] [CrossRef]
  12. Babst, F.; Bouriaud, O.; Poulter, B.; Trouet, V.; Girardin, M.P.; Frank, D.C. Twentieth century redistribution in climatic drivers of global tree growth. Sci. Adv. 2019, 5, eaat4313. [Google Scholar] [CrossRef] [PubMed]
  13. He, H.; Yan, Y.; Chen, T.; Cheng, P. Tree Height Estimation of Forest Plantation in Mountainous Terrain from Bare-Earth Points Using a DoG-Coupled Radial Basis Function Neural Network. Remote Sens. 2019, 11, 1271. [Google Scholar] [CrossRef]
  14. Hu, T.; Su, Y.; Xue, B.; Liu, J.; Zhao, X.; Fang, J.; Guo, Q. Mapping global forest aboveground biomass with spaceborne LiDAR, optical imagery, and forest inventory data. Remote Sens. 2016, 8, 565. [Google Scholar] [CrossRef]
  15. Peng, X.H.; Yang, R.Q.; Yin, Y.L.; Shankar, P.; Xu, T.L.; Fu, P.L.; Ge, S.; Fan, Z.X. Radial growth response of Pinus densata to climate factors in Baima Snow Mountain, Northwest Yunnan. Acta Ecol. Sin. 2023, 43, 8884–8893. [Google Scholar] [CrossRef]
  16. Panthi, S.; Bräuning, A.; Zhou, Z.K.; Fan, Z.X. Growth response of Abies georgei to climate increases with elevation in the central Hengduan Mountains, Southwestern China. Dendrochronologia 2018, 47, 1–9. [Google Scholar] [CrossRef]
  17. Bi, Y.; Xu, J.; Gebrekirstos, A.; Guo, L.; Zhao, M.; Liang, E.; Yang, X. Assessing drought variability since 1650 AD from tree-rings on the Jade Dragon Snow Mountain, Southwest China. Int. J. Climatol. 2015, 35, 4057–4065. [Google Scholar] [CrossRef]
  18. Yang, R.Q.; Fan, Z.X.; Li, Z.S.; Wen, Q.Z. Radial growth of Pinus yunnanensis at different elevations and their responses to climatic factors in the Yulong Snow Mountain, Northwest Yunnan, China. Acta Ecol. Sin. 2018, 38, 8983–8991. [Google Scholar] [CrossRef]
  19. Tang, C.Q.; Matsui, T.; Ohashi, H.; Dong, Y.F.; Momohara, A.; Herrando-Moraira, S.; Qian, S.; Yang, Y.; Ohsawa, M.; Luu, H.T.; et al. Identifying long-term stable refugia for relict plant species in East Asia. Nat. Commun. 2018, 9, 4488. [Google Scholar] [CrossRef]
  20. Wangda, P.; Ohsawa, M. Structure and regeneration dynamics of dominant tree species along altitudinal gradient in a dry valley slopes of the Bhutan Himalaya. For. Ecol. Manag. 2006, 230, 136–150. [Google Scholar] [CrossRef]
  21. Stephenson, N.L.; Das, A.J.; Condit, R.; Russo, S.E.; Baker, P.J.; Beckman, N.G.; Coomes, D.A.; Lines, E.R.; Morris, W.K.; Rüger, N.; et al. Rate of tree carbon accumulation increases continuously with tree size. Nature 2014, 507, 90–93. [Google Scholar] [CrossRef] [PubMed]
  22. Peñuelas, J.; Filella, I. Phenology. Responses to a warming world. Science 2001, 294, 793–795. [Google Scholar] [CrossRef] [PubMed]
  23. Deng, Y.; Pan, J.; Wang, J.; Liu, Q.; Zhang, J. Mapping of forest biomass in Shangri-La City based on LiDAR technology and other remote sensing data. Remote Sens. 2022, 14, 5816. [Google Scholar] [CrossRef]
  24. Buras, A.; Menzel, A. Projecting tree species composition changes of European forests for 2061-2090 under RCP 4.5 and RCP 8.5 scenarios. Front. Plant Sci. 2019, 9, 1986. [Google Scholar] [CrossRef] [PubMed]
  25. Yue, C.R. Forest Biomass Estimation in Shangri-La County Based on Remote Sensing. Ph.D. Thesis, Beijing Forestry University, Beijing, China, 2012. [Google Scholar]
  26. Neuenschwander, A.; Guenther, E.; White, J.C.; Duncanson, L.; Montesano, P. Validation of ICESat-2 terrain and canopy heights in boreal forests. Remote Sens. Environ. 2020, 251, 112110. [Google Scholar] [CrossRef]
  27. Jiang, F.; Zhao, F.; Ma, K.; Li, D.; Sun, H. Mapping the forest canopy height in Northern China by synergizing ICESat-2 with sentinel-2 using a stacking algorithm. Remote Sens. 2021, 13, 1535. [Google Scholar] [CrossRef]
  28. Li, W.; Niu, Z.; Shang, R.; Qin, Y.; Wang, L.; Chen, H. High-resolution mapping of forest canopy height using machine learning by coupling ICESat-2 LiDAR with sentinel-1, sentinel-2 and landsat-8 data. Int. J. Appl. Earth Obs. Geoinf. 2020, 92, 102163. [Google Scholar] [CrossRef]
  29. Narine, L.L.; Popescu, S.; Neuenschwander, A.; Zhou, T.; Srinivasan, S.; Harbeck, K. Estimating aboveground biomass and forest canopy cover with simulated ICESat-2 data. Remote Sens. Environ. 2019, 224, 1–11. [Google Scholar] [CrossRef]
  30. Huang, X.; Cheng, F.; Wang, J.; Yi, B.; Bao, Y. Comparative study on remote sensing methods for forest height mapping in complex mountainous environments. Remote Sens. 2023, 15, 2275. [Google Scholar] [CrossRef]
  31. Gascon, F.; Bouzinac, C.; Thépaut, O.; Jung, M.; Francesconi, B.; Louis, J.; Lonjou, V.; Lafrance, B.; Massera, S.; Gaudel-Vacaresse, A. Copernicus sentinel-2A calibration and products validation status. Remote Sens. 2017, 9, 584. [Google Scholar] [CrossRef]
  32. Escasio, J.C.L.; Santillan, J.R.; Makinano-Santillan, M. Using machine learning classifiers and regression models for estimating the stand ages of falcata plantations from sentinel data. Int. Arch. Photogramm. Remote Sens. Spat. Inf. Sci. 2023, XLVIII-4/W6-2022, 465–472. [Google Scholar] [CrossRef]
  33. Huang, X.; Cheng, F.; Wang, J.; Duan, P.; Wang, J. Forest canopy height extraction method based on ICESat-2/ATLAS data. IEEE Trans. Geosci. Remote Sens. 2023, 61, 5700814. [Google Scholar] [CrossRef]
  34. Valbuena, R.; Maltamo, M.; Mehtätalo, L.; Packalen, P. Key structural features of boreal forests may be detected directly using L-moments from airborne lidar data. Remote Sens. Environ. 2017, 194, 437–446. [Google Scholar] [CrossRef]
  35. Li, D.; Ju, W.; Fan, W.; Gu, Z. Estimating the age of deciduous forests in Northeast China with enhanced thematic mapper plus data acquired in different phenological seasons. J. Appl. Remote Sens. 2014, 8, 083670. [Google Scholar] [CrossRef]
  36. Lu, D.; Mausel, P.; Brondízio, E.; Moran, E. Relationships between forest stand parameters and landsat TM spectral responses in the Brazilian Amazon Basin. For. Ecol. Manag. 2004, 198, 149–167. [Google Scholar] [CrossRef]
  37. Schroeder, T.A.; Wulder, M.A.; Healey, S.P.; Moisen, G.G. Mapping wildfire and clearcut harvest disturbances in boreal forests with landsat time series data. Remote Sens. Environ. 2011, 115, 1421–1433. [Google Scholar] [CrossRef]
  38. GB/T38590-2020; Technical Regulations for Continuous Forest Inventory. National Forest Resources Standardization Technical Committee: Beijing, China, 2020.
  39. Cheng, K.; Chen, Y.; Xiang, T.; Yang, H.; Liu, W.; Ren, Y.; Guan, H.; Hu, T.; Ma, Q.; Guo, Q. A 2020 forest age map for China with 30 m resolution. Earth Syst. Sci. Data 2024, 16, 803–819. [Google Scholar] [CrossRef]
  40. Lu, D.; Chen, Q.; Wang, G.; Liu, L.; Li, G.; Moran, E. A survey of remote sensing-based aboveground biomass estimation methods in forest ecosystems. Int. J. Digit. Earth 2014, 9, 63–105. [Google Scholar] [CrossRef]
  41. Johnstone, J.F.; Allen, C.D.; Franklin, J.F.; Frelich, L.E.; Harvey, B.J.; Higuera, P.E.; Mack, M.C.; Meentemeyer, R.K.; Metz, M.R.; Perry, G.L.W.; et al. Changing disturbance regimes, ecological memory, and forest resilience. Front. Ecol. Environ. 2016, 14, 369–378. [Google Scholar] [CrossRef]
  42. Meng, X.; Gao, X.; Li, S.; Lei, J. Spatial and temporal characteristics of vegetation NDVI changes and the driving forces in Mongolia during 1982–2015. Remote Sens. 2020, 12, 603. [Google Scholar] [CrossRef]
  43. Gao, Y.; Lu, D.; Li, G.; Wang, G.; Chen, Q.; Liu, L.; Li, D. Comparative analysis of modeling algorithms for forest aboveground biomass estimation in a subtropical region. Remote Sens. 2018, 10, 627. [Google Scholar] [CrossRef]
  44. Burrascano, S.; Keeton, W.S.; Sabatini, F.M.; Blasi, C. Commonality and variability in the structural attributes of moist temperate old-growth forests: A global review. For. Ecol. Manag. 2013, 291, 458–479. [Google Scholar] [CrossRef]
  45. Watson, J.E.M.; Evans, T.; Venter, O.; Williams, B.; Tulloch, A.; Stewart, C.; Thompson, I.; Ray, J.C.; Murray, K.; Salazar, A.; et al. The exceptional value of intact forest ecosystems. Nat. Ecol. Evol. 2018, 2, 599–610. [Google Scholar] [CrossRef] [PubMed]
  46. Thom, D.; Rammer, W.; Seidl, R. The impact of future forest dynamics on climate: Interactive effects of changing vegetation and disturbance regimes. Ecol. Monogr. 2017, 87, 665–684. [Google Scholar] [CrossRef] [PubMed]
  47. Seidl, R.; Spies, T.A.; Peterson, D.L.; Stephens, S.L.; Hicke, J.A. Searching for resilience: Addressing the impacts of changing disturbance regimes on forest ecosystem services. J. Appl. Ecol. 2016, 53, 120–129. [Google Scholar] [CrossRef] [PubMed]
  48. Margolis, H.A.; Nelson, R.F.; Montesano, P.M.; Beaudoin, A.; Sun, G.; Andersen, H.E.; Wulder, M.A. Combining satellite lidar, airborne lidar, and ground plots to estimate the amount and distribution of aboveground biomass in the boreal forest of North America. Can. J. For. Res. 2015, 45, 838–855. [Google Scholar] [CrossRef]
  49. Qi, W.; Saarela, S.; Armston, J.; Ståhl, G.; Dubayah, R. Forest biomass estimation over three distinct forest types using TanDEM-X InSAR data and simulated GEDI lidar data. Remote Sens. Environ. 2019, 232, 111283. [Google Scholar] [CrossRef]
  50. Zhu, X.; Wang, C.; Nie, S.; Pan, F.; Xi, X.; Hu, Z. Mapping forest height using photon-counting LiDAR data and landsat 8 OLI data: A case study in Virginia and North Carolina, USA. Ecol. Indic. 2020, 114, 106287. [Google Scholar] [CrossRef]
  51. Hayashi, M.; Saigusa, N.; Oguma, H.; Yamagata, Y.; Takao, G. Quantitative assessment of the impact of typhoon disturbance on a Japanese forest using satellite laser altimetry. Remote Sens. Environ. 2015, 156, 216–225. [Google Scholar] [CrossRef]
  52. Wang, Y.; Li, G.; Ding, J.; Guo, Z.; Tang, S.; Wang, C.; Huang, Q.; Liu, R.; Chen, J.M. A combined GLAS and MODIS estimation of the global distribution of mean forest canopy height. Remote Sens. Environ. 2016, 174, 24–43. [Google Scholar] [CrossRef]
  53. Lin, X.; Shang, R.; Chen, J.M.; Zhao, G.; Zhang, X.; Huang, Y.; Yu, G.; He, N.; Xu, L.; Jiao, W. High-resolution forest age mapping based on forest height maps derived from GEDI and ICESat-2 space-borne lidar data. Agric. For. Meteorol. 2023, 339, 109592. [Google Scholar] [CrossRef]
  54. Bauhus, J.; Puettmann, K.; Messier, C. Silviculture for old-growth attributes. For. Ecol. Manag. 2009, 258, 525–537. [Google Scholar] [CrossRef]
  55. Puettmann, K.J.; Wilson, S.M.; Baker, S.C.; Donoso, P.J.; Drössler, L.; Amente, G.; Harvey, B.D.; Knoke, T.; Lu, Y.; Nocentini, S.; et al. Silvicultural alternatives to conventional even-aged forest management—What limits global adoption? For. Ecosyst. 2015, 2, 8. [Google Scholar] [CrossRef]
Figure 1. Overview of the study area in Shangri-La city, Yunnan Province, China: (a) location of Shangri-La city within Yunnan Province; (b) digital elevation model (DEM) showing the complex mountainous terrain of the study area; (c) spatial distributions of the five dominant tree species in Shangri-La city; (d) distribution across different canopy height intervals.
Forests 15 01622 g001
Figure 2. Workflow of forest age estimation in Shangri-La based on the integration of ICESat-2/ATLAS data, multisource remote sensing imagery, and field survey samples. RF indicates random forest.
Forests 15 01622 g002
Figure 3. Comparison of forest age predictions between the random forest (RF) model and the climate-dependent exponential (Exp) model for all species combined and individual dominant tree species in Shangri-La. (a) All species combined; (b) P. densata; (c) P. asperata; (d) A. fabri; (e) Q. aquifolioides; (f) P. yunnanensis The dashed line represents the 1:1 line, while blue and red points and lines represent predictions from the RF and Exp models, respectively. R2 and RMSE values are provided for each model and species.
Forests 15 01622 g003
Figure 4. Spatial patterns and area statistics of forest age groups in Shangri-La city derived from the climate-dependent exponential model: (a) The overall forest age distribution classified into five groups: young, middle-aged, near-mature, mature, and overmature forests. The inset charts show the area proportions of different age groups for each dominant species; (bf) forest age distributions of the five dominant tree species: (b) P. densata, (c) P. asperata, (d) Q. aquifolioides, (e) A. fabri, (f) P. yunnanensis. The age thresholds and area statistics for each species are provided in Table 2.
Forests 15 01622 g004
Table 1. Fitted parameters of the climate-dependent tree height–age exponential relationship model for the dominant tree species in Shangri-La.
Dominant Tree Speciesa (SE)b (SE)c (SE)d (SE)R2RMSE
P. densata1.2186 (0.0898)
***
0.0038 (0.0010)
***
0.0126 (0.0028)
***
0.4711 (0.0260)
***
0.6392.0468
A. fabri1.4825 (0.2066)
***
0.0035 (0.0009)
***
0.0124 (0.0021)
***
0.4296 (0.0341)
***
0.42223.4209
P. asperata0.5321 (0.0471)
***
−0.0002 (0.0010)0.0084 (0.0029)
**
0.6788 (0.0278)
***
0.84212.7553
Q. aquifolioides0.9082 (0.1040)
***
−0.0009 (0.0007)0.0127 (0.0025)
***
0.4687 (0.0300)
***
0.48782.5242
P. yunnanensis1.4553 (0.1051)
***
−0.0040 (0.0013)
**
0.0133 (0.0023)
***
0.4973 (0.0210)
***
0.64451.8571
Note: ** p < 0.01, *** p < 0.001. SE: Standard Error; R2: Coefficient of determination; RMSE: Root Mean Square Error.
Table 2. Area statistics and classification criteria of forest age groups for the five dominant tree species in Shangri-La city based on the forest age mapping results obtained via the climate-dependent exponential model.
Tree SpeciesCategoryAge Group
YoungMiddle-AgedNear-MatureMatureOvermature
P. densataAge range (year)≤2021–3031–4041–60≥61
Area (km2)0.3764.32240.311625.0781073.927
Proportion (%)0.020.252.3135.8461.58
Q. aquifolioidesAge range (year)≤4041–6061–8081–120≥121
Area (km2)0.0360.46123.877746.536397.915
Proportion (%)0.000.042.0463.8734.04
A. fabriAge range (year)≤4041–6061–8081–120≥121
Area (km2)0.00720.979278.9931669.96293.208
Proportion (%)0.000.053.8781.7314.35
P. asperataAge range (year)≤4041–6061–8081–120≥121
Area (km2)2.92446.605156.52457.15994.442
Proportion (%)0.396.1520.6660.3412.47
P. yunnanensisAge range (year)≤2021–3031–4041–60≥61
Area (km2)NoneNone9.792571.209165.382
Proportion (%)NoneNone1.3176.5322.16
Disclaimer/Publisher’s Note: The statements, opinions and data contained in all publications are solely those of the individual author(s) and contributor(s) and not of MDPI and/or the editor(s). MDPI and/or the editor(s) disclaim responsibility for any injury to people or property resulting from any ideas, methods, instructions or products referred to in the content.

