Article

The Combined Effects of the Thermal Environment and Air Quality at Recreation Places on the Physiology and Psychology of People in Urban Parks

1
College of Architecture and Planning, Fujian University of Technology, Fuzhou 350108, China
2
Fujian Vocational College of Agriculture, Fuzhou 350002, China
3
College of Landscape Architecture and Art, Fujian Agriculture and Forestry University, 15 Shangxiadian Rd., Fuzhou 350000, China
*
Author to whom correspondence should be addressed.
These authors contributed equally to this work.
Forests 2024, 15(9), 1640; https://doi.org/10.3390/f15091640
Submission received: 1 September 2024 / Revised: 13 September 2024 / Accepted: 16 September 2024 / Published: 17 September 2024

Abstract

:
Urban forests, crucial to urban ecosystems, are increasingly threatened by the challenges of urbanization, such as deteriorating thermal environments and declining air quality. Despite their recognized benefits to city dwellers’ quality of life, a systematic understanding of the impact of these environmental factors on public psychophysiological well-being in recreational sites is a notable gap in the literature. The objective of this research was to bridge this gap by examining the effects of the thermal environment and air quality in urban forests on the public’s perception, offering scientific evidence to inform environmental optimization and health management strategies for urban parks, essential for sustainable urban development and public health. Three urban parks in Fuzhou, Fujian Province, namely Fuzhou National Forest Park, Xihu Park, and Jinniushan Sports Park, were selected as research sites. Environmental monitoring and questionnaire surveys were conducted at 24 recreation places from October to December 2020, collecting temperature, humidity, and wind speed; the atmospheric composition includes PM2.5, PM10, negative oxygen ion, and psychophysiological data from the public. Multivariate statistical methods were employed to assess the environmental characteristics of different recreation places types and their impact on public health. The findings reveal that environmental factors explained 1.9% to 11.8% of the variation in physiological and psychological responses, mainly influenced by temperature, wind speed, and negative oxygen ions. Forests and waterfront recreation places significantly outperform canopy and open recreation places in promoting mental invigoration, stress relief, emotional tranquility, and attention restoration. Environmental monitoring results indicate that favorable meteorological conditions and good air quality are crucial for enhancing the service functions of recreation places. Notably, the positive correlation between a negative air ion concentration and psychological well-being provides a novel perspective on understanding the health benefits of urban forests. The thermal environment and air quality of urban recreation places exert a significant influence on the psychophysiological status of the public. Increasing green coverage, improving water body environments, and rationally planning recreation places layout are of great theoretical and practical significance for enhancing the environmental quality and service functions of urban forests.

1. Introduction

Amidst the tide of global urbanization, urban forests stand as indispensable constituents of the urban ecosystem, fulfilling multiple roles such as providing recreational places [1,2], ameliorating the urban microclimate [3], and preserving biodiversity [4,5]. The development and stewardship of these parks are not only pivotal to the quality of life for urban dwellers [6] but also crucial to the realization of sustainable urban development [7,8]. However, while offering services to the public, urban forests are confronted with formidable challenges such as the deterioration of thermal environments [9] and the decline in air quality [10]. Urban forests play a crucial role in mitigating the adverse effects of global warming and urban heat island effects [11] on the thermal environment and air quality in urban areas. They lower urban temperatures and improve air quality by providing shade, releasing water, and filtering pollutants. Therefore, studying the impact of urban forests on the urban thermal environment and air quality is crucial for developing nature-based solutions to cope with the deteriorating environmental conditions in urban areas.
The urban forest’s thermal environment and air quality are pivotal to the physical and mental health of individuals frequenting these recreation places. Thermal comfort is directly linked to the body’s heat balance, influencing psychological states and behavioral choices [12,13], while the quality of air is integral to respiratory health; prolonged exposure to polluted air can escalate the risk of various diseases [14]. Consequently, the study of the impact of recreation places’ thermal environments and air quality on public health is of significant theoretical and practical importance for the optimization of urban forests design, enhancement of park services, and safeguarding of public health. The current research on the impact of urban forests on human well-being is relatively limited, often examining physiological or psychological effects in isolation. Our study bridges this gap by integrating both perspectives, exploring how thermal environments and air quality within these green spaces jointly affect physiological responses and psychological experiences. There is an urgent need for comprehensive scientific exploration of these knowledge areas to guide the development of urban forest environments in a way that fully supports public health.
The acceleration of urbanization has led to an exacerbation of the urban heat island effect (UHI), which has had negative impacts on human health and the urban environment [15]. Urban forests, as an effective strategy for mitigating UHI, have become a hot topic of research due to their cooling effects and contributions to the well-being of residents. Research indicates that urban forests typically exhibit lower mean land surface temperatures compared to the broader urban area. The cooling influence of these green spaces is found to extend approximately 300 m from their boundaries. The size of urban forests, vegetation coverage, and the Normalized Difference Vegetation Index (NDVI) are key factors affecting their cooling effects [16].
Through remote sensing technology and on-site monitoring, research has revealed the temperature regulation function of urban forests in different seasons and types [17]. Urban forests contribute to mitigating temperatures and enhancing the microclimatic environment, such as reducing concentrations of PM2.5 and ozone and increasing the relative humidity, providing a more comfortable living environment for residents [18]. Moreover, urban forests have a positive impact on the psychological well-being of residents, capable of reducing heat sensation and improving emotional states [19].
In terms of air quality, urban forests play a crucial role in mitigating air pollution and enhancing air quality [20]. Air pollutants such as PM2.5 and PM10, which are fine particulate matters detrimental to human health, can be effectively filtered and absorbed by vegetation. Some studies have elucidated the concentration distribution characteristics of air pollutants within urban environments, demonstrating that areas with dense vegetation typically exhibit lower levels of these pollutants [21]. Trees and plants in urban forests act as natural air purifiers, capturing airborne particles on their leaves and branches, thus reducing the overall pollutant load in the air [22]. Additionally, the presence of urban forests can promote air circulation, which helps disperse pollutants and improve air quality. However, some studies have indicated that the air quality in urban forests is influenced by surrounding traffic pollution, particularly in areas close to high-traffic roads [23]. This underscores the need for strategic planning in the placement of urban forests to maximize their air quality benefits.
Current research often focuses on the impact of a single environmental factor on health, lacking consideration of the combined effects of multiple factors. Urban forests are a complex ecosystem with a complex combination between thermal environment and air quality, and research on single factors alone may not fully reveal the impact on public health. Furthermore, much of the existing research employs qualitative methods such as questionnaires, lacking systematic quantitative monitoring and analysis, which makes it difficult to accurately assess the specific impacts of environmental factors on health. Additionally, current research often concentrates on the overall environmental characteristics of urban forests, neglecting the differences between various recreation places, which hampers the provision of guidance for refined management of these sites.
This study systematically investigates the characteristics of the thermal environment and air quality in urban forests recreation places and the impact of these environmental factors on public physiological and psychological health. The main objectives of this study are as follows:
(1)
The relationship between thermal environmental parameters, public physiological and psychological indicators, and their impact on health;
(2)
The relationship between air quality indicators, public physiological and psychological indicators, and their impact on health;
(3)
How the thermal environment and air quality of urban forest recreation places comprehensively influence the physiological ease and psychological health of the people.

2. Materials and Methods

2.1. Study Site Overview

This research concentrates on Fuzhou, the capital city of Fujian Province in southeast China, recognized as a historic and cultural metropolis and a pivotal economic hub. Known for its scenic beauty and rich forest tourism assets, Fuzhou boasts a humid subtropical climate, featuring year-round verdure, substantial sunlight, and significant precipitation [24]. Characterized by a brief winter and an extended summer, the city has a frost-free period of 326 days annually. It receives an annual sunlight exposure of 1700 to 1980 h and an annual rainfall of 900 to 2100 mm. The mean temperature in Fuzhou is approximately 20–25 °C, with December marking the coldest month at 6–10 °C, and July and August being the warmest, with temperatures averaging 33–37 °C. Temperature variations can range from 2.5 to 42.3 °C throughout the year. The city maintains an average relative humidity of about 77%.
The distinctive urban heat island effect, attributed to Fuzhou’s basin topography, coupled with the pivotal function of urban forests in modulating the microclimate and enhancing thermal comfort and air quality, results in a diverse microclimatic landscape within the city. This heterogeneity needed to be considered in the study design as it was crucial to choose the right season and sites to study. First, geographical location and types of recreational areas were considered. Information on park area, shape, vegetation composition, number of visitors, accessibility, and recreational facilities were used to select parks that represented the urban forests in Fuzhou. Based on these attributes, three different types of parks were selected as the study sites: Jinniushan Sports Park, Fuzhou National Forest Park, and Xihu Park.
In Jinniushan Park, Canarium album, Dimocarpus longan, and Phyllostachys sulphurea are the dominant tree species. In Fuzhou National Forest Park, trees like Ficus microcarpa, Archontophoenix alexandrae, and Bauhinia blakeana are the primary ones. In Fuzhou Xihu Park, there are many Osmanthus fragrans, Prunus persica, Lagerstroemia indica, and Salix matsudana Koidz planted. The selection of these parks is based on their diversity in type, function, and visitor experience, which enable us to provide a comprehensive perspective on the impact of urban trees on public health. The specific locations of the parks are shown in detail in Figure 1.

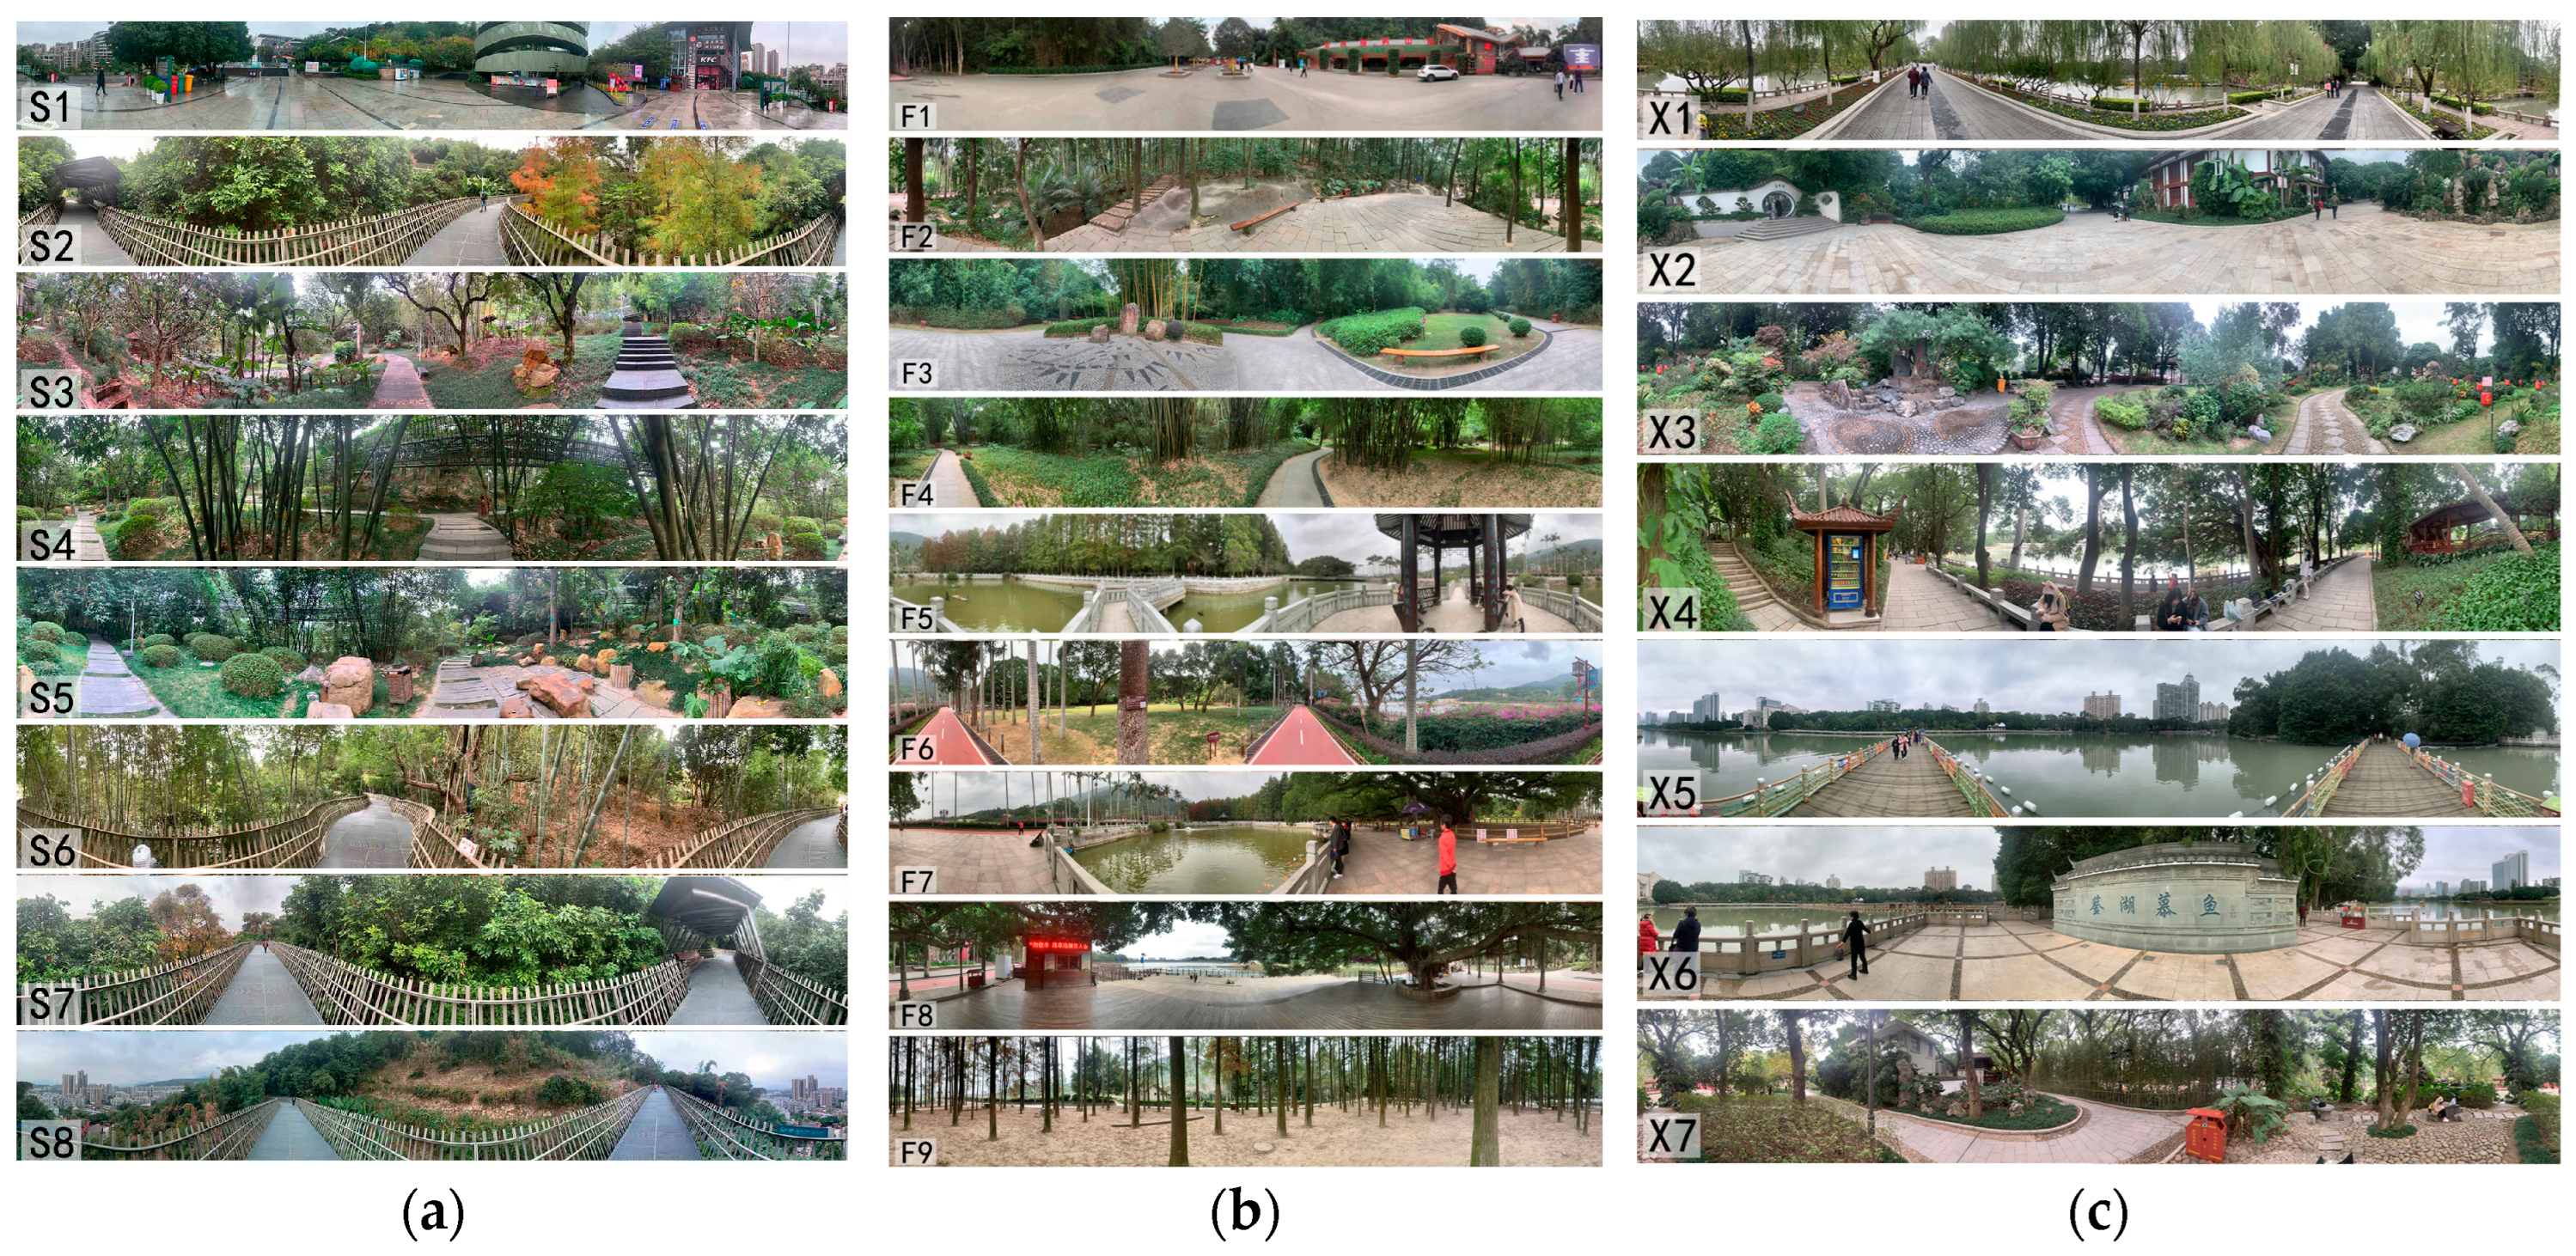
2.2. Sample Sites Setting

In this study, we conducted an in-depth investigation of three urban parks in Fuzhou City and selected 24 sample sites for intensive research, as shown in Figure 2 and Figure 3. Within the study, Jinniushan Sports Park encompasses eight designated sample locations, identified as S1 through S8; Fuzhou National Forest Park features nine such sites, denoted by F1 through F9; and Xihu Park comprises seven sites, marked X1 through X7.
These 24 sample sites were categorized into four major types based on their environmental characteristics. The specific classification is shown in detail in Table 1.
The spatial characteristics within urban parks were categorized based on a pre-experimental survey of 60 scenes. A clustering analysis was conducted using quantitative analysis indicators of scene elements, resulting in four clusters. These are defined as follows:
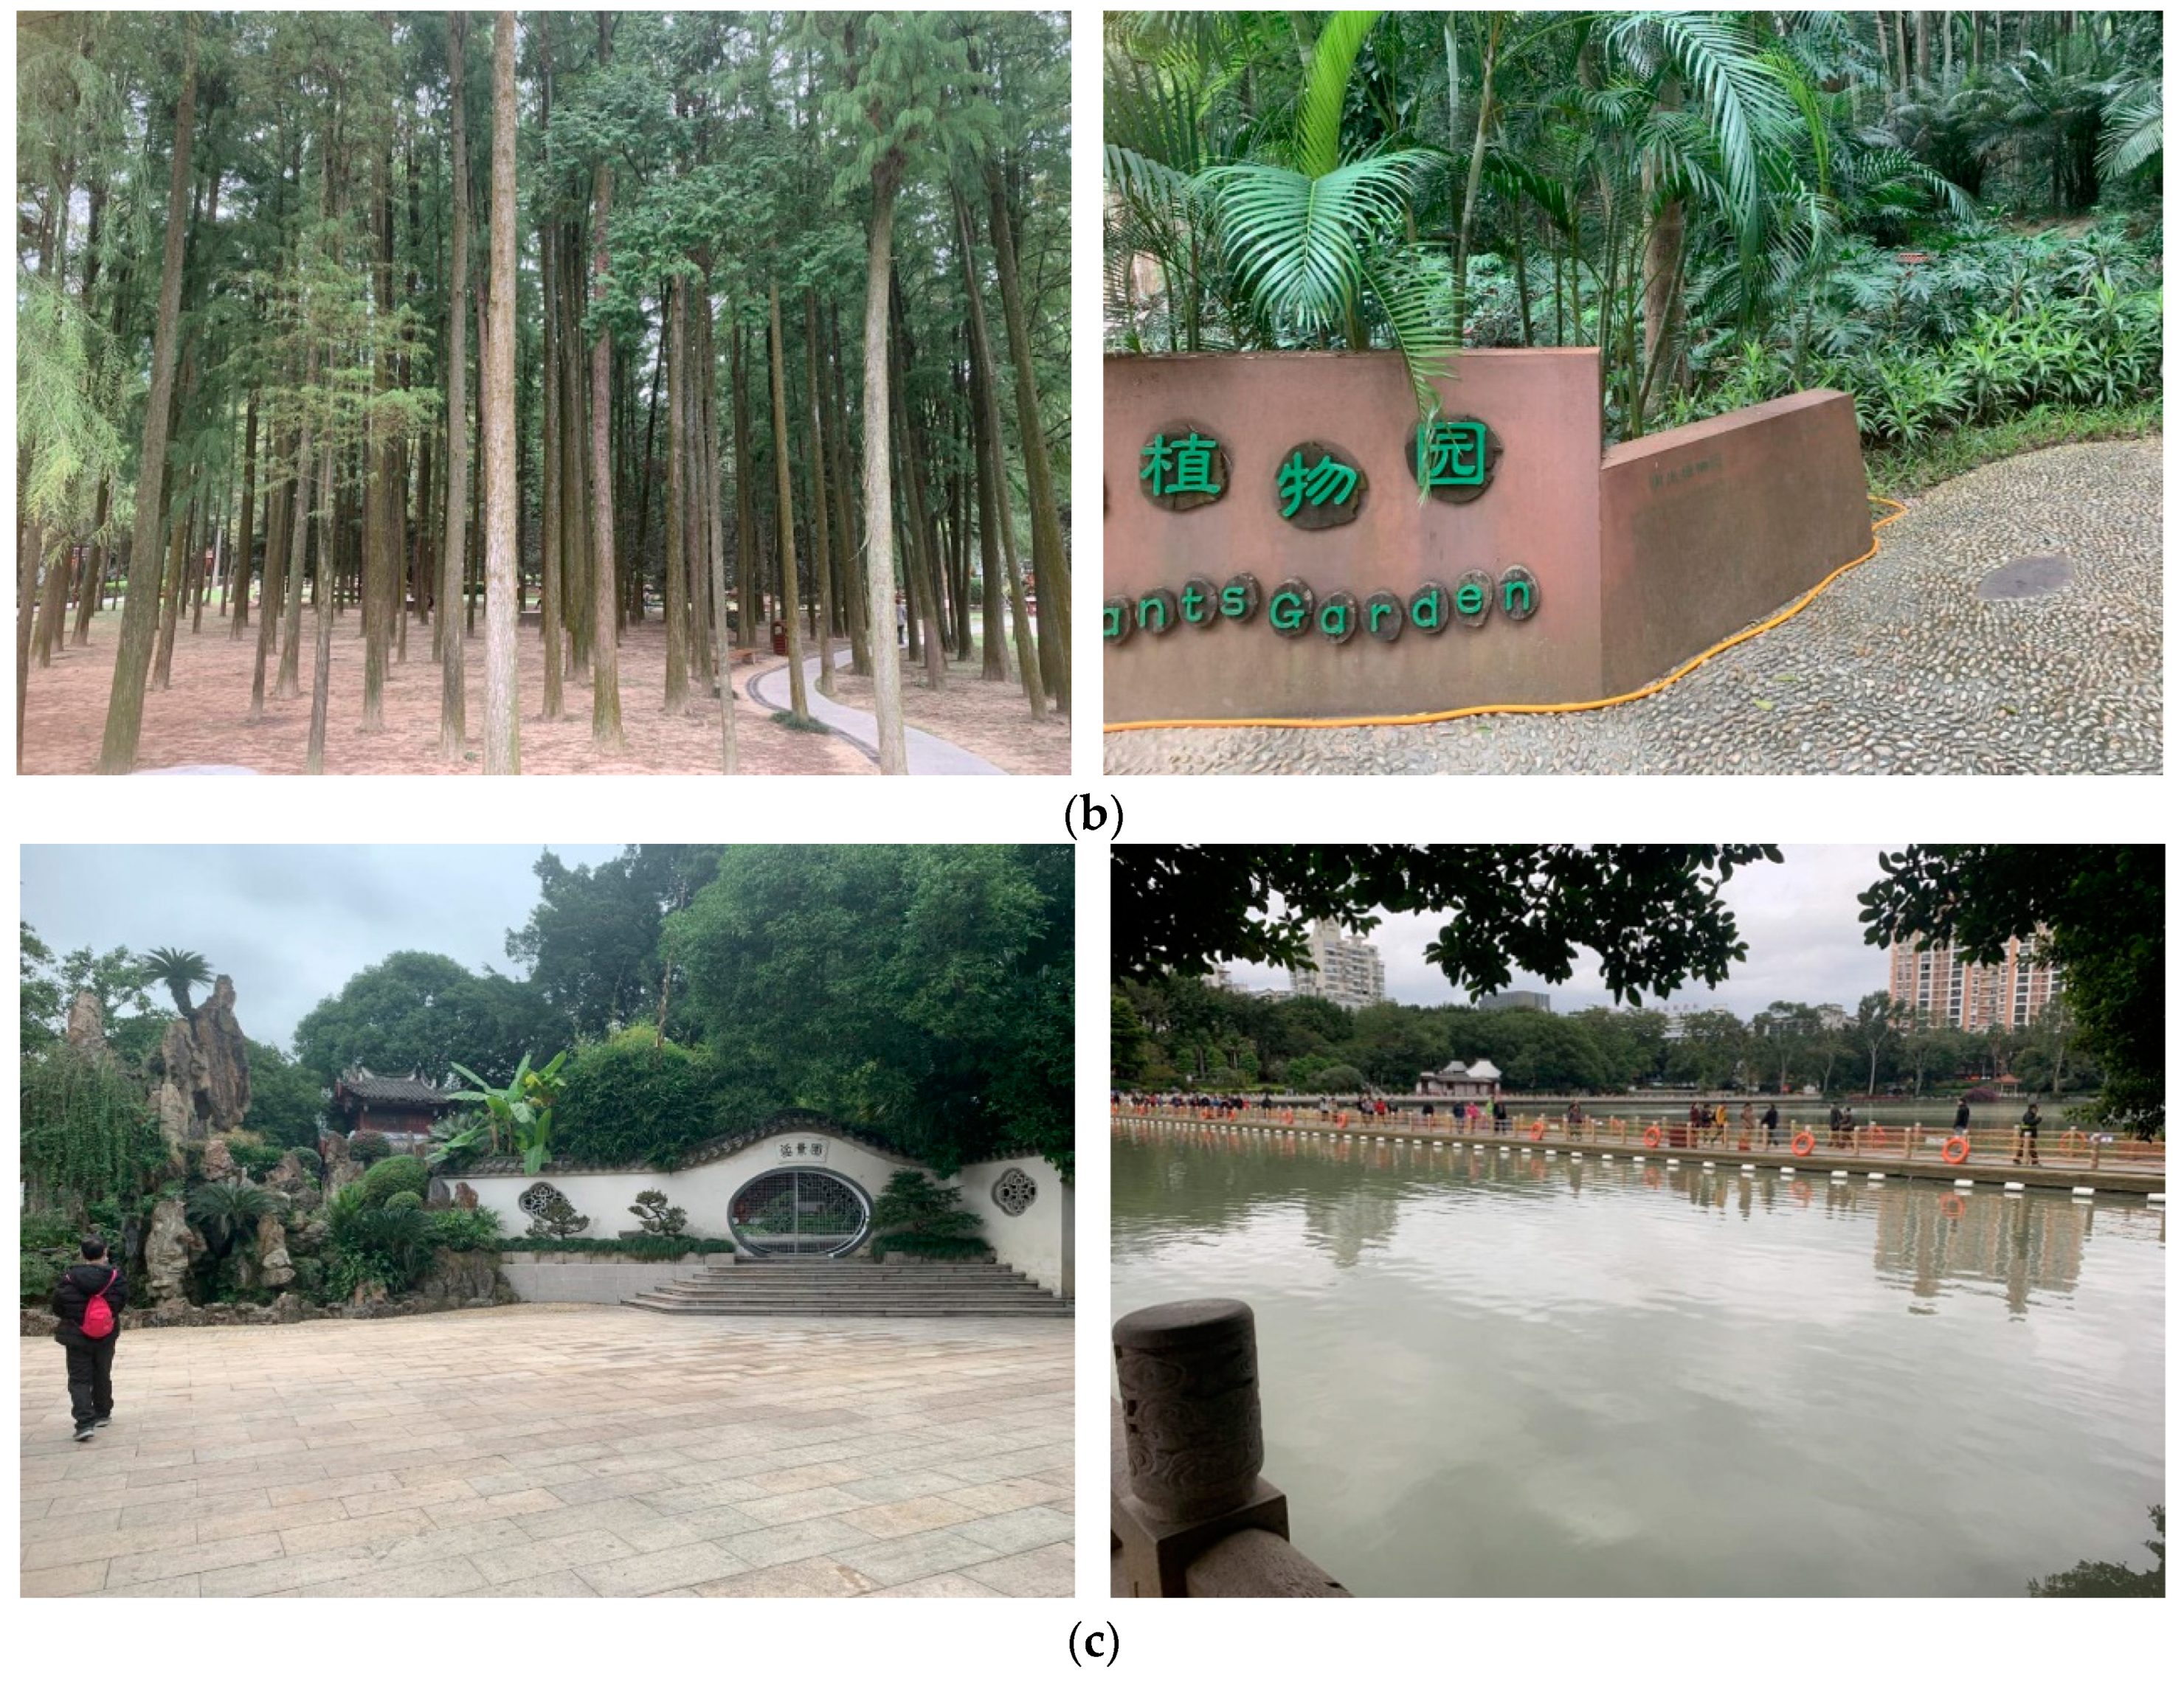
  • A type with a high green view rate and a large proportion of site area, which, through expert scene judgment, is defined as open recreation places: these are open and spacious recreational spaces within urban parks, such as recreational platforms and squares;
  • Park spaces with a high green view rate and narrow lines of sight, which are defined as forest recreation places: these are the wooded recreational areas within urban parks;
  • Spaces that are relatively open with the presence of large water bodies are defined as waterfront recreation places. The classification is based on the type of urban park;
  • A cluster with relatively high values of spatial elements, which, through scene judgment, is defined as canopy recreation places: scenes that are located at the canopy level or on the top or mid-levels of mountain parks, where the viewing points are above the canopy with a broad range of visibility.

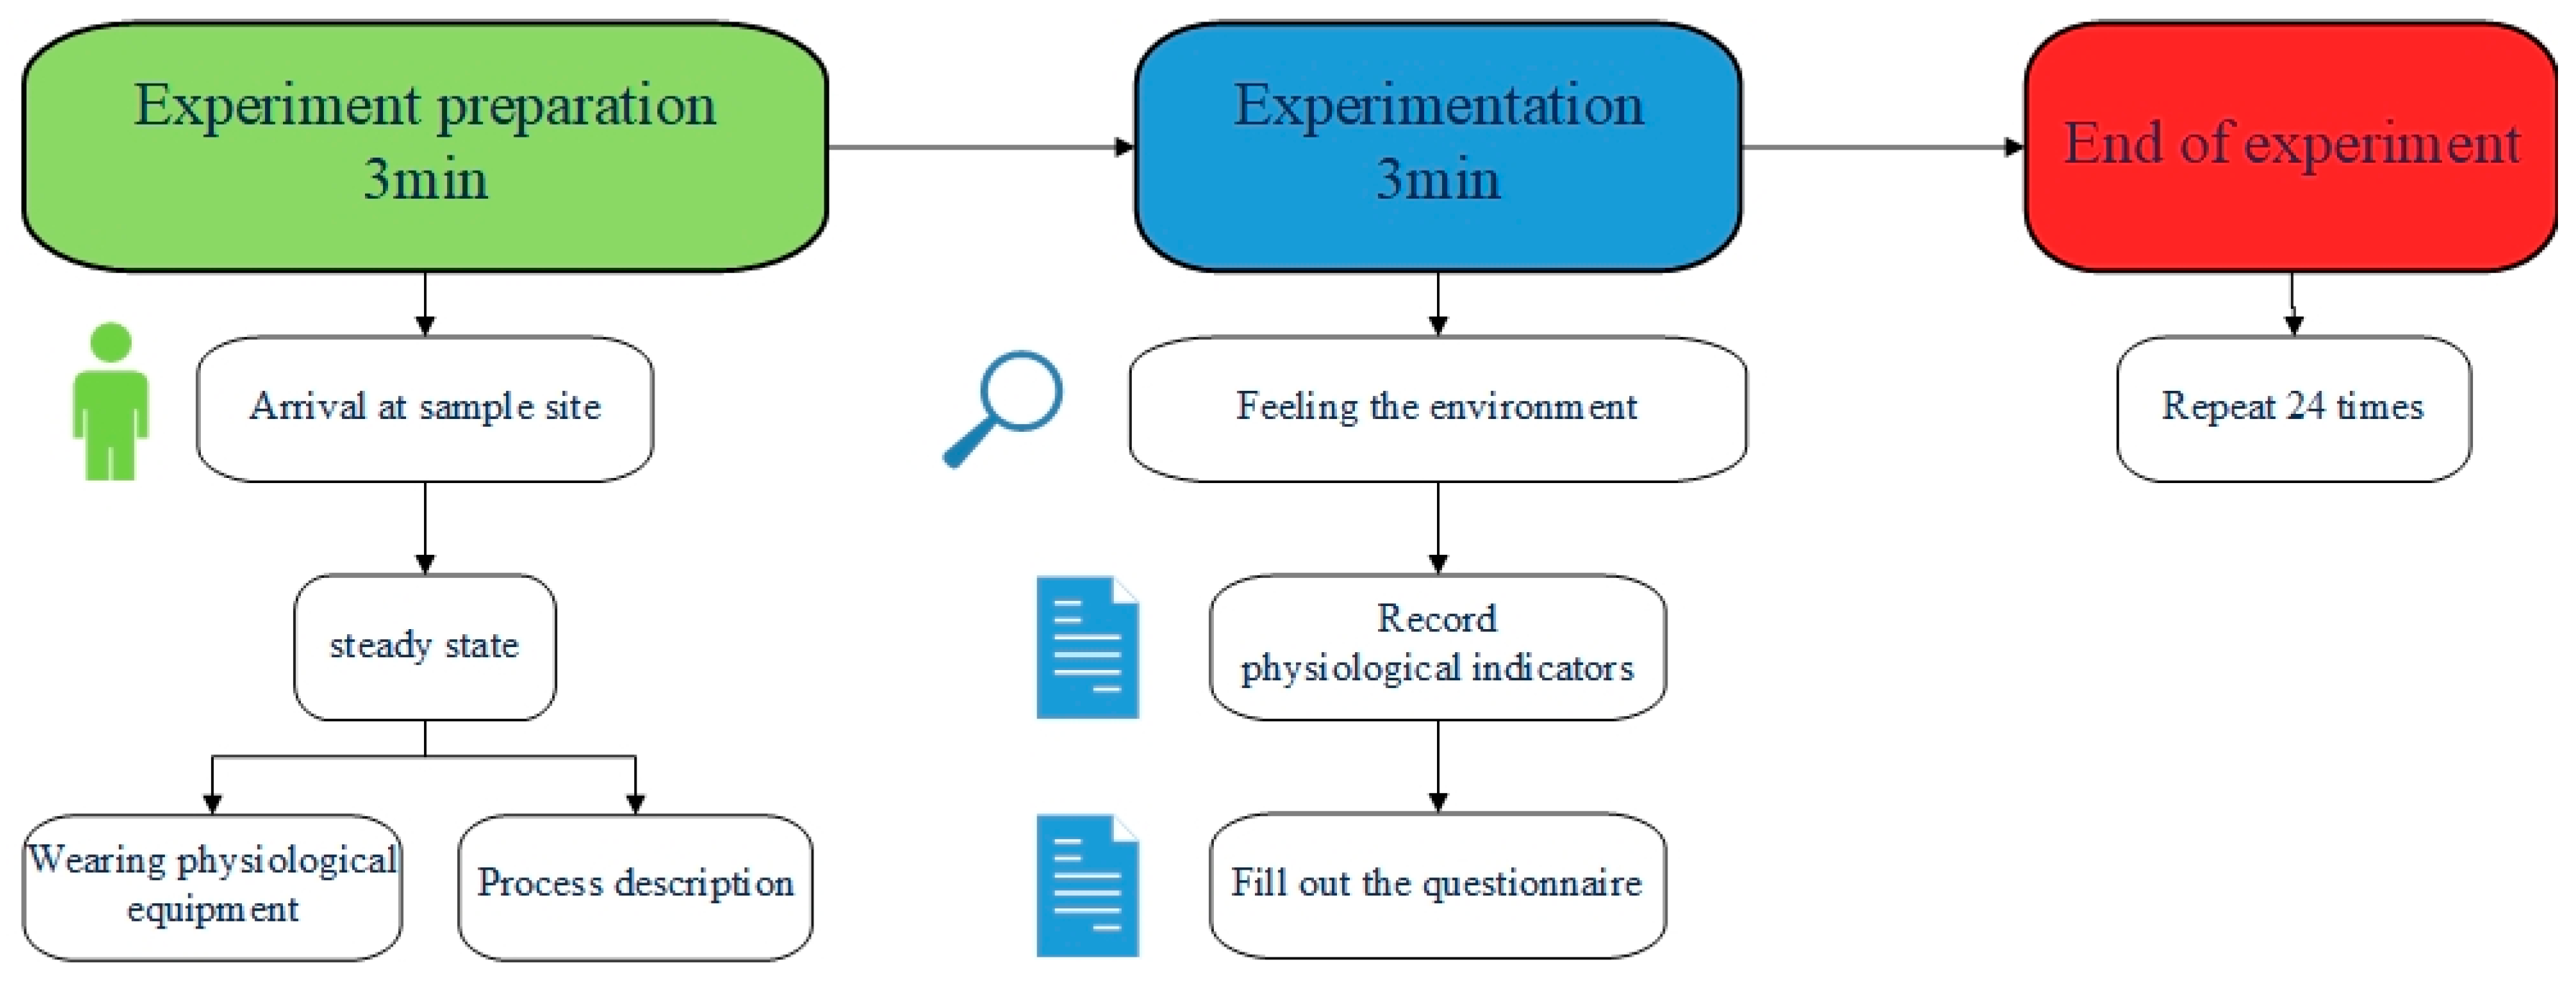
2.3. Overall Experimental Design

This research endeavors to assess the influence of the thermal and air quality conditions in Fuzhou City’s urban park forests on the physiological and psychological well-being of visitors, aiming to uncover the sensory and operational dynamics of urban green spaces. For this purpose, three municipal parks with a total of 24 key sampling sites were selected for the study. The investigation integrates the assessment of thermal conditions and air quality with synchronous tracking of visitors’ physiological responses and survey-based data to provide a holistic view of the urban forest’s impact on sensory perception.

2.4. Environmental Quality Monitoring Method

The selection of monitoring equipment and sensors was predicated on a rigorous set of criteria designed to ensure the highest standard of data collection for our study. The decision-making process encompassed the following parameters:
  • Accuracy and Precision: We meticulously chose devices that boast high levels of accuracy and precision, ensuring that the measurements correspond closely with the actual environmental conditions;
  • Sensitivity and Response Time: Our sensors were selected for their sensitivity to minute environmental changes and rapid response times, allowing for the precise capture of dynamic variations within the urban forest microclimate;
  • Ease of Calibration and Maintenance: We favored equipment that requires infrequent calibration and minimal maintenance, thereby reducing the potential for human error and ensuring uninterrupted data collection;
  • Environmental Durability: Considering the outdoor setting of our study, the equipment’s resilience to environmental factors such as temperature fluctuations and humidity was a mandatory criterion;
  • User-friendliness: The operability of the devices was also taken into account, with a preference for those that offer an intuitive user interface to facilitate ease of use by research personnel.
In this study, we employed advanced sensor technology provided by Weihai Jinghe Digital Mine Technology Co., Ltd. (Weihai, China). to conduct meticulous data monitoring of a series of key environmental parameters. The monitored data encompassed meteorological factors (such as temperature, relative humidity, wind speed, and barometric pressure) and environmental quality indicators including air anion concentration and oxygen content. Furthermore, we measured illuminance, ultraviolet radiation, and noise levels, and calculated the environmental comfort index based on these measurements. The specific monitoring parameters are detailed in Table 2. To enhance the accuracy of the data, we specifically procured an AIC2000 air anion concentration detector manufactured in the United States for in-depth monitoring of selected sample sites.
Fuzhou experiences frequent rainy days in spring, hot summers, and cold winters. To avoid the impact of extreme weather on the experiment, the experiment will be conducted in autumn. Specifically, the experiment took place from October to December in 2020, while avoiding special weather conditions such as rain, heavy fog, typhoons, pollution, and others, covering three major urban parks: Fuzhou National Forest Park, Xihu Park, and Jinniushan Sports Park. Within each park, 24 monitoring points were established to ensure the representativeness and comprehensiveness of the data. Monitoring commenced at 7:00 AM and concluded at 7:00 PM each day. To ensure consistency and accuracy in measurements, all sensors were placed horizontally at a height of 1.5 m above the ground. Data readings were taken at a frequency of once every 2 h, with three consecutive readings taken each time and the average value recorded as the final entry.
In addition, we utilized the Jinghe Cloud Integrated Mobile Meteorological Station to continuously measure temperature (°C), relative humidity (%), and wind speed (m/s). Each measurement lasted for 3 min, with readings recorded every minute during that period to ensure the continuity and stability of the collected data.
Through this comprehensive and systematic data monitoring approach, we were able to obtain accurate and reliable information on the environmental quality of urban trees, providing a solid data foundation for further analysis and research.

2.5. Measurement of Physiological Data from the Public

Physiological and psychological metrics are essential in gauging individuals’ emotional states [25]. Key physiological indicators such as electrodermal activity (EDA), heart rate (HR), and respiratory rate are significant for assessing the degree of physiological arousal [26]. However, these markers, while indicative of arousal, are not always precise in differentiating among specific emotional states. Studies have noted [27] that these indicators predominantly reflect a general state of physiological activation and do not unequivocally disclose the nature of the emotions being experienced.
In general physiological terms, EDA tends to increase when an individual is tense [28]. HR is a measure of the number of times the heart beats per minute, typically expressed in beats per minute (bpm). It is a key physiological parameter for assessing an individual’s state of physiological arousal and stress level [29]. In adults, resting HR normally ranges from 60 to 100 bpm [27,30], although athletes have lower HR [31]. HR is one of the physiological indicators of the body’s response to activity or stress. During physical activity or stress, HR increases to meet oxygen and energy demands [32]. Emotional tension also influences HR; the release of adrenaline during stress increases HR and blood pressure [33].
HR is not constant and naturally fluctuates with physiological processes such as breathing [34]. Heart rate variability (HRV) refers to the variation in the time intervals between normal heartbeats and is an important indicator of autonomic nervous system activity [35]. High HRV is usually associated with good cardiac function and lower stress levels, while low HRV may indicate increased stress or impaired cardiac function. The low-frequency (LF) component of HRV is typically linked to the activity of the sympathetic nervous system, whereas the high-frequency (HF) component is associated with the parasympathetic nervous system [36]. The LF/HF ratio, representing the proportion of LF to HF in HRV, serves as an indicator of the fluctuating dynamics between sympathetic and parasympathetic nervous system activities [37]. When an individual encounters environmental or internal stimuli, the central nervous system coordinates the activities of the sympathetic and parasympathetic nerves to regulate HR changes and maintain physiological balance. Under nervous or anxious emotions, the sympathetic nerves are dominant, leading to increased stress levels and LF/HF ratio. Conversely, in a relaxed state, the parasympathetic nerves are dominant, and the LF/HF ratio decreases. Accordingly, shifts in the LF/HF ratio can effectively signal an individual’s psychological condition, reflecting alterations in tension, relaxation, or comfort levels [38]. In addition, HRV analysis, particularly the LF and HF components, holds significant applications in emotional research [39,40]. It offers insights into the balance between sympathetic and parasympathetic nervous system activities. By understanding these components, researchers can explore areas such as stress, anxiety, and psychopathology [41]. Moreover, HRV analysis finds use in biofeedback and interventions, aiding the development of effective strategies for stress management and mental health improvement [42].
EDA signals exhibit significant variations in response to emotional changes, making them a valuable tool for examining individuals’ reactions to emotionally stimulating environments or stimuli [43]. In the presence of environmental stressors, skin conductance demonstrates sensitive fluctuations, establishing it as an effective indicator of emotional shifts. As emotional intensity increases, physiological reactions such as vasodilation and increased sweat gland secretion occur, leading to decreased skin resistance and increased skin conductance. When emotions stabilize, sweat gland secretion decreases, skin resistance increases, and skin conductance decreases accordingly [44].
In view of this, this experiment monitored physiological indicators such as participants’ EDA, HR, and HRV. To minimize external influences, participants maintained a stationary position while observing the surrounding scenery, thereby enabling a more precise measurement of their physiological and psychological reactions.

2.6. Questionnaire Survey

According to the World Health Organization (WHO), mental health is defined as a state of well-being in which the individual realizes his or her own abilities, can cope with the normal stresses of life, can work productively and fruitfully, and is able to make a contribution to his or her community [45]. The objective of this study is to assess the effects of perception on mental well-being, utilizing spiritual vitality, stress relief, emotional arousal, and attention recovery as key metrics for evaluating mental health.
The questionnaire survey comprised two primary sections. The initial section concentrated on personal background, such as gender, age, stress level, professional background, and the frequency of urban park visits. The subsequent section pertained to the assessment of tourists’ psychological indicators, drawing upon the research of several scholars [46,47]. It employed a 7-point Likert scale to formulate questionnaire items and implemented a quantitative evaluation with 7 serving as the maximum score. Table 3 introduces the significance of the corresponding psychological indicators. By employing this structured questionnaire design, the study sought to thoroughly investigate the precise effects of landscape perception on individuals’ mental health, aiming to offer a scientific foundation for future urban planning and environmental design endeavors.

2.7. Subjects

In the realm of environmental stimuli research, it is imperative to ensure the representativeness of participants and the adequacy of sample size to enhance the scientific rigor and generalizability of findings. Kaplan et al. [52] have emphasized that the college student population can yield highly scientific and representative data for such studies. Consequently, this investigation utilized G*Power 3.1.9.7 to perform a meticulous power analysis, thereby determining an appropriate sample size and guaranteeing that the experiment possesses sufficient statistical power.
Utilizing G*Power software, we calculated the minimum sample size necessary based on the specified effect size, α level (commonly set at 0.05, representing the significance level), and statistical power (typically 0.80 or above). In light of these computations, we chose 77 university students from diverse majors as our experimental subjects. This sample size not only fulfills the criteria for statistical power but also adequately represents a broader spectrum of the young adult population.
In the current study, the participant age demographic was defined as below 30 years of age, with an average age of 23.4 years. This age criterion was meticulously selected to ensure homogeneity in cognitive and perceptual performance, thereby mitigating the confounding effects of age-related cognitive variability on our experimental outcomes.
During the participant selection process, rigorous exclusion criteria were implemented. Individuals with a history of significant physical or mental trauma, major surgeries, or chronic ailments such as cardiovascular disease and hypertension were intentionally omitted from the study group. This measure was taken to prevent their health conditions from potentially skewing the experimental outcomes. The reasoning behind these exclusions is multifaceted:
  • Physiological Consistency: By focusing on a younger adult population, we aimed to achieve a more uniform baseline of physiological responsiveness, which is less likely to be complicated by age-related health issues;
  • Health Bias Mitigation: The exclusion of participants with chronic health conditions was essential to prevent potential biases that could skew the interpretation of the effects of the urban forest environments on physiological and psychological well-being;
  • Complex Health Variable Elimination: Chronic illnesses and their associated treatments can introduce a myriad of health variables that may interact with the environmental factors under investigation, thereby obfuscating the study’s findings;
  • Enhanced Feasibility: Targeting a younger, healthier demographic also enhanced the feasibility of the study, as this group is generally more accessible and willing to participate in research endeavors;
  • Broader Generalizability: By eliminating individuals who might exhibit atypical responses due to health conditions, the generalizability of our findings to a similar young adult population is strengthened.

2.8. Experimental Procedure

The experiment was carried out in three parks within Fuzhou City: Jinniushan Sports Park, Fuzhou National Forest Park, and Fuzhou Xihu Park, spanning a duration of 7–14 days from October to December 2020 to ensure data consistency. The experimental sessions were scheduled daily from 7:00 AM to 7:00 PM to encompass various times of the day. Each day, 3–5 participants were invited to take part in the experiment, with the observation time for each individual in each park being limited to between 1.5 and 3 h.
Prior to the commencement of the experiment, the project leader provided comprehensive, in-person instructions to the 77 participants. This included an introduction to the fundamental concepts of thermal environment and air quality, the objectives and significance of the study, and a detailed explanation of how to complete the questionnaire, elucidating the meaning of each question and response option. Following these instructions, the research team escorted the participants to 24 predetermined sample sites for the measurement of their physiological indicators.
During the specific physiological indicator detection experiment, participants were fitted with calibrated physiological monitoring devices and instructed to avoid talking, eating, or drinking while experiencing the environment at the observation site for a duration of 3 min. This measure was taken to minimize artificial interference during the experiment. The experimenters were tasked with the real-time recording of participants’ physiological indicator data. Following each site visit, participants completed the pertinent questionnaire survey. A detailed illustration of the experimental procedure is provided in the attached Figure 4.

2.9. Analytical Methods

In this study, ANOVA was employed to assess the variability among different parks and recreational areas. To delve into the relationship between the audiovisual environmental elements present in the scene and the physiological and psychological perception responses of the subjects towards the studied scene, and to uncover their potential associations, stepwise regression analysis was conducted on the data. This analysis aimed to investigate whether correlations exist between these elements and to determine the strength and direction of such correlations, thereby facilitating a deeper understanding of the impact of the combined audiovisual effect on public response.

3. Results

3.1. Base Environmental Conditions

The researchers conducted sensory experiments in 24 sample sites according to a predetermined plan. Table 4 shows the thermal environment and air quality data obtained through the equipment used in the above 24 sample sites. Temperatures were recorded between 18 and 22 °C, which is usually considered to be the range of temperatures that the human body feels comfortable with.
Jinniushan Sports Park boasts a generally favorable thermal environment and air quality. For instance, at the S4 sampling site, the wind speed is as low as 0.05 m/s, contributing to a tranquil leisure environment. Concurrently, the site records a high negative oxygen ion concentration of 3.71 ions/cm3, considered a healthy level that potentially benefits physiological and psychological well-being. These conditions collectively foster a comfortable leisure environment where visitors can unwind amidst natural surroundings.
The air quality in Fuzhou National Forest Park was generally good, but the wind speed was slightly higher, e.g., 0.08 m/s at sample point F2. In addition, negative ion concentrations varied significantly in different areas, ranging from 4.20 ions/cm3 at sample point F8 to 2.41 ions/cm3 at sample point F3. This variation may mean that visitors’ experience will vary in different areas of the park, some of which may provide fresher air and greater comfort due to higher negative ion concentrations.
The air quality in Xihu Park is relatively poor, which is mainly reflected in the high readings of PM2.5 and PM10, such as 44.80 μg/m3 for PM2.5 and 45.64 μg/m3 for PM10 at sample point X5. These data indicate that the surrounding environmental factors negatively affect the air quality of the park due to its location in the city center. However, the park has a high humidity, above 62%, which may be related to the characteristics of its water bodies, providing some climate regulation to the park.

3.2. Effect of Thermal Environment and Air Quality on Public Physiological Indicators

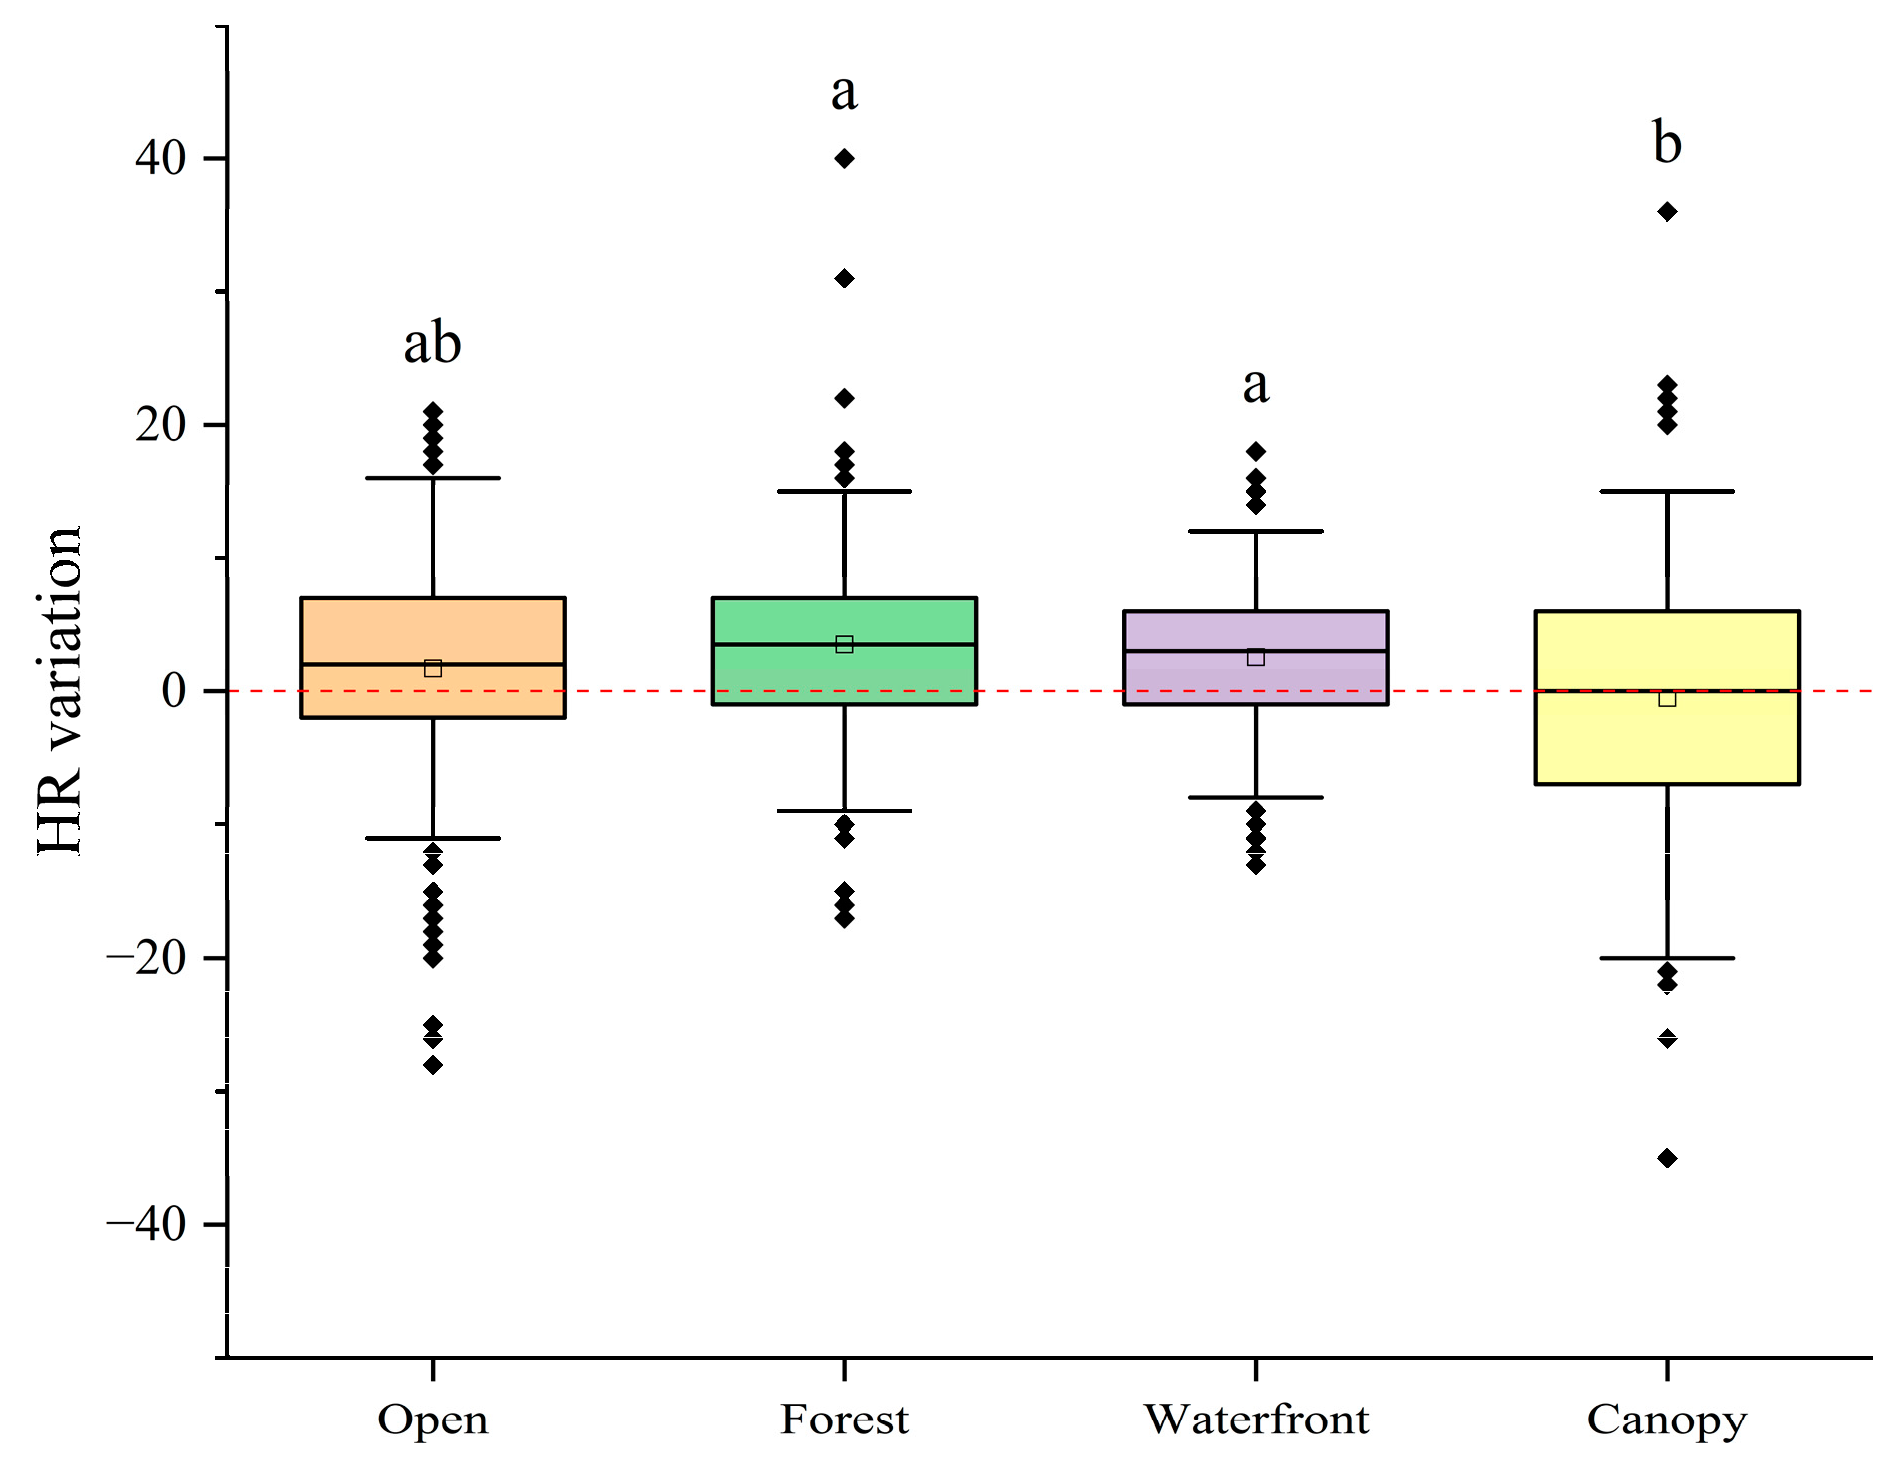
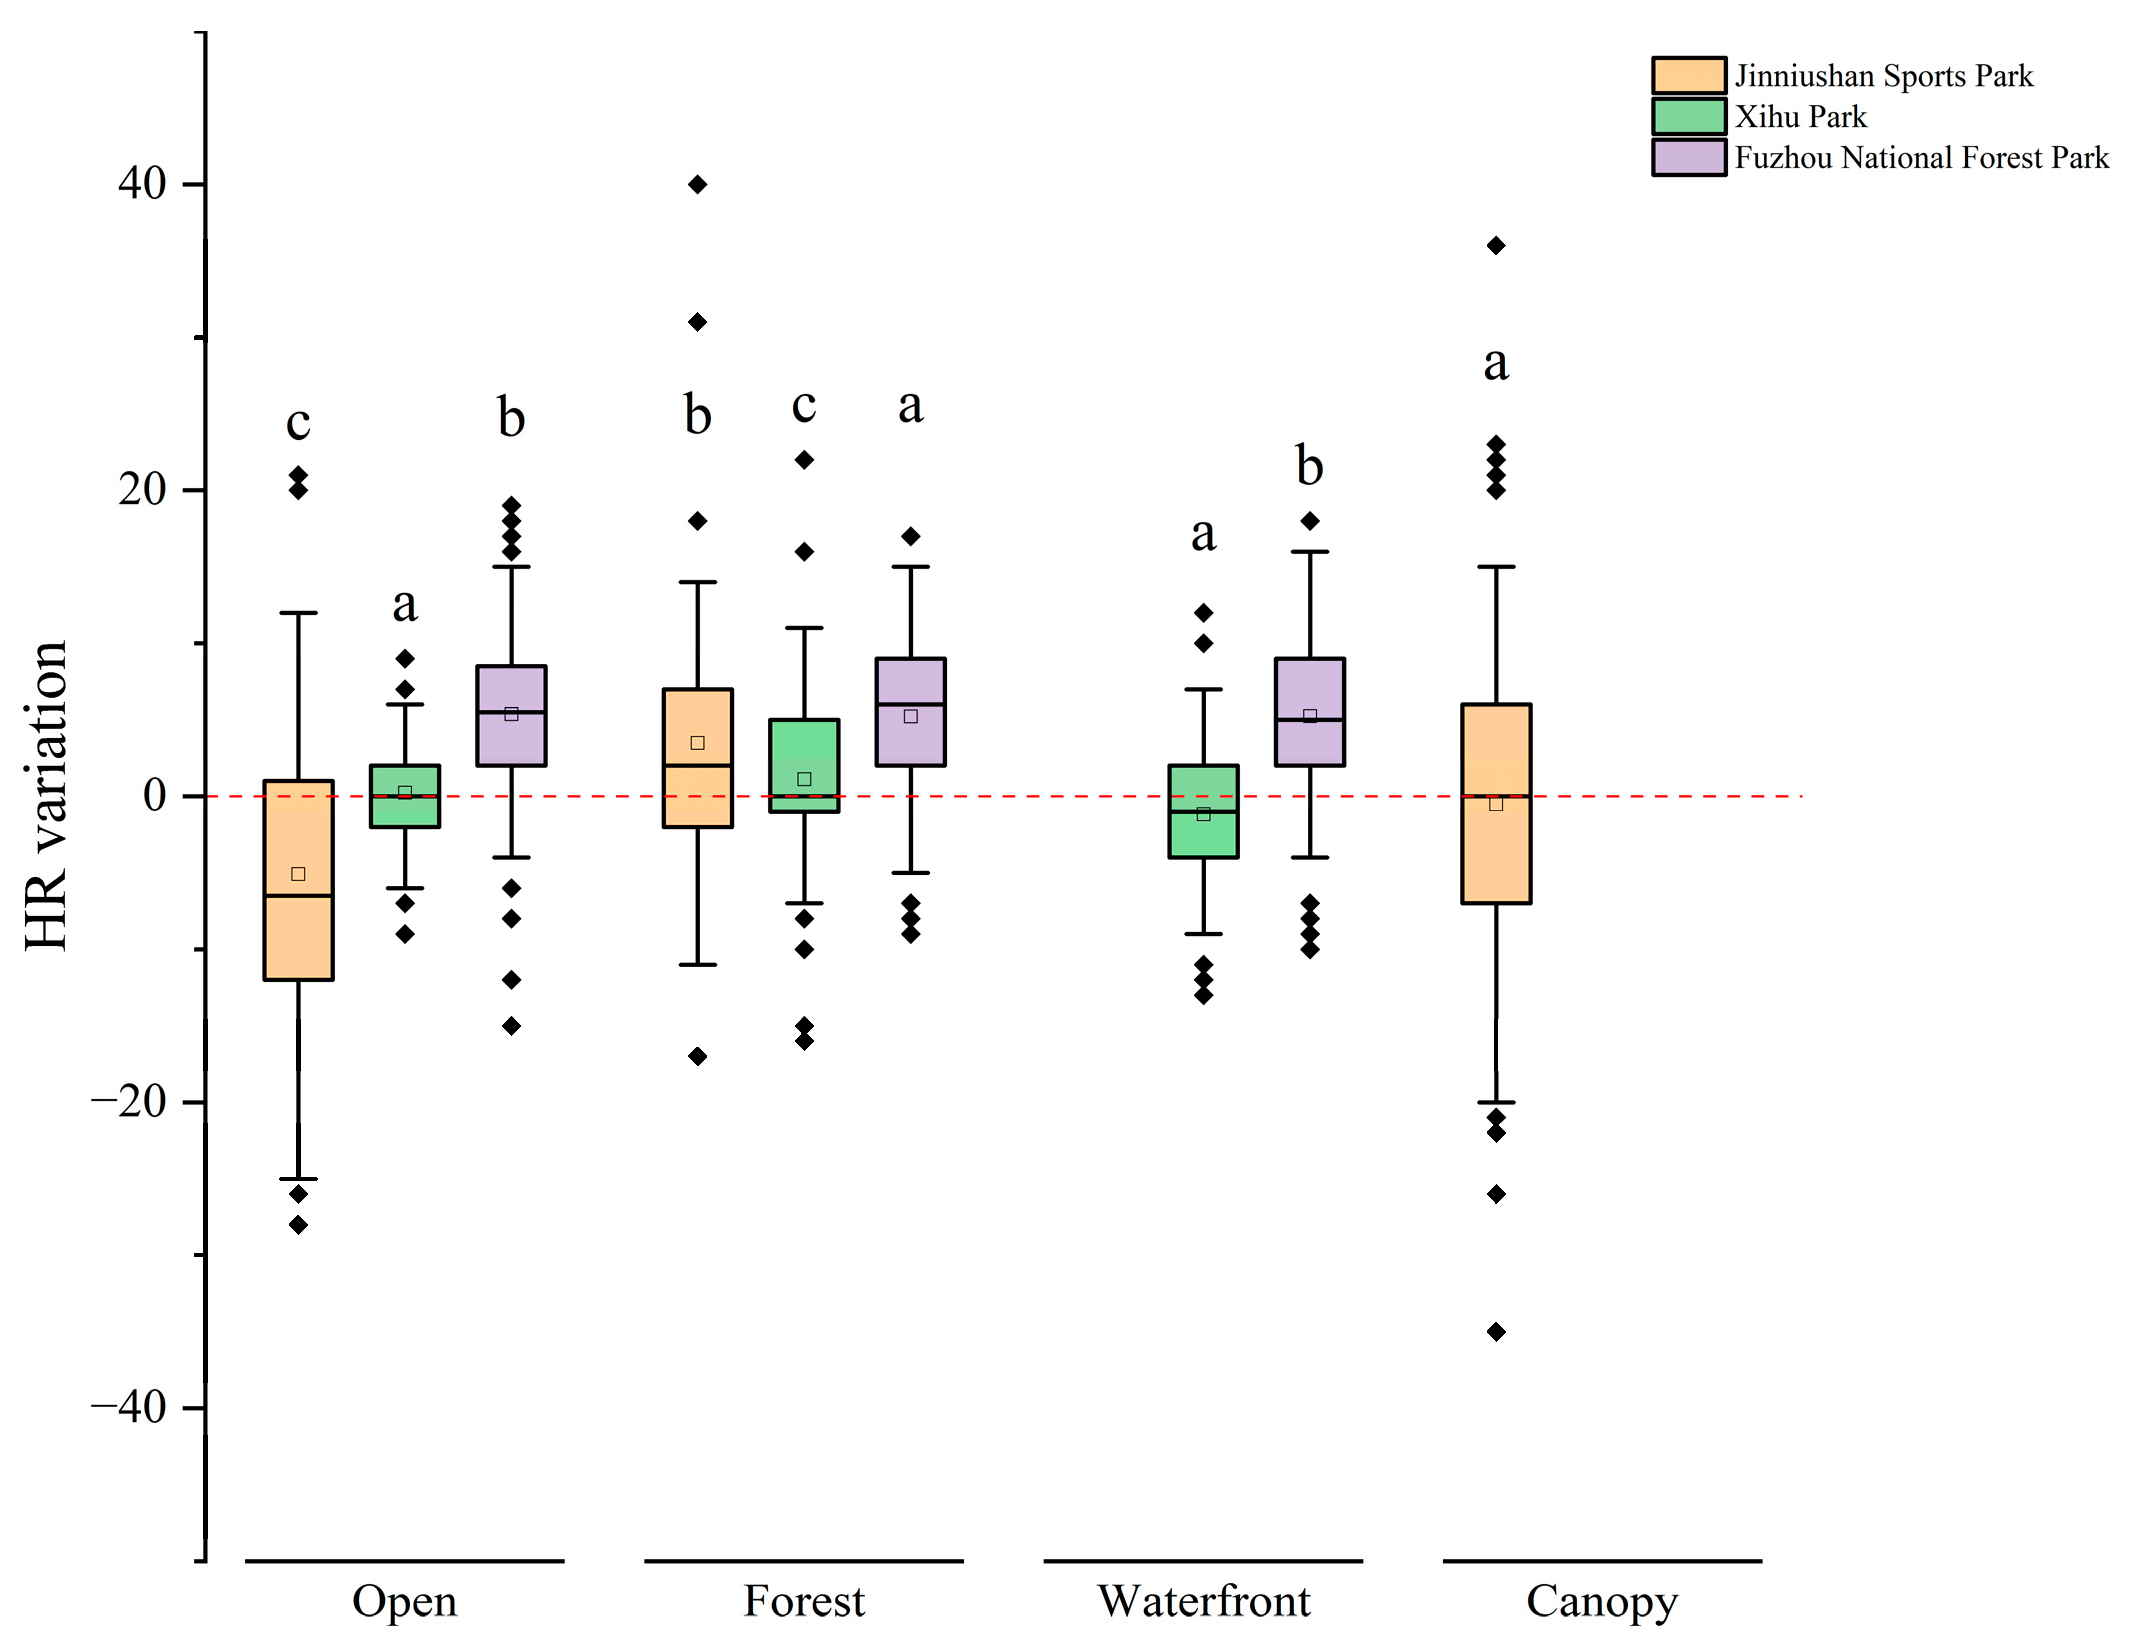
3.2.1. Effects on HR

The impact of different types of recreation places on HR variability, a progressive decrease in HR variation reduction was observed, with the sequence being from forests to waterfronts, open spaces, and canopies (Figure 5). The results showed that there were significant differences in HR changes between forest and canopy places and other places, indicating that these places had unique effects on reducing or increasing HR. Within the canopy environment, improved air quality coupled with an immersive natural experience contributed to profound relaxation, resulting in a reduction in HR.
On the effect of different recreation places in different park types on HR variability, the results showed that there were significant differences in the effects of different places in different park types on HR (Figure 6). For example, in open recreation places, the effects of different parks on heart rate were different, and only the HR in Jinniushan Sports Park changes negatively.

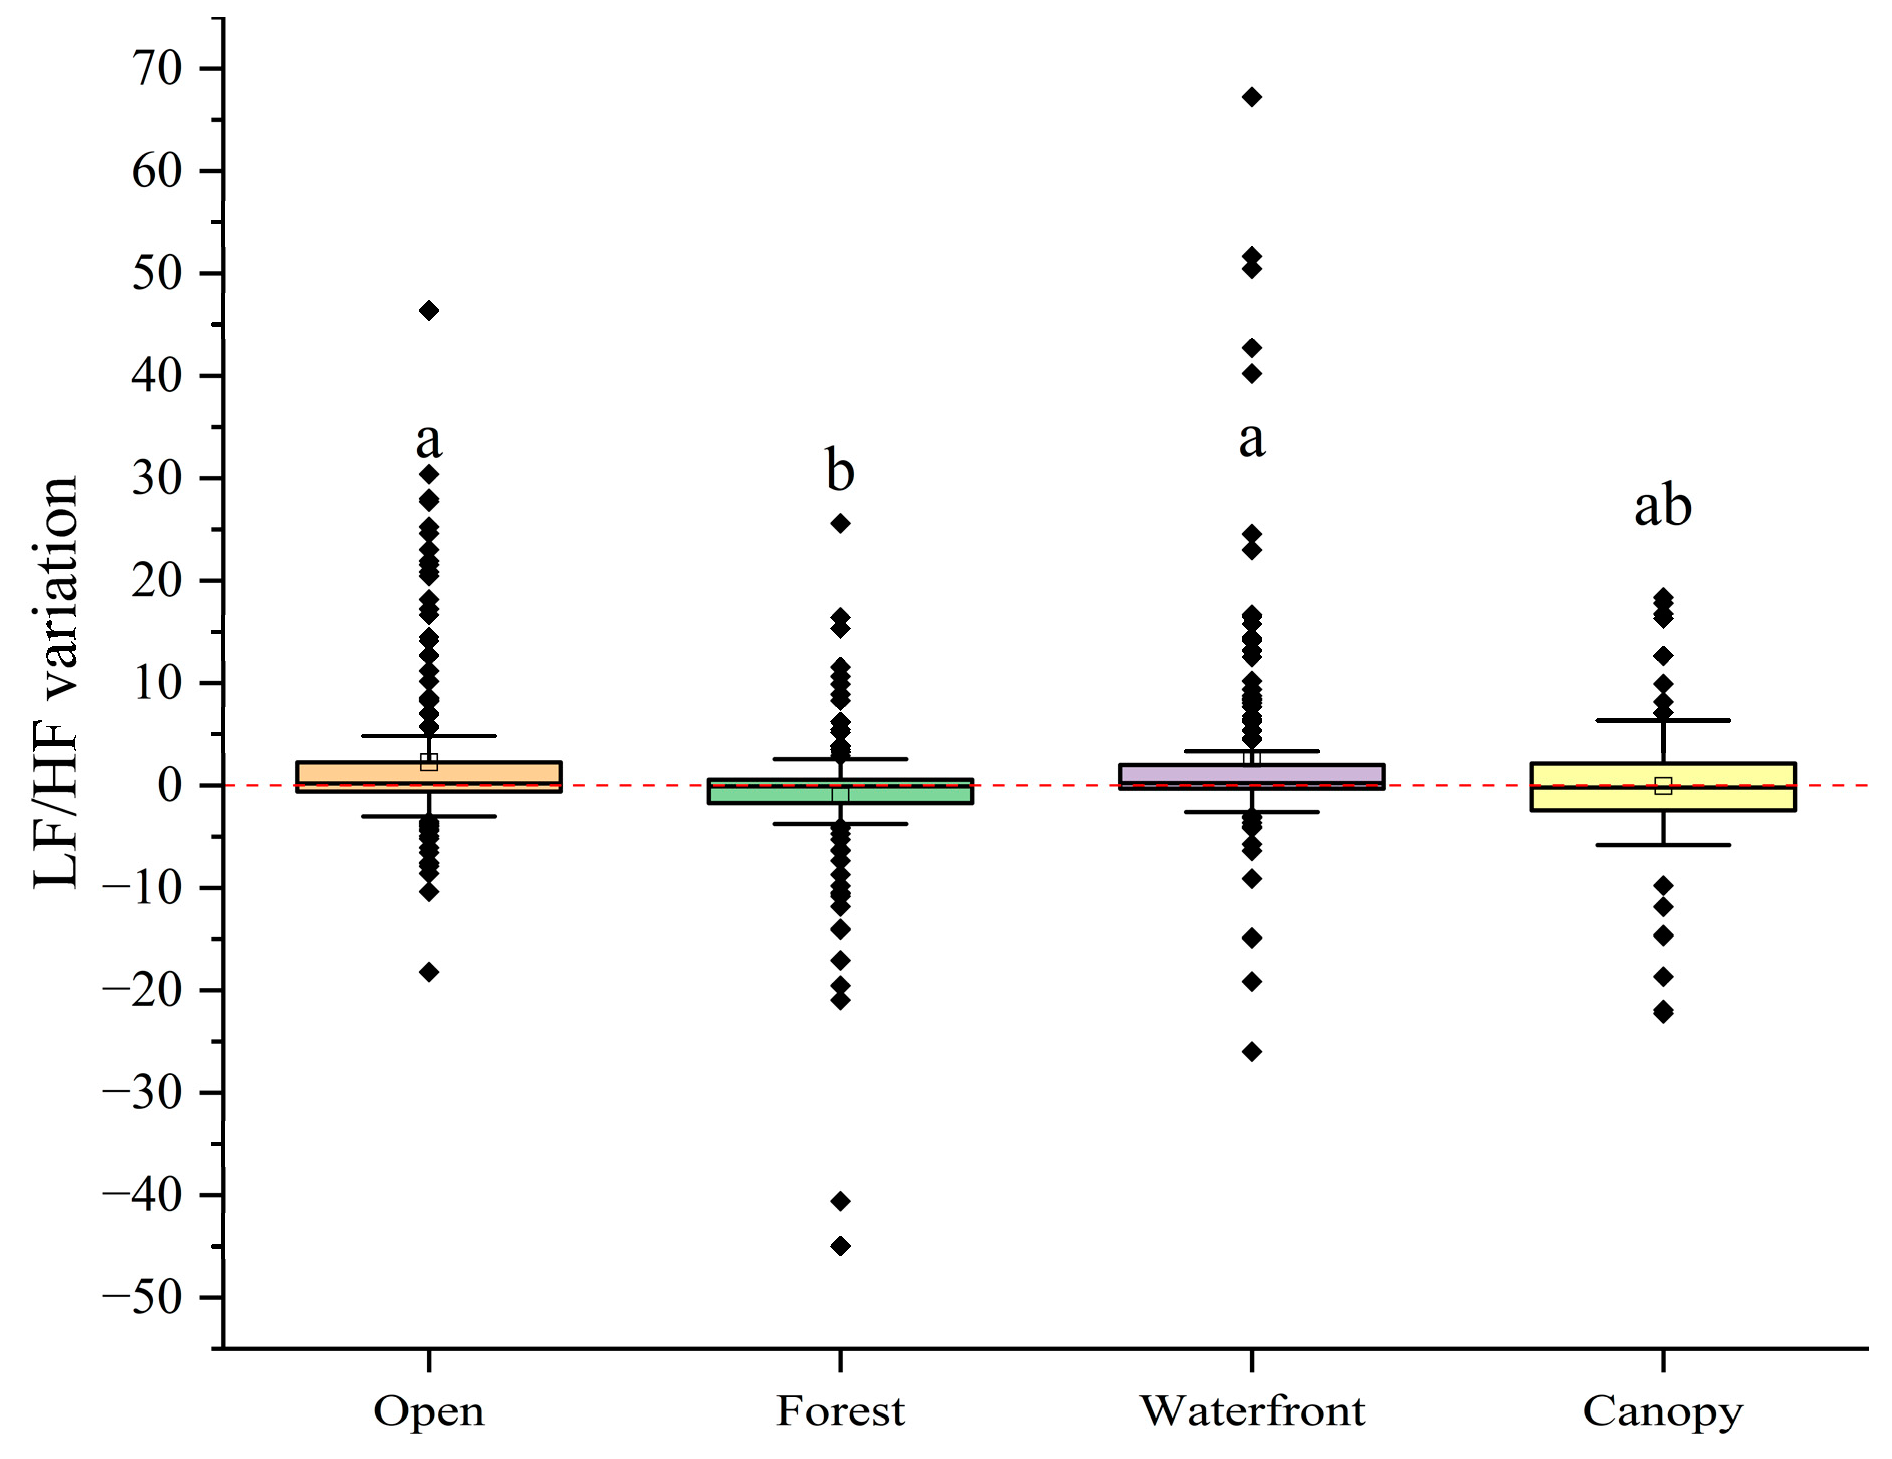
3.2.2. Effects on the Heart Rate LF/HF Balance

Figure 7 illustrates the effect of different types of recreational sites on the change in the LF/HF ratios. The results showed that the forest recreation places, characterized by dense vegetation and minimal disturbance from pedestrians, vehicles, and wildlife, showed the lowest LF/HF ratio and negative changes. This suggests a more pronounced parasympathetic influence, indicative of a relaxed and tranquil psychological state. Conversely, in the other three recreational settings, subjects’ LF/HF ratios increased, albeit without significant differences among them.
The influence of different recreation places in various park types on the change in the LF/HF ratio is presented (Figure 8). The results showed that there were significant differences in the changes in LF/HF ratio in the same places of different park types (such as open, forest, and waterfront). For example, the changes in forest recreation places in Fuzhou National Forest Park were significantly higher than those in other parks.
In general, different types of recreation places and parks have significant effects on the changes in the LF/HF ratio. These differences may reflect the impact of different environments on people’s autonomous nervous system reactions, especially the balance between sympathetic and parasympathetic nerves in different natural environments.

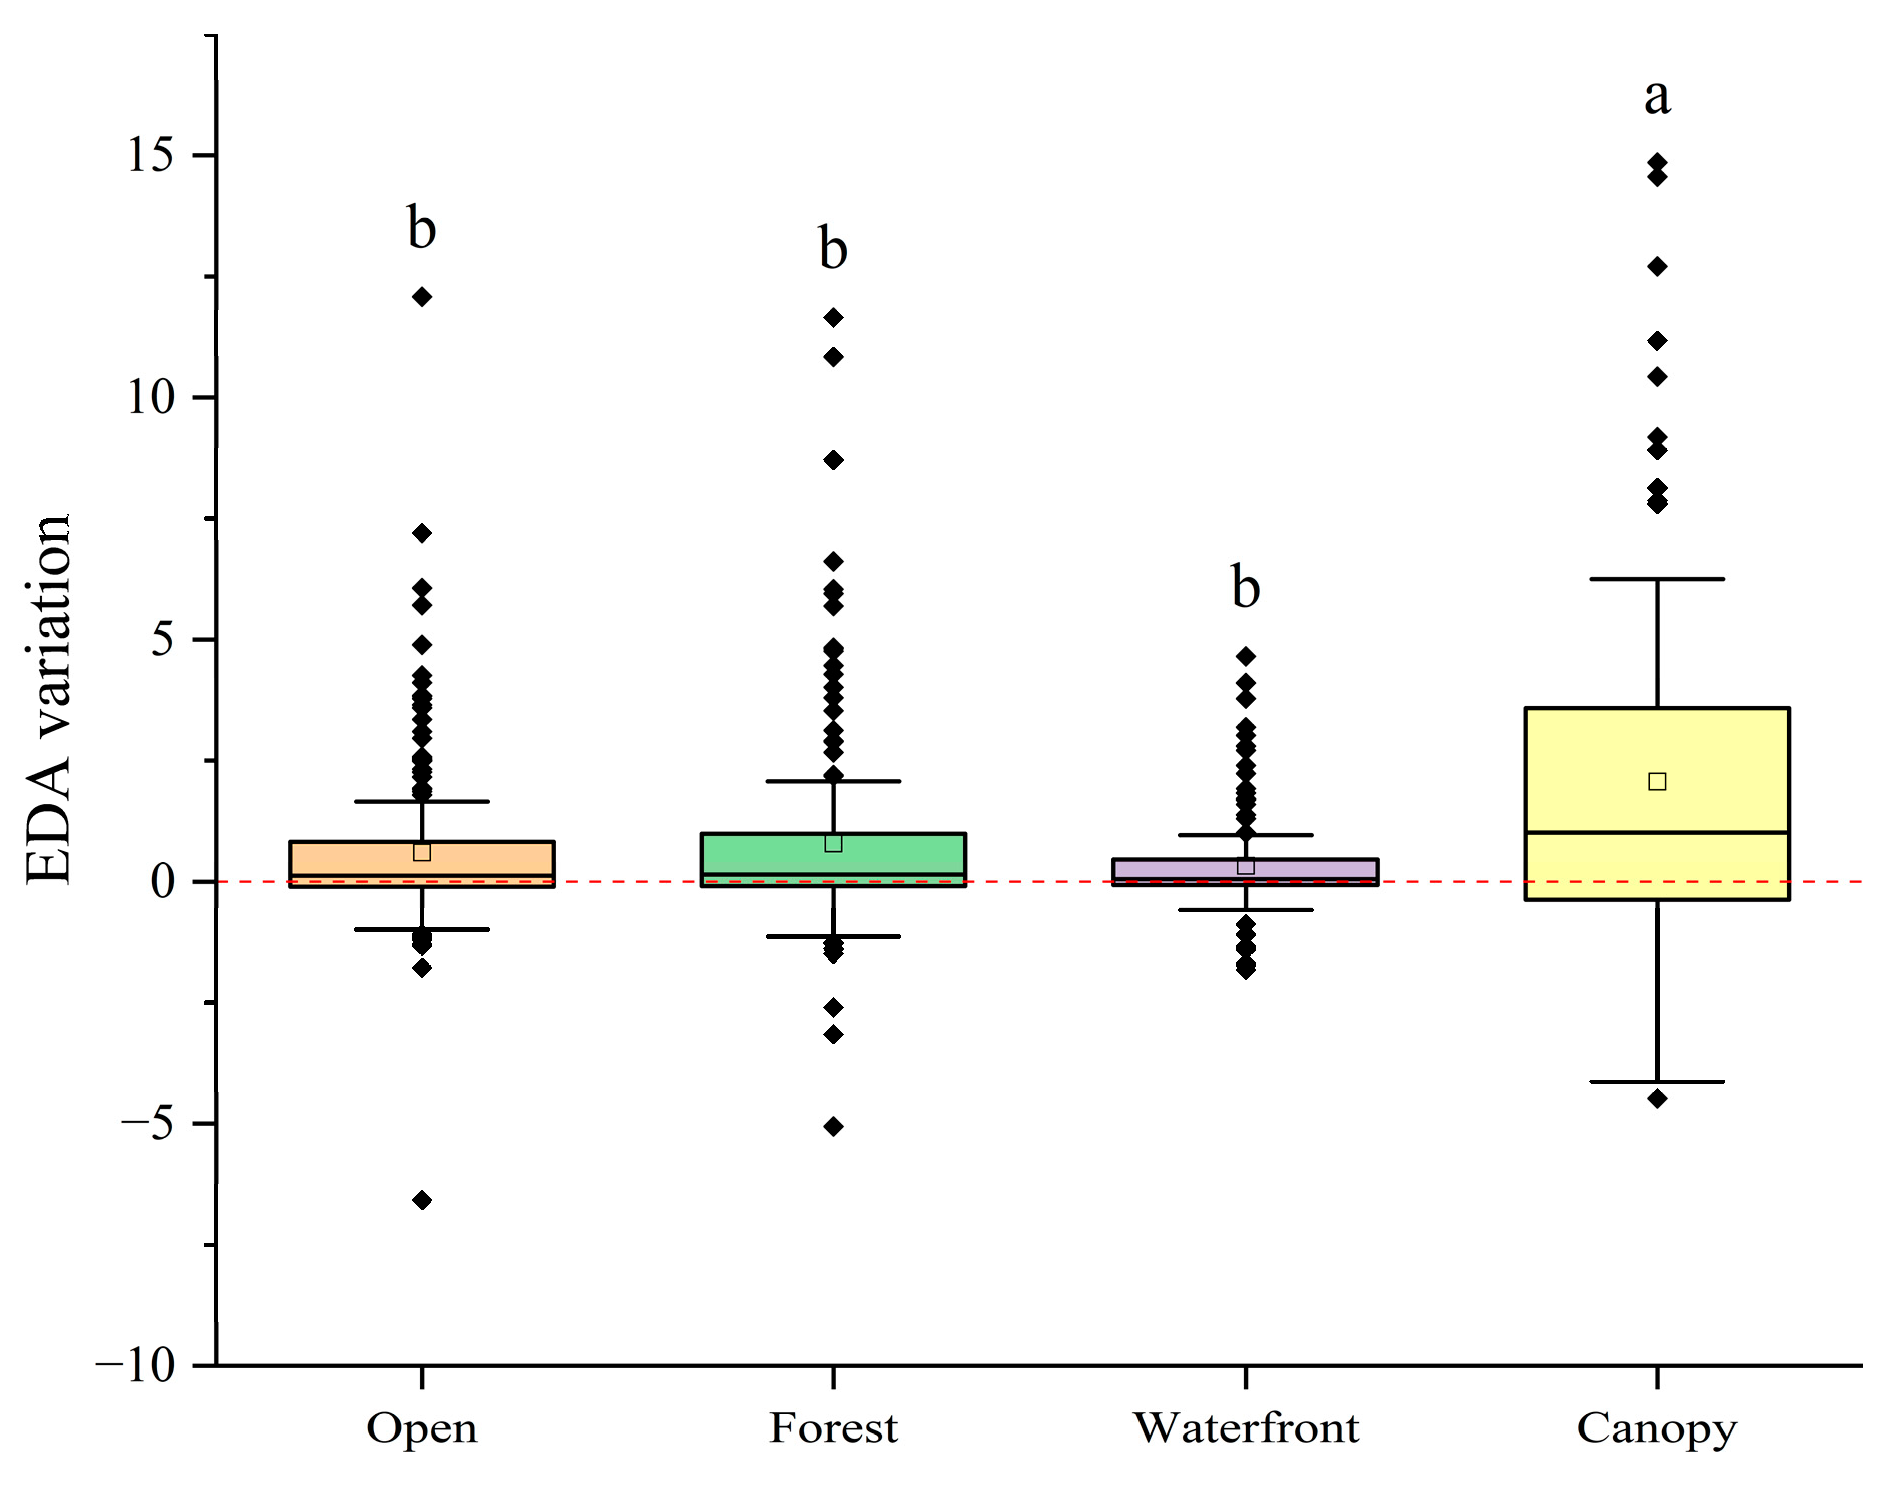
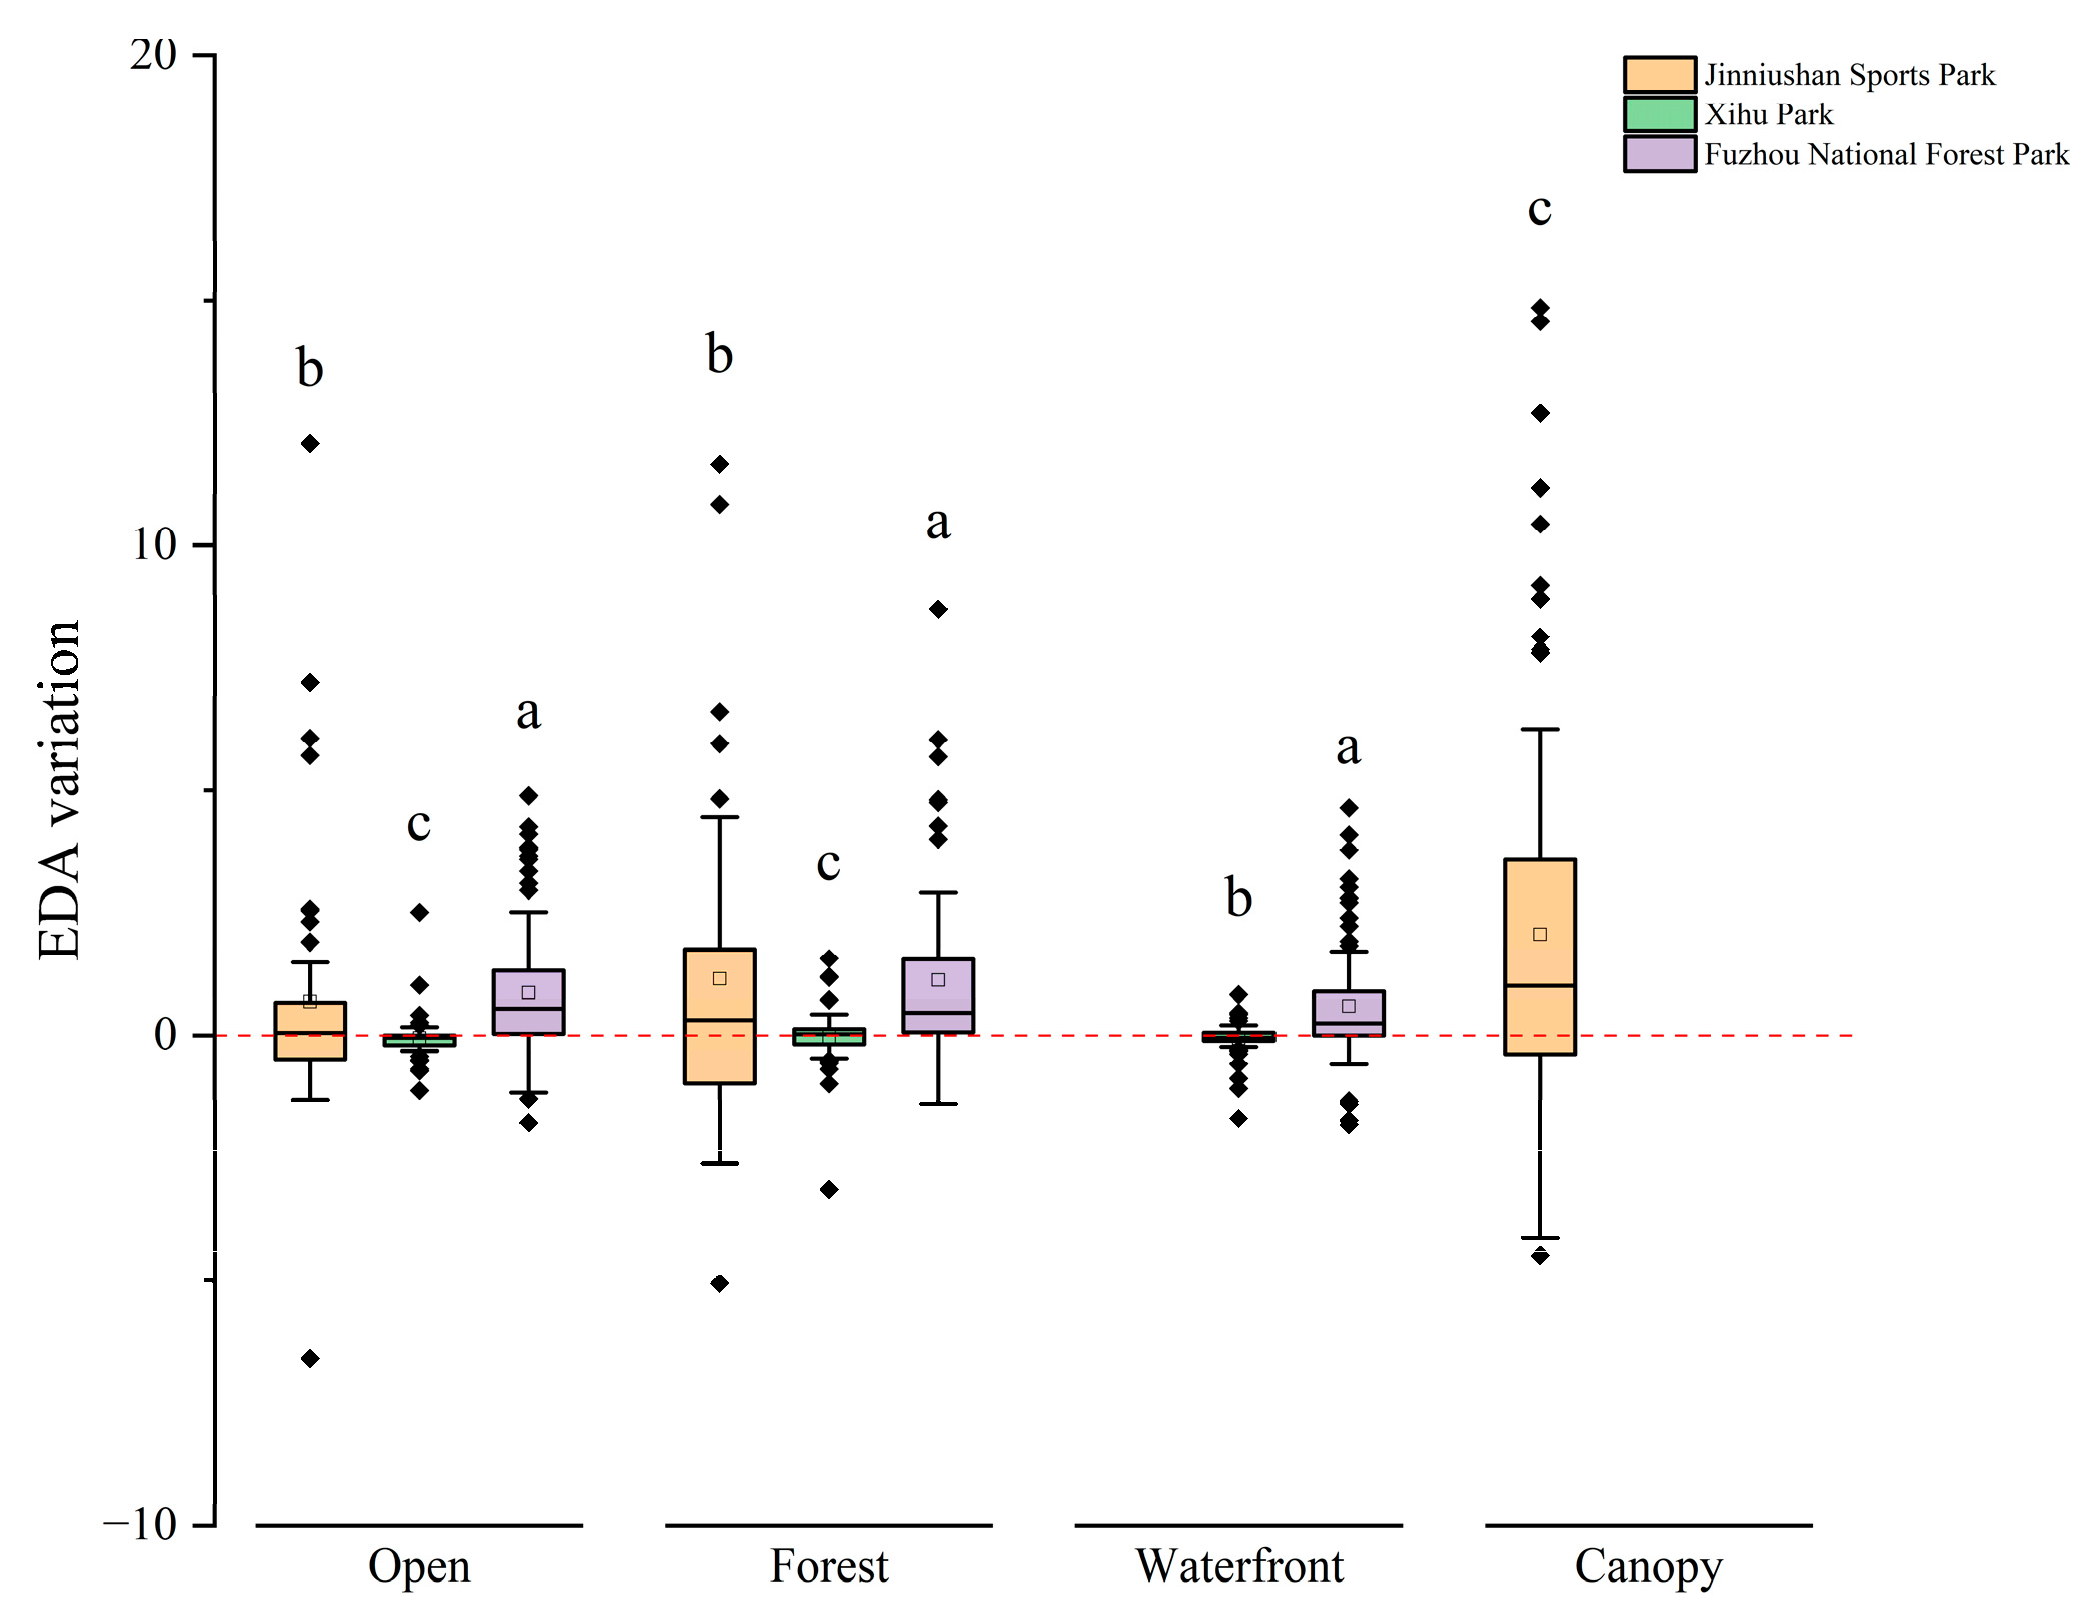
3.2.3. Effects on EDA

Figure 9 presents an analysis of the subjects’ EDA variation values across various recreation places, notably, the canopy recreation place elicited the most significant EDA change value of 2.00, surpassing forest (0.73), open (0.52), and waterfront (0.24) recreation places. It showed that all four types of recreational environments tend to amplify the subjects’ emotional fluctuations. The unique vantage point provided by the canopy recreation places, where individuals are elevated above the tree canopy, offered an unfamiliar perspective and heightened psychological stimulation, leading to pronounced EDA changes. In contrast, the emotional responses in the other three types of environments were more uniform by the end of the test, with no significant differences noted.
The impact of different recreation places in different parks on EDA changes is shown. (Figure 10). The results showed that the differences in EDA changes in the same recreation place among different park were significant. For example, EDA changes were significantly higher at Jinminshan Sports Park than at Xihu Park in the forest recreation places. These showed that different types of natural environments have different effects on individual psychological arousal and emotional response, especially in specific parks and places, where this effect may be more pronounced. Canopy places seem to be able to trigger higher EDA changes, suggesting that people’s psychological arousal level may be higher in these environments.

3.3. Effect of Thermal Environment and Air Quality on Public Psychological Indicators

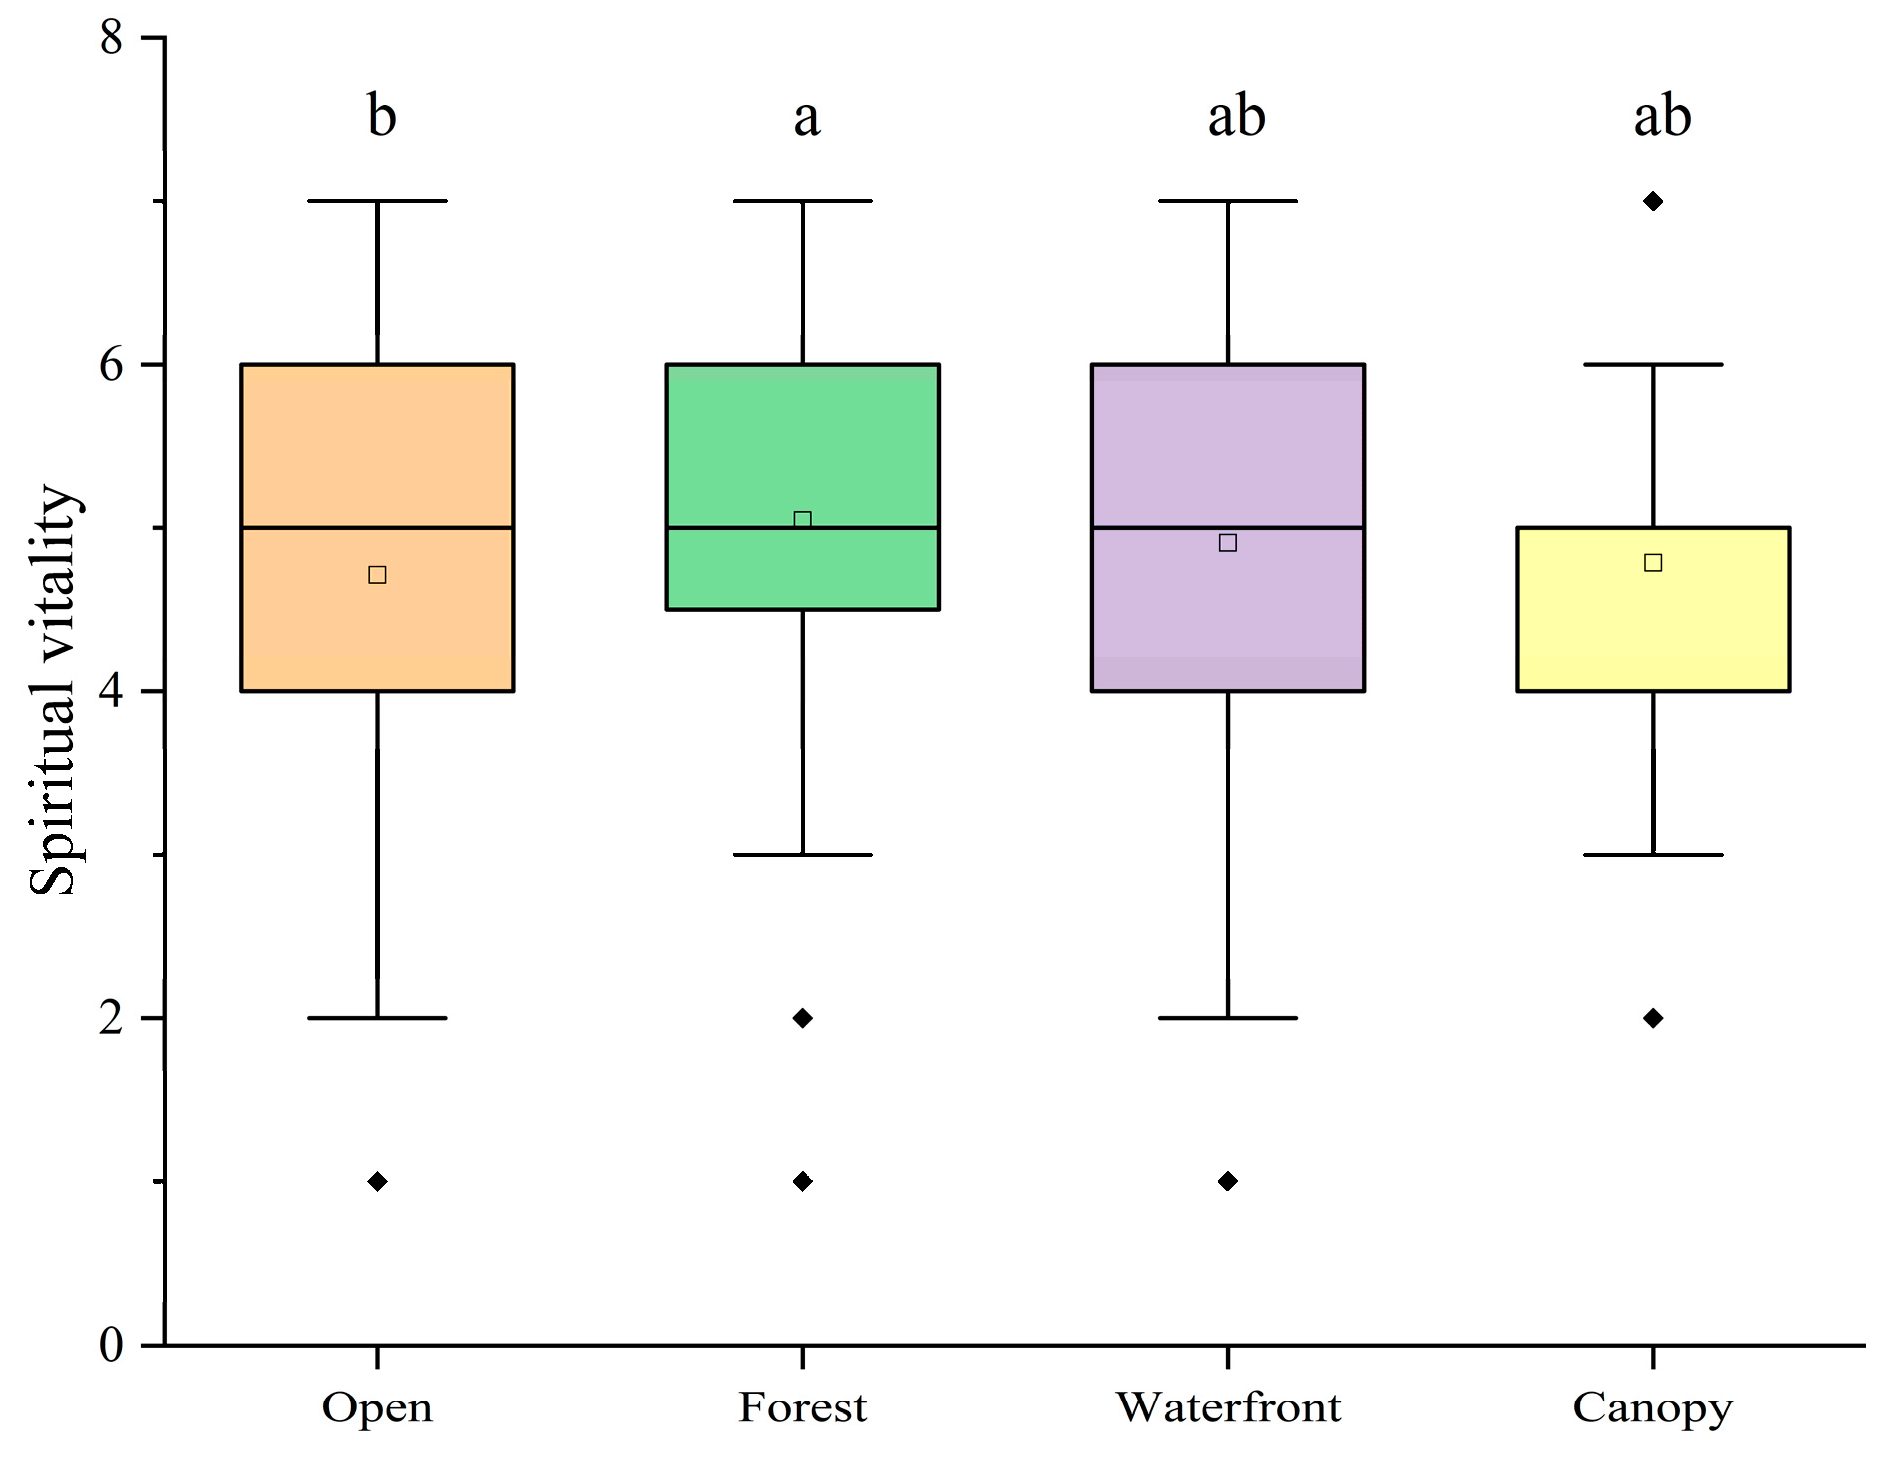
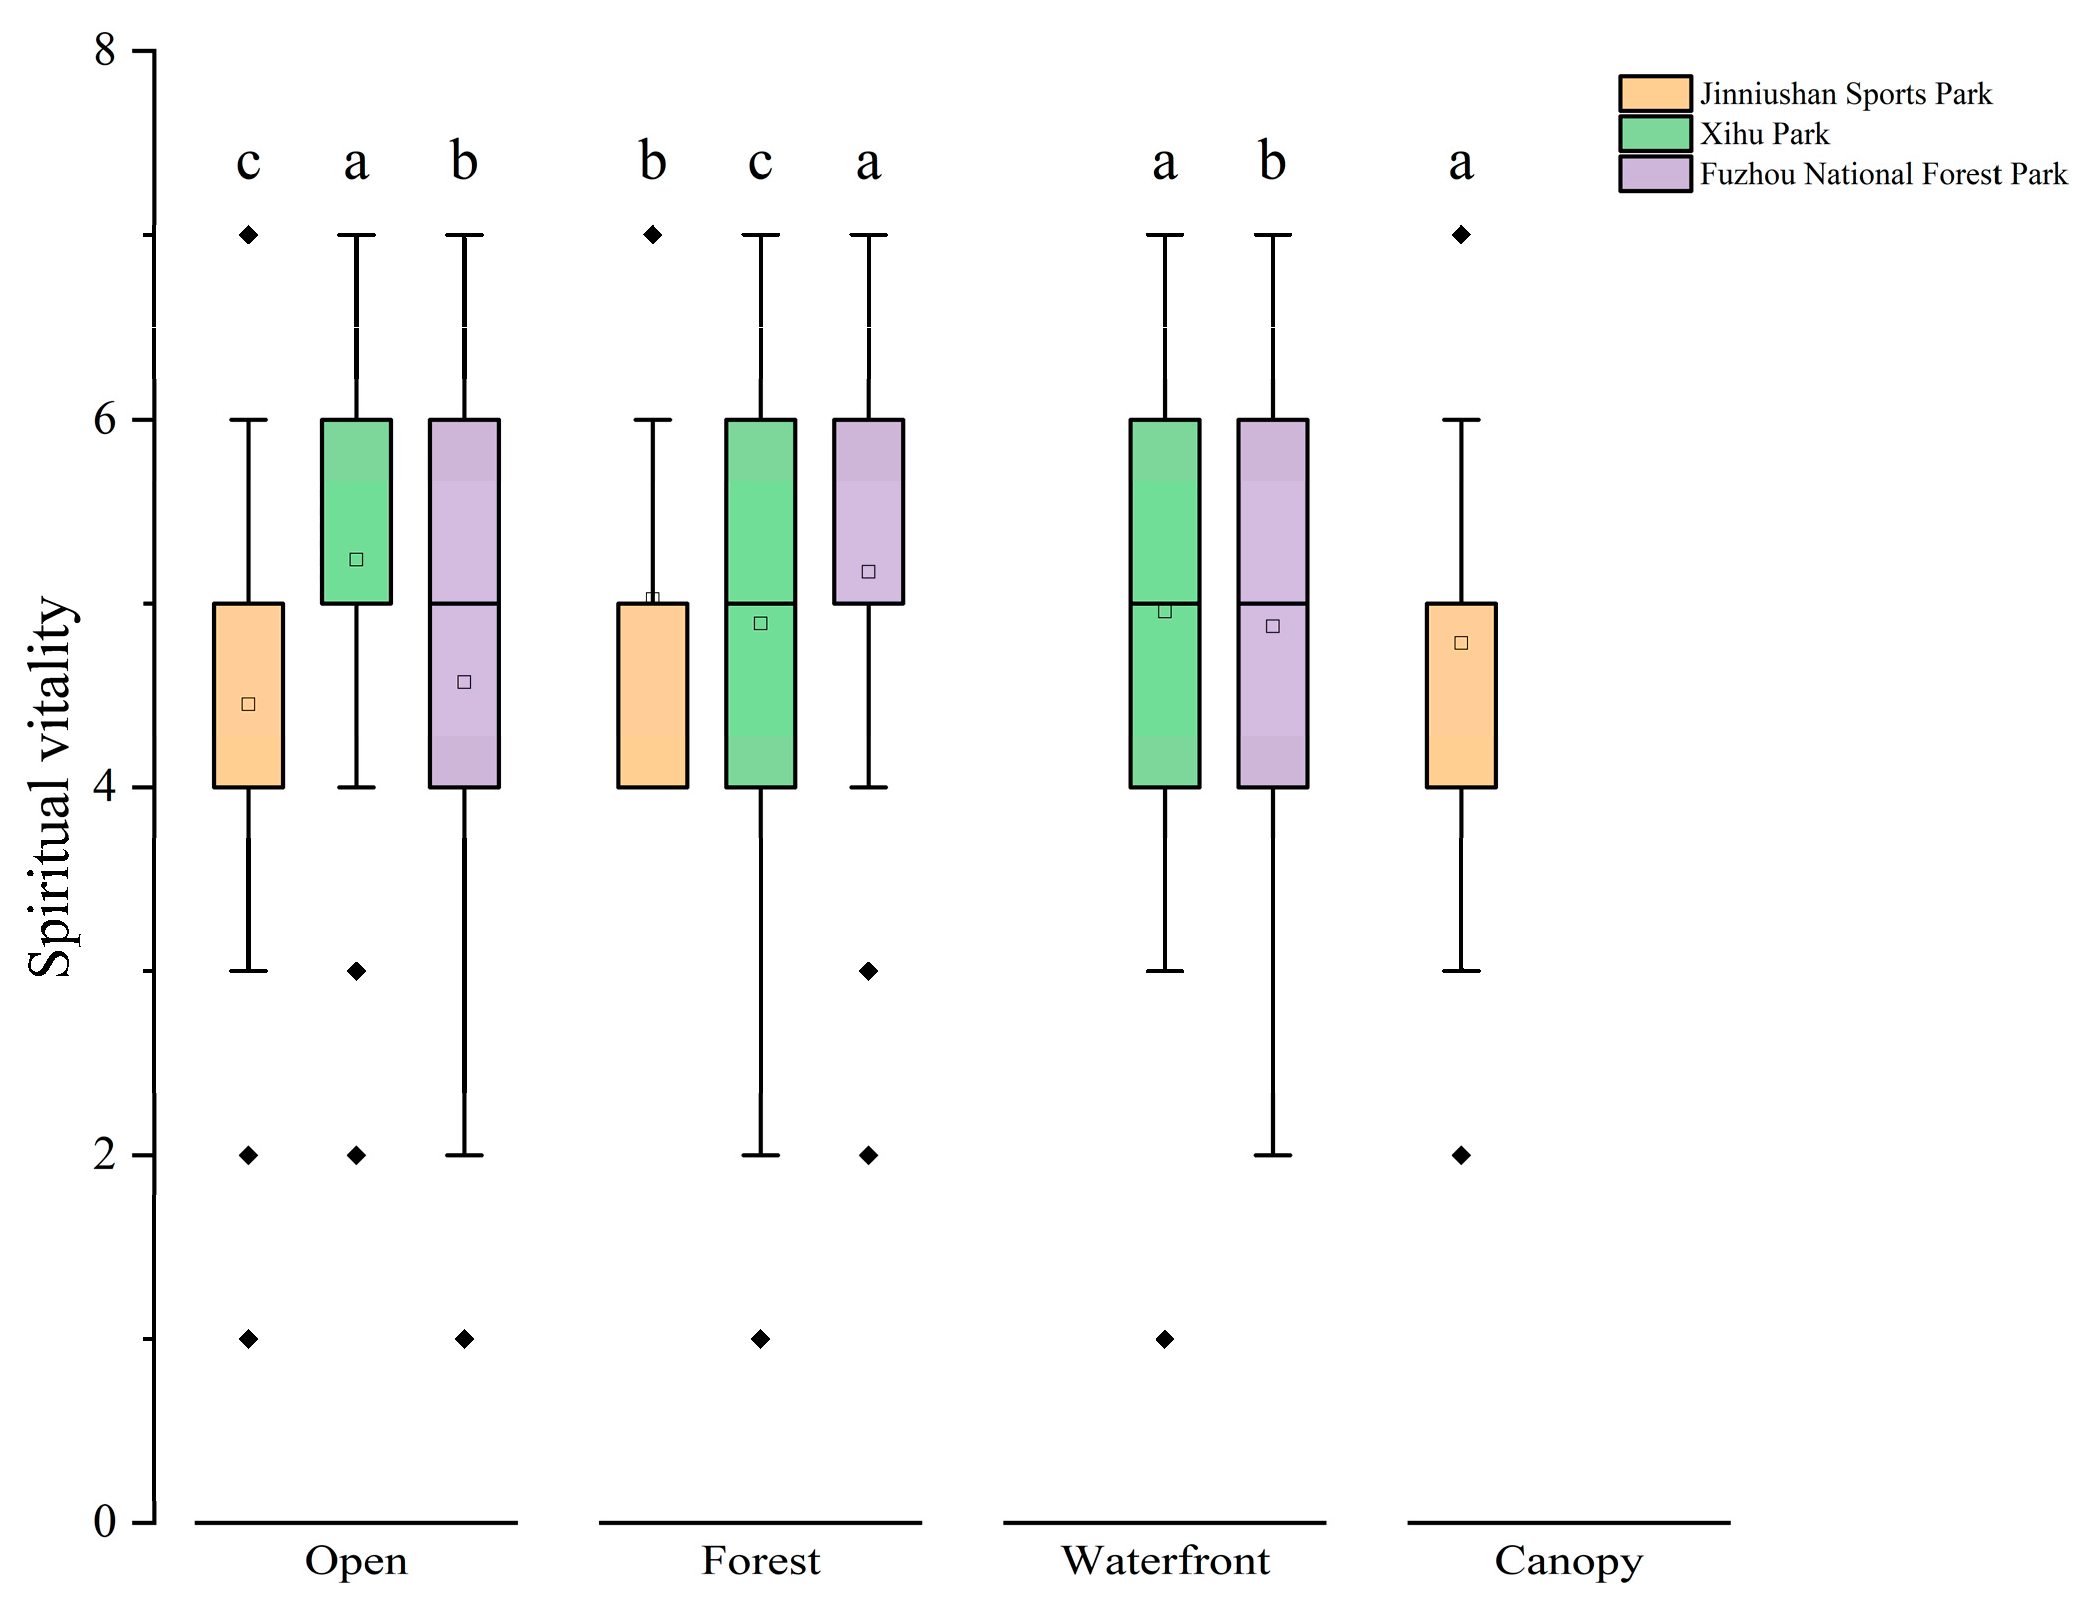
3.3.1. Spiritual Vitality

Our analysis of recreation places in Fuzhou’s parks revealed that the results showed that the scores of spiritual vitality in forest and waterfront places were significantly higher than those in open places, while the score of canopy places was the lowest among these places, and there were significant difference between forest and open areas. This indicates that forest and waterfront environments may be more effective in improving individual mental vitality, while open places and canopy environments have relatively weaker effects (Figure 11).
Figure 12 illustrated the impact of different recreation places in different park types on spiritual vitality. The results showed that there are significant differences in the impact of the same recreation places in different park on spiritual vitality. For example, the score of forest places in Xihu Park is significantly lower than that in other parks. At the same time, in open places, the impact of different parks on spiritual vitality is also different, with higher scores in Xihu Park and Fuzhou National Forest Park.
It can be seen from the general trend that tree coverage and water body factors in the natural environment have a positive impact on mental health, but the differences between different types of natural places and parks indicate that specific environmental characteristics may have unique effects on individual psychological states.

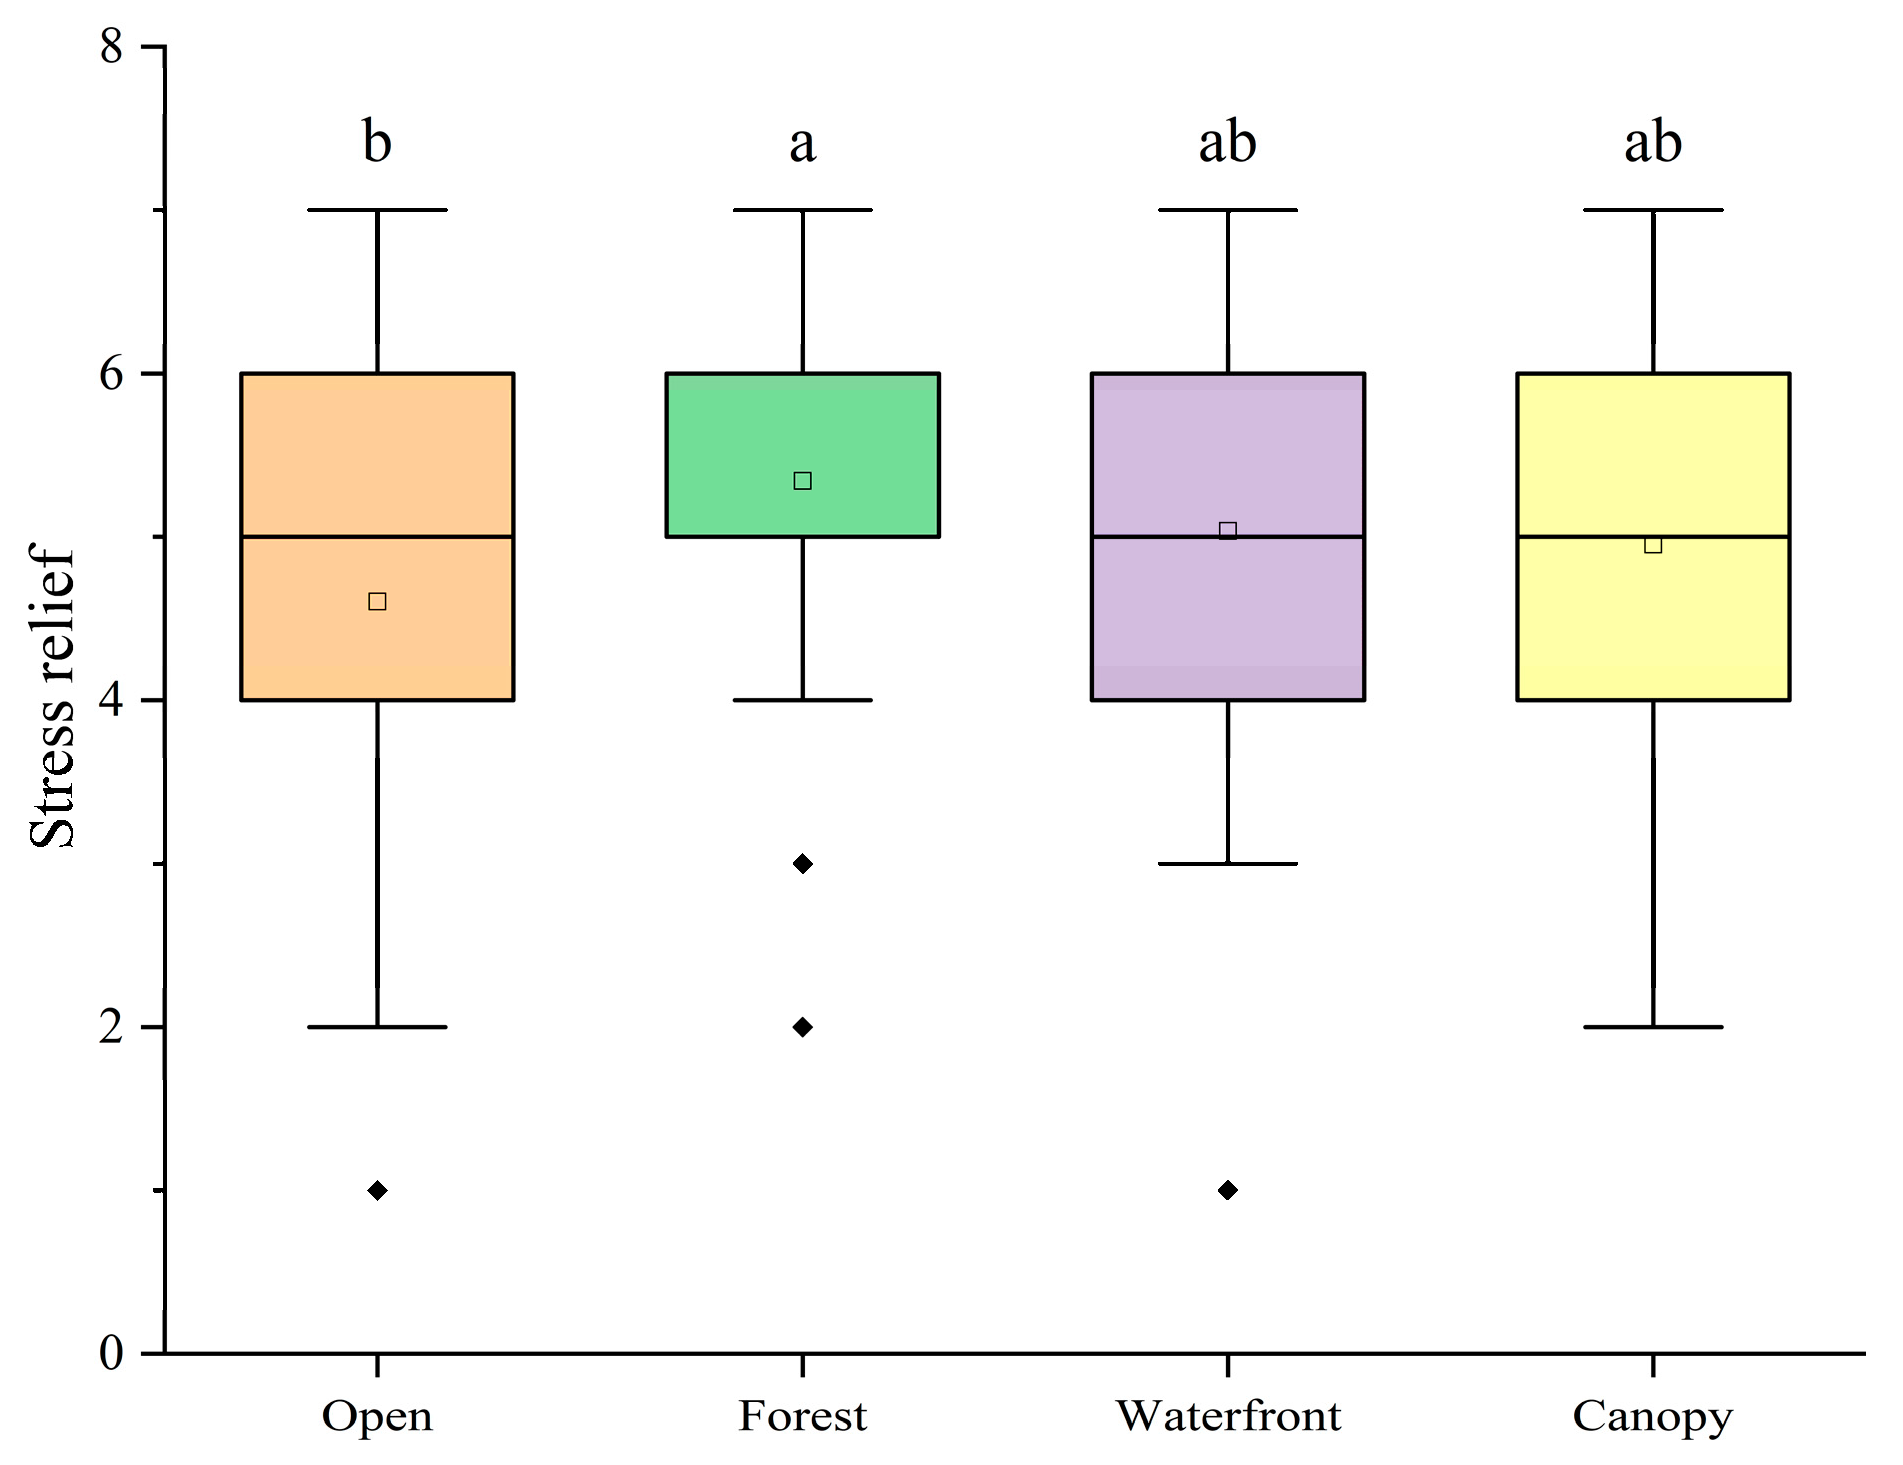
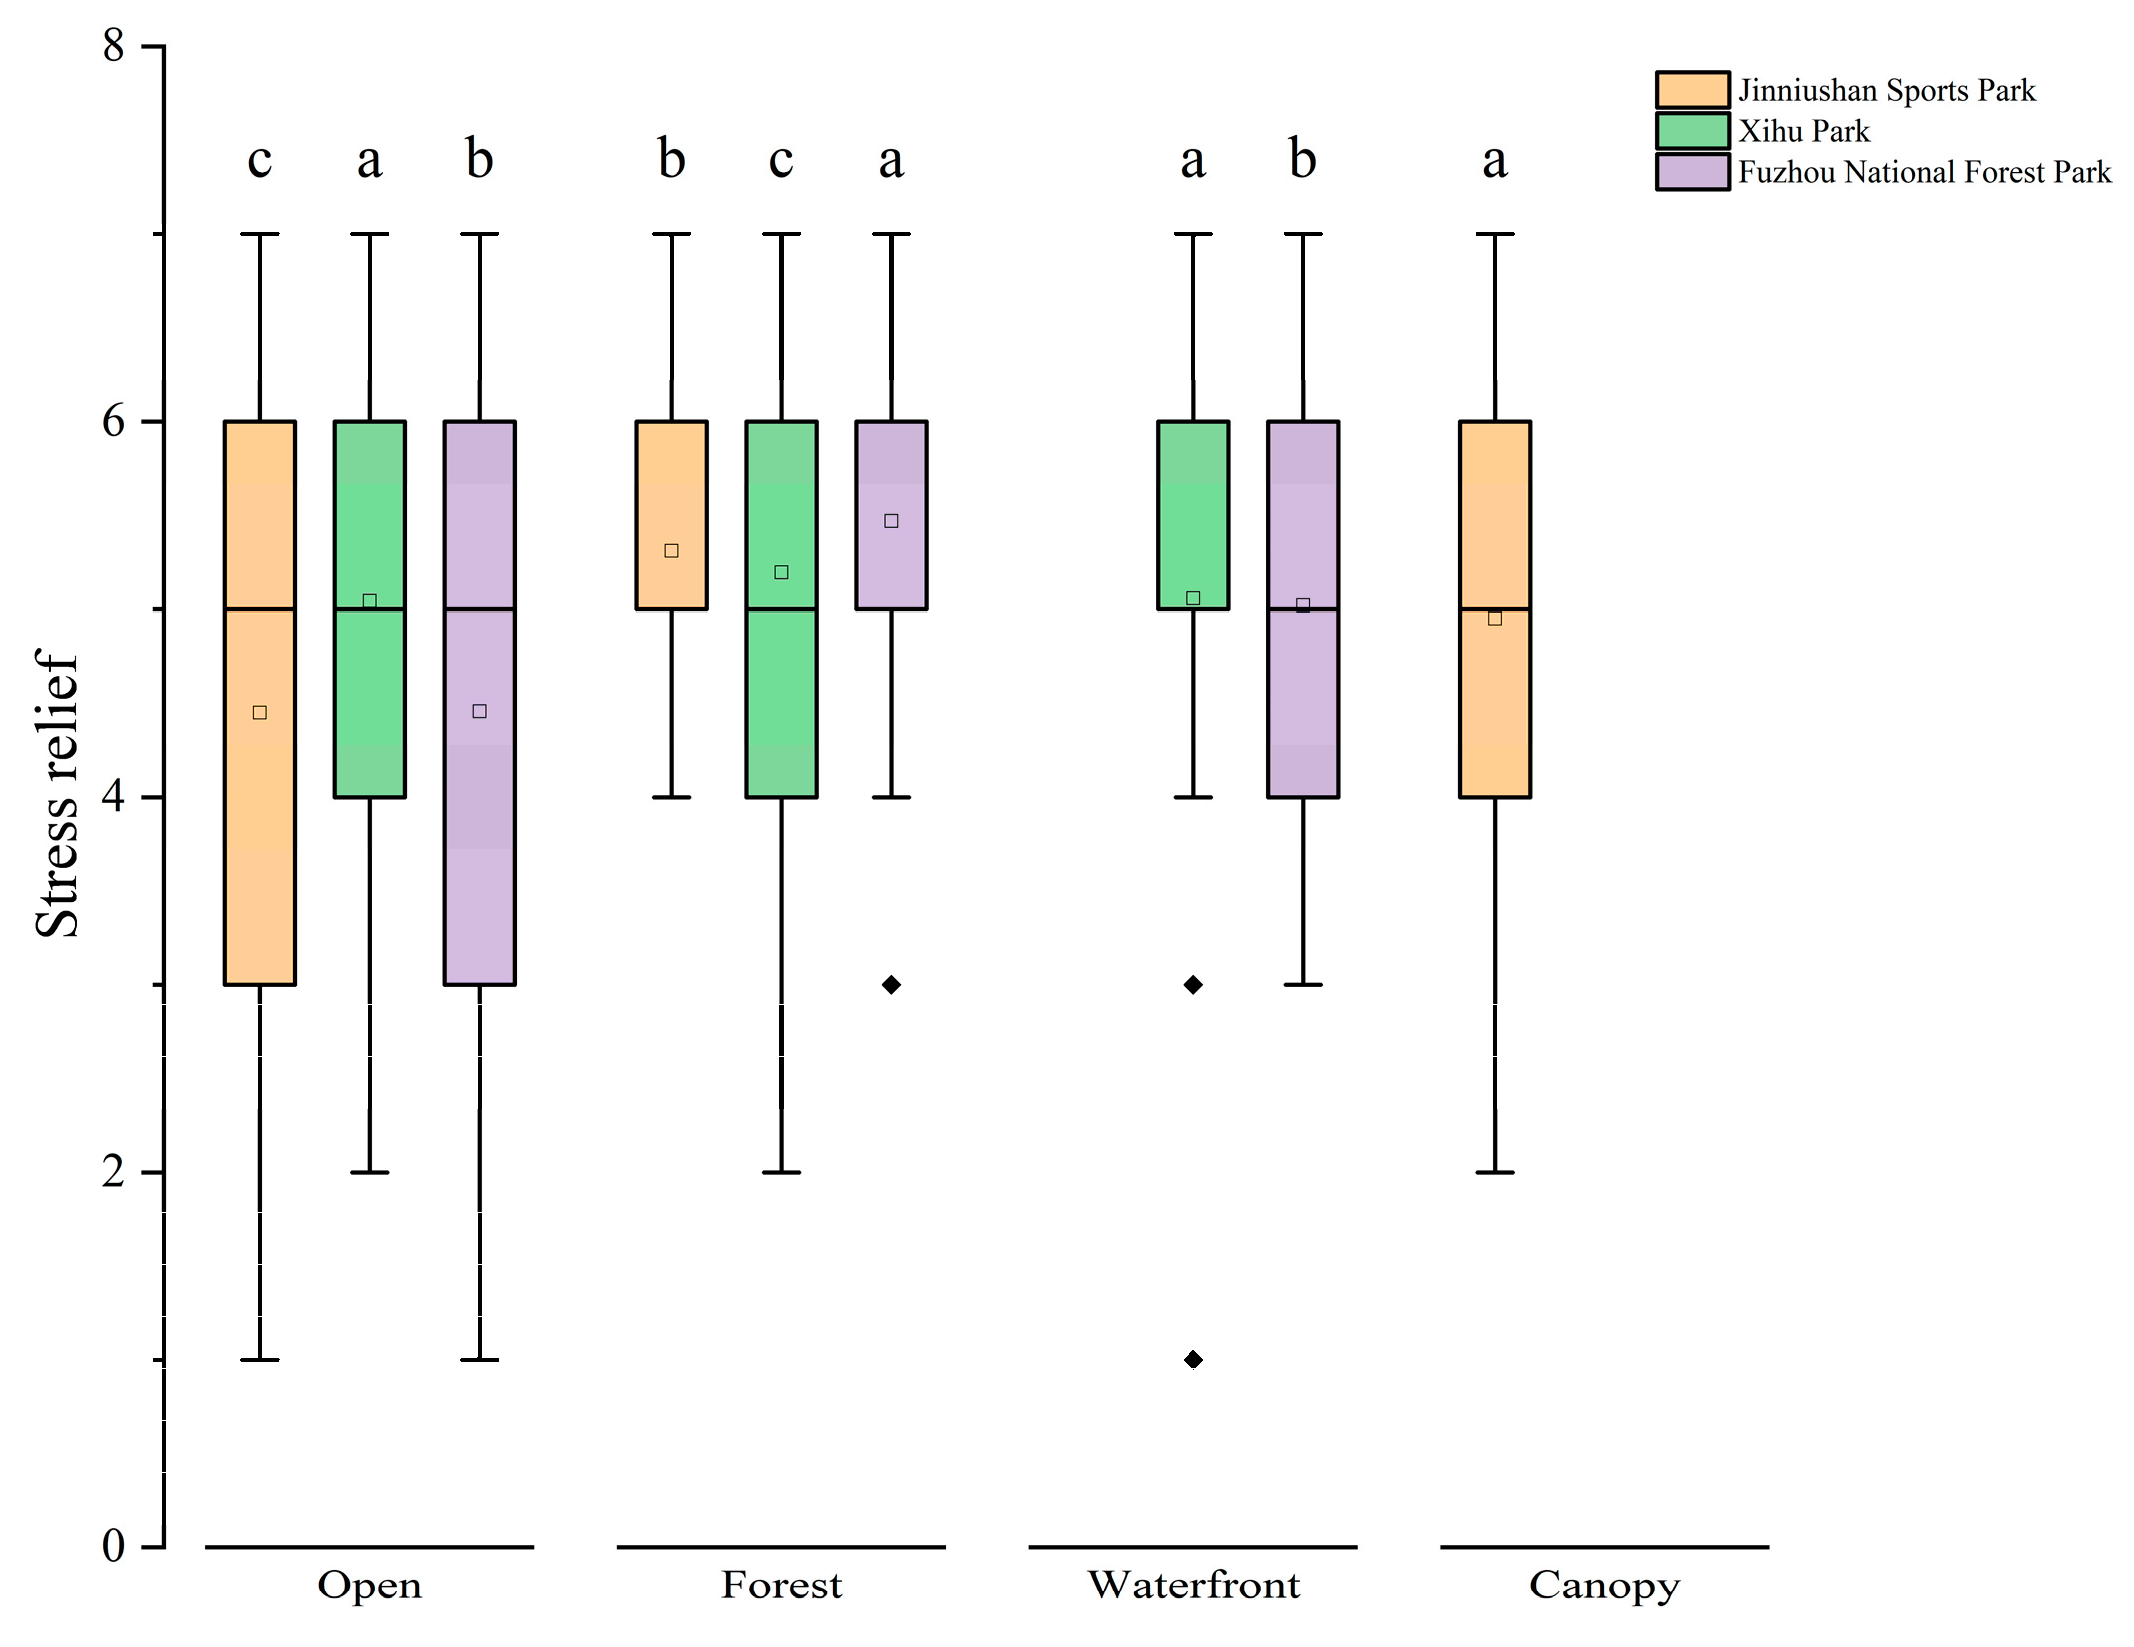
3.3.2. Stress Relief

Figure 13 illustrates our analysis of the stress relief effects across four types of recreational areas within the three Fuzhou parks. Forest recreation places significantly outperformed open recreational places, and the open recreation places are the recreation place with the lowest mean value. It indicated that open recreation places, plagued by traffic and pedestrian noise, were less effective in alleviating stress.
Stress relief at different recreation places in different parks (Figure 14) all showed significant differences. In the open recreation places, Xihu Park has the best pressure relief effect. The forest recreation places had similar stress relief scores across the three parks, and Fuzhou National Forest Park’s score is slightly higher. The effect of different recreation places on stress relief varied significantly, and the same type of recreation places in different parks also showed obvious differences. This further suggests the importance of the environment for stress relief.

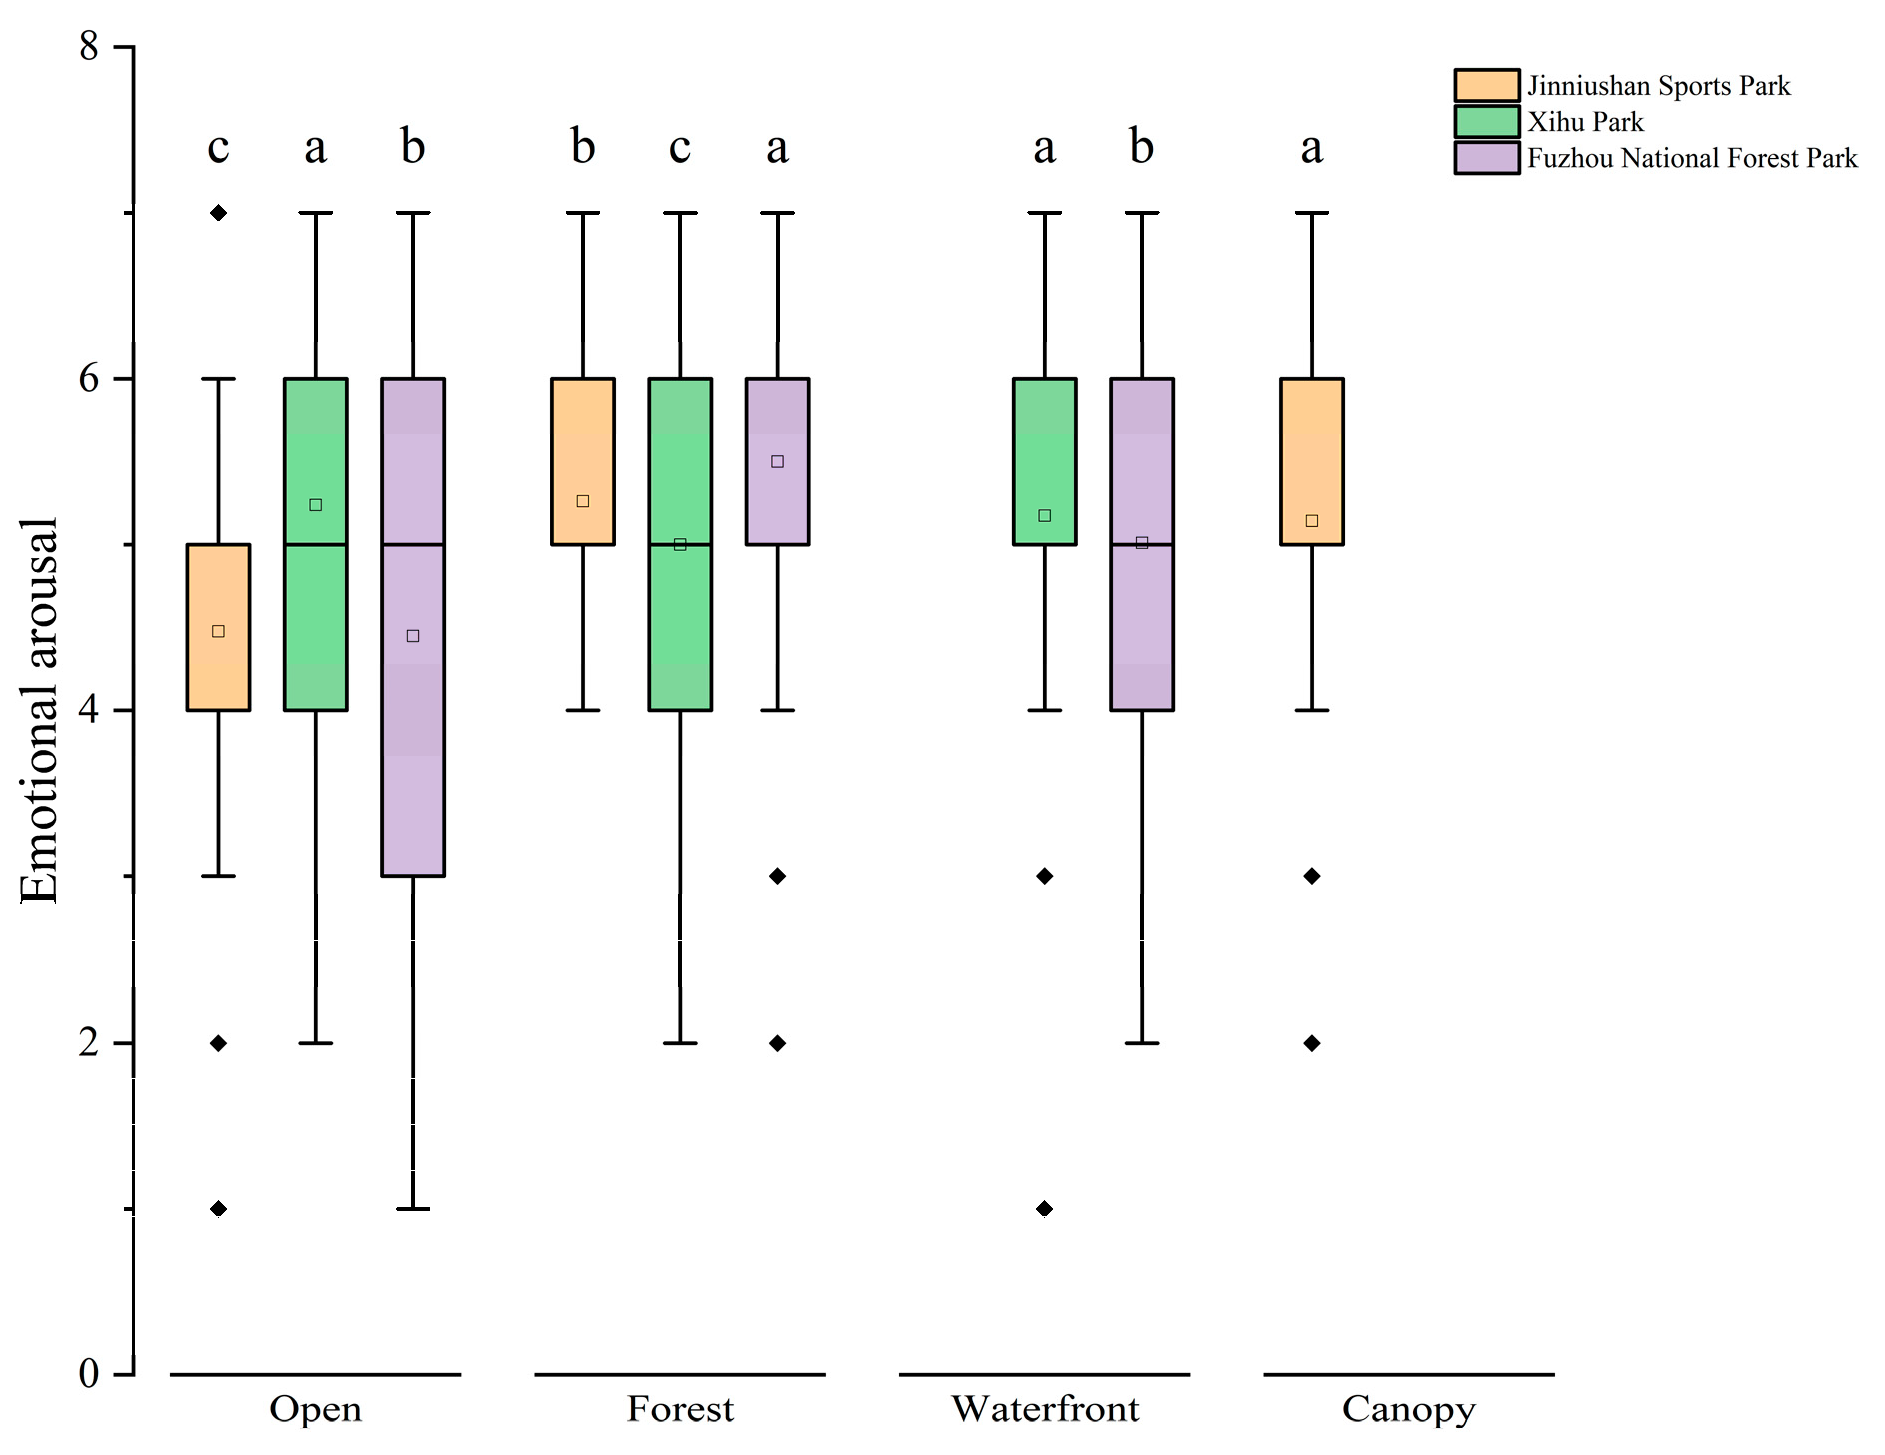
3.3.3. Emotional Arousal

Regarding emotional arousal across the four types of recreation places in the three Fuzhou parks (Figure 15), forest recreational sites were significantly more effective than the others in facilitating emotional recovery (p < 0.001). This outcome is likely linked to the elevated levels of negative oxygen ions and superior air quality within forested areas, which synergistically encourage emotional relaxation and rejuvenation among visitors. Additionally, canopy recreational areas fostered a sense of novelty and exploration due to their distinctive vantage points at height.
The analysis of emotional arousal in different recreation places in different parks suggests that there are significant differences between the parks (Figure 16). In particular, the forest recreation places of Fuzhou National Forest Park can evoke emotions to a higher degree.

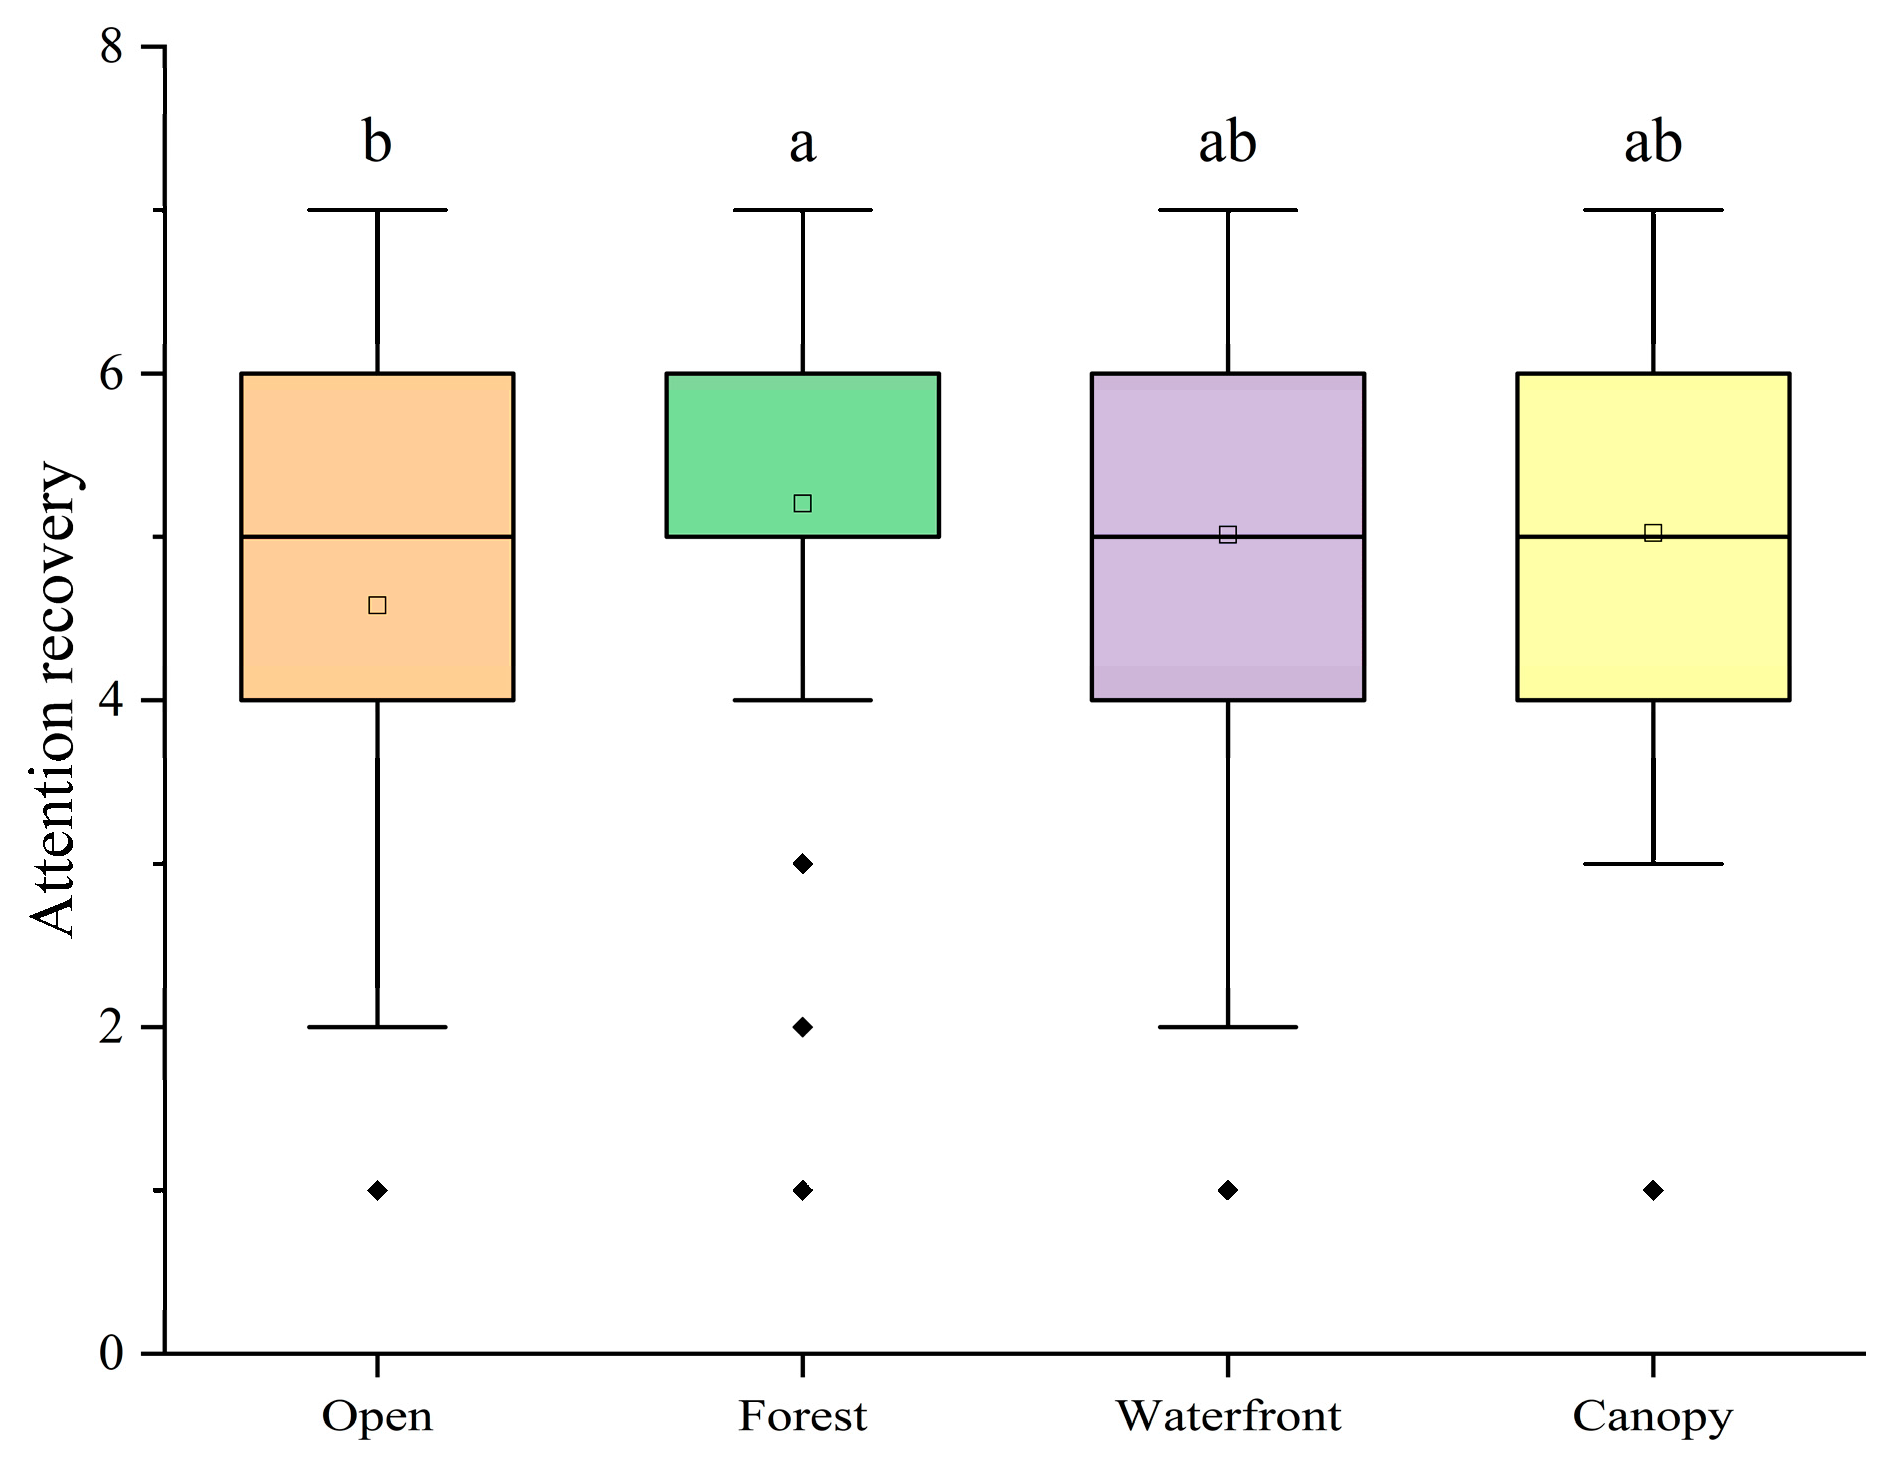
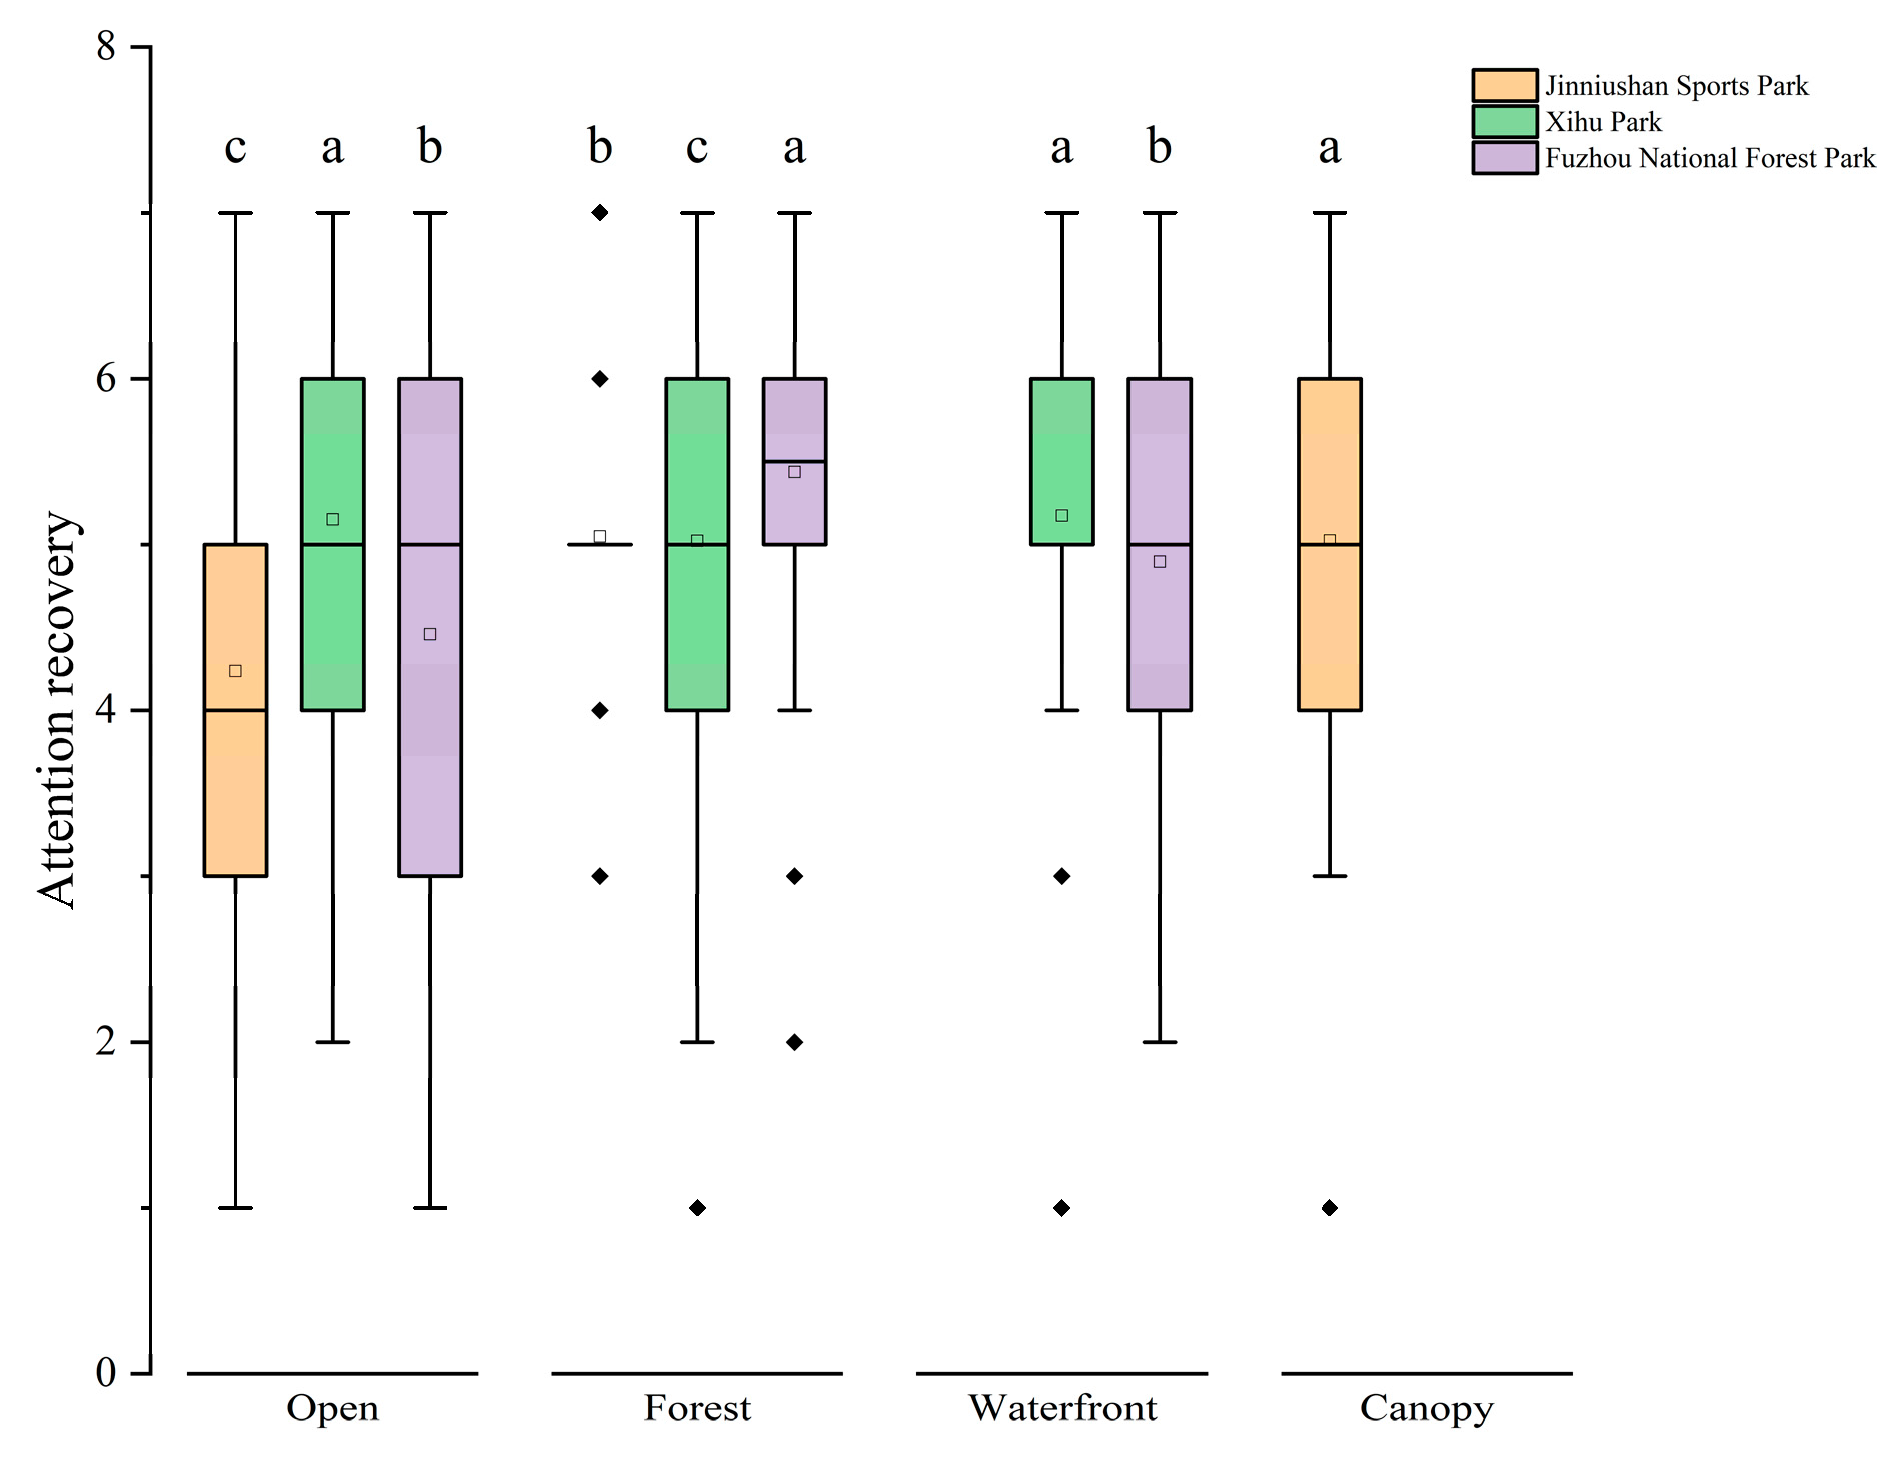
3.3.4. Attention Recovery

The analysis reveals the exceptional capacity of forest recreation places in enhancing attention recovery among participants, outperforming all other areas studied (p < 0.001). Canopy and waterfront recreational places also demonstrate positive effects on attention recovery. The influence of open recreation places was the weakest and appeared significantly different from forest recreation places (Figure 17). The lushness of the landscape, natural ambiance, comfortable thermal environment, and clean air are key factors in facilitating the restoration of attention.
Similar to the other three psychological indicators, attention recovery also showed significant differences among the same recreation places in the three parks (Figure 18). Among them, the forest recreation places of Fuzhou National Forest Park had the best attention recovery effect, while the open recreation places of Jinniushan Sports Park ranked last. This further suggests that park environment and design may have important effects on attention recovery outcomes.

3.4. Regression Analysis of Thermal Environment and Air Quality on Public’s Physiological and Psychological Responses

All thermal environmental parameters and air quality parameters were entered into a stepwise regression model to identify their major influencing factors on people’s physiological and psychological responses. In the initial analysis, PM2.5 and PM10, two air quality parameters, were found to have a strong correlation and multicollinearity. Therefore, in the subsequent analysis, only PM2.5 was retained as the representative air pollutant for stepwise regression, and a model was established based on it, as shown in Table 5 and Table A1.
Taken together, the influencing factors explained 1.9% to 11.8% of the variation in physiological and psychological responses to thermal environmental parameters and air quality parameters. Specifically, the physiological and psychological responses were mainly affected by temperature, wind speed, and negative oxygen ions, while humidity and particulate matter had a smaller impact. However, humidity and particulate matter did not show a significant effect on psychological responses.
Regarding temperature, it had a significant effect on HR, spiritual vitality, stress relief, emotional arousal, and attention recovery, especially on HR and LF/HF, with increasing temperature generally decreasing HR and increasing the magnitude of LF/HF. Regarding humidity, it had a significant effect on physiological responses, such as HR and EDA. The negative regression coefficient indicates that increased humidity leads to a decrease in EDA changes. Regarding wind speed, it had a significant effect on HR, spiritual vitality, stress relief, emotional arousal, and attention recovery, with positive regression coefficients indicating that increased wind speed enhances these responses. Regarding particulate matter, it had a significant negative effect on HR and EDA, which means that increased particulate matter in the air leads to a decreased EDA and HR. Regarding negative oxygen ions, they had a positive significant effect on vigor, stress relief, agitation, and attention restoration, suggesting that increased negative oxygen ions have a positive effect on psychological well-being.
Overall, our results demonstrate the varying influences of different thermal environmental parameters and air quality parameters on people’s physiological and psychological responses. Temperature, humidity, wind speed, and particulate matter have important effects on physiological responses, such as HR and EDA. Wind speed and negative oxygen ions have positive effects on psychological well-being, such as spiritual vitality, stress relief, and attention recovery. Temperature and particulate matter have negative effects on most psychological and physiological responses, especially on HR. These findings suggest that environmental factors play a non-negligible role in both physiological and psychological health.

4. Discussion

In the realm of research investigating the intertwined effects of urban trees microclimate and air quality on the psycho-physiological well-being of the public, this study deepens our understanding of the complex interplay between environmental factors and the physiological and psychological states of individuals. Through an in-depth field monitoring and questionnaire survey conducted across 24 recreation places in three distinct types of urban forests in Fuzhou City, as shown in Figure 19, this study expands our knowledge of the holistic impact of environmental parameters on public health and well-being.

4.1. Thermal Environmental Factors and Physiological-Psychological Indicators

Prior research has predominantly focused on the impact of singular environmental factors on human health, such as the influence of temperature on thermal comfort [53] or the effect of air quality [54] on respiratory health. In terms of the methodology, this study employed a stepwise regression analysis to reveal how various environmental factors interact with each other to affect the public’s psycho-physiological state, ensuring the rigor of the analysis [55]. It is worth noting that an inverse correlation was found between the temperature and HR, and psychological indicators within the comfortable temperature range of 18 to 22 degrees Celsius. This may be attributed to the fact that 18 to 22 degrees Celsius is generally considered to be the thermal comfort zone for most individuals. When individuals are comfortable and immersed in scenic surroundings, their heart rate tends to be lower, and their psychological well-being is often enhanced. In addition, the previous study also found that within a higher temperature range, as the temperature rises, people’s perception of heat gradually increases [24], and there is a significant increase in eardrum temperature, skin temperature and moisture, heart rate, end-tidal carbon dioxide, and body weight, while the acceptability of air quality decreases linearly [56]; these studies confirm our view. The role of psychological adaptation and the contextual factors in this process still require further research in future experiments to gain a more comprehensive understanding of the complex relationship between thermal comfort, psychological well-being, and physiological responses.
Furthermore, humidity exerted significant effects on physiological responses, such as HR and EDA. The negative regression coefficient of EDA implied that higher humidity levels are associated with decreased skin conductance, which could be indicative of reduced physiological arousal or stress. This finding suggests that environments with humidity levels within the range of 50%–60% may facilitate a more relaxed state, potentially mitigating stress responses. This aligns with previous research suggesting that, within a thermoneutral temperature range, the human body is relatively insensitive to changes in humidity; however, slightly humidified air can be perceived as more comfortable [57]. However, the complexity of humidity’s impact on human health warrants further investigation, particularly regarding its interplay with thermal comfort and the potential for exacerbating heat stress conditions in high-humidity scenarios.
Moreover, the present study revealed that wind speed has significant positive effects on both physiological and psychological parameters, including HR, spiritual vitality, stress relief, emotional arousal, and attention recovery. The positive coefficients indicate that increasing wind speeds potentiate these responses, possibly by providing a cooling effect and improving thermal comfort. This aligns with the notion that air movement can foster more stimulating environments, thereby enhancing both physical and mental well-being. In previous studies, scholars have primarily examined the impact of wind speed on thermal sensation and thermal comfort [58,59], and the impact of the wind speed on the current mood [60]. This research offers a novel perspective on understanding the influence of wind speed on psychological well-being, an area that has received limited attention in prior investigations.

4.2. Effects of Recreation Place Type on Psychological Well-Being

Regarding the investigation of recreation places, prior research has largely concentrated on recreation place visitation rates and user satisfaction, as exemplified by the study conducted by Carrus et al. (2015) on the satisfaction of urban forests users [61]. This study, however, adopts a psychological well-being perspective, evaluating the impact of distinct recreation place types on mental restoration, stress alleviation, emotional tranquility, and attention restoration.
Notably, the positive effects of forest and waterfront recreation place align with “nature affiliation” theory [62]. In a previous study on the psychological and physiological effects of various agricultural recreation landscape types, participants who viewed the water landscape were also found to have significantly improved EMG, showing a significant sense of relaxation [63]. This study provides quantitative support for this theory through empirical data, further examining the specific effects of different recreation place types on psychological indicators. This represents a significant contribution to the existing body of research.

4.3. Air Quality and Physical-Mental Health

The relationship between air quality and psychological well-being has emerged as a prominent research focus in recent years. This study investigates these associations by monitoring indicators such as PM2.5, PM10, and negative air ions.
Particulate matter exerts significant negative effects on both HR and EDA, indicating that increased particulate concentrations lead to reductions in HR and EDA. This suggests that exposure to fine particulate matter may diminish physiological arousal, potentially corresponding to a decline in overall well-being [64]. These findings underscore the detrimental impacts of air pollution on both physiological and psychological health, reinforcing the necessity for stringent air quality regulations to safeguard public health.
Concomitantly, this study uncovers a significant positive association between negative ions and psychological well-being, lending novel empirical support to the understanding of urban forests as “urban lungs” [65]. Additionally, previous studies have quantified psychological effects to elucidate the scientific reasons behind the psychological effects of negative air ions. The findings from the young group revealed that the balance among the four basic emotions is related to the psychological effects of negative air ions. Our current study’s results are consistent with these and provide new support [66].
The integration of these findings with our earlier discussion on thermal comfort and physiological responses underscores the multifaceted nature of environmental influences on human health. It highlights the need for a holistic approach in future research to explore the complex interplay between environmental factors, psychological well-being, and physiological responses, ultimately aiming to inform strategies that foster a healthier and more vibrant urban living experience.

4.4. The Practical Significance of Urban Forest Management

Urban forests are essential to the urban ecosystem, offering not only leisure spaces but also playing a central role in climate regulation, air purification, and biodiversity conservation. The findings of this study highlight the potential of urban forests in enhancing the psycho-physiological well-being of residents and provide empirical support for the scientific management of urban forests.
The study indicates that under comfortable temperature and humidity conditions, urban forests contribute to stabilizing physiological indicators such as heart rate and electrodermal activity, thereby reducing physiological stress and improving health levels. Moreover, the positive correlation between good air quality and psychological health underscores the importance of increasing vegetation coverage and optimizing aquatic environments in urban forest management.
The impact of different types of recreational spaces on residents’ well-being varies, with forest and waterfront areas being particularly effective in boosting vitality and alleviating stress. This suggests that urban planners should consider the characteristics of these spaces to meet the diverse health needs of residents.
The study offers clear guidance for urban forest management strategies, recommending the creation of healthier green spaces through optimized spatial layouts, increased greening, and environmental quality improvements. Continuous monitoring and management adjustments ensure the maximization of the ecological service functions of urban forests.
In summary, this study reinforces the role of urban forests in promoting sustainable urban development and improving residents’ quality of life, providing urban planners and managers with a scientific basis for designing and enhancing urban forests.

4.5. Shortcomings and Prospects

While this study provides valuable insights into the impact of urban forests environments on the psychophysiology of the public, it is not without limitations. Firstly, the study sample was primarily drawn from a young university student population, which may not fully represent a broader spectrum of age and demographics groups. Future research could expand the sample scope to include individuals of varying ages, genders, and socioeconomic backgrounds to enhance the generalization of the findings.
Secondly, the study’s time-frame was relatively short-lived, leaving the long-term effects of environmental change on psycho-physiological well-being open to further investigation. Additionally, this study predominantly focused on environmental factors within urban trees. Future research could consider the influence of the surrounding environment, such as urban traffic noise and light pollution, on the microclimate of the parks.
Building upon the present study, future research could delve deeper into the relationship between environmental factors and public health across different seasons and climatic conditions. Moreover, with advancements in remote sensing technologies and wearable devices, future studies could employ more sophisticated monitoring techniques to capture continuous and granular psycho-physiological data, enabling even more profound insights.

5. Conclusions

The present study conducted an in-depth analysis of the sensory experiences of individuals within three emblematic urban forests in Fuzhou City—Jinniushan Sports Park, Fuzhou National Forest Park, and Xihu Park. This was achieved through the monitoring of thermal environments and air quality across 24 distinct sites, complemented by real-time physiological measurements and survey data from the public. The key findings are as follows:
(1)
Impact of Environmental Conditions on Physiological Indicators: A significant influence on public physiological metrics such as heart rate (HR), heart rate variability ratio (LF/HF), and electrodermal activity (EDA) was observed across different recreation place types. Woodland recreation places were particularly effective in reducing HR and enhancing the LF/HF ratio, while waterfront recreation places demonstrated a notable impact in reducing EDA.
(2)
Impact of Environmental Conditions on Psychological Indicators: Forest and waterfront recreation places significantly improved mental vitality, stress alleviation, emotional regulation, and attention restoration, outperforming those under canopies and open spaces.
(3)
The Stepwise Regression Analysis: A significant negative correlation was found between temperature and both HR and psychological indicators, suggesting that an optimal temperature range may be conducive to maintaining physiological and psychological stability. Wind speed showed a significant positive correlation with the all psychological indicators, indicating that an appropriate wind speed may foster psychological well-being. Conversely, the negative correlations observed between particulate matter, HR, and EDA suggest that increased particulate matter concentrations may lead to diminished physiological well-being. The concentration of negative oxygen ions was positively correlated with psychological indicators, implying that an increase in these ions could enhance psychological well-being.
Urban trees significantly enhance the physiological and psychological perceptions of the public, particularly woodland and waterfront recreation places, which, due to their thermal comfort and superior air quality, play a crucial role in boosting public mental vitality, alleviating stress, and restoring emotional balance and attention. Moreover, the environmental monitoring data underscore the importance of considering microclimatic regulation in the design and management of urban forests and the necessity of providing healthier and more comfortable leisure spaces for city dwellers. The findings of this study provide a scientific basis for urban planners and environmental designers to create urban forests environments that are more beneficial to the physical and mental health of the public.

Author Contributions

Conceptualization, Y.L., J.W., J.D. and Y.C.; Data curation, Y.L., J.W., Z.L. and Y.C.; Formal analysis, Y.L., J.W., Y.H., Y.T. and Y.C.; Funding acquisition, Y.L., J.W. and J.D.; Investigation, Y.L., J.W., J.Z., X.Y., Z.Z., J.D. and Y.C.; Methodology, Y.L., J.W., J.D. and Y.C.; Project administration, Y.L. and J.W.; Resources, Y.L., J.W., Z.L., J.Z., X.Y., Z.Z., J.D. and Y.C.; Software, Y.L., J.W., Y.H., Y.T., Z.L., J.Z., X.Y., Z.Z. and Y.C.; Supervision, Y.L., J.W., Y.H. and Y.T.; Validation, Y.L., J.W., Y.H., Y.T., J.Z., X.Y., Z.Z., J.D. and Y.C.; Visualization, Y.L., J.W., J.Z., X.Y. and Z.Z.; Writing—original draft, Y.L., J.W., Y.H., Y.T., Z.L. and J.D.; Writing—review and editing, Y.L., J.W., J.Z., X.Y., Z.Z., J.D. and Y.C. All authors have read and agreed to the published version of the manuscript.

Funding

This research was funded by the Education Department of Fujian Province, grant number JAT220221, and Fujian University of Technology, grant number GY-Z220213.

Data Availability Statement

The data used to support the findings of this study are available from the corresponding author upon request.

Acknowledgments

We would like to express our sincere gratitude to Beijing KingFar International Inc for their generous support through the “Scientific Research Support Program”. We are particularly grateful to the project team’s research staff for their invaluable technical support and for providing access to the ErgoLAB research equipment. Their contributions have significantly enhanced our research capabilities and have made this project possible. We are deeply appreciative of their generosity and support.

Conflicts of Interest

The authors declare no conflicts of interest.

Appendix A

Table A1. Stepwise regression analysis table.
Dependent VariableR2Independent VariableUnstandardized CoefficientsStandardized CoefficientsSig.Collinearity Statistics
BStd. ErrorBeta ToleranceVIF
EDA0.08(Constant)7.1941.138 6.323<0.001
Humidity−0.0980.02−0.205−4.86<0.0010.8391.192
PM2.5−0.0240.008−0.128−3.0210.0030.8391.192
HR0.118(Constant)6.4317.51 0.8560.392
PM2.5−0.3860.06−0.539−6.455<0.0010.2074.83
Humidity0.4620.0930.2554.951<0.0010.5451.834
Temperature−1.1270.386−0.229−2.9190.0040.2354.26
Wind speed11.6945.8930.0821.9840.0480.841.19
LF/HF0.019(Constant)−15.1514.775 −3.1730.002
Temperature0.7970.230.1383.4670.00111
Spiritual vitality0.035(Constant)7.1410.63 11.33<0.001
Temperature−0.1520.036−0.217−4.26<0.0010.6091.642
negative oxygen ion0.2440.0680.1723.593<0.0010.6861.459
Wind speed2.6610.8820.1313.0180.0030.8311.203
Stress relief0.063(Constant)8.050.669 12.027<0.001
negative oxygen ion0.3920.0720.2575.446<0.0010.6861.459
Temperature−0.2130.038−0.281−5.617<0.0010.6091.642
Wind speed3.3880.9360.1553.619<0.0010.8311.203
Emotional arousal0.044(Constant)7.9510.69 11.529<0.001
Temperature−0.1930.039−0.25−4.946<0.0010.6091.642
negative oxygen ion0.3070.0740.1984.142<0.0010.6861.459
Wind speed2.8780.9650.1292.9840.0030.8311.203
Attention recovery0.055(Constant)8.2190.686 11.989<0.001
Temperature−0.2150.039−0.278−5.534<0.0010.6091.642
negative oxygen ion0.3210.0740.2064.354<0.0010.6861.459
Wind speed3.6490.9590.1643.806<0.0010.8311.203

References

  1. Johnson, A.J.; Glover, T.D. Understanding urban public space in a leisure context. Leis. Sci. 2013, 35, 190–197. [Google Scholar] [CrossRef]
  2. Hong, X.; Cheng, S.; Liu, J.; Guo, L.; Dang, E.; Wang, J.; Cheng, Y. How should soundscape optimization from perceived soundscape elements in urban forests by the riverside be performed? Land 2023, 12, 1929. [Google Scholar] [CrossRef]
  3. Fu, J.C.; Wang, Y.P.; Zhou, D.A.; Cao, S.J. Impact of Urban Park Design on Microclimate in Cold Regions using newly developped prediction method. Sustain. Cities Soc. 2022, 80, 103781. [Google Scholar] [CrossRef]
  4. Milano, V.; Maisto, G.; Baldantoni, D.; Bellino, A.; Bernard, C.; Croce, A.; Dubs, F.; Strumia, S.; Cortet, J. The effect of urban park landscapes on soil Collembola diversity: A Mediterranean case study. Landsc. Urban Plan. 2018, 180, 135–147. [Google Scholar] [CrossRef]
  5. Cui, X.; Zeng, J.; Wu, J.; Chen, W. The nexus between urbanization and ecosystem services balance in China: A coupling perspective. Environ. Monit. Assess. 2024, 196, 638. [Google Scholar] [CrossRef] [PubMed]
  6. Koramaz, E.K.; Türkoglu, H. Measuring and understanding urban parks’ contribution to quality of life in istanbul. Soc. Indic. Res. 2018, 138, 335–351. [Google Scholar] [CrossRef]
  7. Zhang, C.; Su, Q.; Zhu, Y.Q. Urban park system on public health: Underlying driving mechanism and planning thinking. Front. Public Health 2023, 11, 1193604. [Google Scholar] [CrossRef]
  8. Guo, L.; Cheng, S.; Liu, J.; Wang, Y.; Cai, Y.; Hong, X. Does social perception data express the spatio-temporal pattern of perceived urban noise? A case study based on 3,137 noise complaints in Fuzhou, China. Appl. Acoust. 2022, 201, 109129. [Google Scholar] [CrossRef]
  9. Zeng, P.; Shi, D.C.; Liu, Y.Y.; Tian, T.; Che, Y.; Helbich, M. Parks may not be effective enough to improve the thermal environment in Shanghai (China) as our modified H3SFCA method suggests. Build. Environ. 2024, 253, 111291. [Google Scholar] [CrossRef]
  10. Yousofpour, Y.; Abolhassani, L.; Hirabayashi, S.; Burgess, D.; Sabouni, M.S.; Daneshvarkakhki, M. Ecosystem services and economic values provided by urban park trees in the air polluted city of Mashhad. Sustain. Cities Soc. 2024, 101, 105110. [Google Scholar] [CrossRef]
  11. Chang, C.R.; Li, M.H. Effects of urban parks on the local urban thermal environment. Urban For. Urban Gree. 2014, 13, 672–681. [Google Scholar] [CrossRef]
  12. Chen, Y.; Chen, Z.; Lin, S.; Lin, X.; Li, S.; Li, T.; Dong, J. Thermal–acoustic interaction impacts on crowd behaviors in an urban park. Forests 2023, 14, 1758. [Google Scholar] [CrossRef]
  13. Li, S.; Chen, Z.; Guo, L.; Hu, F.; Huang, Y.; Wu, D.; Wu, Z.; Hong, X. How do spatial forms influence psychophysical drivers in a campus city community life circle? Sustainability 2023, 15, 10014. [Google Scholar] [CrossRef]
  14. Darçin, M. Association between air quality and quality of life. Environ. Sci. Pollut. Res. 2014, 21, 1954–1959. [Google Scholar] [CrossRef] [PubMed]
  15. Liu, F.; Liu, J.; Zhang, Y.; Hong, S.; Fu, W.; Wang, M.; Dong, J. Construction of a cold island network for the urban heat island effect mitigation. Sci. Total Environ. 2024, 915, 169950. [Google Scholar] [CrossRef] [PubMed]
  16. Lee, P.; Park, J. An Effect of Urban Forest on Urban Thermal Environment in Seoul, South Korea, Based on Landsat Imagery Analysis. Forests 2020, 11, 630. [Google Scholar] [CrossRef]
  17. Chen, Y.; Yang, J.; Yang, R.; Xiao, X.; Xia, J. Contribution of urban functional zones to the spatial distribution of urban thermal environment. Build. Environ. 2022, 216, 109000. [Google Scholar] [CrossRef]
  18. Liu, K.; Li, J.; Sun, L.; Yang, X.; Xu, C.; Yan, G. Impact of urban forest and park on air quality and the microclimate in jinan, northern china. Atmosphere 2024, 15, 426. [Google Scholar] [CrossRef]
  19. Gillerot, L.; Rozario, K.; de Frenne, P.; Oh, R.; Ponette, Q.; Bonn, A.; Chow, W.; Godbold, D.; Steinparzer, M.; Haluza, D.; et al. Forests are chill: The interplay between thermal comfort and mental wellbeing. Landsc. Urban Plan. 2024, 242, 104933. [Google Scholar] [CrossRef]
  20. Briena, L.E.O.; Urbaneka, R.E.; Gregory, J.D. Ecological functions and human benefits of urban forests. Urban For. Urban Gree. 2022, 75, 127707. [Google Scholar]
  21. Ramon, M.; Ribeiro, A.P.; Theophilo, C.Y.S.; Moreira, E.G.; de Camargo, P.B.; de Bragança Pereira, C.A.; Saraiva, E.F.; Tavares, A.D.R.; Dias, A.G.; Ferreira, D.N.M.L. Assessment of four urban forest as environmental indicator of air quality: A study in a brazilian megacity. Urban Ecosyst. 2023, 26, 197–207. [Google Scholar] [CrossRef]
  22. Santunione, G.; Barbieri, A.; Sgarbi, E. Analysis of particulate matter (PM) trapped by four different plant species in an urban forest: Quantification and characterization. Trees For. People 2024, 16, 100585. [Google Scholar] [CrossRef]
  23. Fu, W.; Qiao, Y.; Que, C.; Chen, H.; Dang, E.; Dong, J.; Lin, S. The characteristics of ambient air quality in urban forest areas and other urban areas of Fuzhou city, China. Environ. Dev. Sustain. 2022, 24, 9500–9518. [Google Scholar] [CrossRef]
  24. Chen, Y.; Liu, F.; Lin, X.; Liu, J.; Chen, Z.; Shi, K.; Li, J.; Dong, J. Combined Effects of the Thermal-Acoustic Environment on Subjective Evaluations in Urban Park Based on Sensory-Walking. Forests 2023, 14, 1161. [Google Scholar] [CrossRef]
  25. Roos, A.; Goetz, T.; Krannich, M.; Donker, M.; Bieleke, M.; Caltabiano, A.; Mainhard, T. Control, anxiety and test performance: Self-Reported and physiological indicators of anxiety as mediators. Br. J. Educ. Psychol. 2023, 93, 72–89. [Google Scholar] [CrossRef]
  26. Holm, S.K.; Kaakinen, J.K.; Forsström, S.; Surakka, V. Self-reported playing preferences resonate with emotion-related physiological reactions during playing and watching of first-person shooter videogames. Int. J. Hum. Comput. St. 2021, 155, 102690. [Google Scholar] [CrossRef]
  27. Lee, J.; Park, B.J.; Ohira, T.; Kagawa, T.; Miyazaki, Y. Acute effects of exposure to a traditional rural environment on urban dwellers: A crossover field study in terraced farmland. Int. J. Environ. Res. Public Health 2015, 12, 1874–1893. [Google Scholar] [CrossRef]
  28. Masullo, M.; Toma, R.A.; Maffei, L. Effects of Industrial Noise on Physiological Responses. Acoustics 2022, 4, 733–745. [Google Scholar] [CrossRef]
  29. Roy, H.; Wasylyshyn, N.; Spangler, D.P.; Gamble, K.R.; Patton, D.; Brooks, J.R.; Garcia, J.O.; Vettel, J.M. Linking emotional reactivity between laboratory tasks and immersive environments using behavior and physiology. Front. Hum. Neurosci. 2019, 13, 54. [Google Scholar] [CrossRef]
  30. El Boussaki, H.; Latif, R.; Saddik, A. A review on Video-Based heart rate, respiratory rate and blood pressure estimation. In International Conference of Machine Learning and Computer Science Applications; Springer: Berlin/Heidelberg, Germany, 2023; pp. 129–140. [Google Scholar]
  31. Hatch, J.; Austin, B.; Magee, L.; Zabel, M.; Mccoy, M.; Bunten, L.; Gosch, K.; Magalski, A. Differences in resting heart rate among trained collegiate athletes. Circ. Cardiovasc. Qual. Outcomes 2013, 6, A311. [Google Scholar] [CrossRef]
  32. Pinto, G.S.M.; Abrantes, C.; Brito, J.P.; Novaes, J.S.; Monteiro, M.D.; Reis, V.M. Oxygen uptake, heart rate and energy expenditure during slideboard routines at different cadence. J. Sports Med. Phys. Fit. 2010, 50, 126–131. [Google Scholar]
  33. Bradley, M.M.; Cuthbert, B.N.; Lang, P.J. Startle reflex modification: Emotion or attention? Psychophysiology 1990, 27, 513–522. [Google Scholar] [CrossRef] [PubMed]
  34. Qin, H.; Vaquerizo-Villar, F.; Steenbergen, N.; Kraemer, J.F.; Penzel, T. ECG and heart rate variability in Sleep-Related breathing disorders. In Advances in the Diagnosis and Treatment of Sleep Apnea: Filling the Gap between Physicians and Engineers; Springer: Berlin/Heidelberg, Germany, 2022; pp. 159–183. [Google Scholar]
  35. Hejjel, L.; Gál, I. Heart rate variability analysis. Acta Physiol. Hung. 2001, 88, 219–230. [Google Scholar] [CrossRef]
  36. Sacha, J.; Barabach, S.; Statkiewicz-Barabach, G.; Sacha, K.; Müller, A.; Piskorski, J.; Barthel, P.; Schmidt, G. Gender differences in the interaction between heart rate and its variability—How to use it to improve the prognostic power of heart rate variability? Int. J. Cardiol. 2014, 17, e42–e45. [Google Scholar] [CrossRef]
  37. De Marinis, M.; Strano, S.; Granata, M.; Urani, C.; Lino, S.; Calcagnini, G.; Di Virgilio, V.; Calcagnini, G. Sympathetic-parasympathetic activation during spontaneous attacks of cluster headache: Evaluation by spectral analysis of heart-rate fluctuations. Cephalalgia 1995, 15, 504–510. [Google Scholar] [CrossRef]
  38. Farah, B.Q.; Barros, M.V.G.; Balagopal, B.; Ritti-Dias, R.M. Heart rate variability and cardiovascular risk factors in adolescent boys. J. Pediatr. 2014, 165, 945–950. [Google Scholar] [CrossRef]
  39. Zhao, D.; Boey, L.; Weltens, N.; Biesiekierski, J.R.; Iven, J.; Depoortere, I.; Tack, J.; Van Oudenhove, L. Influence of subliminal intragastric fatty acid infusion on subjective and physiological responses to positive emotion induction in healthy women: A randomized trial. Psychoneuroendocrinology 2019, 108, 43–52. [Google Scholar] [CrossRef]
  40. Mathersul, D.C.; Dixit, K.; Schulz-Heik, R.J.; Avery, T.J.; Zeitzer, J.M.; Bayley, P.J. Emotion dysregulation and heart rate variability improve in US veterans undergoing treatment for posttraumatic stress disorder: Secondary exploratory analyses from a randomised controlled trial. BMC Psychiatry 2022, 22, 268. [Google Scholar] [CrossRef]
  41. Shiga, K.; Izumi, K.; Minato, K.; Sugio, T.; Yoshimura, M.; Kitazawa, M.; Hanashiro, S.; Cortright, K.; Kurokawa, S.; Momota, Y.; et al. Subjective well-being and month-long LF/HF ratio among deskworkers. PLoS ONE 2021, 16, e257062. [Google Scholar] [CrossRef]
  42. Arakaki, X.; Arechavala, R.J.; Choy, E.H.; Bautista, J.; Bliss, B.; Molloy, C.; Wu, S.; Shimojo, S.; Jiang, Y.; Kleinman, M.T.; et al. The connection between heart rate variability (HRV), neurological health, and cognition: A literature review. Front. Neurosci. 2023, 17, 1055445. [Google Scholar] [CrossRef]
  43. Peter, C.; Herbon, A. Emotion representation and physiology assignments in digital systems. Interact. Comput. 2006, 18, 139–170. [Google Scholar] [CrossRef]
  44. Yang, K.; Wang, C.; Gu, Y.; Sarsenbayeva, Z.; Tag, B.; Dingler, T.; Wadley, G.; Goncalves, J. Behavioral and physiological Signals-Based deep multimodal approach for mobile emotion recognition. IEEE Trans. Affect. Comput. 2023, 14, 1082–1097. [Google Scholar] [CrossRef]
  45. Song, C.; Ikei, H.; Igarashi, M.; Miwa, M.; Miyazaki, Y. Physiological and psychological responses of young males during spring-time walks in urban parks. J. Physiol. Anthropol. 2014, 33, 8. [Google Scholar] [CrossRef] [PubMed]
  46. Quanxing, X.; Hu, S.; Bin, G.; Jinfeng, Z. The satisfaction of free park visitors in xi’an based on fuzzy comprehension evaluation. Resour. Sci. 2014, 36, 1645–1651. [Google Scholar]
  47. Shao, T.; Yang, P.; Jiang, H.; Shao, Q. An analysis of public service satisfaction of tourists at scenic spots: The case of xiamen city. Sustainability 2023, 15, 2752. [Google Scholar] [CrossRef]
  48. Bssing, A.; Ostermann, T.; Matthiessen, P.F. Distinct expressions of vital spirituality: The ASP questionnaire as an explorative research tool. J. Relig. Health 2007, 46, 267–286. [Google Scholar] [CrossRef]
  49. Dong, Y.; Li, Y.; Xiang, X.; Xiao, Z.; Hu, J.; Li, Y.; Li, H.; Hu, H. Stress relief as a natural resilience mechanism against depression-like behaviors. Neuron 2023, 111, 3789–3801. [Google Scholar] [CrossRef]
  50. Caruelle, D.; Shams, P.; Gustafsson, A.; Lervik-Olsen, L. Emotional arousal in customer experience: A dynamic view. J. Bus. Res. 2024, 170, 114344. [Google Scholar] [CrossRef]
  51. Fang, Z.; Xu, H.; Tao, L.; Tan, Y.; Li, Y.; Wu, J. Effects of volume ratio, layout and leave size of indoor plants on workers’ attention recovery in factory staff break area. Buildings 2023, 13, 622. [Google Scholar] [CrossRef]
  52. Kaplan, R.; Kaplan, S. Humanscape: Environments for People; Michigan Publishing: Ann Arbor, MI, USA, 1982. [Google Scholar]
  53. Ormandy, D.; Ezratty, V. Health and thermal comfort: From WHO guidance to housing strategies. Energy Policy 2012, 49, 116–121. [Google Scholar] [CrossRef]
  54. Krzyzanowski, M.; Cohen, A. Update of WHO air quality guidelines. Air Qual. Atmos. Health 2008, 1, 7–13. [Google Scholar] [CrossRef]
  55. Fleming, A.; Steenberg, J. The equity of urban forest change and frequency in Toronto, ON. Urban For. Urban Green. 2023, 90, 128153. [Google Scholar] [CrossRef]
  56. Fan, X.; Liu, W.; Wargocki, P. Physiological and psychological reactions of sub-tropically acclimatized subjects exposed to different indoor temperatures at a relative humidity of 70%. Indoor Air 2019, 29, 215–230. [Google Scholar] [CrossRef] [PubMed]
  57. Mei, X. An Experimental Study of the Effect of Air Humidity on Human Thermal Comfort. Master’s Thesis, Chongqing University, Chongqing, China, 2013. [Google Scholar] [CrossRef]
  58. Coccolo, S.; Mauree, D.; Naboni, E.; Kaempf, J.; Scartezzini, J.L. On the impact of the wind speed on the outdoor human comfort: A sensitivity analysis. Energy Procedia 2017, 122, 481–486. [Google Scholar] [CrossRef]
  59. Cheng, V.; Ng, E.; Chan, C.; Givoni, B. Outdoor thermal comfort study in a sub-tropical climate: A longitudinal study based in Hong Kong. Int. J. Biometeorol. 2012, 56, 43–56. [Google Scholar] [CrossRef] [PubMed]
  60. Park, B.; Furuya, K.; Kasetani, T.; Takayama, N.; Kagawa, T.; Miyazaki, Y. Relationship between psychological responses and physical environments in forest settings. Landsc. Urban Plan. 2011, 102, 24–32. [Google Scholar] [CrossRef]
  61. Carrus, G.; Scopelliti, M.; Lafortezza, R.; Colangelo, G.; Ferrini, F.; Salbitano, F.; Agrimi, M.; Portoghesi, L.; Sernenzato, P.; Sanesi, G. Go greener, feel better? The positive effects of biodiversity on the well-being of individuals visiting, urban and peri-urban green areas. Landsc. Urban Plan. 2015, 134, 221–228. [Google Scholar] [CrossRef]
  62. Beery, T.; Jönsson, K.I.; Elmberg, J. From environmental connectedness to sustainable futures: Topophilia and human affiliation with nature. Sustainability 2015, 7, 8837–8854. [Google Scholar] [CrossRef]
  63. Yu, C.Y.; Chen, Y.H.; Chang, C.Y.; Lin, Y.H.; Lin, W.H.; Chen, C.C.; Hsu, H.F. Psychological and physiological benefits to various agricultural recreation landscape types. Hualien Dist. Agric. Improv. Farm Res. Rep. Engl. Summ. Version 2018, 2, 91. [Google Scholar]
  64. Neale, C.; Hoffman, J.; Jefferson, D.; Gohlke, J.; Boukhechba, M.; Mondschein, A.; Wang, S.; Roe, J. The impact of urban walking on psychophysiological wellbeing. Cities Health 2022, 6, 1053–1066. [Google Scholar] [CrossRef]
  65. Xing, Y.; Brimblecombe, P. Trees and parks as “the lungs of cities”. Urban For. Urban Gree. 2020, 48, 126552. [Google Scholar] [CrossRef]
  66. Nakaya, J.; Agishi, Y.; Ohtsuka, Y.; Takahashi, S.; Sakamoto, W.; Iwasaki, T. Emotional effect of excessive negative air ions to human emotion spectrum. J. Jpn. Soc. Balneol. Climatol. Phys. Med. 2002, 231–238. [Google Scholar] [CrossRef]
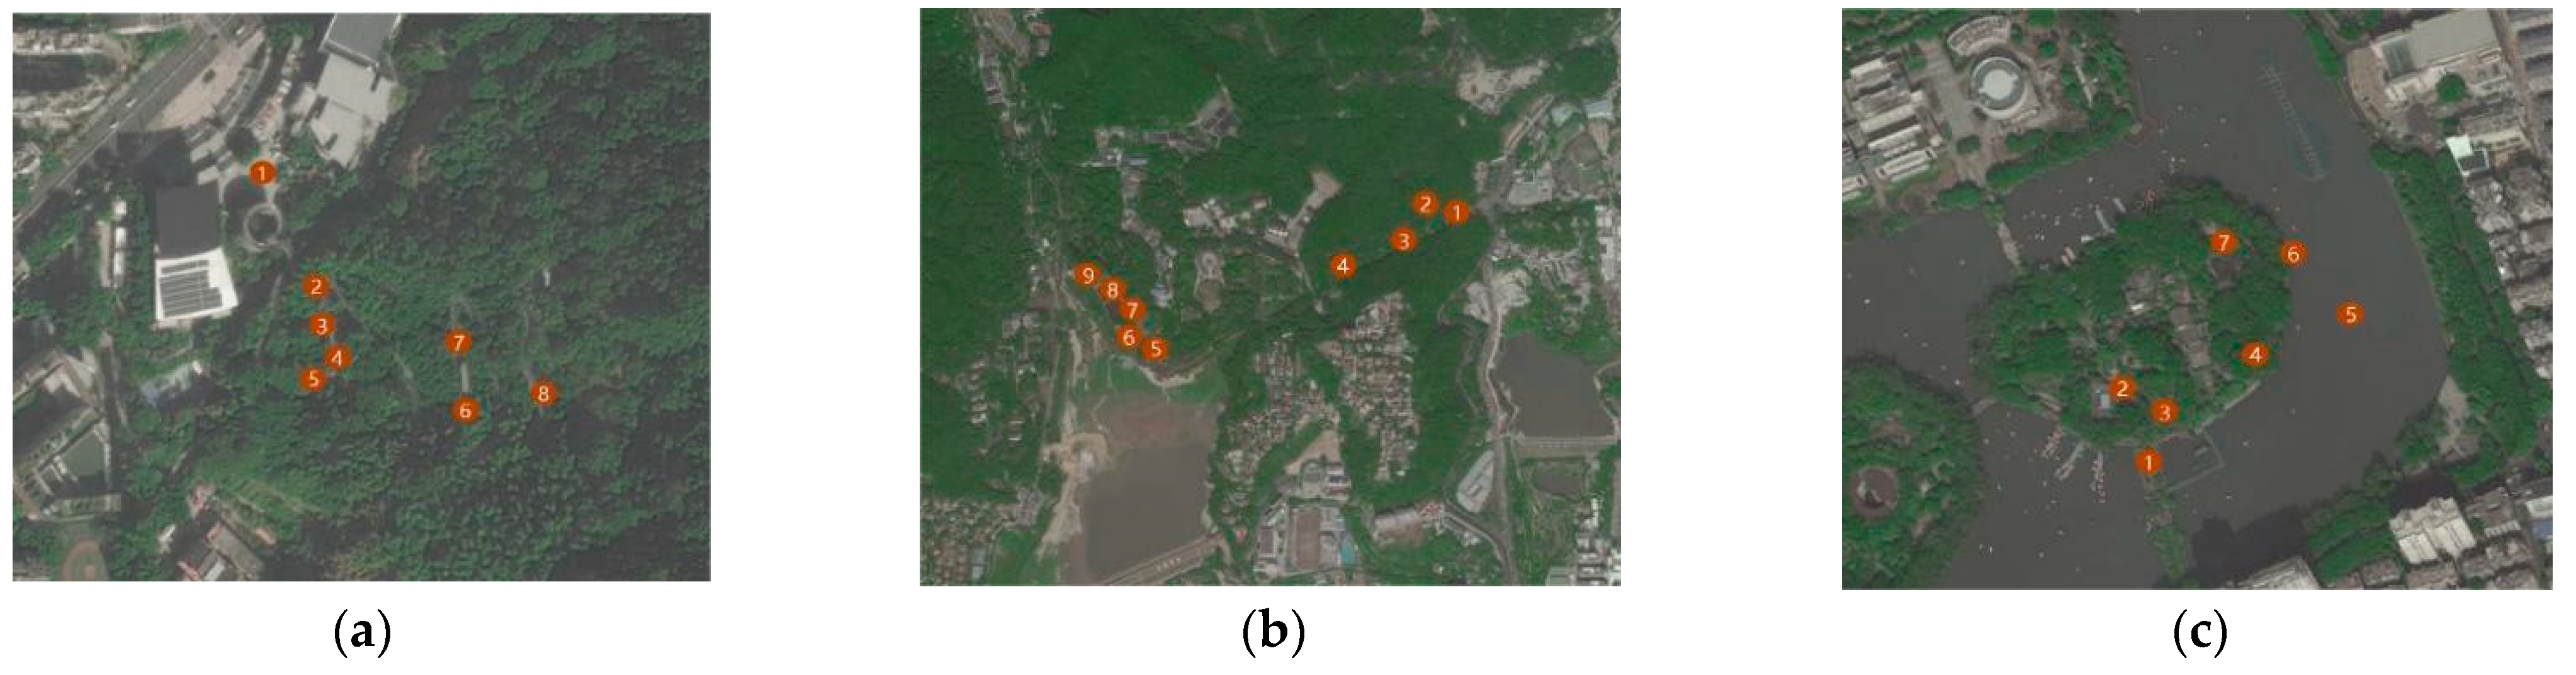
Figure 1. (a) Location of Fujian Province in China map; (b) Location of Fuzhou City in Fujian map; (c) Study site selection of urban forests in Fuzhou.
Forests 15 01640 g001
Figure 2. (a) Study site selection of Jinniushan Sports Park. (b) Study site selection of Fuzhou National Forest Park. (c) Study site selection of Xihu Park.
Forests 15 01640 g002
Figure 3. (a) Plots of Jinniushan Sports Park. (b) Plots of Fuzhou National Forest Park. (c) Plots of Xihu Park.
Forests 15 01640 g003
Figure 4. Procedure.
Forests 15 01640 g004
Figure 5. Variance of HR in different types of recreation places. Different lowercase letters (a,b) represent significant differences in HR variation between different recreation places (p < 0.05).
Forests 15 01640 g005
Figure 6. Variance of HR in different types of recreation places in parks. Different lowercase letters (a–c) represent significant differences in HR variation between different recreation places (p < 0.05).
Forests 15 01640 g006
Figure 7. Variance of LF/HF in different types of recreation places. Different lowercase letters (a,b) represent significant differences in LF/HF variation between different recreation places (p < 0.05).
Forests 15 01640 g007
Figure 8. Variance of LF/HF in different types of recreation places in parks. Different lowercase letters (a–c) represent significant differences in LF/HF variation between different recreation places (p < 0.05).
Forests 15 01640 g008
Figure 9. Variance of EDA in different types of recreation places. Different lowercase letters (a,b) represent significant differences in EDA variation between different recreation places (p < 0.05).
Forests 15 01640 g009
Figure 10. Variance of EDA in different types of recreation places in parks. Different lowercase letters (a–c) represent significant differences in EDA variation between different recreation places (p < 0.05).
Forests 15 01640 g010
Figure 11. Spiritual vitality of different recreation places. Different lowercase letters (a,b) represent significant differences in spiritual vitality between different recreation places (p < 0.05).
Forests 15 01640 g011
Figure 12. Spiritual vitality of different recreation places in parks. Different lowercase letters (a–c) represent significant differences in spiritual vitality between different recreation places (p < 0.05).
Forests 15 01640 g012
Figure 13. Stress relief in different recreation places. Different lowercase letters (a,b) represent significant differences in stress relief between different recreation places (p < 0.05).
Forests 15 01640 g013
Figure 14. Stress relief in different recreation places in parks. Different lowercase letters (a–c) represent significant differences in stress relief between different recreation places (p < 0.05).
Forests 15 01640 g014
Figure 15. Emotional arousal in different recreation places. Different lowercase letters (a,b) represent significant differences in emotional arousal between different recreation places (p < 0.05).
Forests 15 01640 g015
Figure 16. Emotional arousal in different recreation places in parks. Different lowercase letters (a–c) represent significant differences in emotional arousal between different recreation places (p < 0.05).
Forests 15 01640 g016
Figure 17. Attention recovery in different recreation places. Different lowercase letters (a,b) represent significant differences in attention recovery between different recreation places (p < 0.05).
Forests 15 01640 g017
Figure 18. Attention recovery in different recreation places in parks. Different lowercase letters (a–c) represent significant differences in attention recovery between different recreation places (p < 0.05).
Forests 15 01640 g018
Figure 19. (a) The current situation survey of Jinniushan Sports Park. (b) The current situation survey of Fuzhou National Forest Park. (c) The current situation survey of Xihu Park.
Forests 15 01640 g019aForests 15 01640 g019b
Table 1. Classification of recreation place types.
Jinniushan Sports ParkFuzhou National Forest ParkXihu Park
OverviewDefined by its rolling landscape and scenic beauty, it stands as the largest community-based semi-hilly sports park in downtown Fuzhou, acting as the gateway at Fudao Gate 3.Fuzhou National Forest Park, alternatively referred to as “Fuzhou Botanical Garden”, is the premier national-level forest park in Fujian Province, ranking among China’s top ten forest parks and is one of the six 4A-rated tourist attractions in the Fuzhou region. The park’s comprehensive planning extends over an area of 2891.3 hm2, with a watershed covering 13 km2.Situated in the northwest sector of Gulou District within Fuzhou City, near the city’s core, the existing land coverage amounts to 42.51 hm2, with terrestrial space constituting 12.21 hm2 and water bodies encompassing 30.3 hm2.
Open recreation placeS1, S5F1, F3, F7X2, X3
Forest recreation placeS3, S4F4, F9X4, X7
Waterfront recreation place-F5, F6, F8X1, X5, X6
Canopy recreation placeS2, S6, S7, S8--
Table 2. Introduction to the instrument parameters of the mobile weather station.
Measurement IndexMeasuring Range PrecisionResponse Time
PM2.50–999 μg/m3±10%≤60 s
PM100–1500 μg/m3±10%≤60 s
CO2400–60,000 ppm±50 ppm ± 3% current reading<60 s
H2S0–100 ppm0.70 ± 0.15 ppm ≤30 s
O20~25% Vol.At 5%CO2, percent change/CO2 concentration 0.1<15 s
SO20–10 ppm 0.75 ± 0.15 ppm<30 s
Air temperature −40–80 °C±3%≤60 s
Air humidity0–100%RH±3%≤60 s
Illuminance 0–65,535 Lux/0–200 k Lux±5% (25 °C) ≤60 s
Atmospheric pressure30 kPa~120 kPa 700~ 100 millibar (−1.5~+1.5)≤5 s
Wind speed0~60 m/s±0.3 m/s≤0.5 s
Wind direction 8 directions ≤0.5 s
Ultraviolet ray0–3280 w/m25 μW/cm2≥125 ms
Table 3. Basic significance of psychological indicators.
Psychological IndicatorsBasic Significance
Spiritual vitalityThe mental vitality of the individual in the environment [48].
Stress reliefIndividuals can release effective pressure in their environment [49].
Emotional arousalSubsequent to their exposure to the specified environment, individuals experience a reduction and release of negative emotions like anxiety, resulting in a stabilization of their emotional condition [50].
Attention recoveryNatural environments facilitate the restoration of attentional resources in the human brain and possess the ability to promote positive emotions, alleviate stress, and mitigate mental fatigue. Natural spatial environments that adhere to the four fundamental characteristics of being away, rich, engaging, and compatible possess attention restoration capabilities [51].
Table 4. Environment condition of sample sites.
Park NamePlot NumberTemperature
(°C)
Humidity
(%)
Wind Speed
(m/s)
PM2.5
(μg/m³)
PM10
(μg/m³)
Negative Oxygen Ion
(ions/cm³)
Jinniushan Sports ParkS122.1557.280.0430.1932.581.92
S219.5151.180.0118.9721.472.41
S319.2951.310.0718.4320.743.18
S419.0752.450.0520.0221.633.71
S521.0262.790.0328.7830.832.91
S619.0450.490.0319.5121.092.54
S719.2951.210.0119.4221.172.60
S822.3348.720.1419.6921.431.87
Fuzhou National Forest ParkF121.9160.880.0315.6716.832.76
F222.0061.780.0815.1716.264.20
F322.0461.610.1814.9615.913.55
F422.2960.960.0715.2716.313.89
F522.2859.330.0915.1916.142.48
F622.3760.310.1215.0016.052.74
F722.3261.170.1514.7615.692.78
F822.3859.750.1414.9415.922.41
F922.0360.610.1515.1716.113.89
Xihu ParkX118.3164.160.1240.5441.891.50
X218.5663.220.0243.4244.582.04
X318.6264.050.0042.5743.891.94
X418.7562.560.0342.2543.112.15
X518.6062.690.2144.8045.640.96
X618.5562.610.1542.0143.221.46
X718.4463.070.0540.8542.082.16
Table 5. Standardized regression coefficients of thermal environment and air quality indicators on physiological and psychological indicators.
Physiology/Psychology ResponseTemperatureHumidityWind SpeedPM2.5Negative Oxygen IonR2
HR−1.127 **0.462 ***11.694 **−0.386 ***-0.118
LF/HF0.797 ***----0.019
EDA-−0.098 ***-−0.024 **-0.080
Spiritual vitality−0.152 ***-2.661 **-0.244 ***0.035
Stress relief−0.213 ***-3.388 ***-0.392 ***0.063
Emotional arousal−0.193 ***-2.878 **-0.307 ***0.044
Attention recovery−0.215 ***-3.649 ***-0.321 ***0.055
Note: ** and *** denote p < 0.01 and p < 0.001, respectively. - indicates that the thermal environment and air quality had no significant relationship with physiological and psychological indicators.
Disclaimer/Publisher’s Note: The statements, opinions and data contained in all publications are solely those of the individual author(s) and contributor(s) and not of MDPI and/or the editor(s). MDPI and/or the editor(s) disclaim responsibility for any injury to people or property resulting from any ideas, methods, instructions or products referred to in the content.

