Article

Spatiotemporal Changes in Vegetation Cover during the Growing Season and Its Implications for Chinese Grain for Green Program in the Luo River Basin

1
School of Surveying and Land Information Engineering, Henan Polytechnic University, Jiaozuo 454003, China
2
Research Centre of Arable Land Protection and Urban-Rural High-Quality Development of Yellow River Basin, Henan Polytechnic University, Jiaozuo 454003, China
3
School of Resources and Environment, Henan Polytechnic University, Jiaozuo 454003, China
*
Authors to whom correspondence should be addressed.
Forests 2024, 15(9), 1649; https://doi.org/10.3390/f15091649
Submission received: 21 August 2024 / Revised: 9 September 2024 / Accepted: 14 September 2024 / Published: 19 September 2024
(This article belongs to the Special Issue Application of Remote Sensing in Vegetation Dynamic and Ecology)

Abstract

:
The Grain for Green Program (GFGP) plays a critical role in enhancing watershed vegetation cover. Analyzing changes in vegetation cover provides significant practical value in guiding ecological conservation and restoration in vulnerable regions. This study utilizes MOD13Q1 NDVI data to construct the Kernel Normalized Difference Vegetation Index (kNDVI) and analyzes the spatiotemporal evolution and future trends of vegetation cover from 2000 to 2020, covering key periods of the GFGP. The study innovatively combines the optimal parameter geographic detector with constraint lines to comprehensively reveal the nonlinear constraints, intensities, and critical thresholds imposed by various driving factors on the kNDVI. The results indicate that the following: (1) The vegetation cover of the Luo River Basin increased significantly between 2000 and 2020, with a noticeable increase in the percentage of high-quality vegetation. Spatially, the vegetation cover followed a pattern of being “high in the southwest and low in the northeast”, with 73.69% of the region displaying improved vegetation conditions. Future vegetation degradation is predicted to threaten 59.40% of the region, showing a continuous or future declining trend. (2) The primary driving factors for changes in the vegetation cover are evapotranspiration, elevation, population density, and geomorphology type, with temperatures and GDP being secondary factors. Dual-factor enhancement or nonlinear enhancement was observed in interactions among the factors, with evapotranspiration and population density having the largest interaction (q = 0.76). (3) The effects of driving factors on vegetation exhibited various patterns, with thresholds existing for the hump-shaped and concave-waved types. The stability of the kNDVI in 40.23% of the areas showed moderate to high fluctuations, with the most significant fluctuations observed in low-altitude and high-temperature areas, as well as those impacted by dense human activities. (4) By overlaying the kNDVI classifications on the GFGP areas, priority reforestation areas totaling 68.27 km2 were identified. The findings can help decisionmakers optimize the next phase of the GFGP and in effective regional ecological management.

1. Introduction

Vegetation, as an important component of ecosystems, significantly regulates the exchange of carbon, water, and energy between the land and the atmosphere [1]. It has a significant impact on modulating regional and global climates, preserving ecological balance and ensuring the sustainability of water resources. The dynamic change in vegetation cover can not only reveal in-depth the comprehensive impact of natural processes and human activities on the ecosystem environment. The intricate relationships between human activity and natural processes in the ecosystem are profoundly revealed by dynamic changes in vegetation cover [2] but also provide an essential scientific foundation for assessing environmental conditions, predicting climate change, and formulating strategies for environmental protection and restoration. The influences of ecological restoration projects, extreme climate events, and land degradation processes can all lead to changes in vegetation status [3,4]. Issues such as vegetation degradation, soil erosion, and water pollution not only affect the stability of the ecological environment but also pose serious threats to agricultural production and the sustainable development of the economy and society [5,6]. The Sustainable Development Goals (SDGs) of the United Nations explicitly emphasize the protection of terrestrial ecosystems, sustainable forest management, and restoration of degraded lands, providing clear policy directions to governments and international organizations. Monitoring changes in vegetation cover and promoting vegetation cover protection are essential requirements for global sustainable development. Protecting vegetation cover is crucial for combating climate change, pollution, and preserving biodiversity. By formulating and implementing forest conservation policies and promoting afforestation initiatives, we can increase vegetation cover and improve its overall quality. The Grain for Green Program (GFGP), as a systematic project aimed at promoting ecological protection and environmental restoration, enhances forest and grassland vegetation coverage by strategically and gradually converting severely eroded sloping farmland and implementing targeted restoration measures based on land suitability and species adaptability [7]. As a result of this project, vegetation cover has significantly improved and been restored [8,9,10]. Consequently, under the implementation of the GFGP, systematically monitoring the state of vegetation and thoroughly analyzing its spatiotemporal dynamics and driving mechanisms are crucial for developing strategies to prevent degradation and promote vegetation restoration. These efforts are essential to advance ecological protection, preserve biodiversity, and ensure sustainable development.
The Normalized Difference Vegetation Index (NDVI), with its wide monitoring range and excellent precision, has become a key indicator for assessing long-term vegetation dynamics. Jiang et al. [11] analyzed the temporal and spatial development of ecological environments in China on multiple scales using NDVI time series data. Li et al. [12] quantitatively assessed the spatiotemporal trends in the NDVI in South China and examined how it changed in response to different meteorological conditions. Lu et al. [13] investigated the spatiotemporal responses of vegetation to climatic factors, such as temperature, precipitation, and sunshine hours, along the Yellow River. In the Shengli mining area of Xilinhot City, Inner Mongolia, Xing et al. [14] examined long-term variations in vegetation cover and the factors that influence it. The NDVI has been extensively used to investigate vegetation changes and the factors that influence them on different geographic scales according to a review of relevant studies. However, it is limited by its nonlinear saturation relationship with green biomass and its ability to respond only to the presence of green vegetation, without directly representing photosynthesis itself [15]. In contrast, the Kernel Normalized Difference Vegetation Index (kNDVI) effectively overcomes the limitations of the NDVI and the near-infrared reflectance of terrestrial vegetation indexes in handling saturation and mixed-pixel issues under various environmental conditions [16]. This advancement broadens the scope of vegetation monitoring, demonstrating increased noise resistance and stability. Research by Chen et al. [17], Gu et al. [18], and Wang et al. [4] further confirms the ability of the kNDVI to accurately reflect vegetation cover dynamics in both natural and agricultural systems, particularly demonstrating significant advantages in resisting saturation effects, bias interference, and complex phenological changes. Therefore, this study selected the kNDVI as the key indicator to assess vegetation changes to deepen our understanding of vegetation dynamics.
Previous research has primarily concentrated on the climatic factors that influence vegetation changes [19,20], while nonclimatic factors such as topography and human activities have undergone less investigation [21,22]. A thorough evaluation of the complex effects of various driving factors on the kNDVI is desperately needed to effectively address the challenges raised by natural and anthropogenic activities. Currently, methods used to analyze such impacts include traditional linear regression, correlation analysis, random forests, and geographic detectors [3,23,24,25]. Among these, geographical detectors are widely used to identify driving factors of the NDVI in various geographical regions, including the Yellow River Basin [26], Loess Plateau [9], Qianxinan Prefecture [8], the Minjiang River Basin [18], the Tibetan Plateau [19], and Central Asia [23]. Song et al. [27] introduced the Optimal Parameter Geographic Detector (OPGD), which reduces human intervention errors by optimizing the combinations of discretization parameters of continuous variables. This method precisely quantifies the effects of individual and interactive factors on the change in vegetation cover. However, while constraint analysis can explore the nonlinear interdependencies among variables, traditional methods such as linear regression often overlook threshold effects and nonlinear relationships among variables [28,29]. Given the multifactorial influences on the kNDVI changes, this study innovatively combines OPGD with constraint line analysis to investigate nonlinear constraints between driving factors and the kNDVI. In addition, it considers the variability in the distribution of the vegetation index within key factor zones, providing a new perspective to uncover the complex mechanisms underlying the effects of driving factors on vegetation growth. Identification of priority reforestation areas is based on a scientific assessment of the ecological condition of the watershed, which helps identify regions in urgent need of reforestation and ensures that limited resources are allocated to areas requiring the most protection. The implementation of reforestation projects and the identification of priority reforestation areas also represent a proactive response and a concrete practice toward acheiving the Sustainable Development Goals (SDGs) of the United Nations. These efforts contribute to the restoration and protection of the ecological environment and help build a greener, more sustainable future.
One of the largest forest ecosystems in northern China, the Luo River Basin, is the source of a tributary of the Yellow River [30]. Large-scale ecological restoration projects centered on afforestation and reforestation (including grassland restoration) have been carried out in the Yellow River Basin since 1999. These projects have significantly increased vegetation cover, effectively curbed soil erosion, and greatly improved environmental conditions in ecologically fragile areas within the basin [31,32,33]. The “General Plan for Major Ecological System Protection and Restoration Projects (2021–2035)” states that further development of the GFGP is necessary for the Luo River Basin, as it is a crucial region for ecological restoration in the lower reaches of the Yellow River. The topography of the watershed is dominated by mountains, with forests largely distributed in high-altitude regions, which has increased vegetation coverage in the Luo River Basin. Furthermore, the implemented soil and water conservation measures have contributed significantly to controlling soil erosion and maintaining soil fertility, thus guiding the strengthening of ecological environment protection and management in the basin.
This study focuses on the Luo River Basin and analyzes the spatiotemporal evolution characteristics and future vegetation coverage trends using a long-term kNDVI dataset along with the Theil–Sen (Sen) trend analysis, Mann–Kendall (MK) significance testing, and Hurst index methods. This study quantifies the contributions of driving factors in vegetation changes and reveals the nonlinear constraints between kNDVI and its driving factors by combining the OPGD with an analysis of the constraint line. Finally, priority areas for reforestation are identified to guide the implementation of reforestation projects. The purpose of the research is to investigate the state and efficacy of vegetation restoration in the Luo River Basin, providing a strong scientific foundation for the development of regional ecological protection strategies and the improvement in vegetation management.

2. Materials and Methods
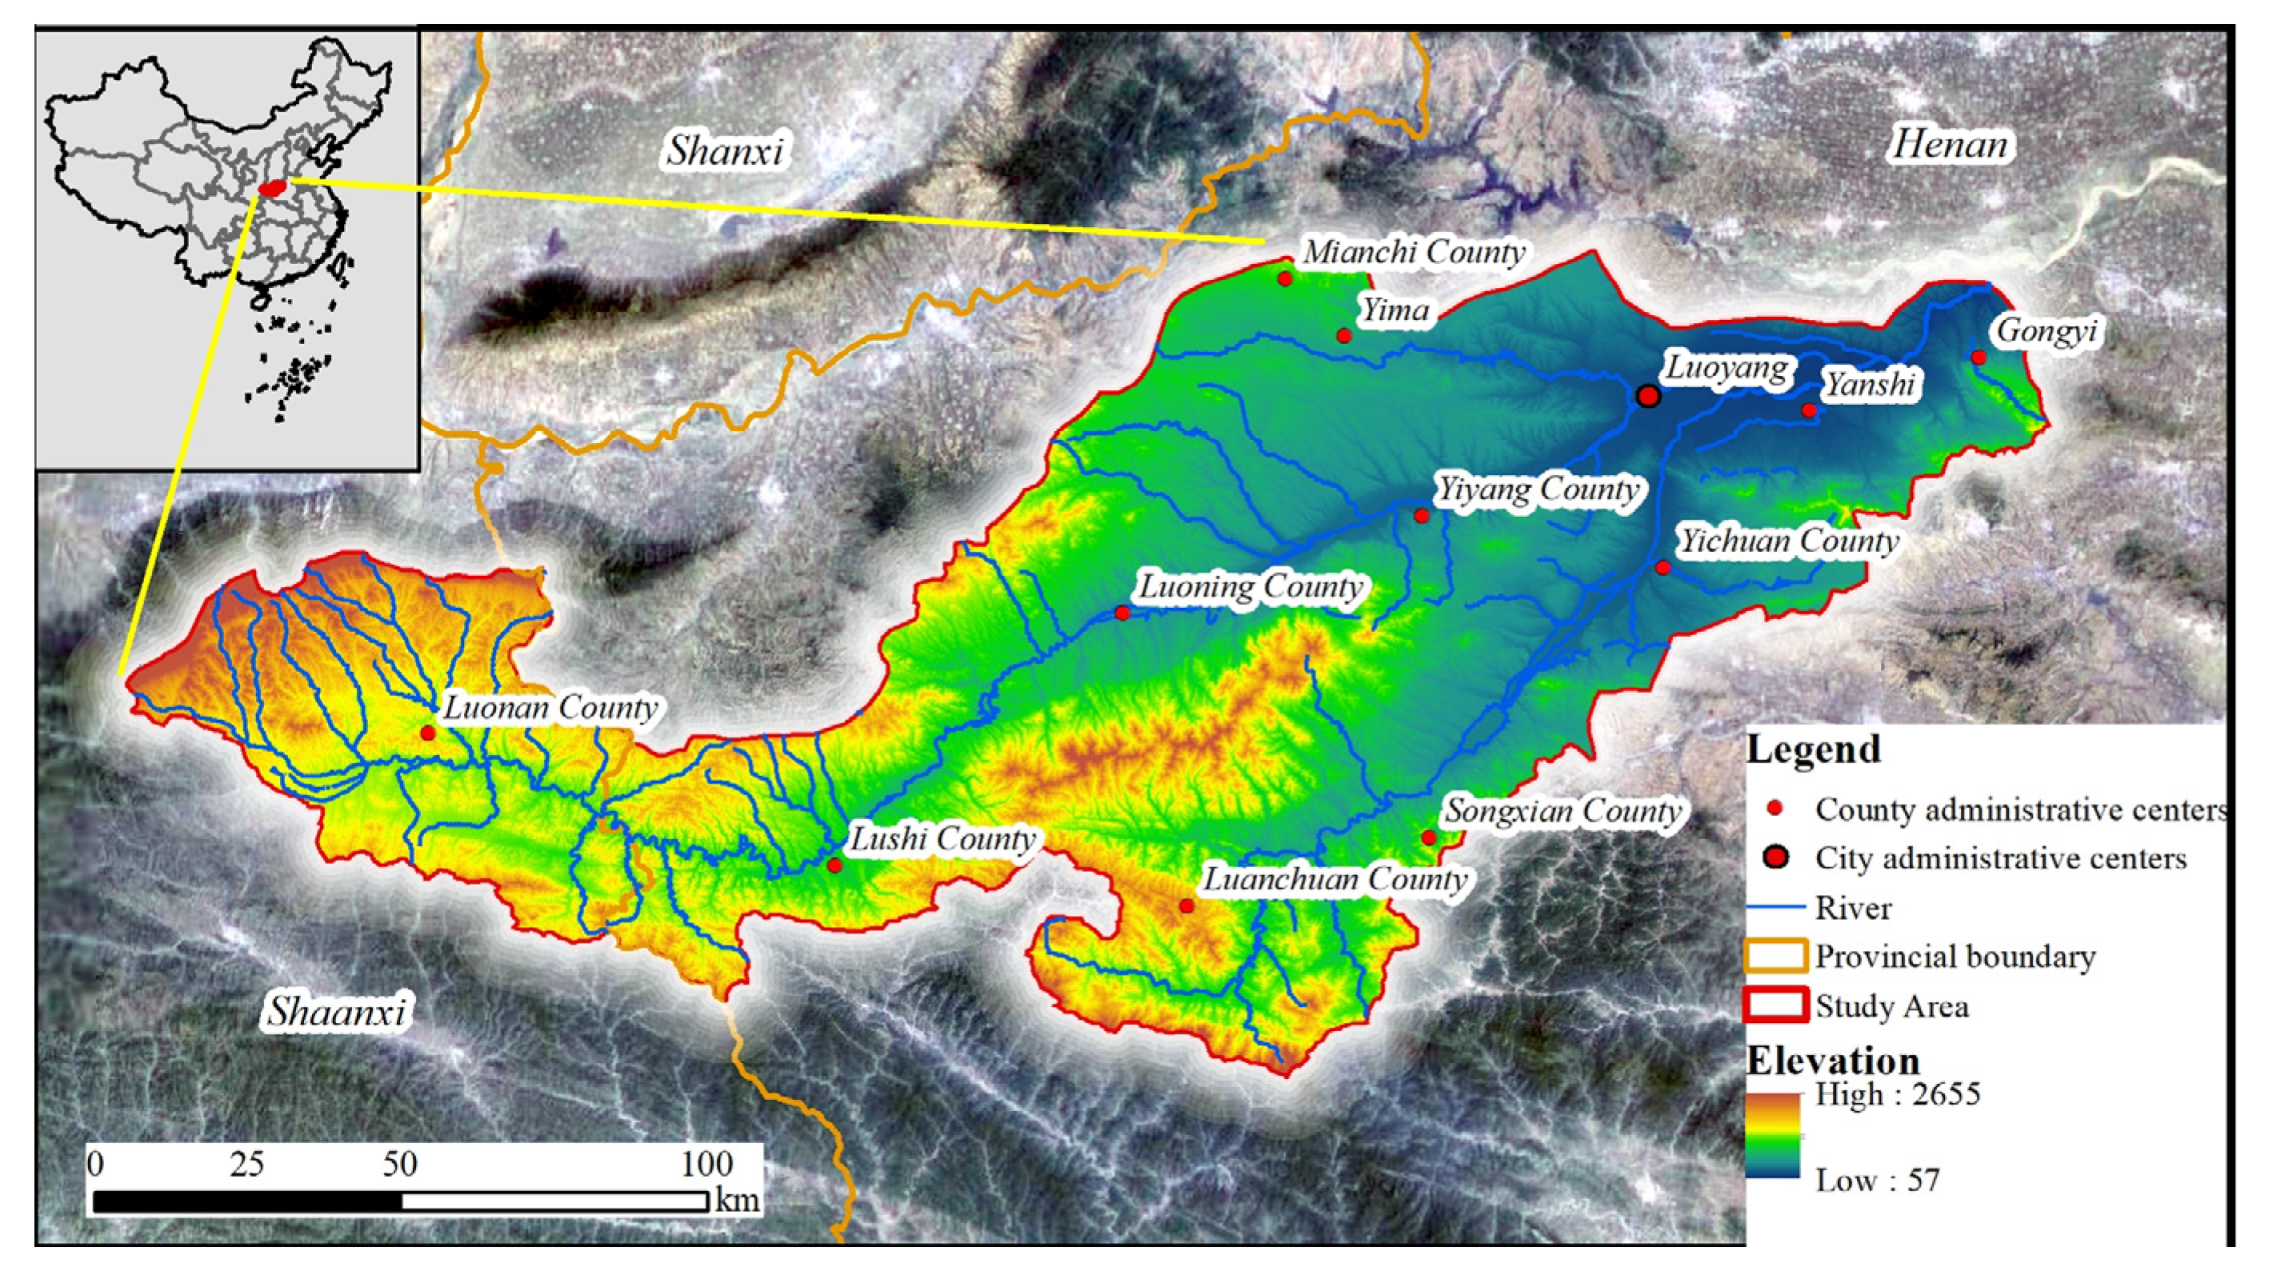
2.1. Study Area

The Luo River passes through the southeast of Shaanxi Province and the northwest of Luoyang city, Henan Province (33°39′–34°53′ N, 109°43′–113°09′ E). It is an important branch of the Yellow River in its lower reaches, where it empties into the Yellow River at Gongyi city. The basin extends 447 km in length and covers a total area of 18,769 km2. The Luo River Basin features a diverse and complex topography, including mountainous, hilly, and plain areas. Elevations range from 57 to 2655 m, showing a significant variation in terrain that follows a pattern of higher elevations in the west and lower heights in the east. This region is situated in the transition zone between the second and third topographic levels of China (Figure 1). The climate is classified as continental monsoon, characterized by a hot and humid summer; a cold and dry winter; and pleasant temperatures in spring and fall [34]. Topography, climate, soil conditions, and human activities have considerable effects on vegetation in the Luo River Basin, leading to notable regional differences. The hilly and mountainous areas have a high vegetation cover and predominantly consist of coniferous and broad-leaf forests, as well as grasslands. On the contrary, the plain areas are mainly covered by cultivated vegetation, with considerable variation in vegetation cover.

2.2. Data Sources and Preprocessing

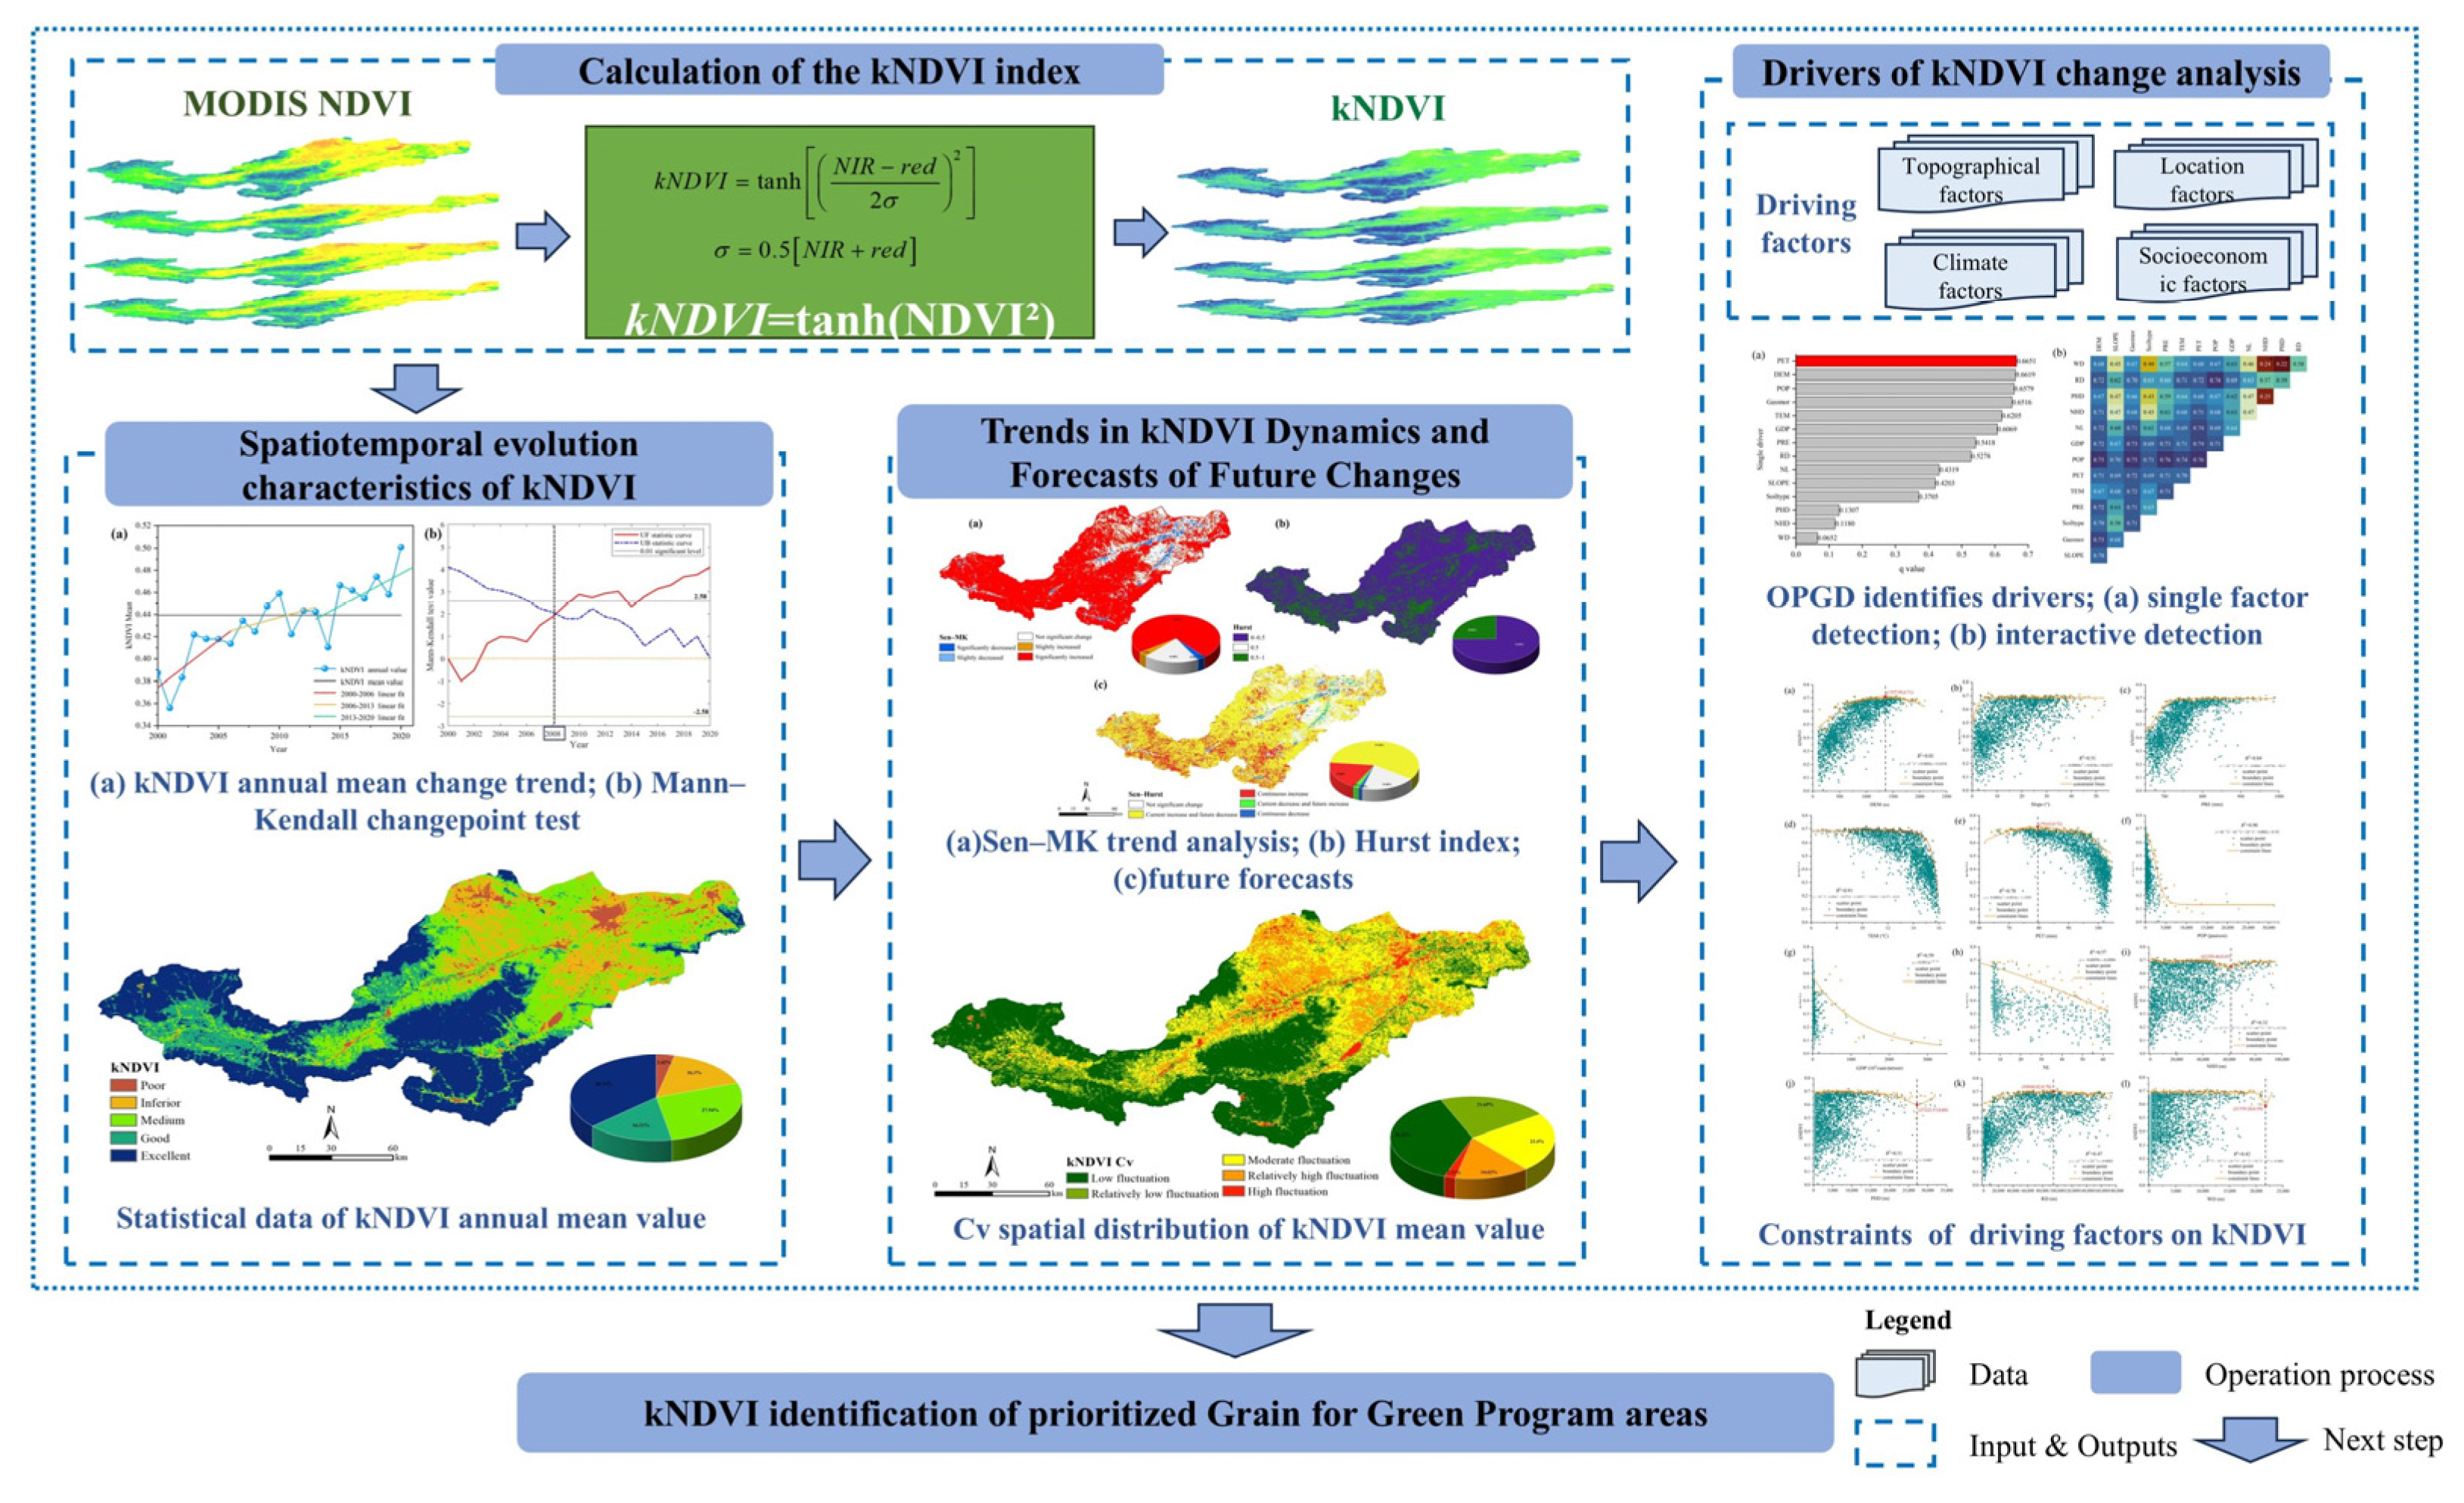
2.2.1. Overall Workflow

This study is based on MOD13Q1 NDVI data from 2000 to 2020 and constructs the kNDVI. Using Sen’s trend analysis, Mann–Kendall test, and Hurst index, we conducted an in-depth analysis of the spatiotemporal evolution of vegetation cover during key periods of the Grain for Green Program and its future trends. By optimizing the spatial scale and partitioning the geographic data through OPGD, without being influenced by human subjectivity, the quality and precision of the research results are improved, allowing for the precise identification of the key driving factors affecting vegetation change. Meanwhile, the constrained line method was used to select boundary scatter points for curve fitting, facilitating an in-depth exploration of the nonlinear relationships and key thresholds between the kNDVI and the continuous driving factor data. These two methods were innovatively integrated with multisource data from 2020, including topographic, meteorological, and socioeconomic data, to analyze the driving mechanisms of the kNDVI from a nonlinear perspective. Finally, based on different levels of the kNDVI and the planning requirements of the GFGP, the priority areas for implementation were precisely identified. A study flow chart is illustrated in Figure 2.

2.2.2. Data Sources

NASA provided the MODIS13Q1 NDVI monthly dataset (June–September 2000–2020), which has a temporal resolution of 16 days and a spatial resolution of 250 m (https://lpdaac.usgs.gov/products/mod13q1v061/, accessed on 12 May 2024). After radiometric calibration, atmospheric correction, and composite preprocessing of monthly maximum value, the mean kNDVI for the growth season of the Luo River Basin (June–September) was calculated using this dataset between 2000 and 2020. DEM data were gathered from the Geospatial Data Cloud at a spatial resolution of 30 m (https://www.gscloud.cn/, accessed on 13 May 2024), and slope data were generated using ArcGIS 10.8 software. The Resource and Environment Science and Data Platform provided data on geomorphology type, night light, and GDP at a spatial resolution of 1 km (https://www.resdc.cn/, accessed on 15 May 2024). The Food and Agriculture Organization (FAO) of the United Nations provided soil data with a spatial resolution of 1 km (http://dx.doi.org/10.3334/ORNLDAAC/1247, accessed on 16 May 2024). The National Earth System Science Data Center is the source of temperature, precipitation, and evapotranspiration data, all of which have a spatial resolution of 1 km (http://www.geodata.cn/data/, accessed on 17 May 2024). World Pop provided the population density data, which have a 1 km spatial resolution (https://www.worldpop.org/, accessed on 18 May 2024). The distance from national highways, provincial highways, railways, and water systems was derived using the Euclidean distance tool. The coordinate system WGS_1984_UTM_Zone_49N was used to uniformly project all the data.

2.2.3. Calculation of the kNDVI

The kNDVI, a nonlinear vegetation index [16], shows greater stability compared to the traditional NDVI. The calculation formula is as follows:
k N D V I = tanh [ ( N I R r e d 2 σ ) 2 ]
σ = 0.5 [ N I R + r e d ]
k N D V I = tanh ( N D V I 2 )
where NIR represents near-infrared light, red denotes red light, and tanh denotes the hyperbolic tangent function. The parameter σ is a length scale variable that can be adjusted to define the nonlinear sensitivity of the NDVI to vegetation density.
The current equidistant NDVI categorization system, with an interval of 0.20 [35,36], is not suitable for the actual fluctuation range of the kNDVI (0–0.70), which is applied to analyze vegetation in the Luo River Basin. The kNDVI values are reclassified into five levels: poor (<0.20), relatively poor (0.20–0.30], moderate (0.30–0.40], relatively good (0.40–0.50], and excellent (>0.50) to more accurately quantify vegetation conditions and their dynamic changes.

2.2.4. Driving Factors

The interaction between natural factors and human activities drives dynamic variations in vegetation cover. Vegetation growth is predominantly influenced by natural factors, including topography, climate, and location, while socioeconomic activities can promote or hinder its development and distribution. To accurately quantify the contribution of different driving factors, we considered representativeness, scientific validity, and measurability, covering 14 aspects, including topography, climate, socioeconomic factors, and location (Table 1) [2,9,32,35]. The changes in vegetation cover in the Luo River Basin were comprehensively analyzed using the OPGD model [27].

2.3. Research Methodology

2.3.1. Trend Analysis

(1)
Theil–Sen and Mann–Kendall trend analysis
Theil–Sen trend analysis is a robust, nonparametric statistical method [37] that effectively handles outliers and non-normally distributed data, reducing the impact of outliers and measurement errors. This method was applied to the Luo River Basin to assess the long-term trends in the kNDVI. The calculation formula is as follows:
β = median [ X j X k j k ]
where β represents the trend in the changes in the kNDVI, and Xj and Xk denote the values of the kNDVI time series for the j-th and k-th years, respectively, where j > k. If β > 0, the trend in the kNDVI increases; while if β < 0, the trend in the kNDVI decreases.
The Mann–Kendall (MK) significance test, a nonparametric method to effectively detect significant changes in data series, exhibits strong robustness and is resilient to the influence of a small number of outliers [38]. The calculation formula is as follows:
S = i = 1 n 1 j = i + 1 n sin ( E S j E S i )
sin ( E S j E S i ) = { 1 , E S j < E S i 0 , E S j = E S i 1 , E S j > E S i
V a r ( S ) = n ( n 1 ) ( 2 n + 5 ) 18
Z = { S 1 var ( S ) , S > 0 0 , S = 0 S + 1 var ( S ) , S < 0
where S represents the test statistic, which approximately follows a normal distribution; while var(S) denotes the variance of S; and Z is the standardized test statistic. In this study, the interannual trends in the kNDVI in the Luo River basin were tested for significance at a confidence level of α = 0.05, with a significant increase (β > 0; Z ≥ 1.96), slight increase (β > 0; 1.65 < Z < 1.96), nonsignificant change (β = 0, |Z| < 1.65), slight decrease (β < 0; 1.65 < Z < 1.96), and significant decrease (β < 0; Z ≥ 1.96).
The Theil-Sen is well-suited for long-term trend analysis because it is insensitive to noise and outliers. The Mann–Kendall test is suitable for assessing the significance of trends in time series data, as it is nonparametric, distribution-free, and highly robust against outliers. In the Luo River Basin, the combination of these two methods substantially improves the accuracy of the analysis of long-term vegetation cover trends.
(2)
The Hurst Index
Rescaled range (R/S) analysis [39] was used to calculate the Hurst index [40], which predicted future trends in the kNDVI for the Luo River Basin. This method is useful for determining whether time-series data follow a trend or exhibit randomness, thereby revealing autocorrelation characteristics and potential long-term trends.
The following are steps in the R/S analysis:
Calculate the mean sequence of any positive integer τ, as follows:
k N D V I τ ¯ = 1 τ t = 1 τ k N D V I τ , t = 1 , 2 , 3 , , n
Calculate the cumulative deviation, as follows:
X ( t , τ ) = t = 1 τ ( k N D V I t k N D V I τ ¯ ) , 1 t τ
Calculate the extreme deviation, as follows:
R τ = max 1 t τ ( t , τ ) min 1 t τ ( t , τ ) , τ = 1 , 2 , 3 , , n
Calculate the standard deviation, as follows:
S τ = [ 1 τ t = 1 τ ( k N D V I t k N D V I τ ) 2 ] 1 2 , τ = 1 , 2 , 3 , , n
Calculate the Hurst index, as follows:
R τ S τ = c τ H
The Hurst index ranges from 0 to 1. The kNDVI time series is considered random and does not exhibit persistence or long-term memory when H = 0.5. The series demonstrates persistence when 0.5 < H ≤ 1, indicating that future changes will follow historical trends. Conversely, the series displays antipersistence when 0 < H < 0.5, indicating that future trends will be opposite to previous ones.
(3)
Coefficient of variation (Cv)
The coefficient of variation is used to quantify the stability and fluctuation of the changes in the kNDVI [41], with its value reflecting the degree of external disturbance and the stability of the vegetation growth. A higher coefficient of variation suggests greater external disturbance and reduced vegetation stability, while a lower value indicates more stable vegetation growth. The calculation formula is, as follows:
C v = 1 x i = 1 n ( x i x ¯ ) 2 n 1
where Cv represents the coefficient of variation in the kNDVI, xi denotes the kNDVI for the current year, and x ¯ represents the multiyear average of the kNDVI.
(4)
Mann–Kendall changepoint test
The Mann–Kendall changepoint test [42] aims to identify whether there are changepoints in time-series data, unaffected by individual outliers, by constructing a statistic to detect significant changes in the mean of the time series. The calculation formula is, as follows:
For n time-series data x1, x2, …, xn, we construct a rank sequence, Sk, as follows:
S k = 1 k R i , R i = { 1 , x i > x j , j = 1 , 2 , i 0 , e l s e
Under the assumption of the random independence of the time series, we define the statistic, as follows:
U F k = S k E ( S k ) V a r ( S k ) , k = 1 , 2 , , n
where E(Sk) and Var(Sk) represent the mean and variance of Sk, respectively, as follows:
E ( S k ) = n ( n + 1 ) 4
V a r ( S k ) = n ( n 1 ) ( 2 n + 5 ) 72
where Sk represents the cumulative number of instances, xi > xj (1 ≤ ji), and xi and xj are the values of the data points at positions i and j in the time series, respectively. UFk follows a standard normal distribution, and the reverse sequence UBk can be constructed by arranging the time series xn, xn−1, …, x1 in reverse order. When plotting the curves of UFk and UBk, if UF is greater than 0, this indicates an increasing trend in the sequence; otherwise, it indicates a decreasing trend. When the confidence interval is less than 2.58, the trend in the kNDVI is considered not statistically significant (p < 0.01); otherwise, the trend is significant. If the UFk and UBk statistic curves intersect between the critical lines, the intersection represents a mutation point in the sequence.

2.3.2. Constraint Lines Extraction

The constraint lines between the kNDVI and its driving factors are extracted using the quantile segmentation method [43]. By analyzing scatter plots, the kNDVI values were evenly divided into 100 intervals along the x-axis. The 99th percentile within each interval is selected as a critical boundary point, yielding 100 critical points in total. Using Origin 2021 software, the distribution of these boundary points and the goodness of fit are employed to classify the types of constraint lines, which reveal the patterns of the constraint effect kNDVI in the Luo River Basin. To further investigate dynamic changes in constraint effects, derivative equations are used to calculate the threshold points of constraint transitions among variables [44].

2.3.3. Optimal Parameter Geodetector (OPGD)

The Geodetector [45] is used to identify spatial differentiation and quantify the impact of natural and socioeconomic factors. To accurately assess the explanatory power of driving factors, the OPGD method discretizes continuous data and selects the appropriate discretization parameters [28,46]. This study uses factor detection and interaction detection to analyze the effect of natural factors and human activities on the differentiation of vegetation. The calculation formula is, as follows:
q = 1 h = 1 L N h σ h 2 N σ 2
where q represents the explanatory power of each driving factor in the spatial variability of the kNDVI, with values for q ranging between 0 and 1, larger values denoting stronger explanatory power; h represents the stratification of the kNDVI and the factor influencing X; Nh and N represent the number of units in layer h and the total number of units in the region; σh2 and σ2 are the discrete variances of the kNDVI in layer h and the entire region.

3. Results

3.1. Evolution of the Spatiotemporal Pattern of the kNDVI

3.1.1. Pattern of the kNDVI Spatial–Temporal Variation

From 2000 to 2020, the kNDVI time series for the Luo River Basin was systematically evaluated and analyzed (Figure 3a). The results show a statistically significant upward trend in the annual mean kNDVI, with an annual growth rate of 0.54%, increasing from 0.39 in 2000 to 0.50 in 2020. The percentage of high-quality vegetation cover increased substantially, particularly following the comprehensive implementation of the GFGP in 2002, indicating a persistent improvement in the region’s vegetation cover. The interannual variation in the kNDVI exhibits a fluctuating but overall upward trend. Among the three time periods (2000–2006, 2006–2013, and 2013–2020), the third period (2013–2020) exhibited the highest annual growth rate of 0.72%, signifying an acceleration in vegetation cover growth. In general, the annual mean kNDVI for the Luo River Basin over 20 years was 0.43, increasing from a minimum annual mean of 0.36 in 2001 to a maximum of 0.50 in 2020, demonstrating a positive evolution in vegetation cover dynamics.
The Mann–Kendall change-point test was used to assess the abrupt changes in the kNDVI trends (Figure 3b). The results indicate that from 2000 to 2003, the UF statistic fluctuated between −2.58 and 0, demonstrating a nonsignificant decreasing trend in the kNDVI. From 2003 to 2009 and from 2013 to 2015, the UF statistic remained between 0 and 2.58, reflecting a nonsignificant increasing trend in the kNDVI. On the contrary, the UF statistic crossed the significance threshold from 2009 to 2013 and after 2015, indicating a significant upward trend in the kNDVI. Importantly, UF and UB statistics intersected at the critical line in 2008, confirming that the kNDVI time series for the Luo River Basin underwent an abrupt change in 2008, providing crucial insight for identifying key points in regional vegetation dynamics.
In evaluating the geographical distribution pattern of the kNDVI in the Luo River Basin, significant differences were observed in the annual mean pixel values (Figure 4a), with the pattern characterized as “high in the southwest and low in the northeast”. The multiyear mean spatial distribution of the vegetation status from 2000 to 2020 accounted for 52.94% of the basin area, with the majority classified as excellent and good. These high-quality vegetation areas were predominantly concentrated in large and medium undulating mountainous regions. In particular, large undulating mountain areas had up to 98.19% of their vegetation classified as excellent and good (Figure 4b). With hills making up a particularly significant component, terraces and hills in the middle and lower reaches of the basin were the primary locations for moderate vegetation cover, which made up 27.54% of the basin’s total area. Regions with poor and inferior vegetation cover compose 19.52% of the area, primarily located on terraces and plains dominated by urbanization processes. The plain generally exhibits low levels of vegetation coverage, with 59.27% of the vegetation classes reaching poor. In contrast, mountainous and hilly areas of the Luo River Basin exhibit better vegetation growth, reflecting the regional differences in vegetation coverage and dynamic changes in vegetation conditions in varying topographical settings.
This study examines the trends in the kNDVI in the following four key stages of the GFGP in the Luo River Basin: initial phase (2000), full implementation phase (2006), consolidation phase (2013), and new round of implementation (2020) (Figure 5a–d). The results show that the percentage of areas with an excellent kNDVI increased from 26.92% in the initial phase to 53.88% in the new round, with some fluctuations between them (Figure 5e). Vegetation growth in the basin has improved significantly under the GFGP. In particular, following the abrupt change in 2008, the proportion of excellent kNDVIs rapidly increased from 34.81% to 53.88%. Areas with good kNDVIs remained relatively stable, while areas with moderate and poor vegetation cover experienced complex dynamic changes, with a general trend of significantly decreasing. On the contrary, areas with poor kNDVIs showed smaller fluctuations throughout the study period, although abrupt changes were observed in specific years. In the Luo River Basin, areas with excellent and good kNDVI values steadily expanded, while areas with moderate and poor kNDVIs have significantly contracted. In particular, areas with poor kNDVIs have tended to become more concentrated in distribution. This trend highlights a positive shift in vegetation quality from moderate and poor levels to excellent and good levels. The implementation of the GFGP in the Luo River Basin, through continuous improvements in different stages, has effectively enhanced the overall vegetation cover quality and positive ecological changes.

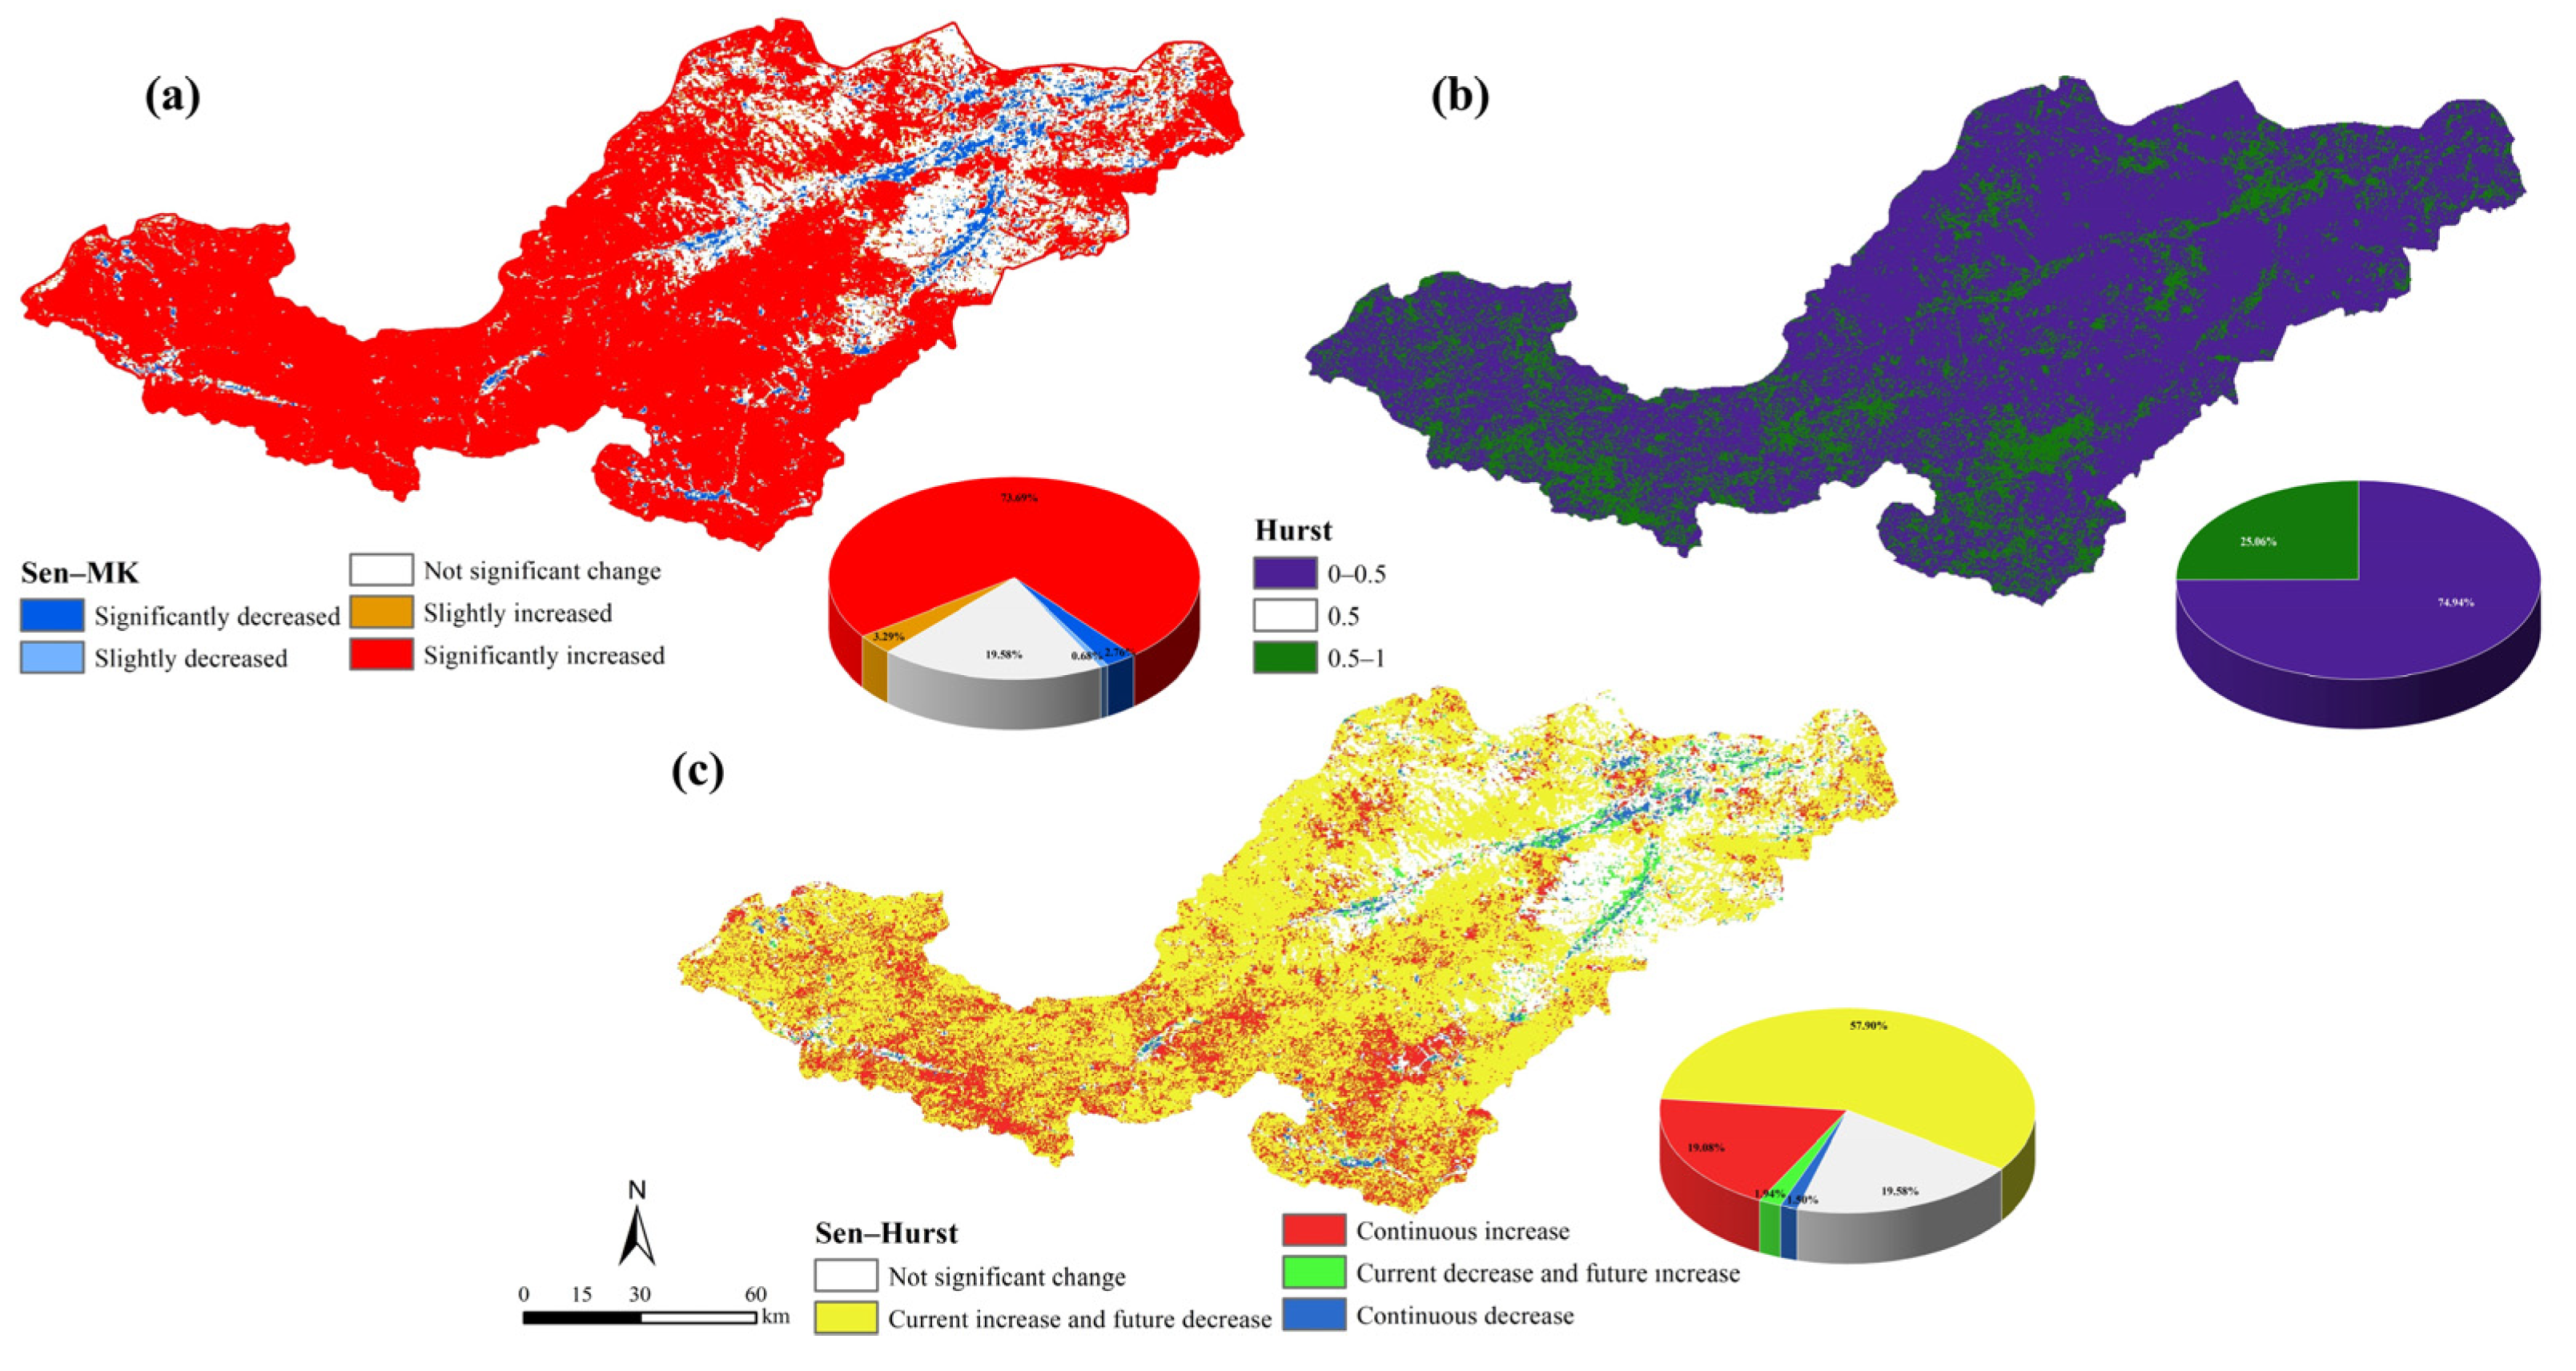
3.1.2. Trends in the kNDVI Dynamics and Forecasts of Future Changes

The MK significance test and Sen trend analysis were used to comprehensively assess the spatial patterns of long-term kNDVI trend changes in the Luo River Basin (Figure 6a). The spatial analysis results show that 76.97% of the basin area exhibited a trend of improvement in vegetation cover, with 73.69% of the area showing significant growth, primarily in high-altitude mountainous and hilly regions. Additionally, 3.29% of the area experienced slight growth. On the contrary, 3.43% of the basin area experienced vegetation degradation, with 2.76% showing a significant decrease, mainly concentrated in low-altitude plains and riverbank areas, coinciding with densely populated areas around Luoyang city and its water systems. The remaining 19.58% of the area maintained stable vegetation cover, without exhibiting a significant change trend.
In the Luo River Basin, the Hurst index, as an important indicator for assessing long-term dependence and antipersistence in time-series data, reveals the projected vegetation cover trends from 2000 to 2020 (Figure 6b). The mean Hurst index of the basin is 0.44, below the critical threshold of 0.50, indicating that the overall vegetation cover exhibits antipersistence, where past changes in vegetation trends are negatively correlated with future trends. Specifically, 74.94% of the basin area, the Hurst index is less than 0.50, reflecting antipersistent behavior in vegetation coverage. In the remaining area, the Hurst index exceeds 0.50, suggesting potential persistence in vegetation cover trends. This study spatially integrated the Sen + MK trend significance test with the Hurst index to further explore the relationship between the kNDVI trend changes and the sustainability of the vegetation cover. The objective was to uncover the spatial coupling between changes in future vegetation trends and sustainability dynamics. Consequently, the basin was classified into the following five categories: continuous decrease (S < 0, H > 0.50), current decrease and future increase (S < 0, H < 0.50), continuous increase (S > 0, H > 0.50), current increase and future decrease (S > 0, H < 0.50), and nonsignificant change (S = 0).
Based on future vegetation cover predictions, most vegetation in the Luo River Basin is projected to be at risk of degradation, and only a few areas are expected to improve (Figure 6c). Specifically, the “continuous increase” area composed 19.08%, mainly concentrated in the upper reaches of Luanchuan, Lushi County, and the southeastern part of Luonan County, exhibiting localized clustering characteristics. In contrast, the “continuous decrease” area is sparsely distributed, representing just 1.50%, and is mainly scattered along the edges of the water system. The area of “current decrease and future increase” accounts for 1.94%, adjacent to the persistent degradation areas. The “current increase and future decrease” area is the most prominent, comprising 57.90%, and widely distributed throughout the basin. Future vegetation changes are predicted to have no significant changes in the remaining 19.58% of the area, which is mainly concentrated in Yichuan County and the places where its downstream counties and cities meet.

3.2. Drivers of the kNDVI Change Analysis

3.2.1. Effects of Drivers on the kNDVI Spatial Pattern

A comprehensive analysis of the spatial distribution pattern of the kNDVI in the Luo River Basin was performed using OPGD, which incorporates 14 variables, including topography, meteorological, socioeconomic, and location factors. Factor detection analysis revealed the ranking of influences on the kNDVI’s spatial differentiation (Figure 7a), as follows: PET > DEM > POP > Geomor > TEM > GDP > PRE > RD > NL > SLOPE > soil type > PHD > NHD > WD. Dominant factors include elevation, population, evapotranspiration, and geomorphology, all with q-values greater than 0.65. Temperature and GDP are secondary factors, each with q-values greater than 0.60. Rainfall, distance from the railway, and night light exert weaker influences on the kNDVI.
The interaction detection analysis indicates that the influence of two interacting factors is significantly stronger than that of a single factor on the spatial differentiation of the kNDVI in the Luo River Basin. With the exception of the nonlinear enhancement observed in the interaction between the distance to water systems and the distance from national and provincial roads, which surpasses the typical dual-factor enhancement, all other factor interactions show a dual-factor enhancement (Figure 7b). The interaction between PET and POP had the strongest effect, with a q-value of 0.76. The influence of interactions between dominant factors and other factors is generally substantial, with q-values more than 0.65, underscoring the critical role of dominant factors in defining the geographical differentiation pattern of the kNDVI. In summary, kNDVI changes are driven by a complex interplay of factors that mutually reinforce one another.

3.2.2. Constraints Relationship between Driving Factors and kNDVI

The constraint effects of various driving factors of the kNDVI are represented by distinct forms of constraint lines (Figure 8). The threshold points in each curve mark the critical nodes for the transition of constraint effects [47]. Specifically, the influence of DEM, PET, and RD on the kNDVI’s characteristic of a hump-shaped curve feature, where the constraint effect weakens as each factor increases until it exceeds a specific threshold (DEM = 1332.05 m, PET = 79.63 mm, and RD = 94,948.82 m), after which the constraint effect intensifies. This phenomenon is attributed to compound changes in temperature, precipitation, and soil conditions that occur when DEM, PET, and RD exceed their threshold, collectively improving the constraint on the kNDVI. The constraint effects of slope and rainfall on the kNDVI are depicted by a convex curve, where an increase in slope exacerbates soil erosion while reducing human interference, and an increase in rainfall directly improves the water conditions for vegetation. As these factors interact, the kNDVI gradually adapts to the environment, and the constraint effect weakens.
The constraint relationship between the kNDVI and the distance from national highways, provincial roads, and water systems follows a concave-waved curve, illustrating the fluctuating impacts of these spatial distance factors, with maximum constraint effects occurring at thresholds of 61,250.46 m, 27,222.57 m, and 21,759.28 m, respectively. The impact of temperature on the kNDVI is represented by a negative convex curve, suggesting that as the temperature increases, vegetation experiences stress, leading to decreased photosynthetic efficiency and increased transpiration, ultimately exerting a negative effect on the kNDVI. The increasing values of POP and GDP progressively intensify their constraint on the kNDVI, following logarithmic curves. In contrast, NL exhibits a negative linear constraint effect on the kNDVI, where the constraint effect strengthens proportionally with light intensity.
Compared to traditional methods, the constrained line method reveals the potentially complex interactions between driving factors and the kNDVI, which are often overlooked or simplified in linear models. Therefore, based on the optimal parameter geographical detector, the constrained line method was combined to analyze the nonlinear constraint effects of the continuous driving factors on the kNDVI. The constraint effects of 12 driving factors on vegetation cover exhibit five types of nonlinear relationships (hump-shaped, positive convex, negative convex, logarithmic, and concave-waved) and one linear relationship (negative linear). Among these, the hump-shaped and concave-waved relationships involve thresholds, with a total of six key thresholds identified. In general, the kNDVI is influenced by the combined effects of climate, topography, and socioeconomic factors, with its constraint effects being relatively complex.

3.3. Relationships between kNDVI Stability and Influence Factor

This study used the Cv of the NDVI as a classification criterion, categorizing the kNDVI fluctuations into the following five levels (Figure 9) [48]: low fluctuation (Cv ≤ 0.10), relatively low fluctuation (0.10 < Cv ≤ 0.15), moderate fluctuation (0.15 < Cv ≤ 0.20), relatively high fluctuation (0.20 < Cv ≤ 0.30), and high fluctuation (Cv > 0.30). The Cv values in the Luo River Basin ranged from 0 to 2.69 between 2000 and 2020, with an average Cv of 0.13, indicating generally stable vegetation dynamics, but with clear gradations and spatial clustering. Specifically, areas with low and relatively low fluctuation accounted for 59.77% of the total area, or 11,218.69 km2. These areas exhibited high kNDVI stability and were less susceptible to external disturbances. In contrast, areas with medium and relatively high fluctuation covered a total of 7136.27 km2, accounting for 38.02%, showing significant changes in the vegetation cover. The areas with high fluctuation were minimal, comprising only 2.21% of the basin, characterized by extremely unstable vegetation conditions and strong external disturbances, with marked fluctuations.
To systematically investigate the complex relationship between kNDVI stability and its key driving factors, the spatial distribution of the kNDVI stability levels was statistically analyzed by categorizing the primary and secondary factors. The analysis indicates that evapotranspiration and temperature have a pronounced negative impact on the kNDVI’s stability (Figure 10). Specifically, as evapotranspiration increases and temperature increases, the stability of the kNDVI exhibits a significant declining trend. The proportion of areas with low fluctuation decrease, while the proportion of moderate and higher fluctuation levels increase sharply, highlighting the significant challenges and potential impacts of climatic factors on the stability of the kNDVI.
In contrast, elevation and geomorphological types exhibit a positive correlation with kNDVI stability, along with significant regional heterogeneity. As elevation increases, the stability of the kNDVI is enhanced, with a significant expansion of low fluctuation areas and a corresponding reduction in moderate to high fluctuation areas, indicating that high-altitude regions promote vegetation stability. In terms of geomorphological types, the upper mountain regions, characterized by high altitudes, are the primary areas of low and relatively low fluctuations. The plateau and hilly regions, shaped by complex terrain, frequently experience moderate to high fluctuations. In contrast, plain regions exhibit high fluctuations in the kNDVIs due to their highly sensitive ecological environment and susceptibility to external disturbances, emphasizing the fragility of plain ecosystems in sustaining vegetation stability.
POP and GDP demonstrate significant negative effects on the stability of the kNDVI. As the POP increases and economic development accelerates, the stability of the kNDVI tends to weaken. This is reflected in the shrinking proportion of low fluctuation areas, while the proportion of moderate and higher fluctuation areas increases correspondingly.

4. Discussion

4.1. Spatiotemporal Heterogeneity of the kNDVI under the GFGP

In the research area, the kNDVI shows an average annual growth rate of 0.54% and a fluctuating rising trend over time. This pattern is consistent with the results of Lu et al. [13], who found that the middle and upper sections of the Yellow River had an NDVI with an increasing trend. The percentage of the region with good vegetation conditions improved significantly by 34 percentage points, from 41% to 74%, between 2000 and 2020. The implementation of national ecological projects, such as the Grain for Green Program and the Natural Forest Protection Program, has effectively promoted the restoration of the ecological environment in the Luo River Basin. However, the mean values of the kNDVI decreased significantly, and the percentage of places with poor vegetation quality increased during 2010–2011 and 2013–2014. These declines are closely associated with extreme weather events, such as devastating flood disaster in Luoyang in 2010 and the most severe summer drought in 63 years in Henan in 2014. The frequent alternation of floods and droughts in Henan Province poses severe challenges to the ecosystems of the plant community. Extreme precipitation events affect soil water balance, nutrient status, and temperature, leading to soil erosion and degradation, thus adversely affecting vegetation growth [49]. Extreme droughts exacerbate soil moisture evaporation, deteriorate the natural environment, and result in a dramatic reduction in vegetation cover, with some species even perishing [50].
Spatially, vegetation cover overall maintains a high level, exhibiting a “high in the southwest, low in the northeast” distribution. The statistical analysis of the types of landform and the levels of the kNDVI (Figure 3) reveals that in mountainous areas with complex and undulating terrain, vegetation cover is predominantly of an excellent grade. In particular, in areas with significant terrain variation, 94.79% of the vegetation cover is classified as excellent, highlighting the superior ecological environment of these regions. On the contrary, the areas with low coverage are mainly concentrated around the main urban area of Luoyang, which has a lower elevation and flatter terrain. Human economic activities heavily disturb vegetation growth in certain places, resulting in less vegetation cover. Future projections indicate that 59.40% of the region is at risk of degradation of the vegetation, showing a trend of continuous or future decrease, which could seriously endanger the ecological environment [23]. Customized ecological restoration and management strategies are urgently needed for areas with insignificant changes and predicted degradation in order to improve vegetation cover and effectively improve ecosystem services. Currently, vegetation degradation occurs mainly at the edges of construction land within the basin, where urbanization and increased economic activities exacerbate land degradation and damage to vegetation cover [51]. Therefore, future ecological protection and restoration efforts should focus on low-elevation plain areas. In March 2022, the Ministry of Natural Resources, in collaboration with other departments, issued the “Major Ecological Protection and Restoration Projects Plan for Key Ecological Areas of the Yellow River (including the Loess Plateau Ecological Barrier) (2021–2035)”, proposes an integrated protection and restoration strategy that encompasses mountains, rivers, forests, farmlands, lakes, grasslands, and deserts to fortify the ecological security barrier of the Yellow River. The ecological status of the Luo River Basin, as a crucial tributary in the middle reaches of the Yellow River, plays an indispensable role in the ecological security of the Yellow River Basin [52]. With the implementation of this plan, the Luo River Basin is expected to experience more favorable ecological changes.

4.2. Constraints on the kNDVI from Drivers

The spatial differentiation of the Luo River Basin in the kNDVI is primarily driven by the PET, DEM, POP, and Geomor types; TEM and GDP are secondary factors. Evapotranspiration, as a key component of vegetation water cycling, exhibits a hump-shaped constraint effect on the kNDVI. Enhances plant growth by promoting the transport of photosynthetic substances, but may also exacerbate stress in drought conditions, inhibiting vegetation survival and potentially leading to plant death [53]. Temperature shows a negatively convex constraint effect, with the constraint intensifying as the temperature increases [54]. High temperatures cause a substantial amount of water to be lost by plant transpiration, which inhibits normal vegetation growth [55]. Socioeconomic factors, POP and GDP, exhibit a logarithmic constraint on the kNDVI. As the socioeconomic factors grow, the constraint effect intensifies, leading to changes in land use and industrial structure, which directly or indirectly reduce the cover of natural vegetation.
In the plains downstream of the Luo River Basin, where POP is high, economic activities are prosperous, and the proportion of construction land is significant, kNDVI values are generally low, highlighting the strong negative impact of socioeconomic activities on natural vegetation [56,57]. However, human activities also show positive effects. For example, the Grain for Green Program and afforestation have significantly improved vegetation conditions and effectively increased the amount of vegetation cover in the basin [58]. The improvement trend in vegetation cover indicates that the benefits of human activities outweigh the drawbacks in this region. In the complex terrain and high elevation areas of the Luo River Basin, reduced human interference provides a favorable growth environment for natural vegetation such as forests. These areas have a high vegetation cover, reflecting the synergistic effects of natural recovery and human intervention.
In the Luo River Basin, the interaction between primary and secondary factors is notably more influential than that of individual factors. Interaction between any two factors significantly enhances the effect of spatial differentiation on the kNDVI. In keeping with other research [22,46], the interaction types are dual-factor enhancement or nonlinear enhancement, highlighting the synergistic and nonindependent mechanisms among the influencing factors. Although elevation is not the main dominant factor, its variation regulates the distribution of temperature, evapotranspiration, and landform types [50]. Factors such as precipitation, distance from railway, and nighttime light have relatively weaker impacts on the kNDVI, but their interactions significantly enhance the explanatory power of changes in vegetation cover. Therefore, the principle of adjusting actions to local conditions should guide ecological restoration strategies in the Luo River Basin. Based on differences in elevation gradient, landform types, and climatic conditions, it is essential to scientifically delineate ecological restoration zones and implement differentiated protection, restoration, and construction measures to comprehensively and efficiently restore the ecological environment.

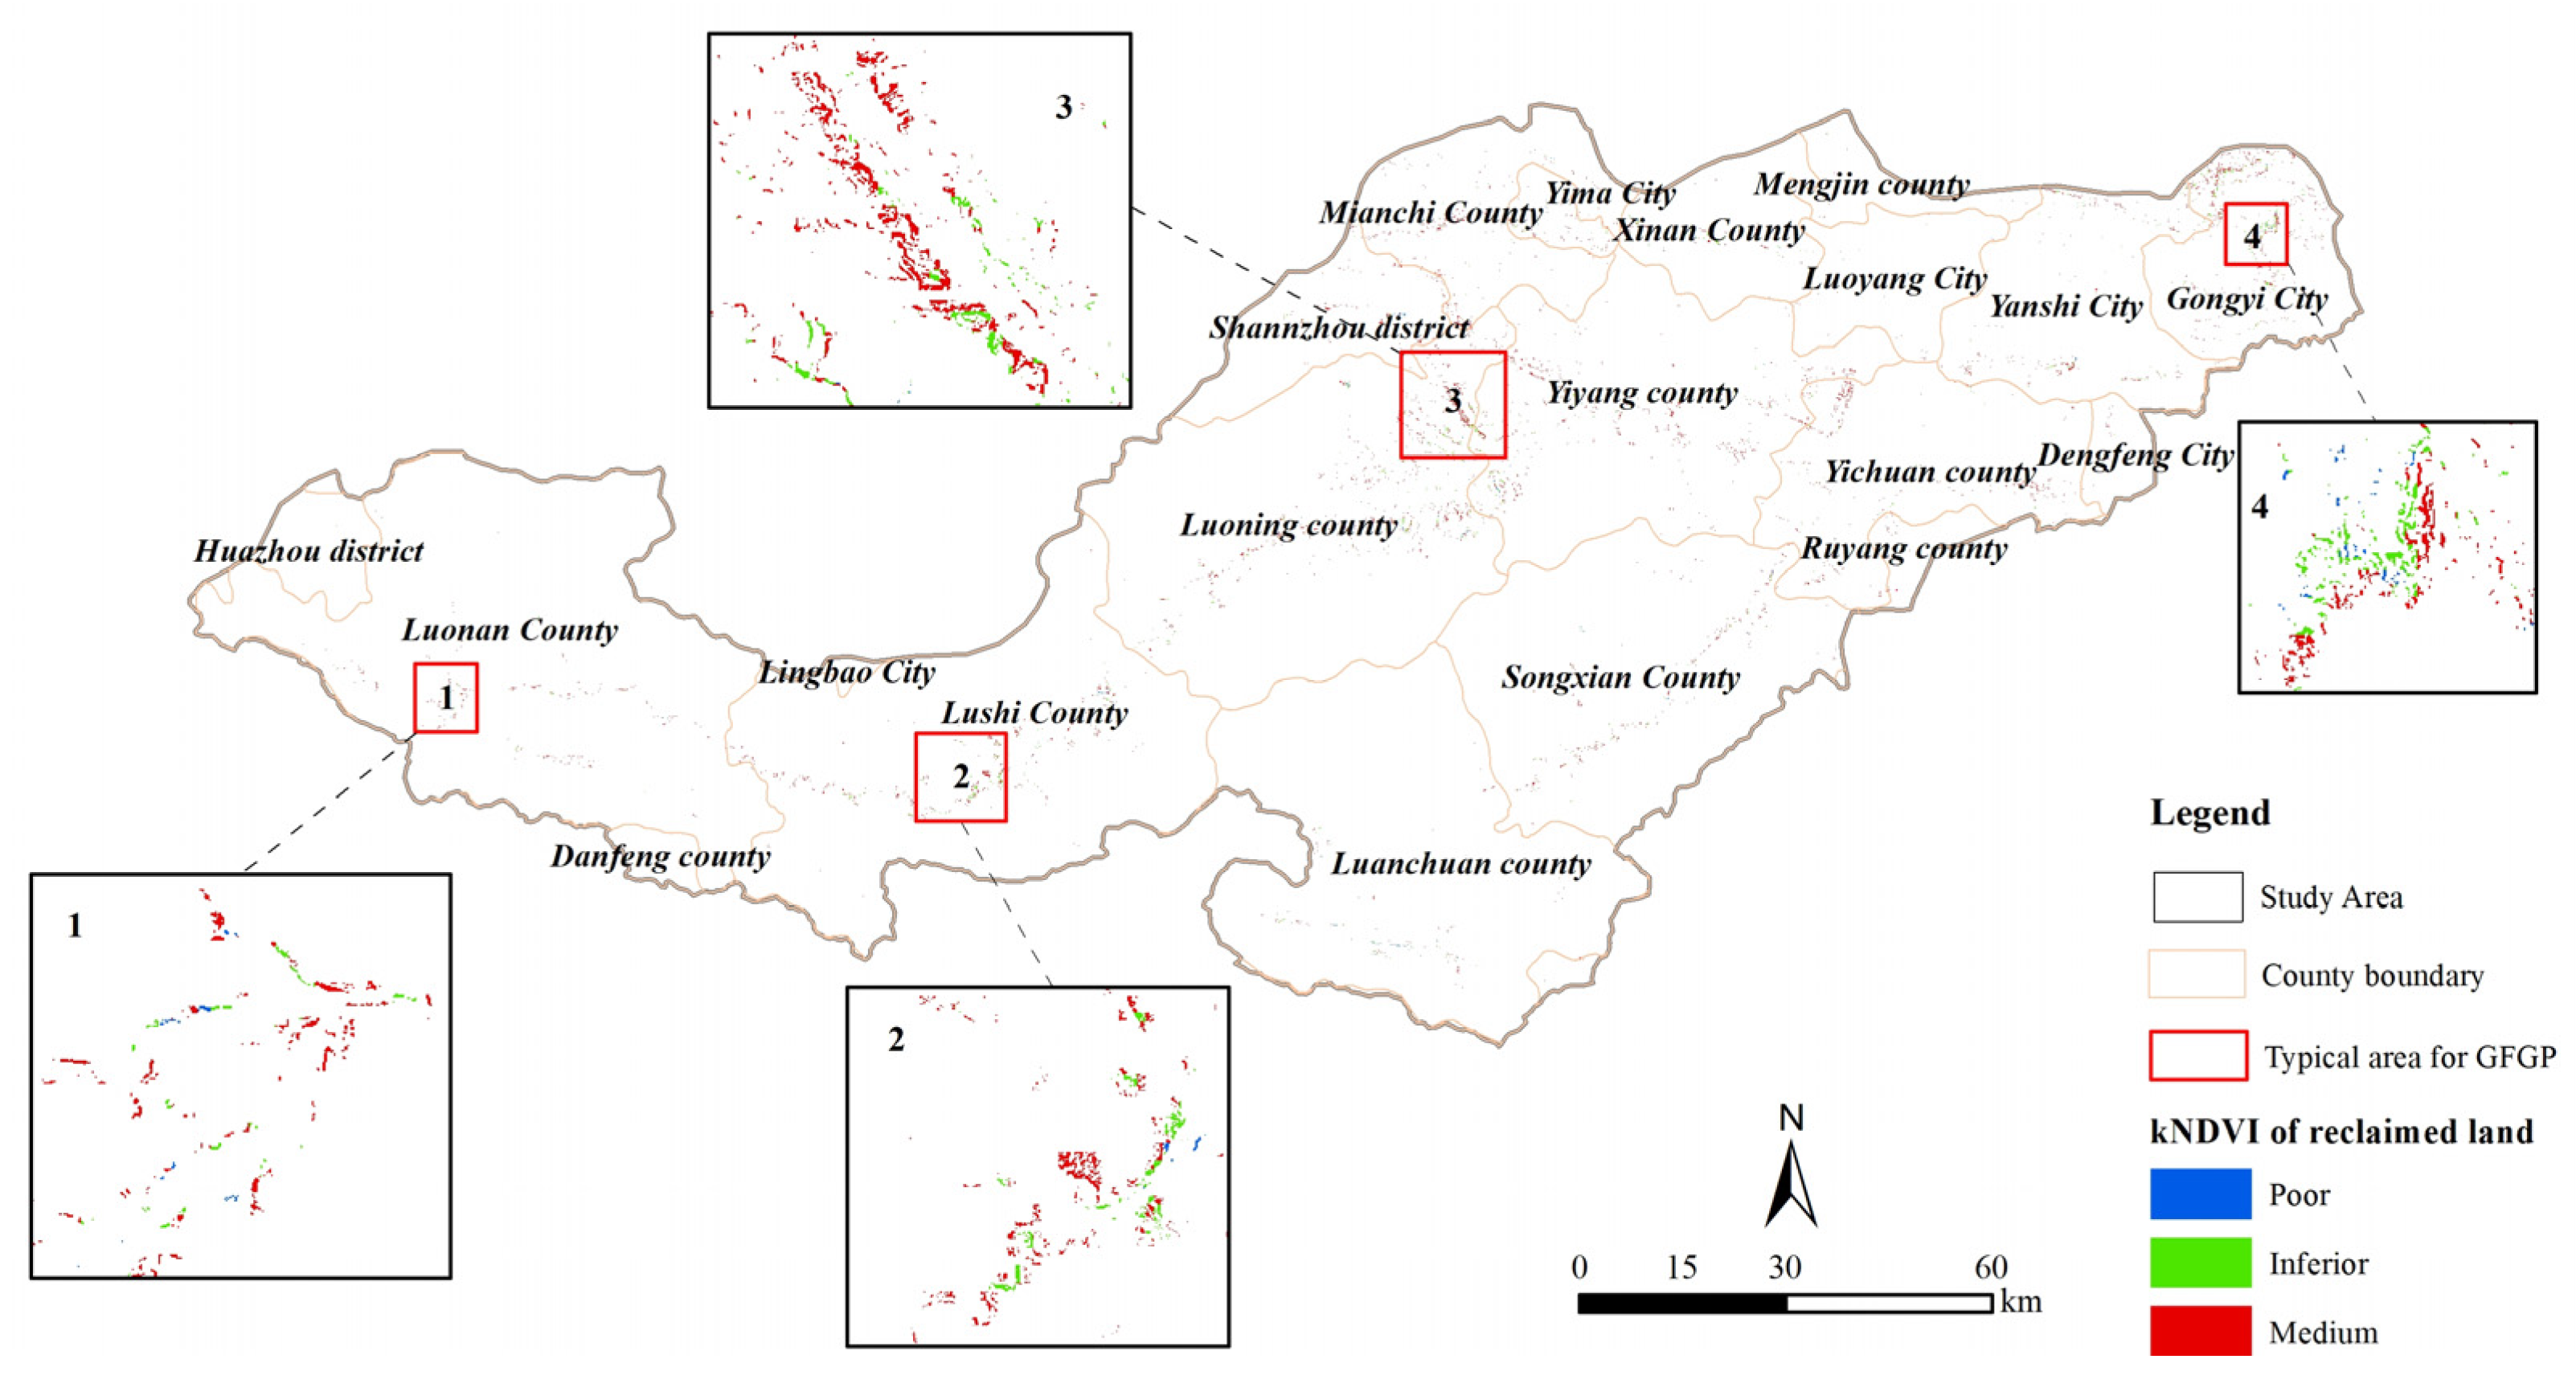
4.3. kNDVI Identification of Prioritized GFGP Areas

Ecological issues such as soil erosion in the Luo River Basin have severely impacted the development of the region, significantly exacerbating land fragmentation and soil quality degradation. In particular, croplands with slopes greater than 25° poses significant challenges in terms of cultivation difficulty, low soil fertility, and poor crop economic benefits, which pose a serious threat to ecosystem balance. This study, based on relevant laws and regulations regarding the GFGP policy by national and local governments, considers the area’s natural characteristics, socioeconomic conditions, and data availability. The slope is identified as the key determinant for reforestation, and cropland along with water conservation areas within the Luo River Basin are further identified as critical regions for reforestation planning.
A total of 8005.10 km3 of cropland was extracted, according to 2020 land use data for the Luo River Basin. Guided by the principles of the white paper “Twenty Years of China’s Grain for Green Program”, the scope for the new round of the program includes steeply terraced cropland, 15–25° slope cropland around important water sources, and severely desertified or polluted croplands. Because of the lack of data on severely desertified and polluted cropland, these were not included in the analysis. The study focuses on cropland with slopes greater than 25° and with slopes of 15–25° near important water sources, integrating water conservation needs to identify reforestation areas around water sources. Using GIS spatial overlay analysis, cropland with slopes of 15–25° within a 1 km buffer around important water sources and slopes greater than 25° were identified, delineating 401.26 km2 as suitable for the new round of reforestation planning. These areas were then spatially matched with 2020 reclassified kNDVI data to identify regions with moderate or lower vegetation cover (low kNDVI values), resulting in 68.27 km2 designated as priority reforestation areas (Figure 11). These areas are spread throughout the basin, adjacent to existing cropland and forest boundaries, providing ideal implementation spaces for the GFGP.
Although the overall kNDVI in the basin remained stable, specific areas such as those with high evapotranspiration, low-altitude plains, high temperatures, and regions of rapid economic development exhibit a trend of decreasing kNDVI stability. These areas should be prioritized in ecological restoration projects. Considering that the GFGP is the largest ecological protection project worldwide and that Henan Province is a key national grain production area, advancing the GFGP in the Luo River Basin must balance the dual objectives of ecological security and food security (adhering to the national red line of 1.8 billion acres of arable land). Therefore, the implementation of the GFGP requires precise measures to avoid excessive intervention. Accurate identification and prioritization of reforestation areas are crucial. As the foundation of terrestrial ecosystem security, vegetation cover and diversity are directly related to ecosystem stability. The dynamic changes in vegetation cover have become key indicators in the assessment and monitoring of the quality of the regional ecological environment [59]. Based on a comprehensive analysis of the new round of GFGP policies and kNDVI levels, this study identifies a total area of 68.27 km2 within the basin that qualifies as a priority for reforestation. This finding has significant practical implications for the guide of regional ecological environment protection and restoration measures.

4.4. Limitations and Prospects

This research thoroughly examined the long-term spatiotemporal evolution of vegetation, predicted future trends, and offered scientific vegetation monitoring data for forest management in the Luo River Basin. It quantitatively determined the impact of various driving factors on the evolution of vegetation and mapping the constraint curves for these factors, providing a basis for managers to adjust strategies and optimize ecological restoration plans. However, this study also faces certain limitations. Although the Hurst index can predict trends in vegetation change, it lacks clarity in defining the specific timing and duration of these trends. Because of the experimental limitations, the choice of driving factors may not be comprehensive, as key elements, such as soil moisture, nitrogen deposition, and duration of sunlight, also need to be considered. GeoDetector has limitations in analyzing the interactive effects of more than two factors on vegetation changes, necessitating a deeper exploration of the combined influence of multiple factors in future research. Future studies should improve the collection of field survey data and thoroughly analyze the interactions mechanisms among driving factors to make more accurate predictions of vegetation changes in the Basin.

5. Conclusions

Using the kNDVI dataset covering the years 2000 to 2020, this study systematically examined the spatiotemporal evolution of the vegetation cover in the Luo River Basin under the GFGP. The OPGD identified the key driving factors that impact the changes in vegetation cover, while the constraint lines revealed the nonlinear constraints and thresholds of these factors. The main findings include the following:
(1)
Throughout the research period, the vegetation cover exhibited an overall upward trend, with the GFGP significantly promoting vegetation growth, leading to improvements in 73.69% of the region. Excellent and good levels of vegetation coverage were observed in more than half of the area, with high-altitude mountain regions having better vegetation cover levels compared to plains and terraces. Additionally, regions with excellent and good vegetation cover transitioned from medium and inferior levels.
(2)
In the Luo River Basin, evapotranspiration, elevation, POP, and geomorphology types (q > 0.65), were the primary factors influencing the spatial variation in the kNDVI, with temperature and GDP serving as secondary factors (q > 0.60). The interaction among factors greatly increased the explanatory power for the kNDVI, primarily through dual-factor enhancement, with the strongest interaction observed between evapotranspiration and POP (q = 0.76).
(3)
Topography, climate, and human activity exert nonlinear constraints on vegetation coverage, with threshold effects observed in the hump-shaped and concave wave-shaped constraint types among the six identified types. An assessment of the stability of the kNDVI within key factor zones indicates that areas with high fluctuations are concentrated in regions of low altitude, high temperature, dense populations, and fragile vegetation.
(4)
Based on the overlay of the GFGP criteria and the levels of the kNDVI, 68.27 km2 of priority reforestation areas were identified, spread throughout the basin, and located adjacent to existing forest lands.

Author Contributions

Conceptualization, L.L., J.Z. (Jinyuan Zhang) and T.Z.; methodology, J.Z. (Jinyuan Zhang); software, L.L.; validation, J.Z. (Jing Zhang) and X.Q.; formal analysis, L.L.; investigation, X.Q.; resources, X.Q.; data curation, J.Z. (Jing Zhang); writing—original draft preparation, J.Z. (Jing Zhang); writing—review and editing, X.Q.; visualization, J.Z. (Jinyuan Zhang); supervision, L.L.; project administration, X.Q.; funding acquisition, X.Q. All authors have read and agreed to the published version of the manuscript.

Funding

The authors declare that financial support was received for the research, authorship, and/or publication of this article. This work was supported by the National Key Natural Science Foundation of China (grant number: U23A2016) and the National Natural Science Foundation of China (grant number: 42271283).

Data Availability Statement

The NDVI is available at https://www.usgs.gov/, accessed on 12 May 2024. The 1 km monthly precipitation dataset for China (1901–2022) is available at http://www.geodata.cn/data/, accessed on 12 May 2024. The 1 km monthly mean temperature dataset for China (1901–2022) is available at http://www.geodata.cn/data/, accessed on 12 May 2024. The 1 km monthly mean potential evapotranspiration dataset for China (1901–2022) is available at http://www.geodata.cn/data/, accessed on 12 May 2024. The DEM data are available at https://www.gscloud.cn/, accessed on 12 May 2024.

Acknowledgments

We appreciate the anonymous reviewers and their valuable comments. Also, we thank the editors for the editing and comments.

Conflicts of Interest

The authors declare that the research was conducted in the absence of any commercial or financial relationships that could be construed as potential conflicts of interest.

References

  1. Wang, Z.; Fu, B.; Wu, X.; Li, Y.; Feng, Y.; Wang, S.; Zhang, L. Vegetation resilience does not increase consistently with greening in China’s Loess Plateau. Commun. Earth Environ. 2023, 4, 336. [Google Scholar] [CrossRef]
  2. Zhang, X.; Wang, G.; Xue, B.; Yinglan, A. Changes in vegetation cover and its influencing factors in the inner Mongolia reach of the yellow river basin from 2001 to 2018. Environ. Res. 2022, 215, 114253. [Google Scholar] [CrossRef] [PubMed]
  3. Liu, Q.; Liu, L.; Zhang, Y.; Wang, Z.; Wu, J.; Li, L.; Paudel, B. Identification of impact factors for differentiated patterns of NDVI change in the headwater source region of Brahmaputra and Indus, Southwestern Tibetan Plateau. Ecol. Indic. 2021, 125, 107604. [Google Scholar] [CrossRef]
  4. Wang, Z.; Fu, B.; Wu, X.; Wang, S.; Li, Y.; Feng, Y.; Li, B. Distinguishing Trajectories and Drivers of Vegetated Ecosystems in China’s Loess Plateau. Earths Future 2024, 12, e2023EF003769. [Google Scholar] [CrossRef]
  5. Sun, W.; Song, X.; Mu, X.; Gao, P.; Wang, F.; Zhao, G. Spatiotemporal vegetation cover variations associated with climate change and ecological restoration in the Loess Plateau. Agric. For. Meteorol. 2015, 209, 87–99. [Google Scholar] [CrossRef]
  6. Sur, K.; Verma, V.K.; Panwar, P.; Shukla, G.; Chakravarty, S.; Nath, A.J. Monitoring vegetation degradation using remote sensing and machine learning over India—A multi-sensor, multi-temporal and multi-scale approach. Front. For. Glob. Chang. 2024, 7, 1382557. [Google Scholar] [CrossRef]
  7. Su, B.; Wang, Y.; Shangguan, Z. Analysis on the scale of a new period of returning farmland to forestland and grassland in Northwest China. Res. Soil Water Conserv. 2017, 24, 59–65. [Google Scholar]
  8. Gu, Y.Y.; Zou, C.X.; Qiao, X.N.; Huang, X.F.; Ye, X.; Xu, M.J.; Yang, Z.Q.; Du, S.P. Spatio-temporal Variations of Fractional Vegetation Coverage and Influencing Factors in Qianxi’nan Prefecture from 2000 to 2015. J. Ecol. Rural. Environ. 2021, 37, 1413–1422. [Google Scholar]
  9. Li, G.; Sun, S.; Han, J.; Yan, J.; Liu, W.; Wei, Y.; Sun, Y. Impacts of Chinese Grain for Green program and climate change on vegetation in the Loess Plateau during 1982–2015. Sci. Total Environ. 2019, 660, 177–187. [Google Scholar] [CrossRef]
  10. Zhao, A.Z.; Zhang, A.B.; Liu, H.X.; Liu, Y.X.; Wang, H.F.; Wang, D.L. Spatiotemporal variation of vegetation coverage before and after implementation of grain for green project in the Loess Plateau. J. Nat. Resour. 2017, 32, 449–460. [Google Scholar]
  11. Jiang, L.; Liu, Y.; Wu, S.; Yang, C. Analyzing ecological environment change and associated driving factors in China based on NDVI time series data. Ecol. Indic. 2021, 129, 107933. [Google Scholar] [CrossRef]
  12. Li, H.; Li, K.X.; Zhao, X.; Zhao, J.C. Changes in Vegetation Greenness and Their Influencing Factors in Southern China. Remote Sens. 2022, 14, 3291. [Google Scholar] [CrossRef]
  13. Lu, C.P.; Hou, M.C.; Liu, Z.L.; Li, H.J.; Lu, C.Y. Variation Characteristic of NDVI and its Response to Climate Change in the Middle and Upper Reaches of Yellow River Basin, China. IEEE J. Sel. Top. Appl. Earth Obs. Remote Sens. 2021, 14, 8484–8496. [Google Scholar] [CrossRef]
  14. Xing, L.; Huang, J.; Lei, S. Study on vegetation coverage change of Xilinhot’s Shengli mining area in recent 30 years. J. Henan Polytech. Univ. 2019, 38, 61–69. [Google Scholar]
  15. Wang, Q.; Moreno-Martinez, A.; Munoz-Mari, J.; Campos-Taberner, M.; Camps-Valls, G. Estimation of vegetation traits with kernel NDVI. ISPRS J. Photogramm. Remote Sens. 2023, 195, 408–417. [Google Scholar] [CrossRef]
  16. Camps-Valls, G.; Campos-Taberner, M.; Moreno-Martínez, Á.; Walther, S.; Duveiller, G.; Cescatti, A.; Running, S.W. A unified vegetation index for quantifying the terrestrial biosphere. Sci. Adv. 2021, 7, eabc7447. [Google Scholar] [CrossRef]
  17. Chen, X.; Chen, T.; Liu, S.; Chai, Y.; Guo, R.; Dai, J.; Wei, X. Vegetation Index-Based Models without Meteorological Constraints Underestimate the Impact of Drought on Gross Primary Productivity. J. Geophys. Res. Biogeosci. 2024, 129, e2023JG007499. [Google Scholar] [CrossRef]
  18. Gu, Z.; Chen, X.; Ruan, W.; Zheng, M.; Gen, K.; Li, X.; Liu, M. Quantifying the direct and indirect effects of terrain, climate and human activity on the spatial pattern of kNDVI-based vegetation growth: A case study from the Minjiang River Basin, Southeast China. Ecol. Inform. 2024, 80, 102493. [Google Scholar] [CrossRef]
  19. Liu, W.; Mo, X.; Liu, S.; Lu, C. Impacts of climate change on grassland fractional vegetation cover variation on the Tibetan Plateau. Sci. Total Environ. 2024, 939, 173320. [Google Scholar] [CrossRef]
  20. Zhao, A.Z.; Zhang, A.B.; Liu, J.H.; Feng, L.L.; Zhao, Y.L. Assessing the effects of drought and “Grain for Green” Program on vegetation dynamics in China’s Loess Plateau from 2000 to 2014. Catena 2019, 175, 446–455. [Google Scholar] [CrossRef]
  21. Riihimäki, H.; Heiskanen, J.; Luoto, M. The effect of topography on arctic-alpine aboveground biomass and NDVI patterns. Int. J. Appl. Earth Obs. Geoinf. 2017, 56, 44–53. [Google Scholar] [CrossRef]
  22. Zhang, Y.; Zhang, L.; Wang, J.; Dong, G.; Wei, Y. Quantitative analysis of NDVI driving factors based on the geographical detector model in the Chengdu-Chongqing region, China. Ecol. Indic. 2023, 155, 110978. [Google Scholar] [CrossRef]
  23. Gao, C.; Ren, X.; Fan, L.; He, H.; Zhang, L.; Zhang, X.; Chen, X. Assessing the Vegetation Dynamics and Its Influencing Factors in Central Asia from 2001 to 2020. Remote Sens. 2023, 15, 4670. [Google Scholar] [CrossRef]
  24. Meng, X.; Gao, X.; Li, S.; Lei, J. Spatial and Temporal Characteristics of Vegetation NDVI Changes and the Driving Forces in Mongolia during 1982-2015. Remote Sens. 2020, 12, 603. [Google Scholar] [CrossRef]
  25. Wang, J.; Wang, K.L.; Zhang, M.Y.; Zhang, C.H. Impacts of climate change and human activities on vegetation cover in hilly southern China. Ecol. Eng. 2015, 81, 451–461. [Google Scholar] [CrossRef]
  26. Yuan, L.H.; Jiang, W.G.; Shen, W.M.; Liu, Y.H.; Wang, W.J.; Tao, L.L.; Liu, X.F. The spatio-temporal variations of vegetation cover in the Yellow River Basin from 2000 to 2010. Acta Ecol. Sin. 2013, 33, 7798–7806. [Google Scholar]
  27. Song, Y.; Wang, J.; Ge, Y.; Xu, C. An optimal parameters-based geographical detector model enhances geographic characteristics of explanatory variables for spatial heterogeneity analysis: Cases with different types of spatial data. Gisci. Remote Sens. 2020, 57, 593–610. [Google Scholar] [CrossRef]
  28. Hao, R.; Yu, D.; Wu, J.; Guo, Q.; Liu, Y. Constraint line methods and the applications in ecology. Chin. J. Plant Ecol. 2016, 40, 1100–1109. [Google Scholar]
  29. Li, J.; Xie, B.; Gao, C.; Zhou, K.; Liu, C.; Zhao, W.; Xie, J. Impacts of natural and human factors on water-related ecosystem services in the Dongting Lake Basin. J. Clean. Prod. 2022, 370, 133400. [Google Scholar] [CrossRef]
  30. Liang, G.; Liu, J. Integrated geographical environment factors explaining forest landscape changes in Luoning County in the middle reaches of the Yiluo River watershed, China. Ecol. Indic. 2022, 139, 108928. [Google Scholar] [CrossRef]
  31. Bai, R.; Wang, X.; Li, J.; Yang, F.; Shangguan, Z.; Deng, L. The impact of vegetation reconstruction on soil erosion in the Loess plateau. J. Environ. Manag. 2024, 363, 121382. [Google Scholar] [CrossRef] [PubMed]
  32. Liu, J.X.; Li, Z.; Zhang, X.; Li, R.; Liu, X.; Zhang, H. Responses of vegetation cover to the Grain for Green Program and their driving forces in the He-Long region of the middle reaches of the Yellow River. J. Arid. Land 2013, 5, 511–520. [Google Scholar] [CrossRef]
  33. Liu, Y.; Liu, B.; Cheng, C.; Zhang, J.; Lu, S. Spatio-temporal changes and influencing factors of vegetation coverage in Yulin City During the Past 20 years since the implementation of the “grain for green” program. J. Soil Water Conserv. 2022, 36, 197–208, 218. [Google Scholar]
  34. Guo, Y.; Lu, X.; Ding, S. The classification of plant functional types based on the dominant herbaceous species in the riparian zone ecosystems in the Yiluo River. Acta Ecol. Sin. 2012, 32, 4434–4442. [Google Scholar]
  35. Peng, W.; Kuang, T.; Tao, S. Quantifying influences of natural factors on vegetation NDVI changes based on geographical detector in Sichuan, western China. J. Clean. Prod. 2019, 233, 353–367. [Google Scholar] [CrossRef]
  36. Peng, W.; Wang, G.J.; Zhou, J.M.; Xu, X.; Luo, H.; Zhao, J.; Yang, C. Dynamic monitoring of fractional vegetation cover along Minjiang River from Wenchuan County to Dujiangyan City using multi-temporal landsat 5 and 8 images. Acta Ecol. Sin. 2016, 36, 1975–1988. [Google Scholar]
  37. Theil, H. A rank-invariant method of linear and polynomial regression analysis. In Henri Theil’s Contributions to Economics and Econometrics: Econometric Theory and Methodology; Springer: Berlin/Heidelberg, Germany, 1992; pp. 345–381. [Google Scholar]
  38. Nanditha, H.S.; Reshmidevi, T.V.; Simha, L.U.; Kunhikrishnan, P. Statistical analysis of rainfall and groundwater interaction in Bhadra catchment. Environ. Dev. Sustain. 2024, 26, 16267–16287. [Google Scholar] [CrossRef]
  39. Mandelbrot, B.B.; Wallis, J.R. Robustness of the rescaled range R/S in the measurement of noncyclic long run statistical dependence. Water Resour. Res. 1969, 5, 967–988. [Google Scholar] [CrossRef]
  40. Hurst, H.E. Long-term storage capacity of reservoirs. Trans. Am. Soc. Civ. Eng. 1951, 116, 770–799. [Google Scholar] [CrossRef]
  41. Alharbi, S.; Raun, W.R.; Arnall, D.B.; Zhang, H.L. Prediction of maize (Zea mays L.) population using normalized-difference vegetative index (NDVI) and coefficient of variation (CV). J. Plant Nutr. 2019, 42, 673–679. [Google Scholar] [CrossRef]
  42. Zheng, J.; Zhou, Z.; Liu, J.; Yan, Z.; Xu, C.Y.; Jiang, Y.; Wang, H. A novel framework for investigating the mechanisms of climate change and anthropogenic activities on the evolution of hydrological drought. Sci. Total Environ. 2023, 900, 165685. [Google Scholar] [CrossRef] [PubMed]
  43. Mills, A.J.; Fey, M.V.; Gröngröft, A.; Petersen, A.; Medinski, T.V. Unravelling the effects of soil properties on water infiltration:: Segmented quantile regression on a large data set from arid south-west Africa. Aust. J. Soil Res. 2006, 44, 783–797. [Google Scholar] [CrossRef]
  44. He, L.; Xie, Z.; Wu, H.; Liu, Z.; Zheng, B.; Wan, W. Exploring the interrelations and driving factors among typical ecosystem services in the Yangtze river economic Belt, China. J. Environ. Manag. 2024, 351, 119794. [Google Scholar] [CrossRef]
  45. Wang, J.; Xu, C.D. Geodetector: Principle and prospective. Acta Geogr. Sin. 2017, 72, 116–134. [Google Scholar]
  46. Zhao, X.; Tan, S.; Li, Y.; Wu, H.; Wu, R. Quantitative analysis of fractional vegetation cover in southern Sichuan urban agglomeration using optimal parameter geographic detector model, China. Ecol. Indic. 2024, 158, 111529. [Google Scholar] [CrossRef]
  47. Hao, R.F.; Yu, D.Y.; Wu, J.G. Relationship between paired ecosystem services in the grassland and agro-pastoral transitional zone of China using the constraint line method. Agric. Ecosyst. Environ. 2017, 240, 171–181. [Google Scholar] [CrossRef]
  48. Liu, Z.; Bi, H.; Hou, G. Determining the Scope of the Residual Gully Region on the Loess Plateau and the Characteristics of Temporal and Spatial Changes of NDVI. J. Soil Water Conserv. 2021, 35, 144–150. [Google Scholar]
  49. He, L.; Guo, J.; Yang, W.; Jiang, Q.; Chen, L.; Tang, K. Multifaceted responses of vegetation to average and extreme climate change over global drylands. Sci. Total Environ. 2023, 858, 159942. [Google Scholar] [CrossRef]
  50. Lai, J.L.; Qi, S.; Cui, R.R.; Liao, R.E.; Tang, Y.; Li, P. Analysis of Vegetation Change and Influencing Factors in Southwest Alpine Canyon Area. Environ. Sci. 2023, 44, 6833–6846. [Google Scholar]
  51. Duan, Q.T.; Luo, L.H.; Zhao, W.Z.; Zhuang, Y.L.; Liu, F. Mapping and Evaluating Human Pressure Changes in the Qilian Mountains. Remote Sens. 2021, 13, 2400. [Google Scholar] [CrossRef]
  52. Chen, Y.; Qiao, X.; Yang, Y.; Zheng, J.; Dai, Y.; Zhang, J. Identifying the spatial relationships and drivers of ecosystem service supply–demand matching: A case of Yiluo River Basin. Ecol. Indic. 2024, 163, 112122. [Google Scholar] [CrossRef]
  53. Luo, D.-D.; Wang, C.-K.; Jin, Y. Stomatal regulation of plants in response to drought stress. J. Appl. Ecol. 2019, 30, 4333–4343. [Google Scholar]
  54. Lamchin, M.; Lee, W.K.; Jeon, S.W.; Wang, S.W.; Lim, C.H.; Song, C.; Sung, M. Long-term trend of and correlation between vegetation greenness and climate variables in Asia based on satellite data. MethodsX 2018, 5, 803–807. [Google Scholar] [CrossRef] [PubMed]
  55. Ren, Z.G.; Tian, Z.H.; Wei, H.T.; Liu, Y.; Yu, Y.P. Spatiotemporal evolution and driving mechanisms of vegetation in the Yellow River Basin, China during 2000–2020. Ecol. Indic. 2022, 138, 108832. [Google Scholar] [CrossRef]
  56. Liu, Y.; Tian, J.Y.; Liu, R.H.; Ding, L.Q. Influences of Climate Change and Human Activities on NDVI Changes in China. Remote Sens. 2021, 13, 4326. [Google Scholar] [CrossRef]
  57. Wang, M.Y.; Fu, J.E.; Wu, Z.T.; Pang, Z.G. Spatiotemporal Variation of NDVI in the Vegetation Growing Season in the Source Region of the Yellow River, China. ISPRS Int. J. Geo-Inf. 2020, 9, 282. [Google Scholar] [CrossRef]
  58. Wang, H.; Liu, G.; Li, Z.; Ye, X.; Fu, B.; Lü, Y. Analysis of the Driving Forces in Vegetation Variation in the Grain for Green Program Region, China. Sustainability 2017, 9, 1853. [Google Scholar] [CrossRef]
  59. Abera, T.A.; Heiskanen, J.; Maeda, E.E.; Hailu, B.T.; Pellikka, P.K.E. Improved detection of abrupt change in vegetation reveals dominant fractional woody cover decline in Eastern Africa. Remote Sens. Environ. 2022, 271, 112897. [Google Scholar] [CrossRef]
Figure 1. The study area in the Luo River Basin.
Forests 15 01649 g001
Figure 2. The flow chart of the study.
Forests 15 01649 g002
Figure 3. Interannual variation; (a) Annual annual mean variation trend in the kNDVI; (b) the results of the Mann–Kendall change–point test.
Forests 15 01649 g003
Figure 4. Statistics on the multiyear average kNDVI in the Luo River Basin: (a) average kNDVI spatial distribution; (b) proportion of different kNDVI levels under various geomorphological types.
Forests 15 01649 g004
Figure 5. (ad) Characteristics of the changes in the kNDVI during the critical period; (e) variations in the percentage of the various classes of the kNDVI from 2000 to 2020.
Forests 15 01649 g005
Figure 6. Significance analysis of the kNDVI trends and future sustainability. (a) the trend of Sen–MK changed significantly; (b) Hurst index; (c) future change trend.
Forests 15 01649 g006
Figure 7. The explanatory power of various driving factors on the spatial pattern of the kNDVI in 2020: (a) results of the detection of the driving factors of the kNDVI; (b) results of the detection of interactions among the driving factors. Note * indicates nonlinear enhancement, and other dual-factor enhancement.
Forests 15 01649 g007
Figure 8. The constraint relationship between the continuous driving factor indicators and kNDVI. (a) Constraint line of DEM; (b) Constraint line of Slope; (c) Constraint line of PRE; (d) Constraint line of TEM; (e) Constraint line of PET; (f) Constraint line of POP; (g) Constraint line of GDP; (h) Constraint line of NL; (i) Constraint line of NHD; (j) Constraint line of PHD; (k) Constraint line of RD; (l) Constraint line of WD.
Forests 15 01649 g008
Figure 9. Spatial distribution pattern of the CV of the annual mean kNDVI in the Luo River Basin.
Forests 15 01649 g009
Figure 10. Proportion of the kNDVI stability classes in key impact factor subdivisions.
Forests 15 01649 g010
Figure 11. The kNDVI identification of prioritized GFGP areas.
Forests 15 01649 g011
Table 1. Drivers of the kNDVI.
CategoryDriver NameAbridgeCodeUnitResolutionDatatype
Topographical factorsElevationDEMX1m30 mcontinuous
SlopeSLOPEX2°30 mcontinuous
Geomorphology typeGeomorX3/1 kmcategorical
Soil typeSoil typeX4/1 kmcategorical
Climate
factors
PrecipitationPREX5mm1 kmcontinuous
TemperatureTEMX6°C1 kmcontinuous
EvapotranspirationPETX7mm1 kmcontinuous
Socioeconomic factorsPopulation densityPOPX8Pearson·km−21 kmcontinuous
Gross domestic productGDPX9103·km−21 kmcontinuous
Night lightsNLX10/1 kmcontinuous
Location
factors
Distance from the national highwayNHDX11m1 kmcontinuous
Distance from provincial highwayPHDX12m1 kmcontinuous
Distance from railroadRDX13m1 kmcontinuous
Distance from the water systemWDX14m1 kmcontinuous
Disclaimer/Publisher’s Note: The statements, opinions and data contained in all publications are solely those of the individual author(s) and contributor(s) and not of MDPI and/or the editor(s). MDPI and/or the editor(s) disclaim responsibility for any injury to people or property resulting from any ideas, methods, instructions or products referred to in the content.

