Article

Moss Cover Modulates Soil Fungal Functional Communities and Nutrient Cycling in Alpine Forests

1
Key Laboratory of Land Resources Evaluation and Monitoring in Southwest, Sichuan Normal University, Ministry of Education, Chengdu 610101, China
2
College of Life Sciences, Sichuan Normal University, Chengdu 610041, China
*
Author to whom correspondence should be addressed.
Forests 2025, 16(1), 138; https://doi.org/10.3390/f16010138
Submission received: 3 November 2024 / Revised: 20 December 2024 / Accepted: 10 January 2025 / Published: 14 January 2025
(This article belongs to the Special Issue Biogeochemical Cycles in Forests)

Abstract

:
Moss–cyanobacteria associations serve as significant nitrogen fixers and represent the primary nitrogen sink in boreal forests. Fungi, which are essential for soil biogeochemical cycling, have community structures intrinsically linked to forest ecosystem health and productivity. Using high-throughput sequencing, we investigated differences between moss-covered and non-moss soils in two alpine forests (both plantation and natural forests) by examining soil nitrogen contents, fungal community structure, composition, and functional guilds. Results demonstrated that moss cover enhanced soil nutrient contents, including total carbon, total nitrogen, and inorganic nitrogen. It also altered fungal community characteristics, resulting in higher Chao1 and Shannon diversity indices, as well as a more complex fungal network. Notable changes in functional guilds included an increase in saprotrophic fungi abundance and a decrease in ectomycorrhizal fungi. Our findings support the concept that moss cover creates distinct soil environments: moss-covered soils attract decomposers and nutrient-mobilizing fungi (particularly saprotrophs and ectomycorrhiza), while non-moss soils favor ectomycorrhizal fungi that relieve nutrient limitation through extensional mycelial networks. These findings highlight the critical role of moss cover in sustaining forest soil health and resilience, positioning it as a cornerstone of carbon and nutrient cycling within forest ecosystems.

1. Introduction

Mosses make up the primary layer beneath subalpine and boreal coniferous forests, directly or indirectly influencing the biogeochemical cycling of nutrient elements associated with nitrogen (N) fixation [1]. In N-limited boreal forests, biological nitrogen fixation (BNF) mediated by moss–cyanobacteria associations can contribute up to 50% of the total N input [2,3]. This association is well studied in N-limited environments, such as the boreal forests of northern Europe and temperate grasslands [4,5,6,7]. In N-rich temperate forests, some studies indicate that mosses exhibit a high N-fixing potential but primarily when N deposition is significantly elevated [8].
Mosses in boreal and subalpine forest ecosystems are characterized by high N-use efficiency and low decomposition rates, contributing to carbon (C) and N accumulation in many high-latitude ecosystems [9]. Several studies have demonstrated that N fixed within the moss–cyanobacteria associations is highly conserved, with minimal direct transfer to higher plants and soils [4]. Instead, a significant portion is recirculated from senescent tissues [10]. However, environmental changes such as moisture and temperature fluctuations can result in N loss from mosses by drying and rewetting cycles, ultimately increasing soil N pools [11]. For instance, studies in the mid-Indian Himalayas have observed higher ammonium N concentrations in moss-covered soils, while higher nitrate N concentrations were found in non-moss soils during both rainy and winter seasons [12]. Furthermore, the N mineralization rate, nitrification rate, inorganic N, and total N content are observed to increase in moss-covered soils, suggesting that moss cover enhances N transformation [13,14,15]. In the subtropical karst, soil microbial biomass and community composition in moss-covered soils exhibit distinct differences from non-moss soils [16,17,18]. Despite these advances, research linking moss–cyanobacteria associations and soil microbial communities in alpine forests remains limited.
Feather moss–cyanobacteria associations function as significant N sinks, and their newly fixed N can transfer into boreal forest ecosystems through soil microbiomes [6,19]. Previous research has shown that mycorrhizal fungi and N-fixing bacteria are responsible for most of the N and phosphorus (P) annual acquisition by plants [20]. Soil fungi utilize their mycorrhizal extensive mycelium to explore inorganic nutrients from nutrient-rich niches, while saprotrophic fungi can decompose organic matter [21]. The N dynamics in moss systems are intrinsically linked to soil microbial communities, particularly fungal assemblages, which serve as key mediators in nutrient cycling. However, little is known about the fungal communities participating in moss–cyanobacteria associations within alpine forest ecosystems.
In the alpine coniferous forest ecosystem, the BNF by the moss–cyanobacteria associations represents a crucial nitrogen input pathway. However, the influence of these associations on soil fungal communities and their functional guilds remains poorly understood. To address this gap, we investigate whether the presence of moss cover significantly affects soil fungal community structure, functional guild composition, and soil nutrient dynamics in alpine forest ecosystems. Our study conducted a comparative study in the eastern Qinghai–Tibet Plateau (QTP), collecting soil samples from moss-covered and non-moss areas in both plantation and natural alpine forests. By using Internal Transcribed Spacer (ITS) amplicon sequencing combined with comprehensive soil physicochemical analyses, we characterized the fungal community composition, functional guilds, soil nutrient conditions, and their interactions. The results are expected to offer a scientific understanding of how moss–cyanobacteria associations influence soil fungal communities and contribute to ecosystem resilience and sustainability in alpine forest ecosystems.

2. Materials and Methods

2.1. Sample Site and Sampling

The field research was conducted in the Miyaluo Experimental Forests, located on the eastern Qinghai–Tibet Plateau in Lixian County, Sichuan Province, China (31°35′ N, 102°35′ E, at an altitude of 3150 m). The area experiences a mean annual temperature of 8.9 °C. July, the warmest month, has an average temperature of 12.6 °C, while January, the coldest, month averages −8 °C. Annual precipitation ranges between 600 and 1100 mm, with the highest frequency and volume of rainfall occurring from May to September. Historically, large areas of natural forests were deforested for agriculture. However, plantations were later established, now spanning one million hectares in western Sichuan Province, accounting for about 50% of the region’s forest area. We conducted soil sampling across two forest types including plantation and natural alpine forests. The plantation is approximately 80 years old, dominated by dragon spruce (Picea asperata), referred to as “the plantation forest”. The natural forest is approximately 205 years old, dominated by spruce (Picea asperata) and fir (Abies faxoniana), referred to as “the natural forest”. The understory of the spruce plantation is sparse and mainly consists of herbaceous plants such as Festuca ovina, Deyeuxia arundinacea, and Carex capilliformis. In contrast, the natural spruce–fir forest has a denser understory, dominated by Acer mono, Lonicera species, and Betula albosinensis, along with herbaceous species like Anemone rivularis and Carex capilliformis. This sampling strategy was designed not to compare forest types, but rather to ensure the generalizability of our results across different alpine forests, thereby strengthening the validity and broader ecological relevance of our conclusions. According to the IUSS Working Group (2007), both sites are classified as Cambic Umbrisols.
Soil sampling was conducted during August 2019, the peak warm and rainy season. In each forest type, we selected four approximately 4 m × 4 m replicate grid plots within larger representative 100 m × 100 m plots. From each grid, moss-covered soils and non-moss soils were selected for sampling. Five subsamples were collected from the mineral horizon of 0–5 cm in each grid. The five subsamples of moss-covered soils (MSs) and non-moss soils (almost bare soils or covered with a thin layer of litter, BSs) were pooled. MS was defined as soil adhering to moss and was carefully subsampled using shovels and brushes. BS was sampled after clearing the surface litter. In both plantation and natural forests, a total of 16 soil samples (plantation moss-covered soil (PM), plantation bare soil (PS), natural forest moss-covered soil (NM), and natural forest bare soil (NS)) from each grid were sieved (2 mm) in situ, then split into two parts. One part was immediately stored in an ice box, transported to the laboratory, and stored at −4 °C for further processing of soil fungal community analysis. The second part was air-dried after transport to the laboratory for the analysis of soil properties.

2.2. Soil Physicochemical Properties

The soil water content (SWC) was determined using the gravimetric method [22], which involves drying fresh soil samples at a temperature of 105 °C for 24 h. Soil pH levels were quantified using a pH meter (Mettler Toledo, Shanghai, China) with a soil-to-water ratio of 1:2.5 (mass to volume). Soil total carbon (TC) and total nitrogen (TN) contents were measured using an elemental analyzer (Vario Macro Elementar, Germany). The concentrations of nitrate nitrogen (NO3-N) and ammonium nitrogen (NH4+-N) in the soil were extracted with the 2M KCl solution. NO3-N was measured using ultraviolet spectrophotometry, while NH4+-N was determined using the potassium chloride–indophenol colorimetric method [23].

2.3. DNA Extraction, Sequencing, and Data Analysis

Soil DNA of the total microbial genome was extracted from each of the four samples using the Omega Soil DNA Kit (Omega Bio-tek, Norcross, GA, USA). The extracted DNA in three replicates was pooled and dissolved into ED buffer and stored at −20 °C for PCR and sequencing. PCR amplification targeted the ITS2 region of fungal DNA, utilizing the primer sets ITS 3F (5′-GCATCGATGAAGAACGCAGC-3′) and ITS 4R (5′-TCCTCCGCTTATTGATATGC-3′), as described by Menkis et al. [24]. The PCR cycle conditions included pre-denaturation at 95 °C for 3 min, followed by 35 cycles of denaturation at 95 °C for 30 s, annealing at 55 °C for 30 s, and extension at 72 °C for 45 s, with a final extension at 72 °C for 10 min.
Sequencing of the ITS amplicons was conducted on the Illumina MiSeq PE300 platform by Majorbio Bio-Pharm Technology Co., Ltd. (Shanghai, China). The raw sequences were processed for quality control and feature table construction utilizing QIIME 2 along with the DADA2 plugin [25]. Sequences of high quality were grouped into amplicon sequence variants (ASVs) at 100% similarity. Taxonomic classification of each representative ASV was performed using the UNITE database (version 8.0) with a confidence threshold set at 0.7. In total, 1,414,622 high-quality fungal reads from 16 samples were classified into 2126 ASVs. To mitigate the potential influence of variations in sequencing depth, ASVs were rarefied to a uniform total read count of 44,640. Both alpha diversity (including Chao1 richness, Shannon diversity, Pielou’s evenness, and Faith’s phylogenetic diversity) and beta diversity metrics were assessed in QIIME 2 [25]. Additionally, fungal functional guilds were predicted using the Fungi Functional Guild (FUNGuild) tool [26]. This analysis assessed the functional groups of fungi, calculated their relative abundance, and identified the top three fungal phyla by abundance. Classification of ectomycorrhizal exploration types relied on Deemy (http://www.deemy.de/, accessed on 18 September 2024) and previous studies by Agerer [27] and Lilleskov et al. [28]. All sequence data have been deposited in the National Center for Biotechnology Information Sequence Read Archive under accession number PRJNA1174282.
Statistical analyses were performed in R version 4.3.3. Alpha diversity indices (Chao1, ACE, Simpson, and Shannon) were calculated using the ’vegan’ package [29]. Community composition differences between treatments were analyzed using non-metric multidimensional scaling (NMDS) based on Bray–Curtis distances. Microbial co-occurrence networks were constructed to evaluate soil microbial community dynamics. Network metrics, including the total number of nodes, links, network diameter, average clustering coefficient (CC), and relative modularity (RM), were computed using the igraph package in R (version 4.3.3). Network visualization was performed using Gephi software. The statistical significance of community dissimilarity was tested using permutational multivariate analysis of variance (PERMANOVA) with 999 permutations. Differences in soil properties and fungal functional guilds between moss-covered and non-moss soils were assessed using paired Wilcox tests, with p < 0.05 considered statistically significant.

3. Results

3.1. Physicochemical Properties of Soil

In both forests, PM and NM exhibited higher levels of total N, total C, and inorganic N (including NO3-N and NH4+-N) contents compared to PS and NS soils (Figure 1), with significant differences noted in these nutrient contents (p < 0.05). However, the differences in soil moisture content (Figure S1) and pH were not significant. Overall, the presence of moss significantly enhances total C and nutrient content in both plantation and natural forests, while its effect on pH remains relatively weak.

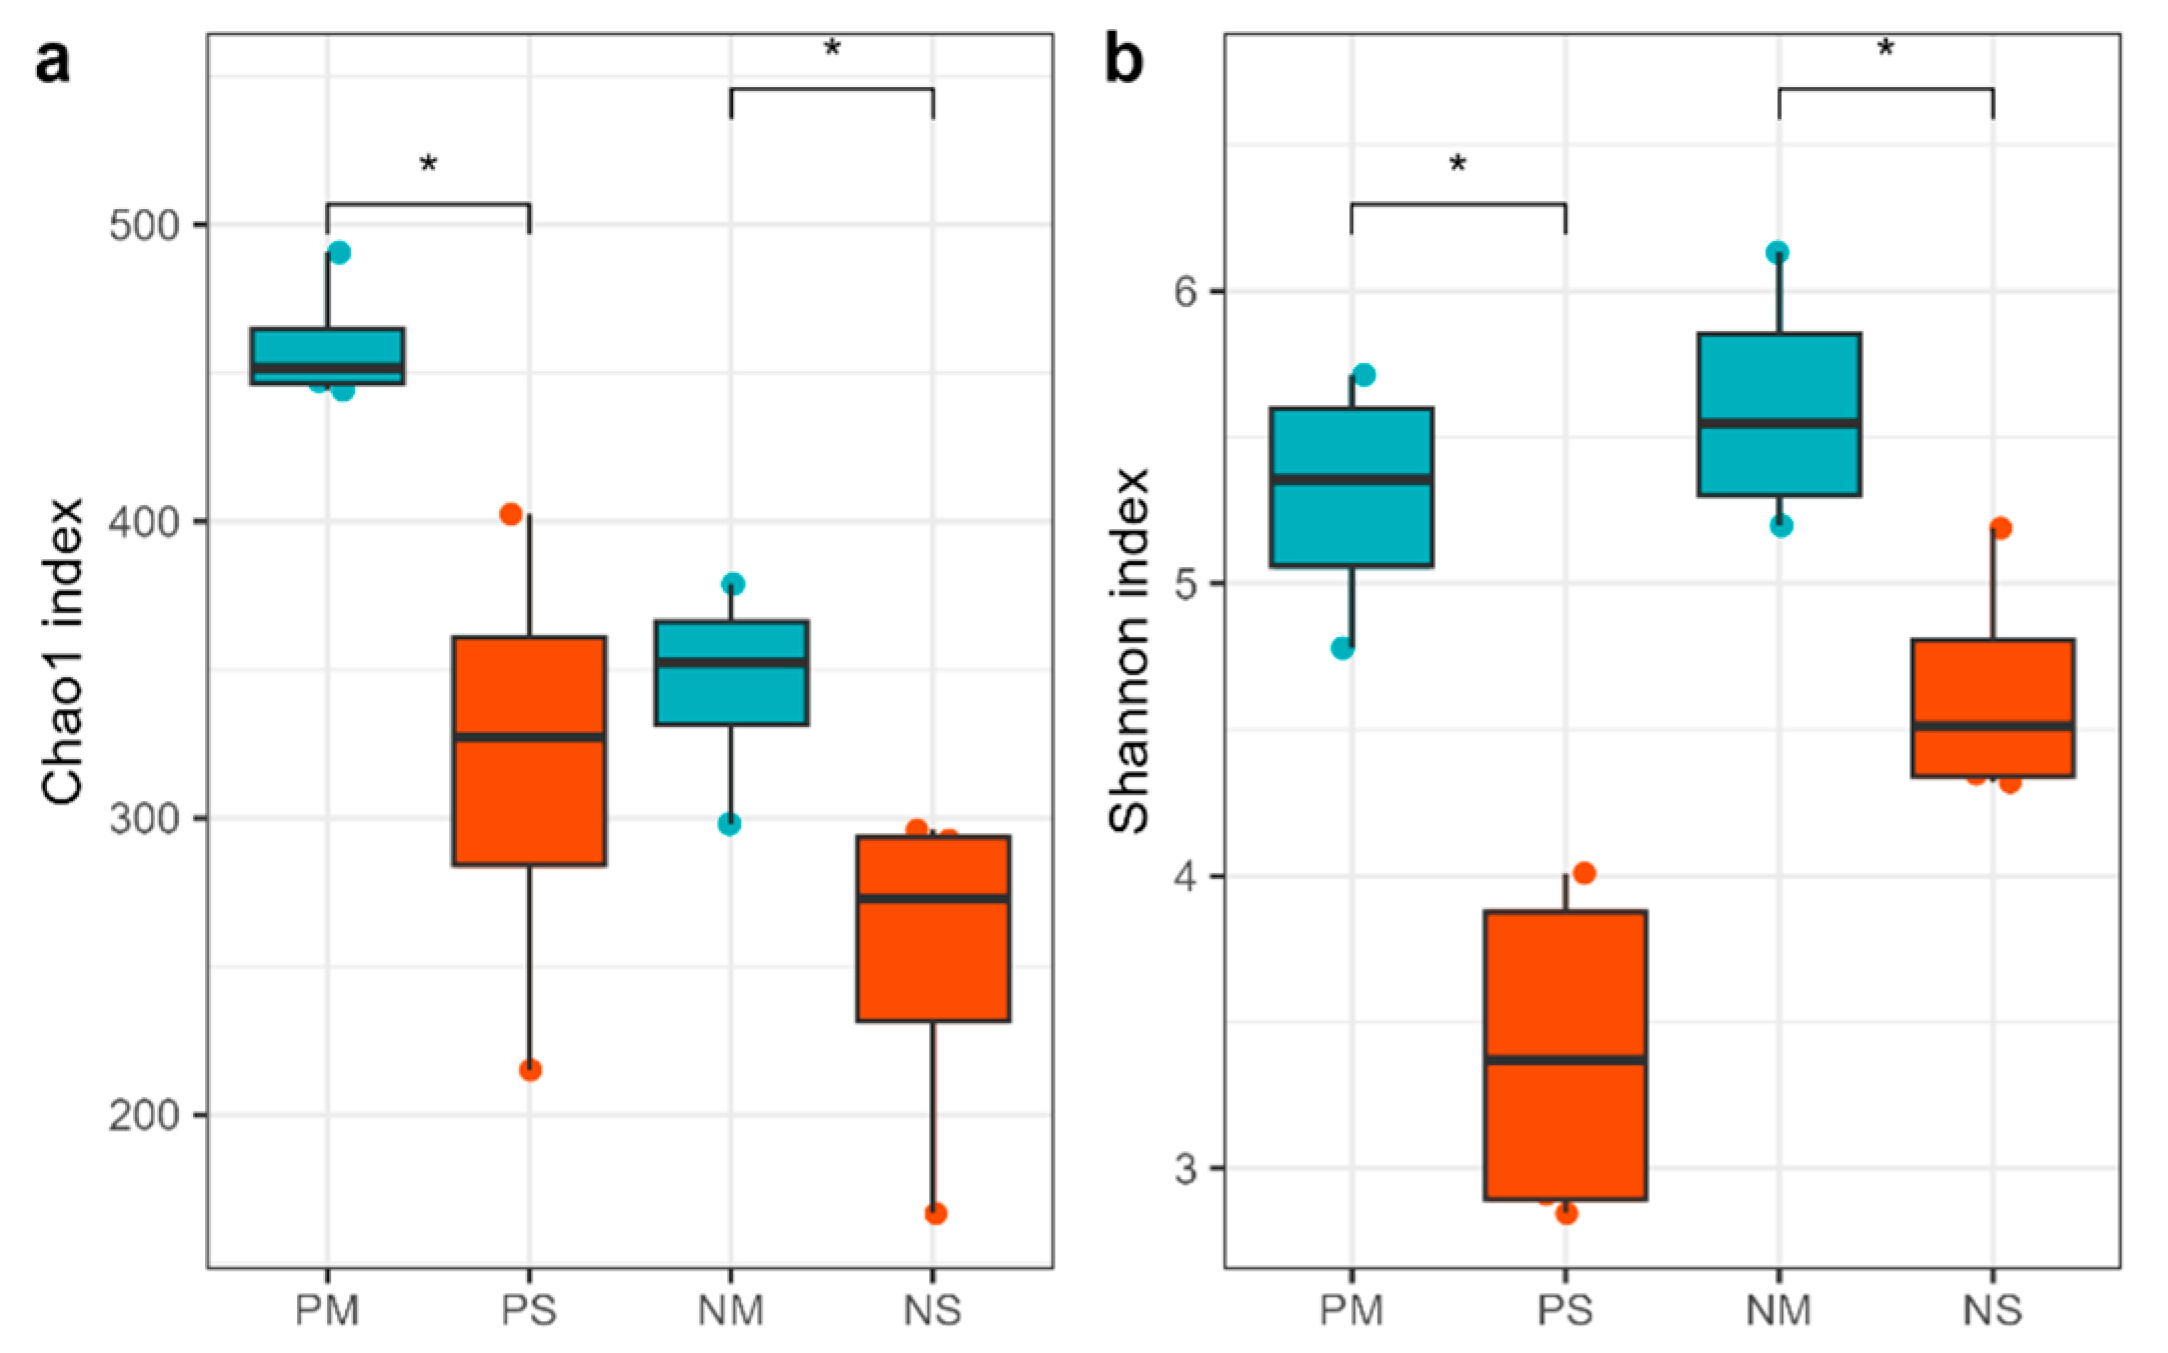
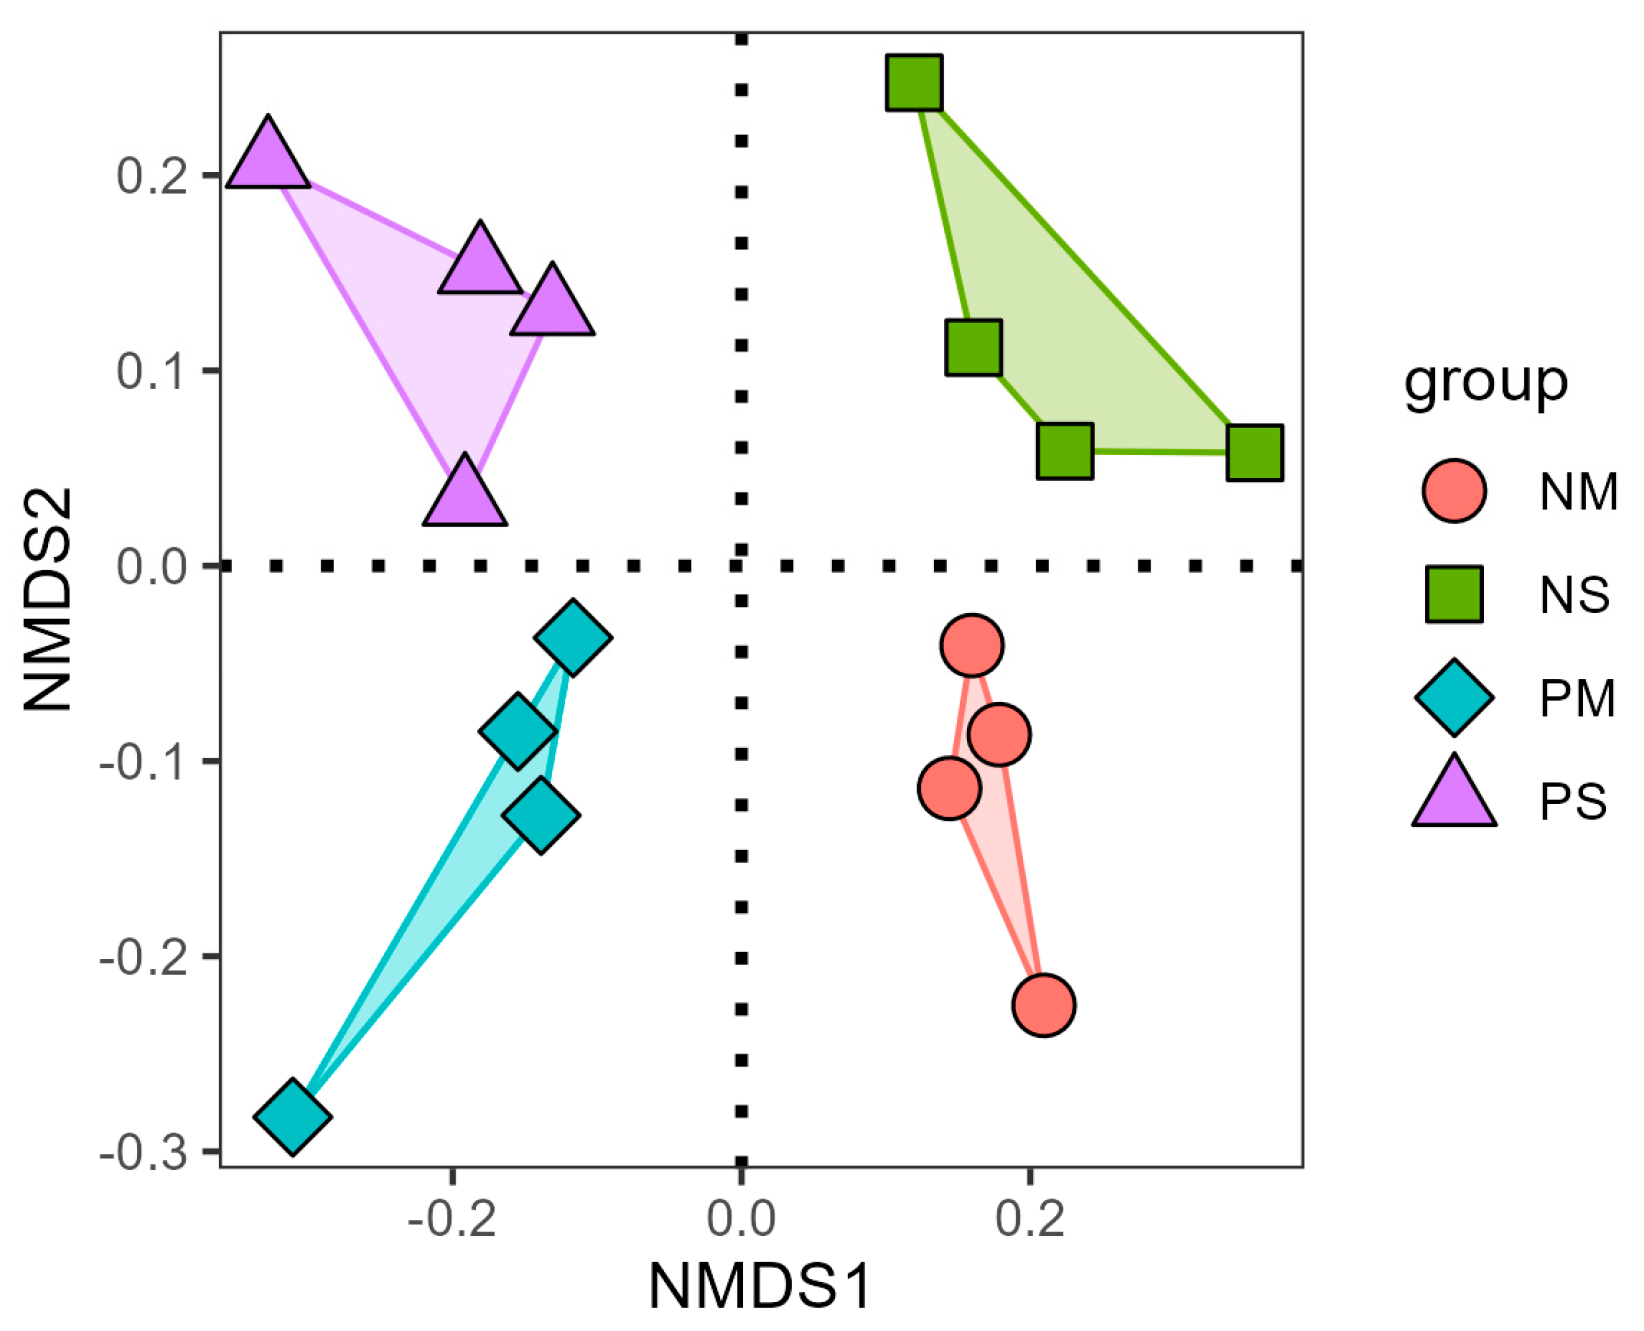
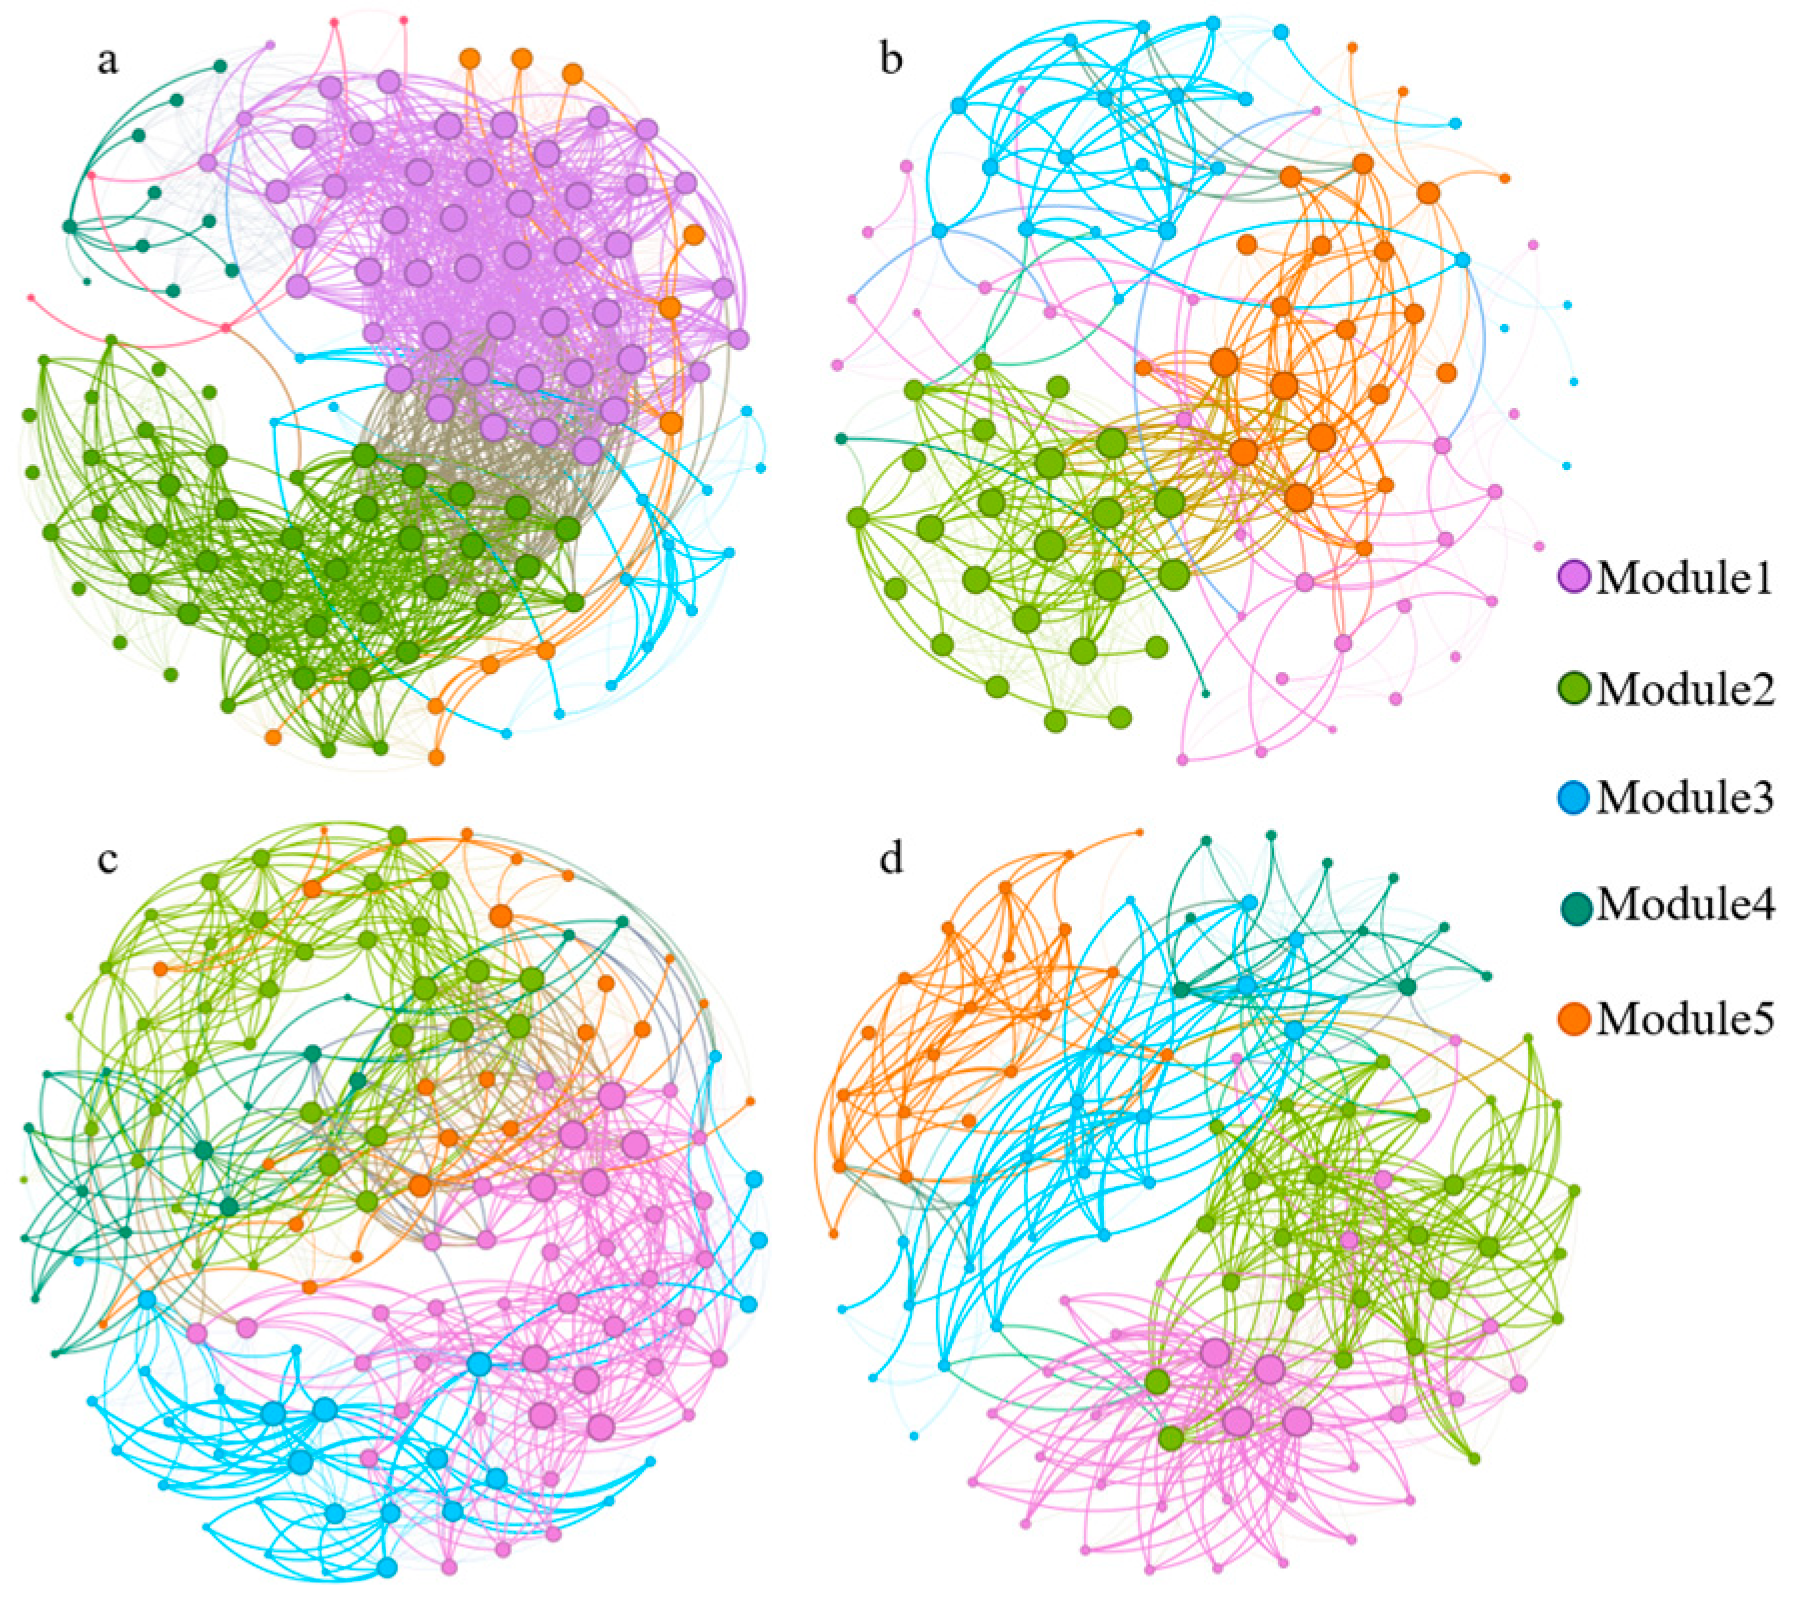
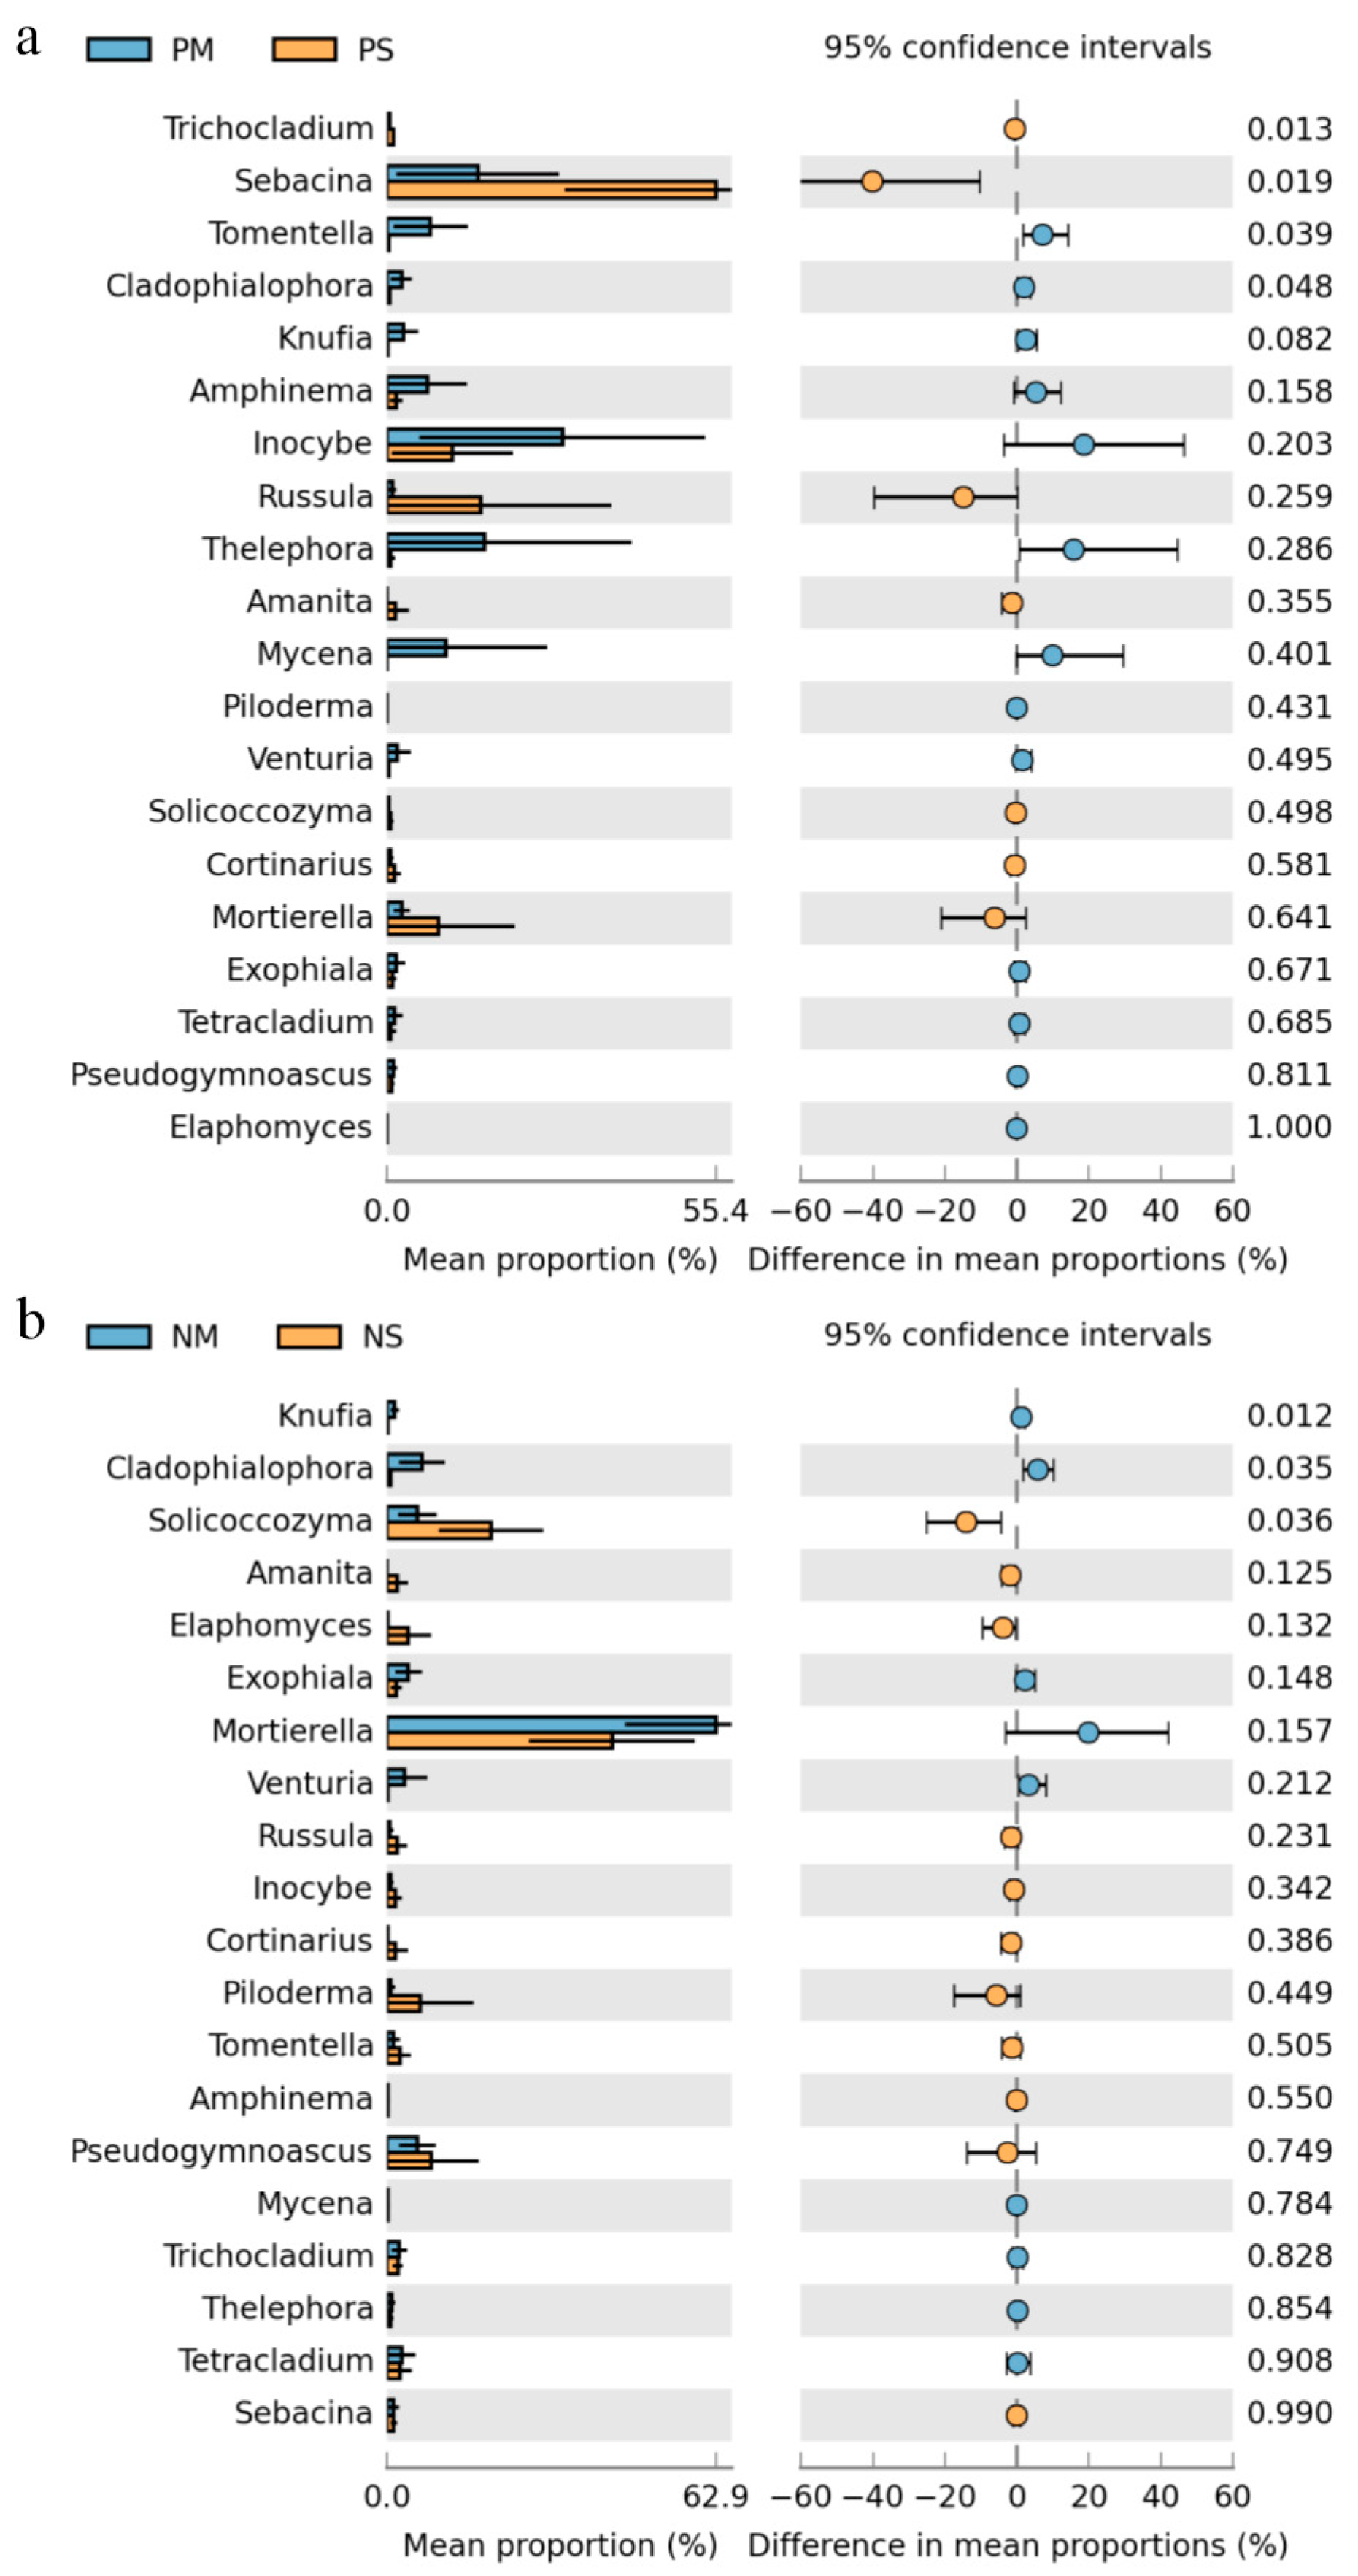
3.2. Soil Fungal Alpha, Beta Diversity, and Co-Occurrence Network Changes

We compared alpha diversity between the PM and PS in the plantation and NM and NS in the natural forest by calculating fungal community richness, diversity, evenness, and phylogenetic diversity features (Table S1). The Chao1 and Shannon indices showed that PM and NM had higher values than those in the PS and NS (Figure 2). For instance, the Chao1 and Shannon diversity of fungal communities in PM ranged from 444.32 to 490.70 and 4.78–5.56, which were significantly higher than those in PS, respectively. Similarly, the Chao1 and Shannon diversity of fungal communities in NM ranged from 498.06 to 378.91 and 5.20–6.13; both were significantly higher than those in NS.
NMDS analysis coupled with PERMANOVA revealed significant distinctions among fungal communities (p = 0.001) across PM, PS, NM, and NS (Figure 3). These four soil fungal communities formed distinct clusters by the principal coordinates. Significant differences in beta diversity (p < 0.05) were observed between PM and PS in the plantation forest (p = 0.021), as well as between NM and NS in the natural forest (p = 0.022). The observed sample dispersion patterns indicate substantial heterogeneity in fungal community structure among these groups.
The effects of fungal interactions among different soils were analyzed by co-occurrence network analysis (Figure 4). In both the plantation and natural forests, the number of edges between nodes in MS was higher than that in BS, and the fungal community in MS showed higher connectivity and complexity. Meanwhile, other topological properties such as average degree, positive correlation numbers, and network diameter were higher in MS than in BS, suggesting that fungal communities tend to coexist in BS. In contrast, the relative modularity was lower in MS than in BS in both forests. However, the relative clustering coefficients in MS were lower than in BS in the plantation forests, suggesting that the fungi are more loosely related to each other, resulting in weaker fungal interactions and the weak stability of the network (Table 1).

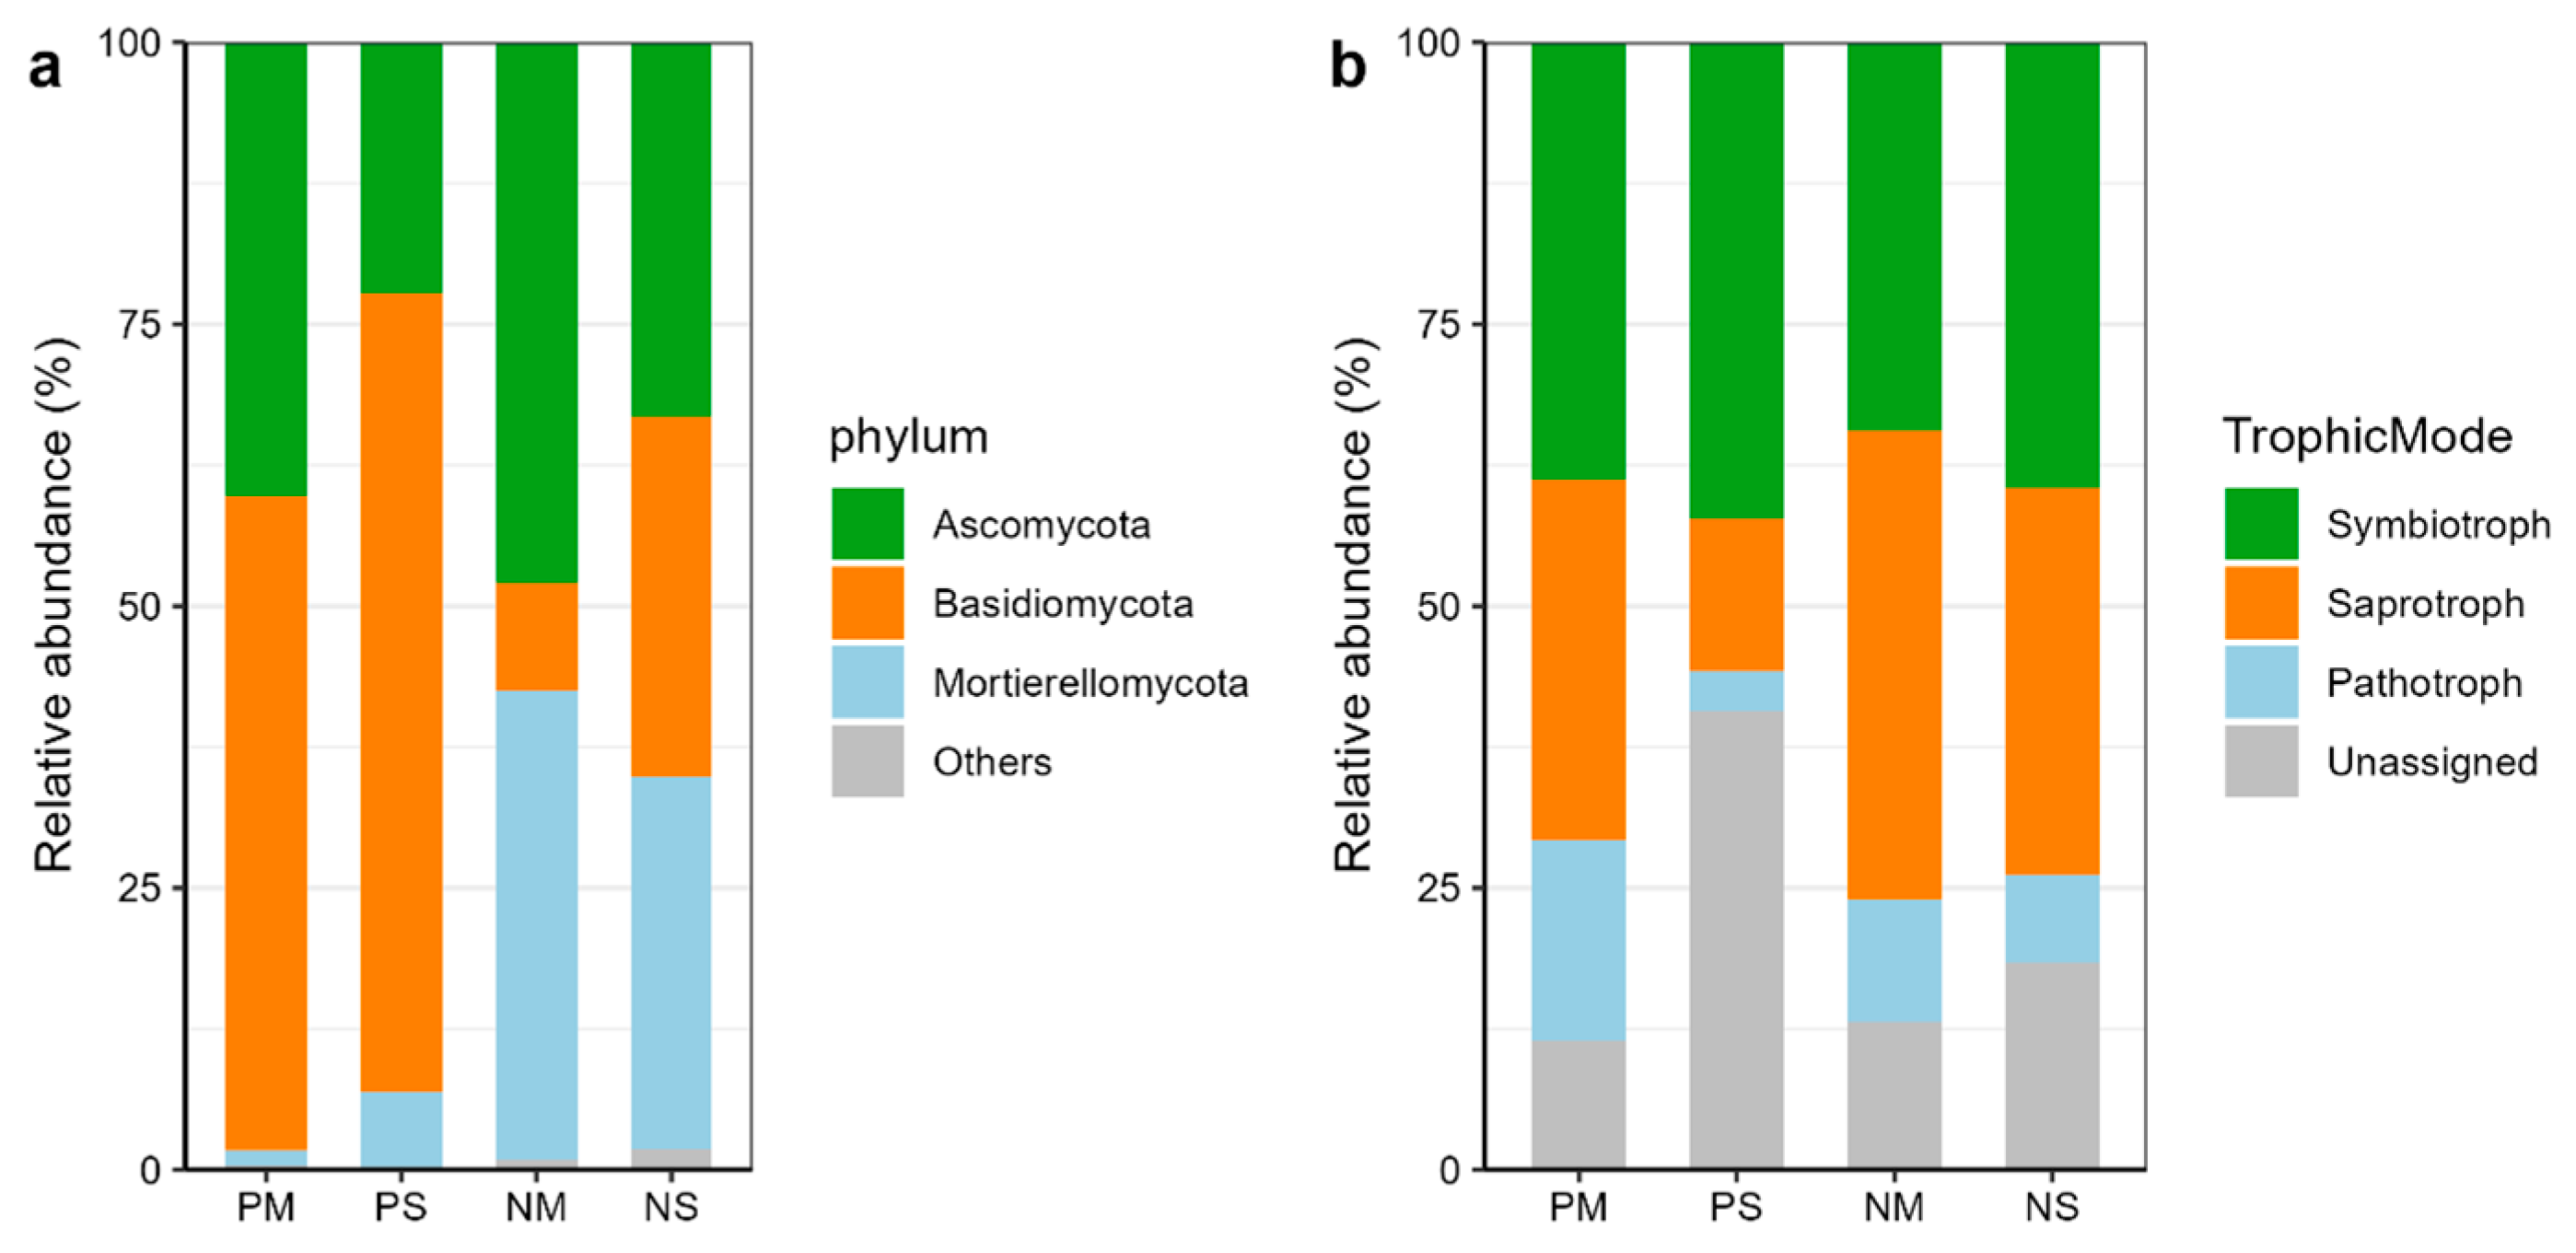
3.3. Dominant Fungal Phylum and Trophic Group Changes

A total of 502,992 high-quality sequences belonging to 10 fungal phyla, 42 classes, 105 orders, 225 family, 389 genera, and 559 species were identified in all samples. Taxonomic profiling revealed that the phyla Basidiomycota, Ascomycota, and Mortierellomycota dominated in all samples (Figure 5a). The relative abundance of Ascomycota in PM and NM was higher than that in PS and NS. The relative abundance of Basidiomycota in the PS and NS was higher than that in the PM and NM. Additionally, the relative abundance of Mortierellomycota in NM was higher than that in NS, but in PM, it was lower than that in PS. FunGuild was used to analyze the metabolic pathways of the fungal communities. The fungal communities in PM, PS, NM, and NS were classified into various functional groups using trophic mode (Figure 5b). In general, about 79.07% of ASVs were classified into trophic modes: Symbiotroph, Saprotroph, and Pathotroph. The relative abundance of Saprotroph and Pathotroph was higher in PM and NM than in PS and NS, while the relative abundance of Symbiotroph showed the opposite trend.

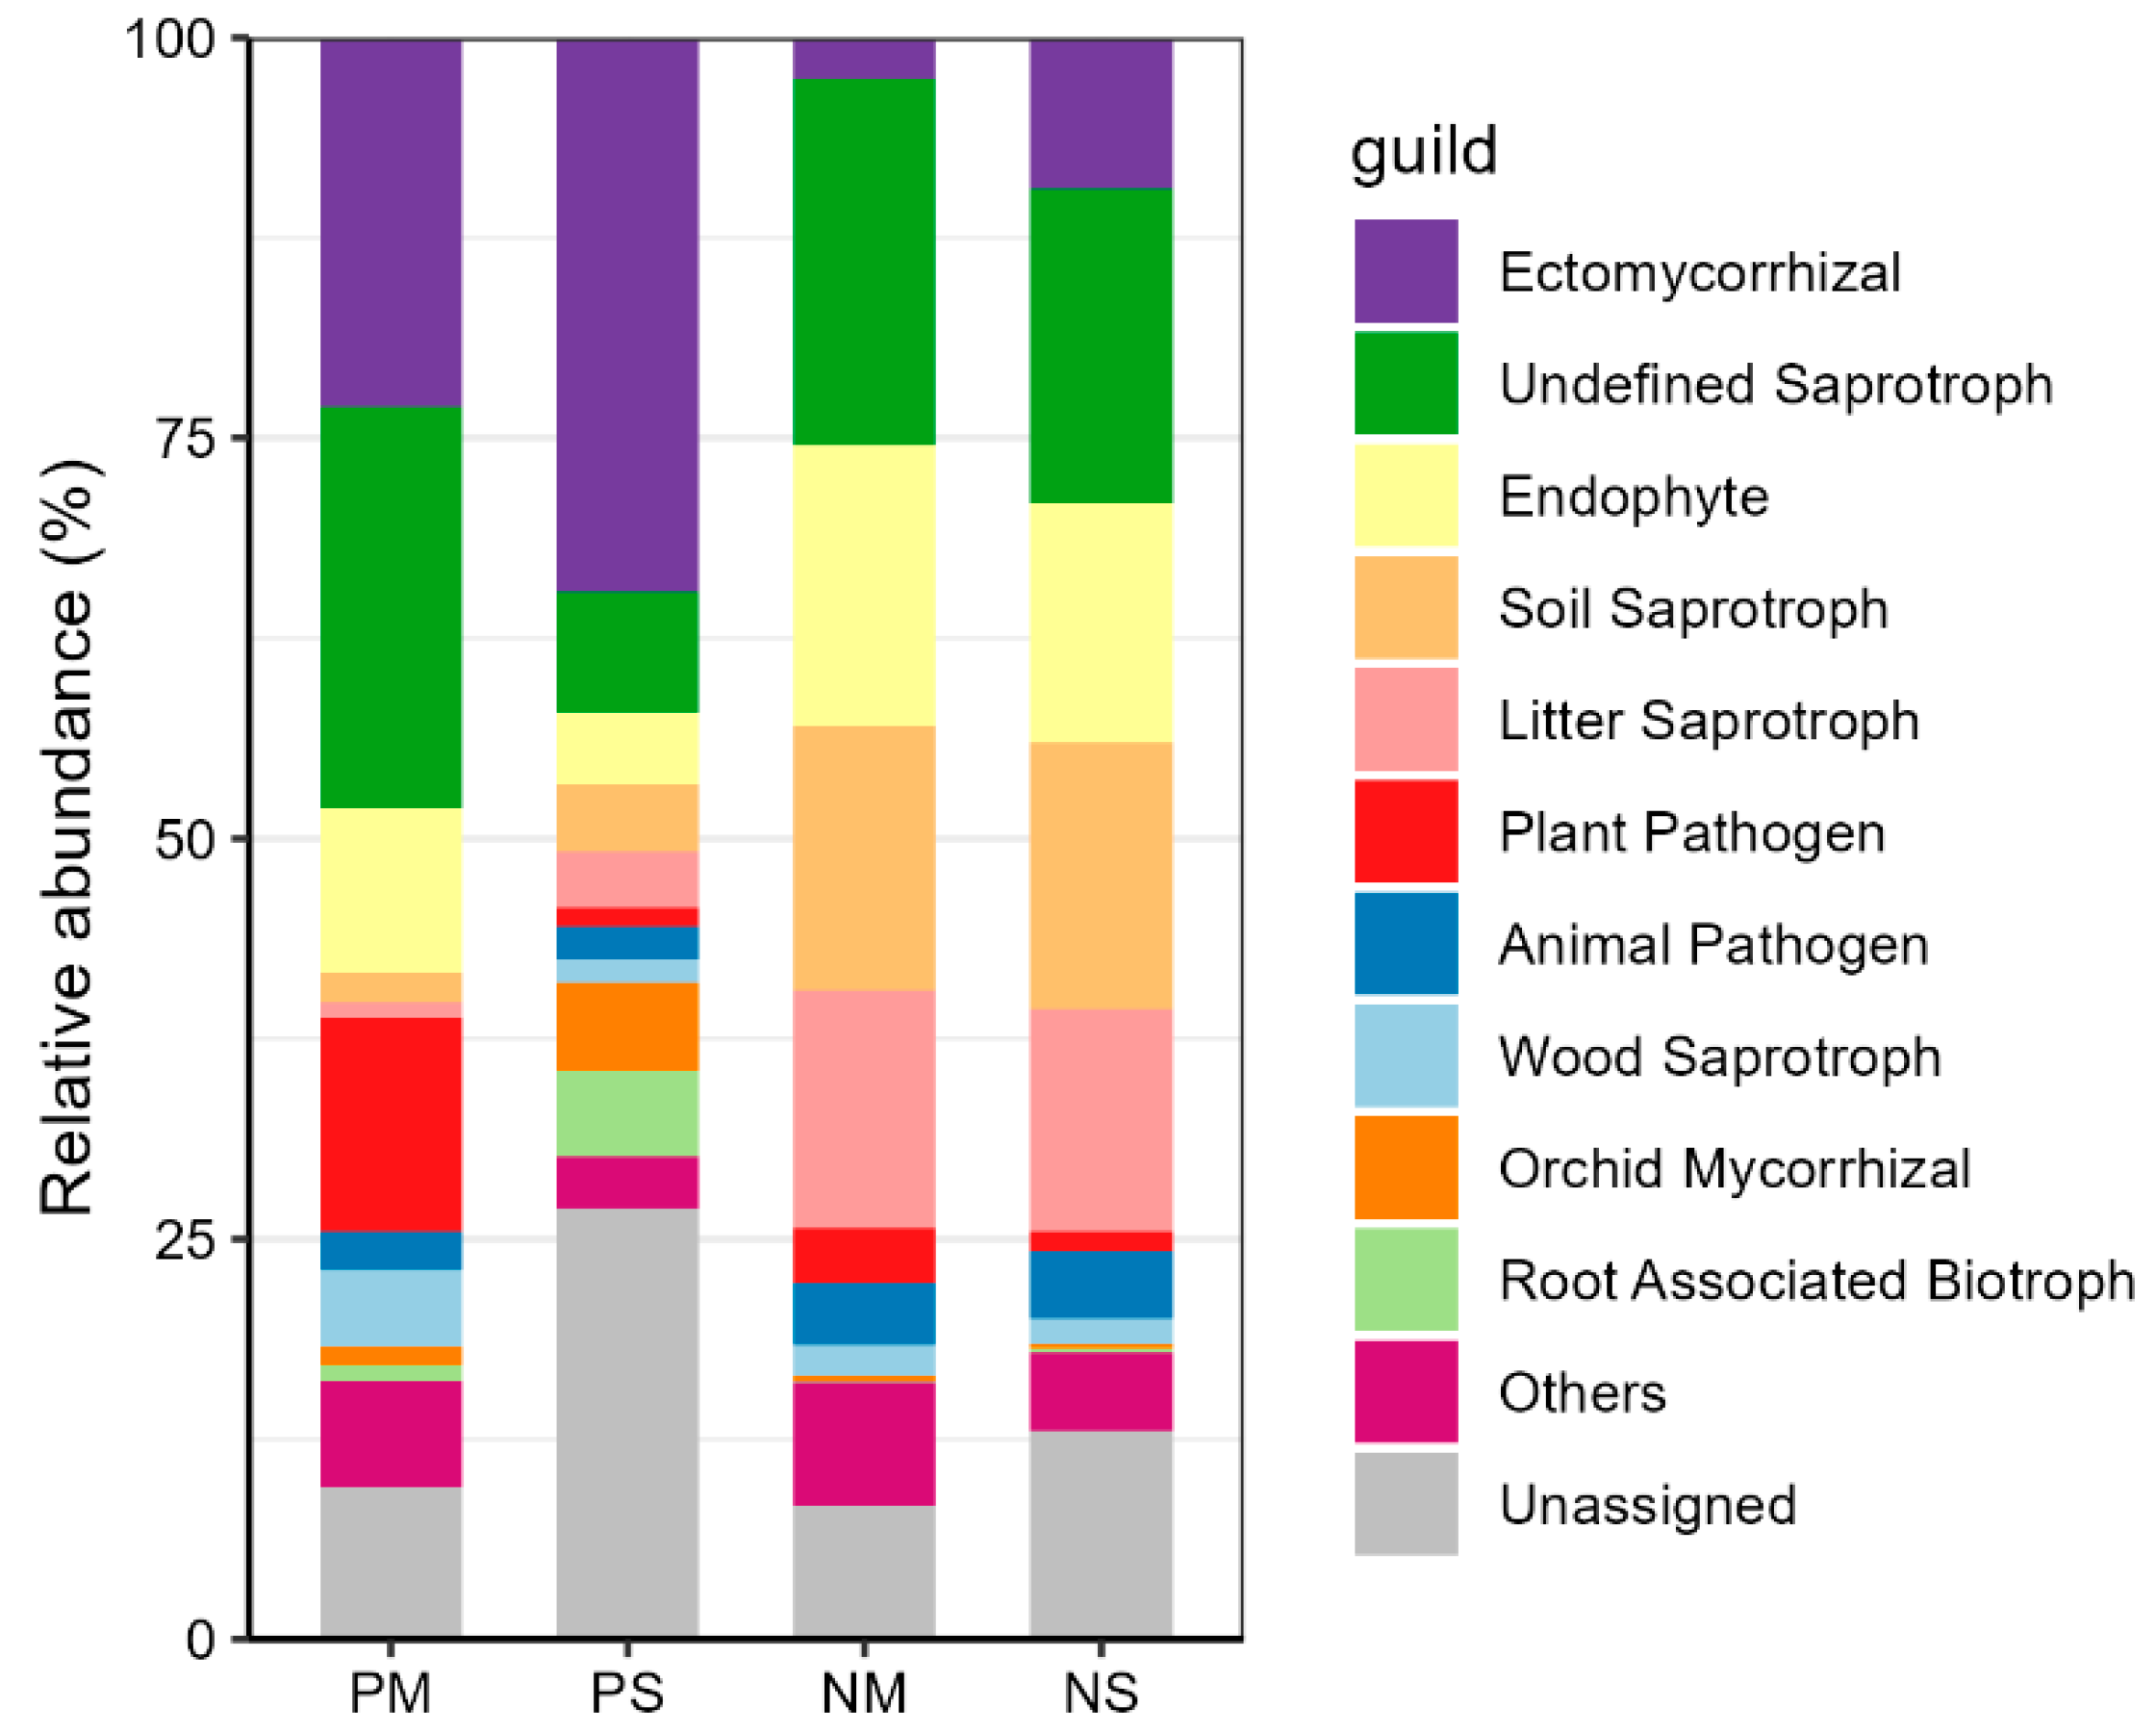
3.4. Dominant Fungal Functional Group Changes

The top ten genera in relative abundance were ectomycorrhizal, undefined saprotroph, Endophyte, Soil Saprotroph, Litter Saprotroph, Plant Pathotroph, Animal Pathotroph, Wood Pathotroph, Orchid Mycorrhizal and Root-Associated Biotroph (Figure 6). Undefined saprotroph was the most observed functional group, accounting for about 18.81% in the natural forest. The relative abundance of undefined saprotroph in MS was significantly higher (p < 0.01) than that in BS in the natural forest (Figure S2). No significant difference was observed in the plantation. Followed by ectomycorrhizal and Endophyte, the relative abundance of ectomycorrhizal in MS was significantly lower than that in BS (p < 0.05) in both plantation and natural forests (Figures S2 and S3). We found that the component proportion of fungal functional groups was distinctly different between each pair of groups. For instance, the relative abundance of ectomycorrhizal fungi in PM and NM was lower than that in PS and NS. However, the undefined saprotroph, Endophyte, Plant Pathogen, and Wood Saprotroph in the PM and NM had a higher relative abundance than that in PS and NS.

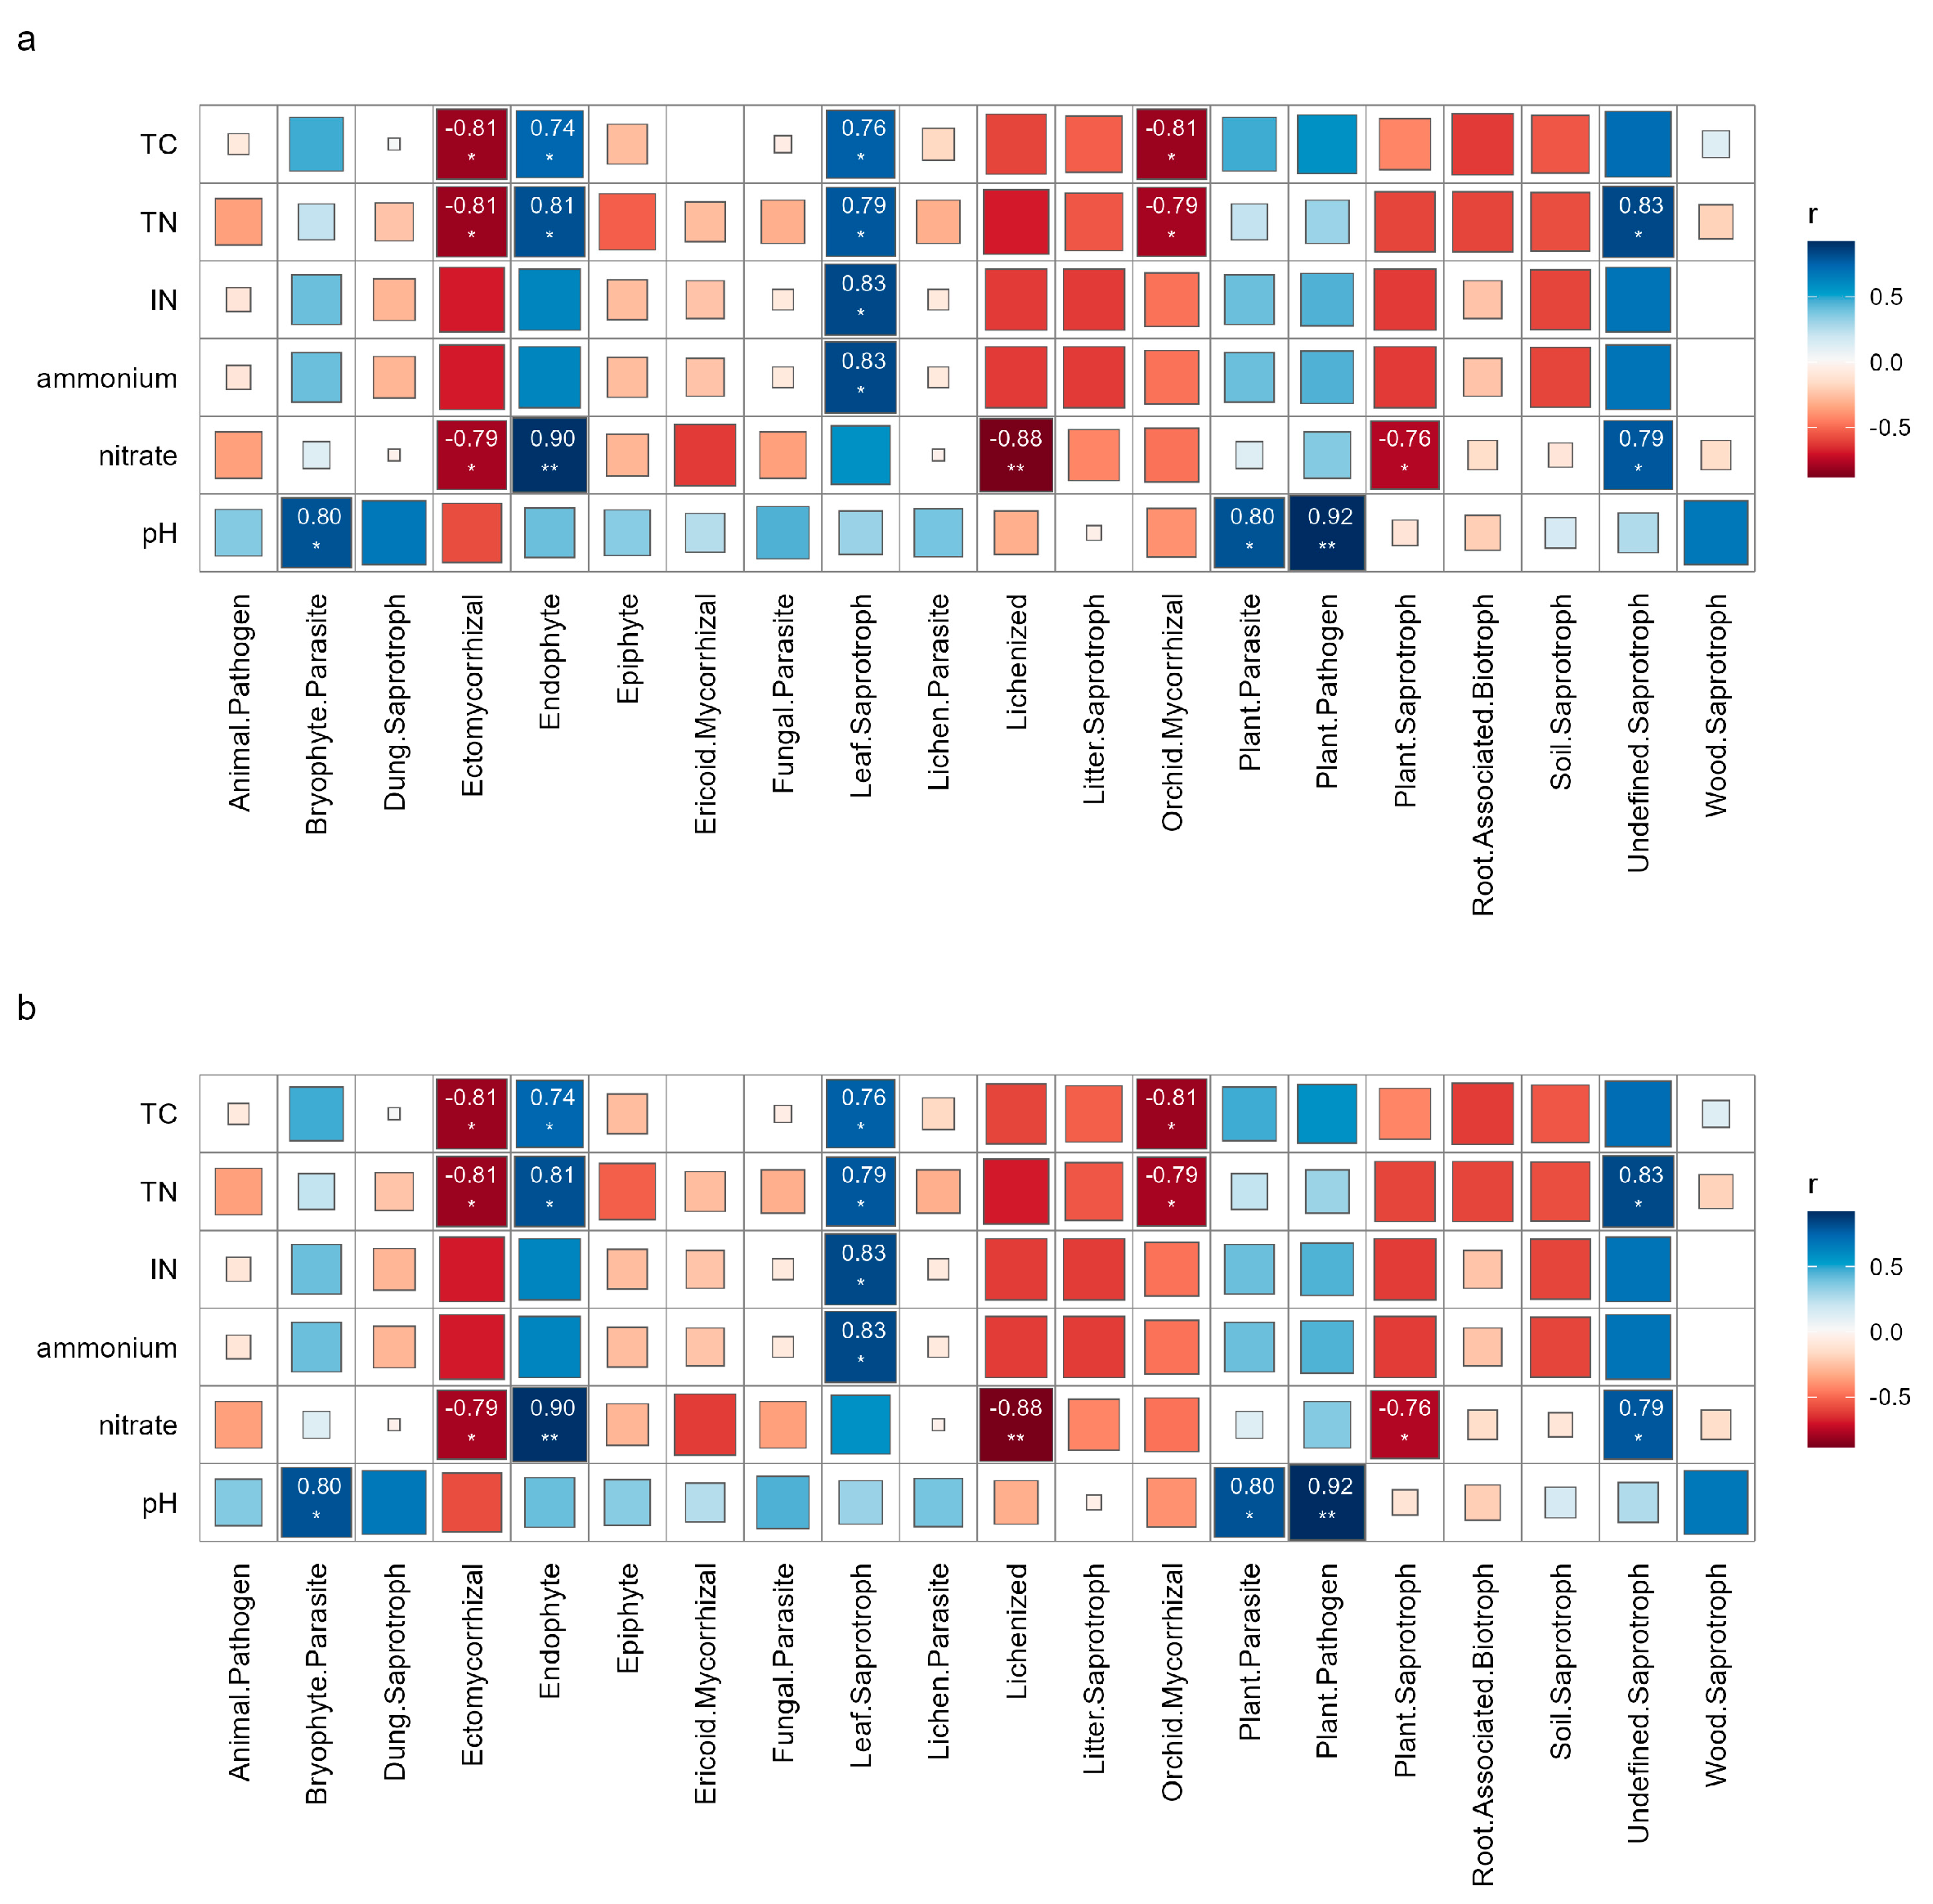
3.5. The Relationship Between Fungal Functions and Soil Physicochemical Properties

The Mantel test was used to explore the effect of soil nutrients on different fungal functional groups (Figure 7). The results showed that in the plantation, the relative abundance of both undefined saprotroph and leaf saprotroph were positively correlated with measured soil nutrients. The relative abundance of undefined saprotroph was significantly and positively correlated with TN and NO3-N (p < 0.05), and the relative abundance of leaf saprotroph was significantly and positively correlated with TC, TN, IN, and NH4+-N (p < 0.05). On the contrary, the relative abundance of ectomycorrhizal was negatively correlated with measured soil nutrients, specifically showing a significant negative correlation (p < 0.05) with TC, TN, and NO3-N. In the natural forest, the relative abundance of both undefined saprotroph and leaf saprotroph was also positively correlated with measured soil nutrients, and the relative abundance of undefined saprotroph was significantly positively correlated (p < 0.05) with TC, TN, IN, and NH4+-N. In addition, the relative abundance of ectomycorrhizal was significantly negatively correlated with TN and NH4+-N (p < 0.05) and showed very significant negative correlations with IN and NO3-N.
The relative abundance of key ectomycorrhizal taxa was different between the MS and BS (Figure 8). In the plantation, the relative abundance of Sebacina and Trichocladium in PS was markedly greater than that in PM (p < 0.05), while the relative abundance of Tomentella and Cladophialophora in PM was significantly higher than that in PS (p < 0.05). In the natural forest, the relative abundance of Solicoccozyma in NS was significantly higher than that in NM (p < 0.05), and the relative abundance of Cladophialophora in NM was significantly higher than that in NS (p < 0.05). The other functional groups showed no significant difference. Additionally, the relative abundance of Mortierella in the natural forest was higher in MS than in BS, and it belonged to saprotrophic fungi.
Additionally, the ectomycorrhizal fungi were further categorized into three exploration types based on mycelium length: contact, short-range, and medium-range. The contact-type fungi included the genus Russula, while the short-range category comprised Sebacina, Inocybe, and Elaphomyces. The medium-range explorers featured Thelephora, Piloderma, and Amanita. Interestingly, Tomentella and Amphinema exhibited dual characteristics, functioning as both contact and medium-range mycorrhizal fungi in nutrient exploration. In our study, the contact type accounted for 11.09%, while the short and medium distance accounted for 44.54% in MS. Meanwhile, the contact type accounted for 17.57%, and the short and medium distance accounted for 64.60% in BS. Obviously, the proportion of short- and medium-distance ectomycorrhizal fungi was lower in MS compared to BS, suggesting distinct fungal foraging strategies.

4. Discussion

4.1. Effect of Moss Cover on Soil Physicochemical Properties

Mosses, as dominant understory vegetation, play a critical role in regulating soil microbial activity and ecosystem processes [10]. In boreal forests, feather mosses enhance soil moisture and temperature [30], regulate the rate of soil mineral weathering [31], and influence soil fertility [32] as well as nutrient availability [33], ultimately shaping the activities of soil microbial communities. Additionally, mosses impact the chemical composition of soil solution including total carbon, total nitrogen, and inorganic nitrogen [34]. By forming a unique microhabitat, moss cover provides favorable conditions for soil microorganisms. Our results revealed significantly higher concentrations of total carbon (TC), total nitrogen (TN), and inorganic nitrogen (IN) in moss-covered soils (MSs) compared to bare soils (BSs) across both forest types investigated. These observations are consistent with previous findings that moss cover enhances soil nutrient retention capacity, particularly through increased cation exchange capacity (CEC) and available nitrogen pools [34]. The characteristic wetting–drying cycles in moss-dominated habitats facilitate the release and accumulation of nutrients in the soil matrix, particularly contributing to nitrogen pool enrichment [11]. Specifically, in alpine forest ecosystems, MS exhibits elevated concentrations of NH4+-N [12]. The presence of moss cover substantially enhances both inorganic and total nitrogen content, thereby accelerating nitrogen transformation processes, including mineralization and nitrification rates [13,14,15]. Additionally, soil characteristics such as TC, TN, magnesium (Mg), and pH significantly influence the composition of soil microbial communities [10]. Notably, soil fungal communities demonstrate a heightened sensitivity to variations in these physicochemical properties [35].

4.2. Effects of Moss Cover on Fungal Community Diversity and Composition Structure

Our results revealed significantly elevated Chao1 and Shannon indices for α-diversity in MS, demonstrating the enhanced diversity and abundance of soil fungal communities relative to BS. This is consistent with previous research indicating that fungal α-diversity exhibits greater sensitivity to forest ground cover than bacterial α-diversity, with moss-covered microhabitats fostering richer microbial communities [36]. Moreover, β-diversity analyses indicated considerable structural differences in fungal communities (p = 0.001), with distinct community compositions between MS and BS in two forest types (p < 0.05). These observations align with the findings of Sweeney et al. [37], who demonstrated that microhabitat conditions fundamentally shape endophytic fungal community structures, confirming the enhanced fungal diversity and abundance in MS relative to BS.
In our study, the fungal network in MS was more complex; this is consistent with the results of our diversity analysis. More complex networks are considered more resistant to external environmental pressures [38]. In MS, positive interactions increased and modularity decreased in fungal communities. However, microbiomes dominated by positive interactions are often regarded as unstable. Environmental factors such as global warming and seasonal variations in precipitation can significantly influence soil microbial community composition [38]. To stabilize the network, fungal communities may rely on positive feedback loops and co-fluctuation mechanisms, allowing rapid responses and efficient spread throughout the system [39]. Additionally, cross-modular associations between taxa were more prevalent under moss cover, enabling fungal networks to adapt dynamically to environmental extremes [40]. This dynamic adaptation results in greater resilience, reflected by stronger temporal fluctuations in response to environmental changes.
The soil fungal communities were predominantly characterized by Basidiomycota, Ascomycota, and Mortierellomycota. Our findings indicate that moss cover significantly enhances the relative abundance of Ascomycota and Basidiomycota. Specifically, the Ascomycota phylum plays a crucial role in the decomposition of recalcitrant organic matter and nutrient cycling processes [41]. The saprotroph and Symbiotroph are fundamental to soil organic matter decomposition and nutrient cycling [42,43]. Extensive research has demonstrated that variations in vegetation cover and nitrogen concentrations substantially influence the composition and diversity of soil microbial communities [44,45]. Our investigation revealed significantly higher proportions of Ascomycota in MS compared to BS, which can be attributed to elevated inorganic nitrogen concentrations in MS, whereby Ascomycota participates in nitrogen cycling within the rhizosphere through symbiotic ectomycorrhizal associations [46].

4.3. Effects of Moss Cover on Fungal Functional Guilds

In all trophic classifications, the fungal community composition was predominantly characterized by Symbiotroph, Saprotroph, and Pathotroph guilds. Symbiotrophs facilitate host plant water and mineral absorption and bolster plant resilience against abiotic and biotic stress [47,48]. Saprotroph fungi, largely free-living, constitute the primary decomposers in forest ecosystems, where their enzymatic capacity for degrading complex organic polymers, particularly lignin and cellulose, is fundamental to biogeochemical cycling [49]. In synergy with Symbiotrophs, these fungi also contribute to nutrient transport to host plants [50].
Our investigations revealed a higher relative abundance of Saprotrophs in MS compared to BS, while ectomycorrhizal fungi were more prevalent in BS. Saprotrophic fungi predominantly inhabit the litter layer, deriving carbon and nutrients from fresh and partially decomposed organic matter [51]. In contrast, ectomycorrhizal fungi primarily colonize the more decomposed humus layer, establishing extensive mycelial networks to enhance nutrient uptake, particularly nitrogen, in the rhizosphere [20,52,53,54]. These fungal associations access limited nutrients through extensive extraradical mycelial networks emanating from root tips, thereby optimizing soil resource exploration beyond nutrient-depleted zones [55].
Ectomycorrhizal fungi are classified into distinct morphological categories, contact, short-range, medium-range, and long-range types, based on their nutrient acquisition strategies [27]. In our study, the relative abundance of contact, short-range, and medium-range ectomycorrhizal fungi was significantly reduced in natural forests compared to plantations. This divergence may be attributed to higher nitrogen availability in natural forests, thereby reducing the dependency on ectomycorrhizal nutrient uptake [56]. Moreover, this phenomenon explains the greater abundance of medium-range ectomycorrhizal fungi in moss-covered sites (MSs), reflecting a diminished need for short-range types. Recent investigations have established that atmospheric nitrogen deposition enhances productivity in plantation ecosystems, while simultaneously suppressing productivity in natural forests [57]. Additionally, effective nitrogen levels significantly influence the abundance of ectomycorrhizal fungi within these natural forest ecosystems [58]. Our experiments highlighted significantly higher nitrogen content in moss-covered natural forests, potentially leading to reduced primary productivity and ectomycorrhizal fungal abundance.
In plantations, short- and medium-range ectomycorrhizal fungi exhibited lower abundance in MS compared to BS. Under nitrogen-limited soils, plants typically enhance their association with ectomycorrhizal fungi to facilitate nitrogen acquisition beyond the root zone. However, once nitrogen limitation is alleviated, this dependency diminishes [56]. This mechanism may explain the elevated presence of short- and medium-range ectomycorrhizal fungi in BS. Additionally, soil fungal communities are often categorized as miners, scavengers, and carriers based on their ecological roles in nutrient acquisition. Our findings substantiate this functional classification theory. Moss-covered soils exhibited enhanced nutrient status, favoring the proliferation of groups associated with nutrient decomposition and mobilization. In contrast, nutrient-limited BSs predominantly harbored exploration and mobilization groups [21].

5. Conclusions

Our findings provide compelling evidence of significantly higher diversity and distinct fungal community composition within MS. Moss cover in both plantation and natural forests increases soil water content and enriches key nutrients, such as total carbon and total nitrogen, creating a favorable microhabitat for soil fungi. Saprotrophic and ectomycorrhizal guilds demonstrate functional dominance in MS, highlighting their role in nutrient decomposition and cycling, whereas ectomycorrhizal guilds are more prevalent in BS, where they optimize nutrient acquisition through extensive mycelial networks. Additionally, moss cover fosters the development of more complex fungal networks in MS, which exhibit greater resistance to environmental extremes but lower overall stability compared to those in BS. These findings suggest that moss cover not only enriches soil nutrient pools but also attracts decomposer and nutrient-mobilizing fungi, thereby playing a crucial role in shaping soil fungal communities and promoting biogeochemical processes. Conversely, nutrient-limited BS predominantly supports ectomycorrhizal fungi adapted for resource optimization. Our findings emphasize the integral role of moss cover in maintaining soil fertility and enhancing ecosystem productivity. By improving conditions that promote fungal diversity and functional differentiation, moss cover supports critical ecological processes and fosters forest soil health. This study advances our understanding of moss cover as a cornerstone of carbon and nutrient cycling within forest ecosystems, underscoring its essential contribution to ecosystem resilience and sustainability.

Supplementary Materials

The following supporting information can be downloaded at https://www.mdpi.com/article/10.3390/f16010138/s1: Table S1: Alpha diversity of fungal communities between the PM and PS and NM and NS in plantation and natural forests; Figure S1: The soil moisture content between the PM and PS and NM and NS in plantation and natural forests; Figure S2: Differences in relative abundance (%) of the dominant trophic guilds of the fungal communities between the NM and NS in natural forest; Figure S3: Differences in relative abundance (%) of the dominant trophic guilds of the fungal communities between the PM and PS in plantation forest.

Author Contributions

Data curation, Q.S.; writing—original draft, M.W.; writing—review and editing, D.L. All authors have read and agreed to the published version of the manuscript.

Funding

This research was funded by the National Natural Science Foundation of China, grant number 31800425; Talent Program by Sichuan Normal University, grant numbers pt31800425; qdf20210029.

Data Availability Statement

All sequence data have been deposited in the National Center for Biotechnology Information Sequence Read Archive under accession number PRJNA1174282.

Conflicts of Interest

The authors declare no conflicts of interest.

References

  1. Berdugo Moreno, M.; Quant, J.; Wason, J.; Dovčiak, M. Latitudinal Patterns and Environmental Drivers of Moss Layer Cover in Extratropical Forests. Glob. Ecol. Biogeogr. 2018, 27, 1213–1224. [Google Scholar] [CrossRef]
  2. Rousk, K.; Jones, D.L.; Deluca, T.H. Moss-Cyanobacteria Associations as Biogenic Sources of Nitrogen in Boreal Forest Ecosystems. Front. Microbiol. 2013, 4, 150. [Google Scholar] [CrossRef] [PubMed]
  3. Rousk, K.; Michelsen, A. Ecosystem Nitrogen Fixation throughout the Snow-Free Period in Subarctic Tundra: Effects of Willow and Birch Litter Addition and Warming. Glob. Change Biol. 2017, 23, 1552–1563. [Google Scholar] [CrossRef]
  4. DeLuca, T.H.; Zackrisson, O.; Nilsson, M.-C.; Sun, S.; Arróniz-Crespo, M. Long-Term Fate of Nitrogen Fixation in Pleurozium schreberi Brid (Mit.) Moss Carpets in Boreal Forests. Appl. Soil Ecol. 2022, 169, 104215. [Google Scholar] [CrossRef]
  5. Renaudin, M.; Blasi, C.; Bradley, R.L.; Bellenger, P. New Insights into the Drivers of Moss-associated Nitrogen Fixation and Cyanobacterial Biomass in the Eastern Canadian Boreal Forest. J. Ecol. 2022, 110, 1403–1418. [Google Scholar] [CrossRef]
  6. Renaudin, M.; Laforest-Lapointe, I.; Bellenger, J.-P. Unraveling Global and Diazotrophic Bacteriomes of Boreal Forest Floor Feather Mosses and Their Environmental Drivers at the Ecosystem and at the Plant Scale in North America. Sci. Total Environ. 2022, 837, 155761. [Google Scholar] [CrossRef]
  7. Calabria, L.M.; Petersen, K.S.; Bidwell, A.; Hamman, S.T. Moss-Cyanobacteria Associations as a Novel Source of Biological N2-Fixation in Temperate Grasslands. Plant Soil 2020, 456, 307–321. [Google Scholar] [CrossRef]
  8. Groß, C.; Hossen, S.; Dittrich, S.; Knorr, K.-H.; Borken, W.; Noll, M. Biological Nitrogen Fixation, Diversity and Community Structure of Diazotrophs in Two Mosses in 25 Temperate Forests. Environ. Microbiol. 2024, 26, e16555. [Google Scholar] [CrossRef]
  9. Mayer, M.; Rewald, B.; Matthews, B.; Sandén, H.; Rosinger, C.; Katzensteiner, K.; Gorfer, M.; Berger, H.; Tallian, C.; Berger, T.W.; et al. Soil Fertility Relates to Fungal-Mediated Decomposition and Organic Matter Turnover in a Temperate Mountain Forest. New Phytol. 2021, 231, 777–790. [Google Scholar] [CrossRef]
  10. Liu, T.; Wu, X.; Li, H.; Alharbi, H.; Wang, J.; Dang, P.; Chen, X.; Kuzyakov, Y.; Yan, W. Soil Organic Matter, Nitrogen and pH Driven Change in Bacterial Community Following Forest Conversion. For. Ecol. Manag. 2020, 477, 118473. [Google Scholar] [CrossRef]
  11. Slate, M.; Sullivan, B.; Callaway, R. Desiccation and Rehydration of Mosses Greatly Increases Resource Fluxes That Alter Soil Carbon and Nitrogen Cycling. J. Ecol. 2019, 107, 1767–1778. [Google Scholar] [CrossRef]
  12. Siwach, A.; Kaushal, S.; Sarma, K.; Baishya, R. Interplay of Moss Cover and Seasonal Variation Regulate Soil Physicochemical Properties and Net Nitrogen Mineralization Rates in Central Himalayas, India. J. Environ. Manag. 2023, 345, 118839. [Google Scholar] [CrossRef] [PubMed]
  13. Koranda, M.; Michelsen, A. Mosses Reduce Soil Nitrogen Availability in a Subarctic Birch Forest via Effects on Soil Thermal Regime and Sequestration of Deposited Nitrogen. J. Ecol. 2021, 109, 1424–1438. [Google Scholar] [CrossRef] [PubMed]
  14. Li, A.; Wang, G.; DeLuca, T.H.; Sun, S.; Zhang, W.; Chen, P.; Wu, A.; Sun, X.; Sun, H.; Hu, Z. Soil Nitrogen Transformations Differ under Sedge and Bryophyte Communities in a Subalpine Forest on the Eastern Tibetan Plateau. Geoderma 2023, 430, 116309. [Google Scholar] [CrossRef]
  15. Wang, L.; Fu, S.; Gao, H.; Li, H.; Liu, Y.; Zhang, L.; Li, H.; You, C.; Liu, S.; Tan, B.; et al. Linking Fungal Community Structure with Soil Nitrogen Dynamics Following Forest Conversion in a Subalpine Forest in China. Geoderma 2023, 433, 116448. [Google Scholar] [CrossRef]
  16. Hu, P.; Xiao, J.; Zhang, W.; Xiao, L.; Yang, R.; Xiao, D.; Zhao, J.; Wang, K. Response of Soil Microbial Communities to Natural and Managed Vegetation Restoration in a Subtropical Karst Region. Catena 2020, 195, 104849. [Google Scholar] [CrossRef]
  17. Li, D.; Wen, L.; Yang, L.; Luo, P.; Xiao, K.; Chen, H.; Zhang, W.; He, X.; Chen, H.; Wang, K. Dynamics of Soil Organic Carbon and Nitrogen Following Agricultural Abandonment in a Karst Region. JGR Biogeosci. 2017, 122, 230–242. [Google Scholar] [CrossRef]
  18. Li, D.; Wen, L.; Jiang, S.; Song, T.; Wang, K. Responses of Soil Nutrients and Microbial Communities to Three Restoration Strategies in a Karst Area, Southwest China. J. Environ. Manag. 2018, 207, 456–464. [Google Scholar] [CrossRef]
  19. Arróniz-Crespo, M.; Bougoure, J.; Murphy, D.V.; Cutler, N.A.; Souza-Egipsy, V.; Chaput, D.L.; Jones, D.L.; Ostle, N.; Wade, S.C.; Clode, P.L.; et al. Revealing the Transfer Pathways of Cyanobacterial-Fixed N into the Boreal Forest through the Feather-Moss Microbiome. Front. Plant Sci. 2022, 13, 1036258. [Google Scholar] [CrossRef]
  20. Tedersoo, L.; Bahram, M. Mycorrhizal Types Differ in Ecophysiology and Alter Plant Nutrition and Soil Processes. Biol. Rev. 2019, 94, 1857–1880. [Google Scholar] [CrossRef]
  21. Cao, T.; Luo, Y.; Shi, M.; Tian, X.; Kuzyakov, Y. Microbial Interactions for Nutrient Acquisition in Soil: Miners, Scavengers, and Carriers. Soil Biol. Biochem. 2024, 188, 109215. [Google Scholar] [CrossRef]
  22. Li, Z.; Wang, Z.; Zhang, W.; Zhu, J.; Chen, B.; Jiang, L.; Xu, D.; Li, W.; Liu, J.; He, Z. Soil Environments Regulate Dominant Soil Fungal Communities along an Elevational Gradient in Subtropical Forests. Forests 2024, 15, 643. [Google Scholar] [CrossRef]
  23. Chen, Z.; Li, S.; Sun, X.; He, L.; Zhou, W.; Zhao, G.; Yu, J.; Bai, X.; Zhang, J. Characteristics of Bacterial Communities under Different Tree Species and Their Response to Soil Physicochemical Properties. Forests 2024, 15, 740. [Google Scholar] [CrossRef]
  24. Menkis, A.; Burokienė, D.; Gaitnieks, T.; Uotila, A.; Johannesson, H.; Rosling, A.; Finlay, R.D.; Stenlid, J.; Vasaitis, R. Occurrence and Impact of the Root-Rot Biocontrol Agent Phlebiopsis Gigantea on Soil Fungal Communities in Picea Abies Forests of Northern Europe. FEMS Microbiol. Ecol. 2012, 81, 438–445. [Google Scholar] [CrossRef]
  25. Bolyen, E.; Rideout, J.R.; Dillon, M.R.; Bokulich, N.A.; Abnet, C.C.; Al-Ghalith, G.A.; Alexander, H.; Alm, E.J.; Arumugam, M.; Asnicar, F.; et al. Reproducible, Interactive, Scalable and Extensible Microbiome Data Science Using QIIME 2. Nat. Biotechnol. 2019, 37, 852–857. [Google Scholar] [CrossRef]
  26. Nguyen, N.H.; Song, Z.; Bates, S.T.; Branco, S.; Tedersoo, L.; Menke, J.; Schilling, J.S.; Kennedy, P.G. FUNGuild: An Open Annotation Tool for Parsing Fungal Community Datasets by Ecological Guild. Fungal Ecol. 2016, 20, 241–248. [Google Scholar] [CrossRef]
  27. Agerer, R. Exploration Types of Ectomycorrhizae. Mycorrhiza 2001, 11, 107–114. [Google Scholar] [CrossRef]
  28. Lilleskov, E.A.; Hobbie, E.A.; Horton, T.R. Conservation of Ectomycorrhizal Fungi: Exploring the Linkages between Functional and Taxonomic Responses to Anthropogenic N Deposition. Fungal Ecol. 2011, 4, 174–183. [Google Scholar] [CrossRef]
  29. Oksanen, J.; Kindt, R.; Legendre, P.; O’Hara, B.; Stevens, H.; Oksanen, M. The Vegan Package. Vegan: Community Ecology Package. 2010. Available online: https://cran.r-project.org/web/packages/vegan/vegan.pdf (accessed on 23 July 2024).
  30. Macias Fauria, M.; Helle, T.; Niva, A.; Posio, H.; Timonen, M. Removal of the Lichen Mat by Reindeer Enhances Tree Growth in a Northern Scots Pine Forest. Can. J. For. Res. 2008, 38, 2981–2993. [Google Scholar] [CrossRef]
  31. Gao, L.; Paré, D.; Chavardès, R.D.; Bergeron, Y. Initiating the Transition from Open-Canopy Lichen Woodland to Productive Forest by Transplanting Moss, Results from a 10-Year Experiment. Plant Soil 2023, 488, 363–376. [Google Scholar] [CrossRef]
  32. García-Carmona, M.; Arcenegui, V.; García-Orenes, F.; Mataix-Solera, J. The Role of Mosses in Soil Stability, Fertility and Microbiology Six Years after a Post-Fire Salvage Logging Management. J. Environ. Manag. 2020, 262, 110287. [Google Scholar] [CrossRef] [PubMed]
  33. Ouimet, R.; Boucher, J.-F.; Tremblay, P.; Lord, D. Comparing Soil Profiles of Adjacent Forest Stands with Contrasting Tree Densities: Lichen Woodlands vs. Black Spruce–Feathermoss Stands in the Continuous Boreal Forest. Can. J. Soil Sci. 2018, 98, 458–468. [Google Scholar] [CrossRef]
  34. Pacé, M.; Paré, D.; Fenton, N.J.; Bergeron, Y. Effects of Lichen, Sphagnum Spp. and Feather Moss Leachates on Jack Pine and Black Spruce Seedling Growth. Plant Soil 2020, 452, 441–455. [Google Scholar] [CrossRef]
  35. Ma, S.; Chen, X.; Su, H.; Xing, A.; Chen, G.; Zhu, J.; Zhu, B.; Fang, J. Phosphorus Addition Decreases Soil Fungal Richness and Alters Fungal Guilds in Two Tropical Forests. Soil Biol. Biochem. 2022, 175, 108836. [Google Scholar] [CrossRef]
  36. Gao, L.; Paré, D.; Martineau, C.; Yin, X.; Rodríguez-Rodríguez, J.C.; Gagné, P.; Bergeron, Y. Response of the Soil Microbial Communities to Forest Ground Cover Manipulation in a Boreal Forest. For. Ecol. Manag. 2024, 553, 121615. [Google Scholar] [CrossRef]
  37. Sweeney, C.J.; de Vries, F.T.; van Dongen, B.E.; Bardgett, R.D. Root Traits Explain Rhizosphere Fungal Community Composition among Temperate Grassland Plant Species. New Phytol. 2021, 229, 1492–1507. [Google Scholar] [CrossRef]
  38. de Vries, F.T.; Griffiths, R.I.; Bailey, M.; Craig, H.; Girlanda, M.; Gweon, H.S.; Hallin, S.; Kaisermann, A.; Keith, A.M.; Kretzschmar, M.; et al. Soil Bacterial Networks Are Less Stable under Drought than Fungal Networks. Nat. Commun. 2018, 9, 3033. [Google Scholar] [CrossRef]
  39. Coyte, K.Z.; Schluter, J.; Foster, K.R. The Ecology of the Microbiome: Networks, Competition, and Stability. Science 2015, 350, 663–666. [Google Scholar] [CrossRef]
  40. Hernandez, D.J.; David, A.S.; Menges, E.S.; Searcy, C.A.; Afkhami, M.E. Environmental Stress Destabilizes Microbial Networks. ISME J. 2021, 15, 1722–1734. [Google Scholar] [CrossRef]
  41. Sterkenburg, E.; Bahr, A.; Brandström Durling, M.; Clemmensen, K.E.; Lindahl, B.D. Changes in Fungal Communities along a Boreal Forest Soil Fertility Gradient. New Phytol. 2015, 207, 1145–1158. [Google Scholar] [CrossRef]
  42. Nie, S.; Lei, X.; Zhao, L.; Brookes, P.C.; Wang, F.; Chen, C.; Yang, W.; Xing, S. Fungal Communities and Functions Response to Long-Term Fertilization in Paddy Soils. Appl. Soil Ecol. 2018, 130, 251–258. [Google Scholar] [CrossRef]
  43. Shen, C.; Gunina, A.; Luo, Y.; Wang, J.; He, J.-Z.; Kuzyakov, Y.; Hemp, A.; Classen, A.T.; Ge, Y. Contrasting Patterns and Drivers of Soil Bacterial and Fungal Diversity across a Mountain Gradient. Environ. Microbiol. 2020, 22, 3287–3301. [Google Scholar] [CrossRef] [PubMed]
  44. Tong, S.; Cao, G.; Zhang, Z.; Zhang, J.; Yan, X. Soil Microbial Community Diversity and Distribution Characteristics under Three Vegetation Types in the Qilian Mountains, China. J. Arid Land 2023, 15, 359–376. [Google Scholar] [CrossRef]
  45. Feng, Y.; Xu, T.; Wang, W.; Sun, S.; Zhang, M.; Song, F. Nitrogen Addition Changed Soil Fungal Community Structure and Increased the Biomass of Functional Fungi in Korean Pine Plantations in Temperate Northeast China. Sci. Total Environ. 2024, 927, 172349. [Google Scholar] [CrossRef]
  46. Cheng, M.; Song, J.; Li, W.; Zhao, Y.; Zhang, G.; Chen, Y.; Gao, H. Potentilla Parvifolia Strongly Influenced Soil Microbial Community and Environmental Effect along an Altitudinal Gradient in Central Qilian Mountains in Western China. Ecol. Evol. 2023, 13, e10685. [Google Scholar] [CrossRef]
  47. Latef, A.A.H.A.; Hashem, A.; Rasool, S.; Abd_Allah, E.F.; Alqarawi, A.A.; Egamberdieva, D.; Jan, S.; Anjum, N.A.; Ahmad, P. Arbuscular Mycorrhizal Symbiosis and Abiotic Stress in Plants: A Review. J. Plant Biol. 2016, 59, 407–426. [Google Scholar] [CrossRef]
  48. Kolaříková, Z.; Kohout, P.; Krüger, C.; Janoušková, M.; Mrnka, L.; Rydlová, J. Root-Associated Fungal Communities along a Primary Succession on a Mine Spoil: Distinct Ecological Guilds Assemble Differently. Soil Biol. Biochem. 2017, 113, 143–152. [Google Scholar] [CrossRef]
  49. Crowther, T.W.; Boddy, L.; Hefin Jones, T. Functional and Ecological Consequences of Saprotrophic Fungus–Grazer Interactions. ISME J. 2012, 6, 1992–2001. [Google Scholar] [CrossRef]
  50. Nehls, U.; Plassard, C. Nitrogen and Phosphate Metabolism in Ectomycorrhizas. New Phytol. 2018, 220, 1047–1058. [Google Scholar] [CrossRef]
  51. Bödeker, I.T.M.; Lindahl, B.D.; Olson, Å.; Clemmensen, K.E. Mycorrhizal and Saprotrophic Fungal Guilds Compete for the Same Organic Substrates but Affect Decomposition Differently. Funct. Ecol. 2016, 30, 1967–1978. [Google Scholar] [CrossRef]
  52. van der Heijden, M.G.A.; Martin, F.M.; Selosse, M.-A.; Sanders, I.R. Mycorrhizal Ecology and Evolution: The Past, the Present, and the Future. New Phytol. 2015, 205, 1406–1423. [Google Scholar] [CrossRef] [PubMed]
  53. Cheeke, T.; Phillips, R.; Brzostek, E.; Rosling, A.; Bever, J.; Fransson, P. Dominant Mycorrhizal Association of Trees Alters Carbon and Nutrient Cycling by Selecting for Microbial Groups with Distinct Enzyme Function. New Phytol. 2016, 214, 432–442. [Google Scholar] [CrossRef] [PubMed]
  54. Baldrian, P. Microbial Activity and the Dynamics of Ecosystem Processes in Forest Soils. Curr. Opin. Microbiol. 2017, 37, 128–134. [Google Scholar] [CrossRef] [PubMed]
  55. Zhang, Z.; Wang, Q.; Yuan, Y.; Liu, Q.; Yin, H. Rejoinder to Jones et al.’s Comments on: “Plant Nitrogen Acquisition from Inorganic and Organic Sources via Root and Mycelia Pathways in Ectomycorrhizal Alpine Forests”. Soil Biol. Biochem. 136: 107517. Soil Biol. Biochem. 2020, 149, 107941. [Google Scholar] [CrossRef]
  56. Högberg, P.; Högberg, M.N.; Göttlicher, S.G.; Betson, N.R.; Keel, S.G.; Metcalfe, D.B.; Campbell, C.; Schindlbacher, A.; Hurry, V.; Lundmark, T.; et al. High Temporal Resolution Tracing of Photosynthate Carbon from the Tree Canopy to Forest Soil Microorganisms. New Phytol. 2008, 177, 220–228. [Google Scholar] [CrossRef]
  57. Zhang, X.; Su, J.; Ji, Y.; Zhao, J.; Gao, J. Nitrogen Deposition Affects the Productivity of Planted and Natural Forests by Modulating Forest Climate and Community Functional Traits. For. Ecol. Manag. 2024, 563, 121970. [Google Scholar] [CrossRef]
  58. Chen, Q.; Strashnov, I.; van Dongen, B.; Johnson, D.; Cox, F. Environmental Dependency of Ectomycorrhizal Fungi as Soil Organic Matter Oxidizers. New Phytol. 2024, 244, 2536–2547. [Google Scholar] [CrossRef]
Figure 1. The soil pH (a), concentration of total carbon (b), total nitrogen (c), and inorganic nitrogen (d) between the PM and PS and NM and NS in plantation and natural forests. Values represent means ± SE (n = 4). * indicates a significant difference determined by the nonparametric Wilcoxon test (p < 0.05). Blue indicates MS and Red indicates BS.
Forests 16 00138 g001
Figure 2. Alpha diversity of fungal communities between the PM, PS, NM, and NS in plantation and natural forests with Chao1 (a) and Shannon index (b). Values represent means ± SE (n = 4). * indicates a significant difference determined by the nonparametric Wilcox test (p < 0.05). Blue indicates MS and Red indicates BS.
Forests 16 00138 g002
Figure 3. NMDS analysis of fungal communities at the ASV level based on Bray–Curtis distance between the PM and PS and NM and NS in plantation and natural forests.
Forests 16 00138 g003
Figure 4. Visualization of fungal co-occurrence networks in PM (a), PS (b), NM (c), and NS (d). Different modules are shown in different colors. Details of co-occurring network topological indexes are shown in Table 1.
Forests 16 00138 g004
Figure 5. The relative abundance of dominant phyla (a) and trophic modes (b) of the fungal communities between the PM and PS and NM and NS in plantation and natural forests.
Forests 16 00138 g005
Figure 6. The relative abundance of dominant trophic guilds of the fungal communities between the PM and PS and NM and NS in plantation and natural forests.
Forests 16 00138 g006
Figure 7. The relationship between fungal functions and soil physicochemical properties in the PM and PS (a) and NM and NS (b). (*: p < 0.05; **: p < 0.01. TC = total carbon; TN = total nitrogen; IN = inorganic nitrogen).
Forests 16 00138 g007
Figure 8. Differences in relative abundance (%) of the top 20 functional fungal genera between the PM and PS and NM, and NS in plantation (a) and natural (b) forests. Effect sizes are standardized coefficients with their associated 95% confidence intervals. The values on the right-hand side indicate the corrected p-values obtained from the Welch t-test. Blue circles indicate significant effects (p < 0.05) and brown circles indicate non-significant effects. Blue circles indicate fungal abundance in the PM and NM soils; yellow circles indicate fungal abundance in the PS and NS soils; p < 0.05 indicates a significant difference between the two treatments.
Forests 16 00138 g008
Table 1. Topological indexes of fungal co-occurring networks in PM, PS, NM, and NS.
NodesEdgesPositive
Correlation
Negative
Correlation
Average
Degree
DiameterRMAverage CC
PM13513081301719.380.350.350.08
PS100439360798.780.220.500.28
NM14590067122912.410.200.550.17
NS11364141023111.350.190.620.16
Note: RM, relative modularity; average CC, average clustering coefficient.
Disclaimer/Publisher’s Note: The statements, opinions and data contained in all publications are solely those of the individual author(s) and contributor(s) and not of MDPI and/or the editor(s). MDPI and/or the editor(s) disclaim responsibility for any injury to people or property resulting from any ideas, methods, instructions or products referred to in the content.

