Article

Variations and Coordination of Leaflet and Petiole Functional Traits Within Compound Leaves in Three Hardwood Species

1
State Forestry and Grassland Administration Key Laboratory of Silviculture in Downstream Areas of the Yellow River, College of Forestry, Shandong Agricultural University, Tai’an 271000, China
2
Wangzhuang Forest Farm Construction and Development Service Center of Lijin County, Dongying 257449, China
3
Key Laboratory of Sustainable Forest Ecosystem Management-Ministry of Education, School of Forestry, Northeast Forestry University, Harbin 150040, China
*
Authors to whom correspondence should be addressed.
Forests 2025, 16(1), 139; https://doi.org/10.3390/f16010139
Submission received: 30 November 2024 / Revised: 9 January 2025 / Accepted: 9 January 2025 / Published: 14 January 2025
(This article belongs to the Special Issue Water Relations in Tree Physiology)

Abstract

:
Leaf morphology and anatomy traits are key determinants for plant performance; however, their roles within compound leaves—comprising both leaflets and petioles—remain insufficiently studied. This study examined the anatomy, morphology, and biomass allocation of leaflets and petioles in three temperate species (Fraxinus mandshurica Rupr., Juglans mandshurica Maxim., and Phellodendron amurense Rupr.). The results showed pronounced anatomical variations within the whole leaf. Specifically, as phyllotaxy increased, the number of conduits significantly increased in petioles but showed less variation. Within the same growth position, the number of conduits was highest in the petiole, followed by the petiolule, main vein, and minor veins. In the terminal leaf vascular network, thinner conduits of minor veins may result in a lower hydraulic efficiency but a higher resistance to embolism. Biomass allocation favored leaflets over petioles in all three examined species. Additionally, the specific leaf area slightly increased with an increase in the degree of phyllotaxy. These findings underscore the trade-offs of efficiency and safety in vascular tissues, as well as the expanding leaf and investment between the leaflet and petiole.

1. Introduction

Leaves are essential for resource acquisition and are responsible for plant growth and performance [1]. Numerous studies have examined the ways that leaves vary in size, mass, shape, and thickness [2,3,4]. For instance, leaves vary from less than 0.79 mm2 to 2.79 × 106 mm2 in area [5]; leaf forms include simple and compound leaves [6], and not all compound leaves are homologous [7,8]. The number and arrangement of leaflets vary greatly across different species, which is also an important trait for identification [9]. The smaller leaflets in a compound leaf are responsible for photosynthesis, while the petiole and rachis (without and with a carrying leaf, respectively, as shown in Figure 1) are crucial for support [10]. Meanwhile, the proportion of biomass allocated to petiole is generally higher in a compound leaf than that in a simple leaf, which has been widely reported across herbaceous, shrub, and woody species [10,11,12,13]. A larger leaf area (LA) requires greater structural support and a higher transport capacity, leading to increased biomass allocation to the petiole [14]. Such patterns highlight the trade-offs in biomass share between leaflets and petioles [15]. However, whether the functional traits of the individual leaflets along the petiole vary with their position has been less explored.
In compound leaves, phyllotaxy refers to the mode of arrangement of individual leaflets along the petiole [16] (Figure 1A in this study), and it is closely associated with leaf functional traits. Morphologically, the terminal leaflets of European ash (Fraxinus excelsior L.) have a smaller LA and shorter length than the lateral leaflets [17]. Chemically, both the nitrogen and phosphorus contents were positively correlated with phyllotaxy in Fraxinus mandshurica Rupr. and Phellodendron amurense Rupr. [18,19], where the terminal leaflet was defined as the first order, and so on. Anatomically, the spongy thickness and the ratio of palisade thickness to spongy thickness in F. mandshurica decreased with an increase in phyllotaxy [18]. Furthermore, vascular tissues play a key role in maintaining the equilibrium of support and transportation within a compound leaf. However, the variations in the vascular tissue traits of leaflets and petioles at different phyllotactic positions remain unknown and require further investigation.
McCulloh et al. [20] found that the petiole within compound leaves had wider conduits, while the petiolule (the stalk of the distal leaflet) had more conduits. Due to the constrained number of conduits in the petiole, widened conduits are optimized for high hydraulic efficiency. The leaf area was found to be significantly positively related to the number and diameter of conduits in 14 species [20]. Widened conduits also increase the risk of xylem embolisms. Previous studies had confirmed the trade-off between hydraulic efficiency and safety in vascular tissues, i.e., larger conduits contribute to a higher conductivity, but they have a higher vulnerability, while the opposite is true for smaller conduits [21]. However, changes in leaf vasculature at different phyllotactic positions have been less explored, especially for each leaflet within a compound leaf.
In this study, three temperate deciduous hardwood species in northeastern China, Fraxinus mandshurica, Juglans mandshurica Maxim., and Phellodendron amurense, were chosen, which were widespread in this area, and all three examined species have compound leaves. Across the three selected species, the petiolules of the leaflets were extremely short and close to the petiole. In order to examine the anatomical trait variations at different positions, we defined the whole rachis as the petiole (Figure 1A). For each leaflet, the anatomical parameters of the petiolule, main vein, and minor veins were measured, and their variations along the phyllotaxy were also compared. Additionally, the biomass share between the leaflets and petioles was analyzed. The objectives of this study were to (1) investigate the anatomical variations in the petiole and individual leaflets at different phyllotactic positions and (2) explore the morphological traits and biomass allocation of the petioles and leaflets in the examined species.

2. Materials and Methods

2.1. Study Site

This study was conducted in plantations at the Maoershan Forest Research Station (127°30′–127°34′ E, 45°21′–45°25′ N) of the Northeast Forestry University, Heilongjiang Province, China. This site experiences a temperate continental monsoon climate, with an average annual temperature of 2.8 °C, a frost-free period of 125 d, and an annual precipitation of 723 mm, respectively. The growing season spans June, July, and August. Soils at the site are classified as Hap-Boric Luvisols with well-developed horizons and good drainage [22]. Plantations of three species were established on flat terrain in 1986 by planting nursery-raised 2-year-old bare-root seedlings on a 1.5 m × 2.0 m planting grid. The mean stand densities were 3003, 3187, and 2884 tree ha−1 for F. mandshurica, J. mandshurica, and P. amurense, respectively, and the corresponding mean diameters at breast height were 12.2, 14.1, and 10.7 cm, respectively, at the time of sampling.

2.2. Leaf Sample Collection

We sampled 15–20 mature compound leaves from south-exposed branches of 3 to 5 trees (far away from the plantation margin) per species in July 2014, randomly. They were sealed in plastic bags and carried to the laboratory. In the laboratory, the intact leaf samples were gently washed with deionized water to remove impurities adhering to the leaves. For each species, all the collected compound leaf samples were divided into two subsamples: the first one was prepared for morphology and biomass allocation analysis. For this subsample of compound leaves, the petiole was kept complete, but different leaflets along the petiole were labeled according to the phyllotaxy (Figure 1A). Then, each petiole and leaflet with the same phyllotaxy were immediately put in a zipper and transported to the laboratory for morphological analysis. The other subsample was prepared for anatomy analysis. Specifically, the petiole and leaflet were dissected and labeled along the phyllotaxy, respectively. Then, all these petioles and leaflets with the same phyllotaxy were collected and fixed in formalin–aceto-alcohol (FAA) solution (90 mL 50% ethanol + 5 mL 100% glacial acetic acid + 5 mL 37% formaldehyde) and stored in a 4 °C refrigerator for anatomical analysis. All the leaf samples were collected from an individual tree in the field; inevitably, the number of leaflets within each compound leaf was different. Additionally, the terminal leaflet (T) and two first-order leaflets were connected with each other in the same phyllotaxy (showed in Figure 1A); therefore, the number and diameter of conduits in the petiole were only showed in first-order leaflets (L1) but not for terminal leaflets (T).

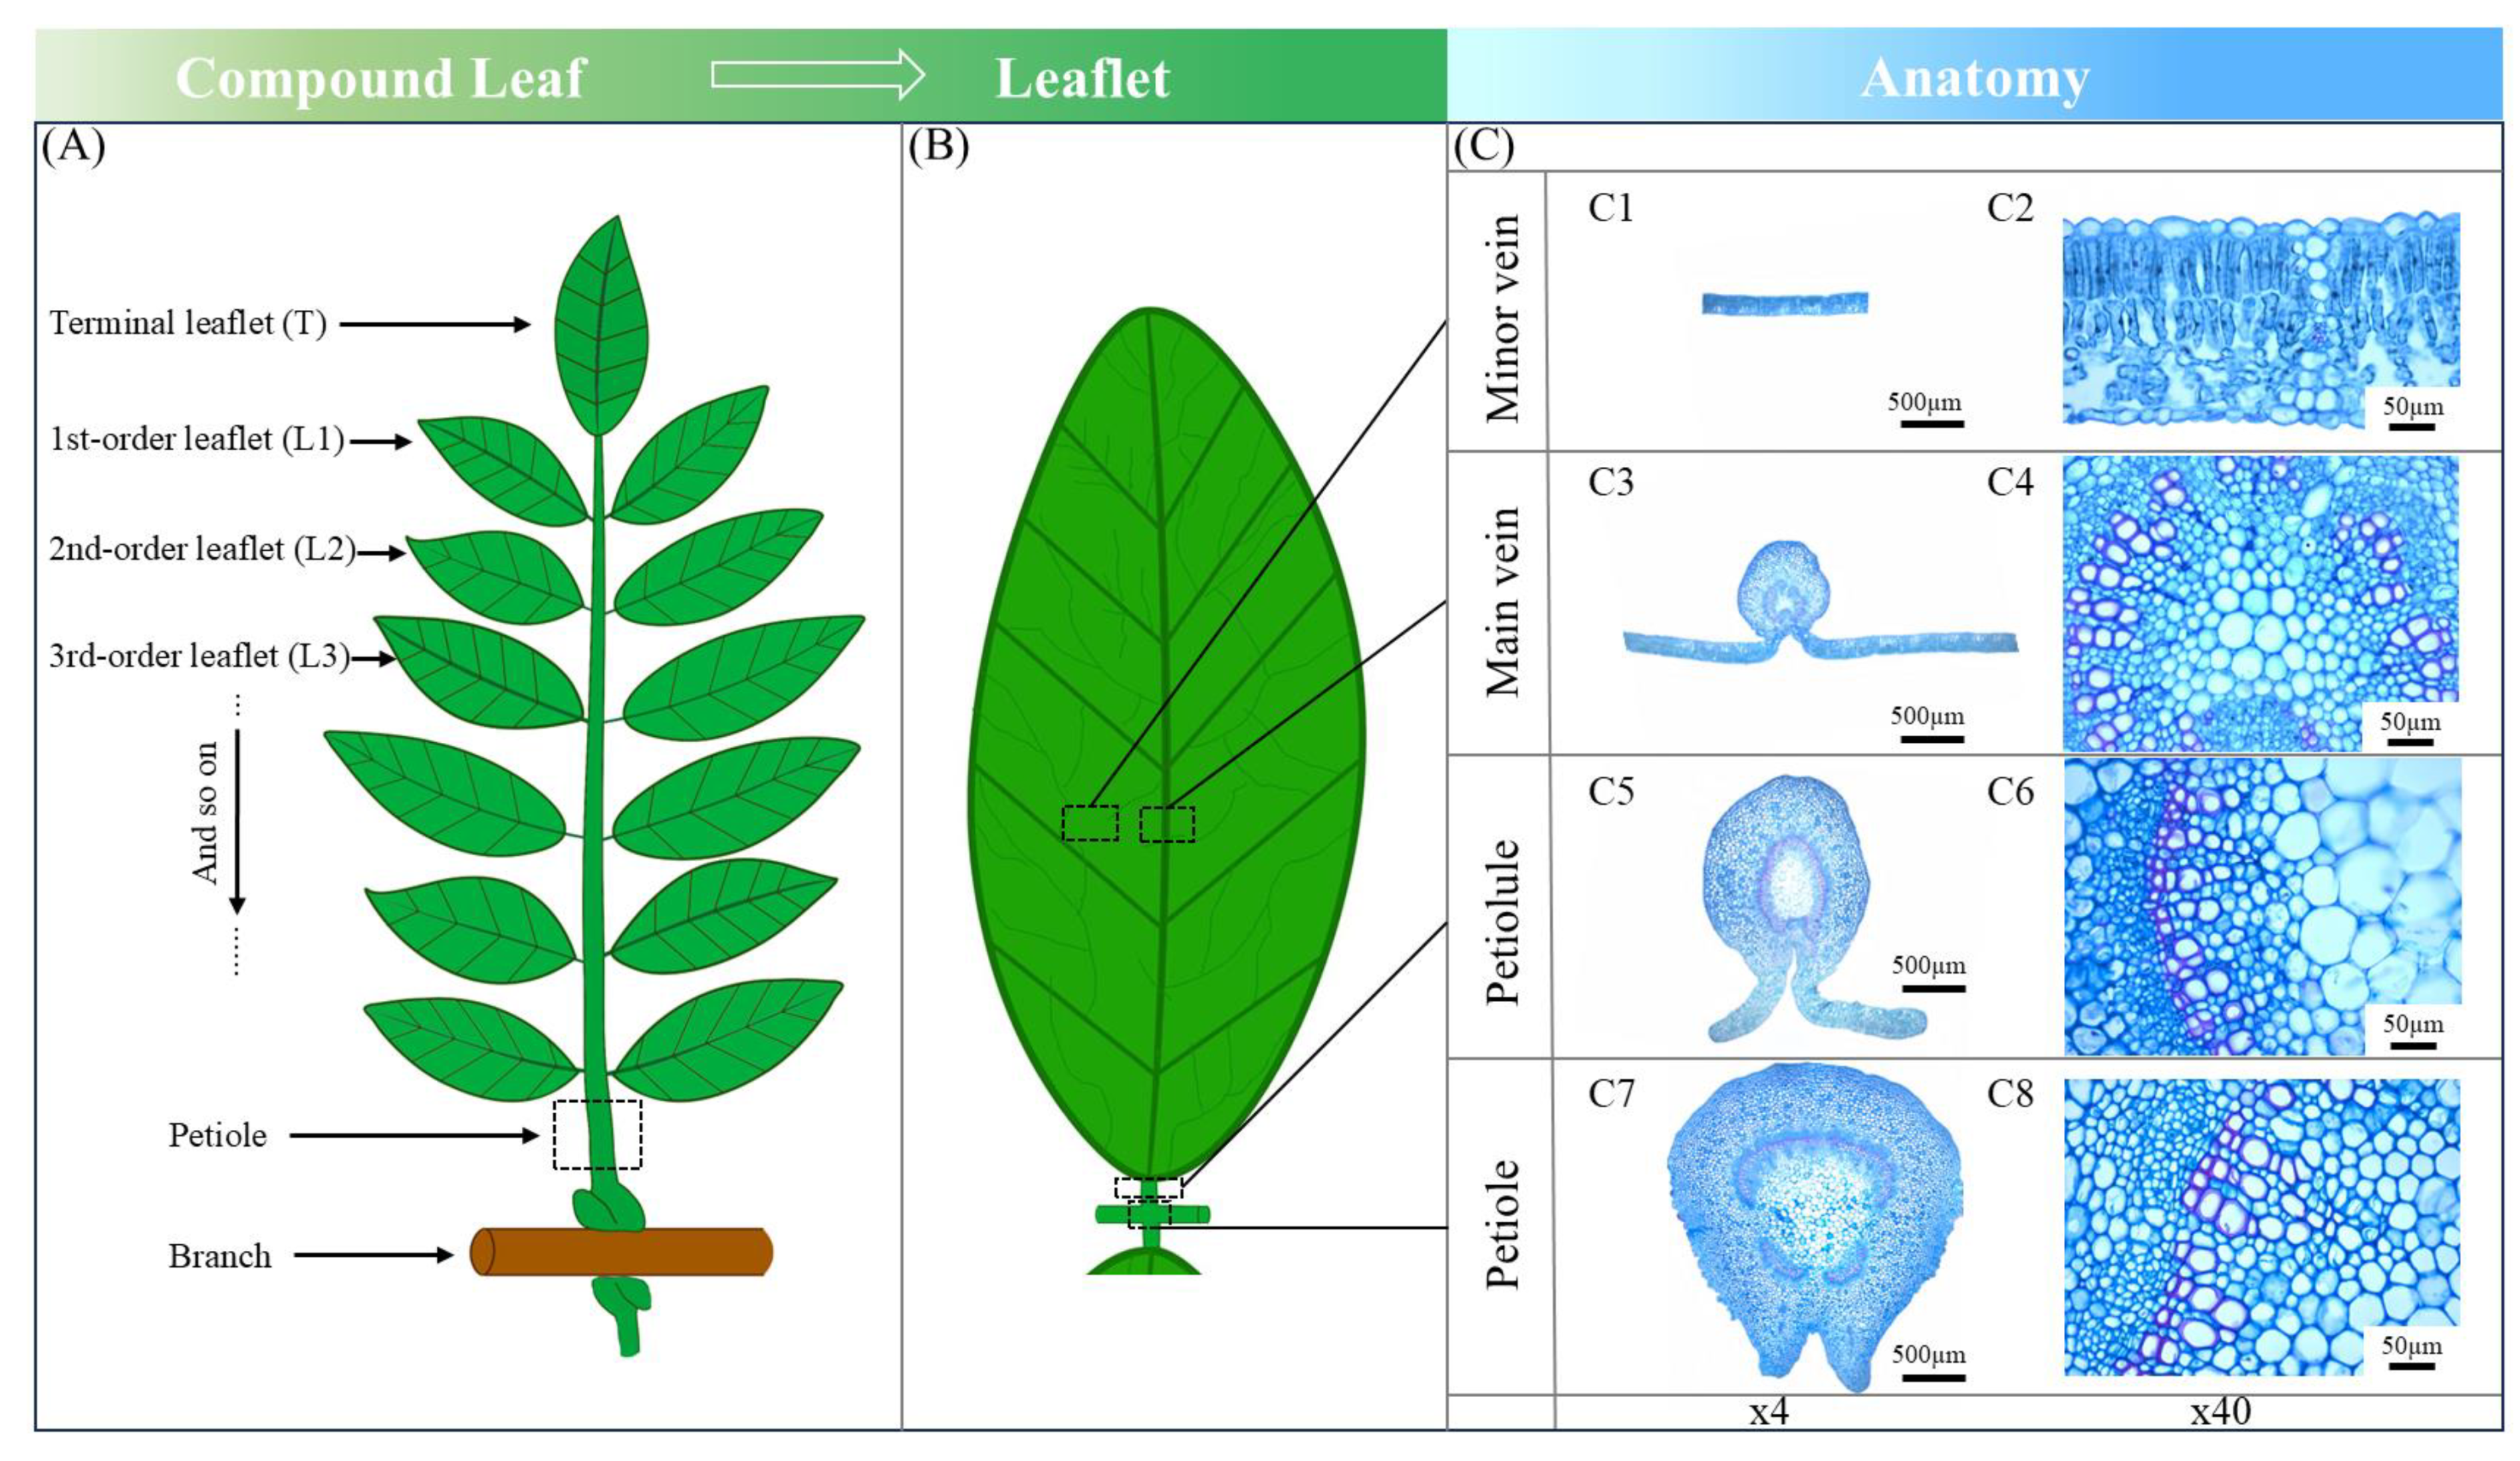
2.3. Leaf Morphology and Anatomy

In the laboratory, leaflets with the same phyllotaxy were scanned with an Expression 10000XL 1.0 scanner (Epson Telford Ltd., Telford, UK) to determine leaf area (LA). Afterward, they were oven-dried at 65 °C to a constant weight (nearest 0.0001 g). The specific leaf area (SLA, cm2·g−1) was calculated as the total LA divided by the dry weight [23]. Meanwhile, the petiole of each leaf was also oven-dried for the biomass share analysis.
For the anatomical measurement, the midpoints in each leaflet and petiole segment without damage were sampled for the vascular measurements. Selected leaflets and petioles were prepared for anatomy analysis following the procedure described by Guo et al. [24], including being dehydrated in a graded ethanol series of 70%, 85%, 95%, and 100% alcohol, embedded in paraffin, and sectioned with a microtome to produce 8 μm thick sections, and then finally being stained with safranin-fast green. All the cross-sections of the leaflet and petiole were photographed using a biological microscope (Olympus Electronics Inc, Tsukuba, Japan) equipped with a Motic 3000 CCD camera (Motic Corporation, Xiamen, China). Anatomical traits were measured with a precision of 1 μm using Motic Images Advanced 3.2 software (Motic Corporation, Xiamen, China). Specifically, vascular tissues in the petiole, petiolule, and main and minor veins were measured (Figure 1C), including the number and diameter of conduits. On average, the xylem areas for conduit measurements in the petiole, petiolule, and main and minor veins were ca. 15 mm2, 5 mm2, 0.04 mm2, and 80 µm2 for the three examined species in this study, respectively. For each leaflet, the thickness of the leaflet, palisade, and spongy tissue (i.e., LT, PT, and ST, respectively) and the ratio of palisade tissue thickness to spongy tissue thickness were analyzed. Additionally, the cell tense ratio (CTR) was calculated as the PT divided by the LT, and the spongy tissue ratio was calculated as the ST divided by the LT.

2.4. Data Analysis

For each tree species, the means and their standard errors (SEs) were calculated for all the measured traits. For vascular traits, the effects of species, leaflet position (i.e., petiolule and main and minor veins), and phyllotaxy, as well as their interaction, were tested using a three-way factorial analysis of variance (ANOVA), and the other traits were tested using a two-way ANOVA. Fisher’s Least Significant Difference (LSD) test was applied to analyze differences in leaf morphology and anatomy along the phyllotaxy (p = 0.05) in each examined species. The “ggplot2” R package [25] was used to visualize all traits. All statistical analyses were performed using the SPSS software (2010, V.19.0; IBM Corp., Armonk, NY, USA).

3. Results

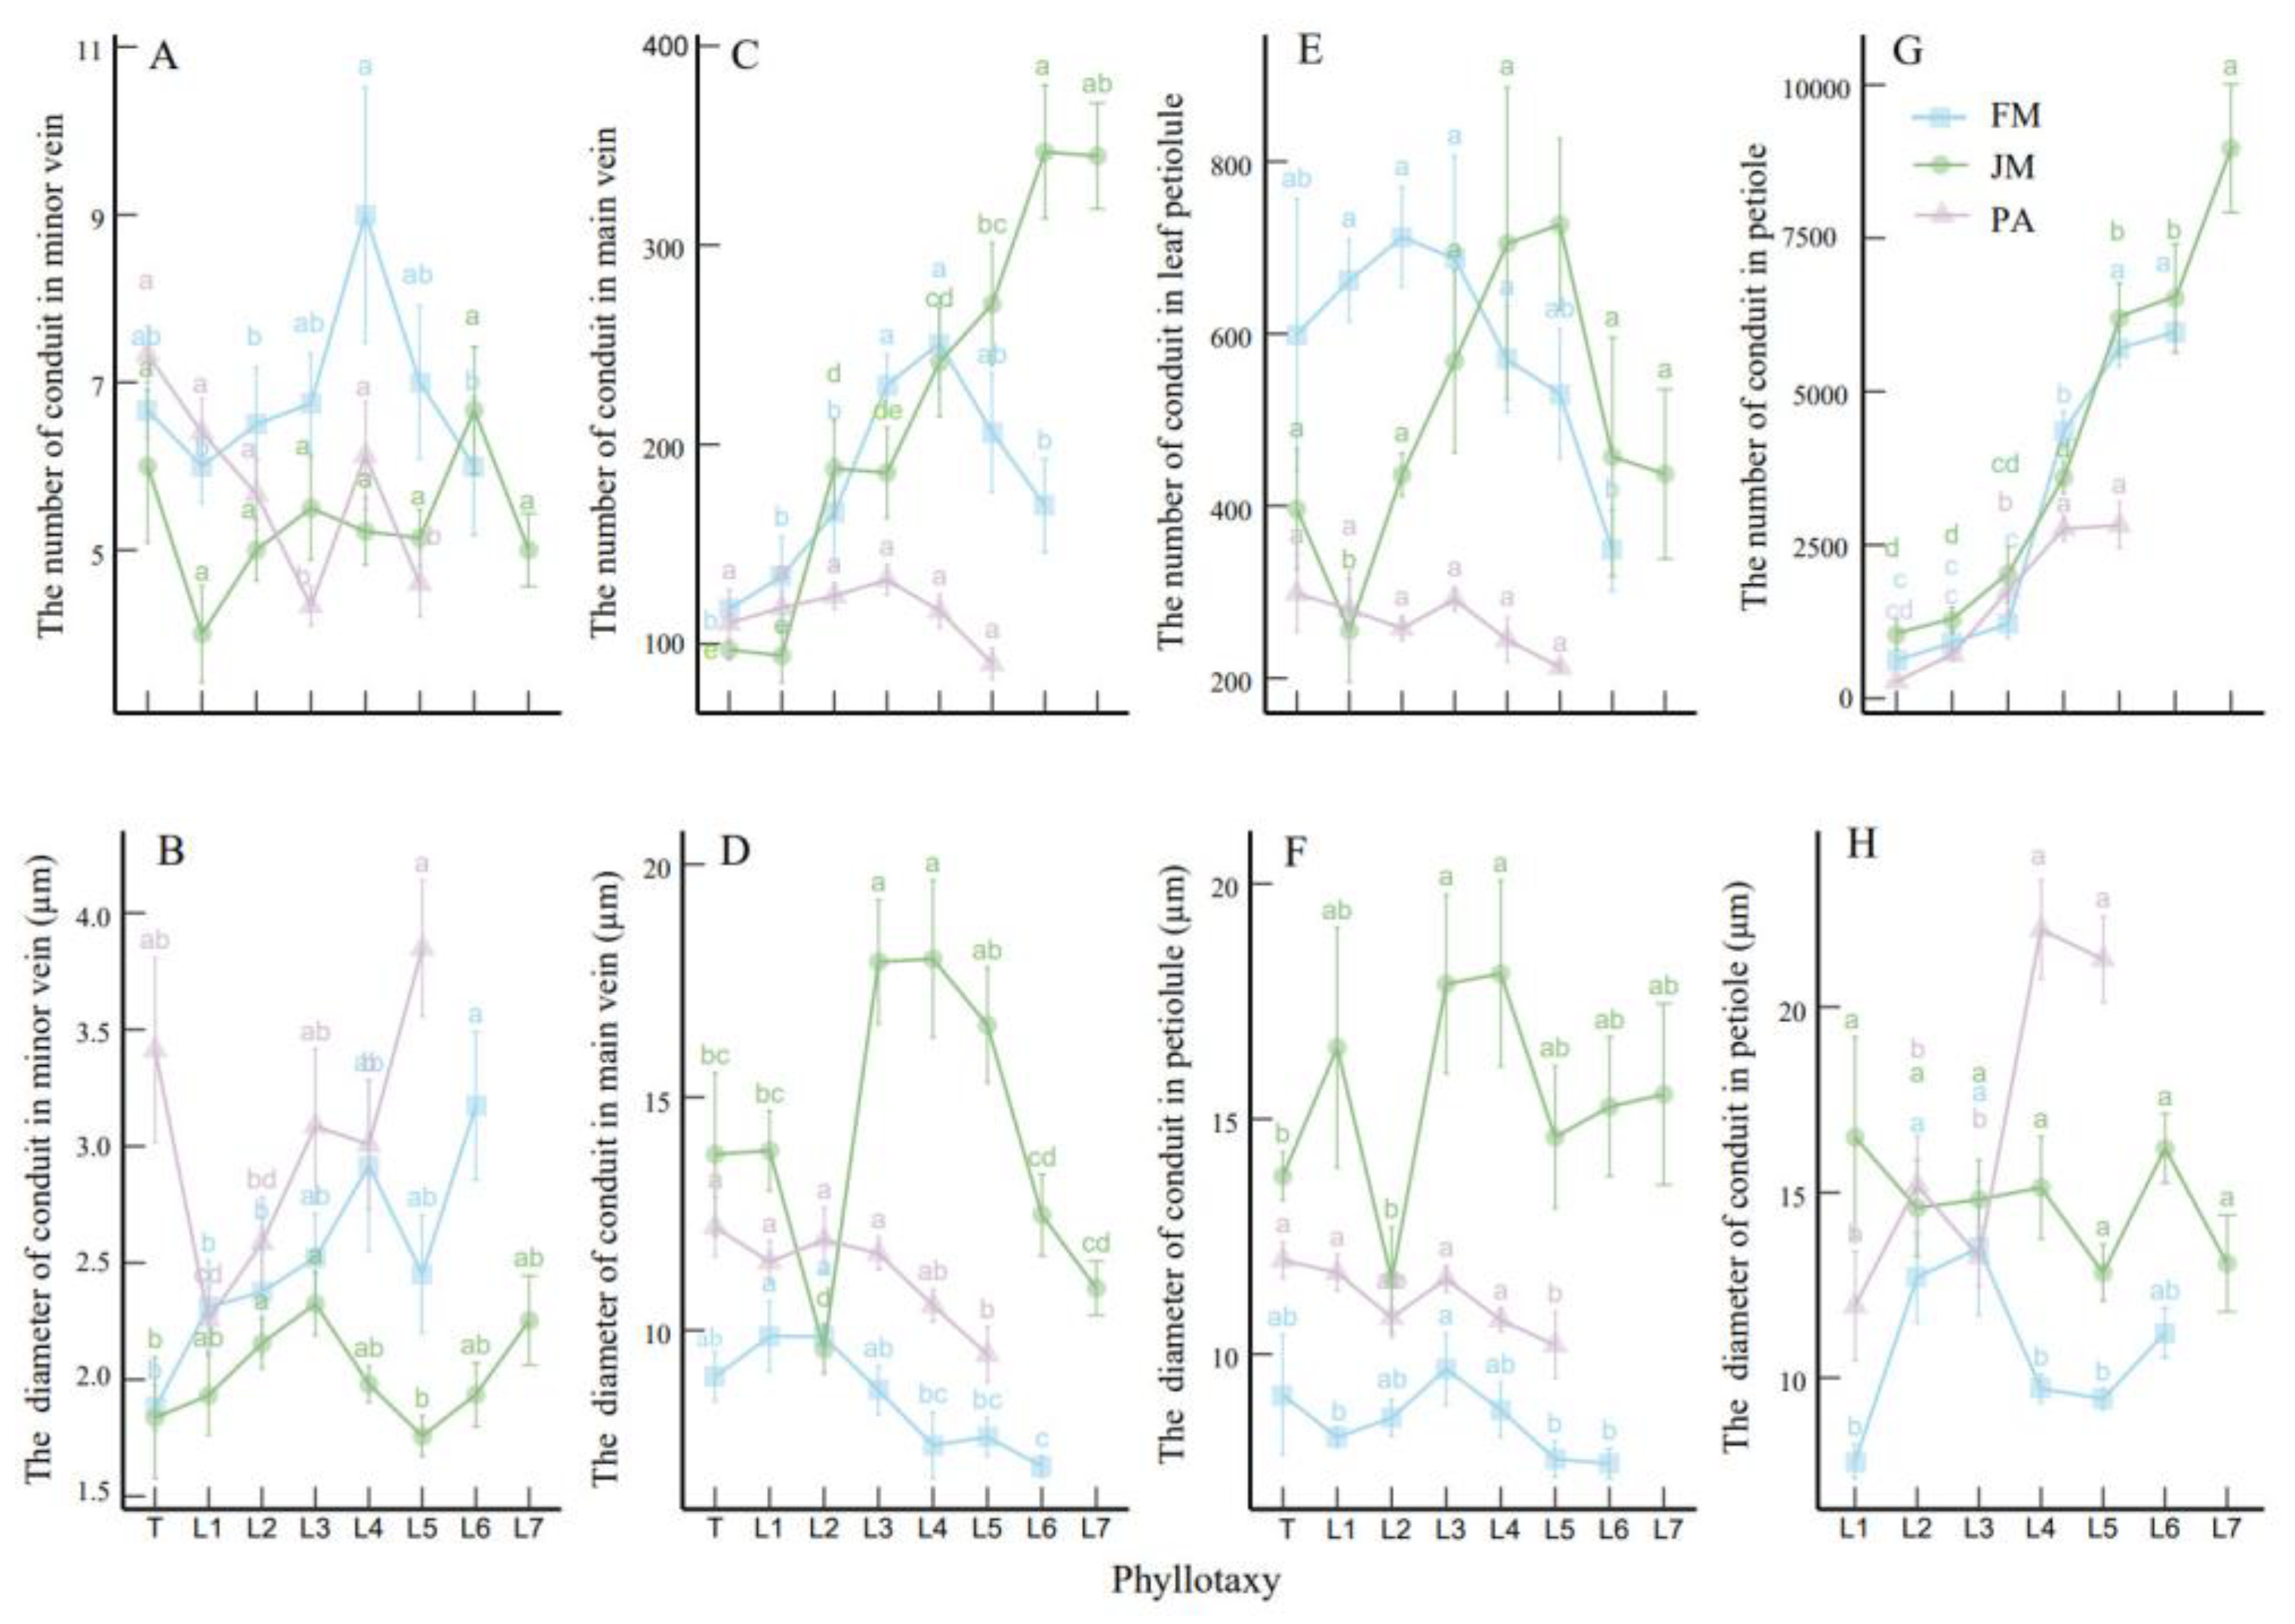
3.1. Leaf Vascular Traits Along Phyllotaxy

The leaflet anatomical traits exhibited substantial inter- and intraspecific variability with the changes in the phyllotaxy (Figure 2 and Figure 3; Table 1 and Table 2). The number of conduits in the petiole increased significantly with ascending phyllotaxy across the three species (Figure 2G). In F. mandshurica, the number of petiole vessels in the base (L6) was 8.7 times higher than that in the distal (L1), which were 7.6 times (L8 vs. L1) for J. mandshurica and 9.2 times (L5 vs. L1) for P. amurense. In the main vein, with the ascending phyllotaxy, the number of conduits increased in J. mandshurica but showed a pattern of first increasing and then decreasing in F. mandshurica and exhibited less variations in P. amurense (Figure 2C). However, the number of conduits in the minor vein and petiolule exhibited less variation among the three examined species (Figure 2A,E). Additionally, the mean conduit diameter exhibited relatively less variability. In general, the largest conduits in the main vein and petiolule were observed in the middle of whole compound leaf (i.e., the third and fourth order in J. mandshurica and the second and third order in F. mandshurica and P. amurense, respectively, Figure 2D,F).
Generally, the number of conduits was greatest in the petiole (3127.58, 4229.52, and 1666.25 for F. mandshurica, J. mandshurica, and P. amurense, respectively, Figure 2G), followed by the petiolule (587.07, 497.66, and 264.00 for three species, respectively, Figure 2E) and the main vein (181.82, 220.98, and 115.17 for three species, respectively, Figure 2C), with the minor vein showing the lowest number (6.85, 6.67, and 5.74 for three species, respectively, Figure 2A) (Table 1). Furthermore, the mean conduit diameter was smallest in the minor vein, and this trend was similar across the other three positions (Figure 2B,D,F,H).

3.2. Leaf Mesophyll Traits Along Phyllotaxy

The arrangement of leaflet mesophyll cells within a compound leaf showed minimal association with phyllotaxy, despite the fact that thickenings of both the palisade and spongy tissues with increasing phyllotaxy were observed across the three species (Figure 3A,B, Table 3). However, a significant increase in leaflet thickness with ascending phyllotaxy was evident only in J. mandshurica (Figure 3F). Meanwhile, leaflet thickness was greatest in F. mandshurica, followed by P. amurense and J. mandshurica (Figure 3F). Notably, the thick leaflets in F. mandshurica were primarily attributed to a thicker palisade tissue, whereas in P. amurense, spongy tissue contributed more significantly to the leaflet thickness (Figure 3A,B). Additionally, the ratio of palisade tissue thickness to spongy tissue thickness (Figure 3D), cell tense ratio (Figure 3E), and spongy ratio (Figure 3F) of J. mandshurica were consistently higher than those of F. mandshurica and P. amurense across all phyllotaxy.

3.3. Relative Share of Biomass and Leaflet Area Within Compound Leaf

The biomass proportions of the leaflet were 78.8%, 82.8%, and 81.2% for F. mandshrica, J. mandshurica, and P. amurense, respectively (Figure 4A), which were 2.7, 3.8, and 3.4 times higher than those of petioles in the corresponding three species, respectively. With increasing phyllotaxy, the proportions of both biomass and area of individual leaflets initially increased and then decreased, a trend that was particularly pronounced in J. mandshurica (Figure 4).
With the increase in phyllotaxy, the SLA of high-order leaflets was 25.9% higher than that of the terminal one in F. mandshurica, with corresponding increases of 10.0% and 18.9% observed in J. mandshurica and P. amurense, respectively; such differences were only significant in P. amurense (Figure 5). Additionally, F. mandshurica exhibited the highest SLA among the three species, followed by P. amurense and J. mandshurica (Figure 5).

4. Discussion

4.1. Vascular Network in Compound Leaves

Here, we explored the inter- and intraspecific variation in the leaflet and petiole vascular networks in three temperate broad-leaved tree species. The number of petiole vessels increased significantly with ascending phyllotaxy in all three examined species. According to Hagen–Poiseuille’s law [26], the theoretical hydraulic conductivity of the petiole increases significantly from the terminal to the base, which may relate to the resource transport capacity. Along the vascular network, water is reallocated to the decreasing-order leaflets and eventually to the mesophyll cells. Therefore, fewer and thinner vessels in the distal end of the vascular network in each individual leaflet can suffice for the transportation [27]. For compound leaves, each individual leaflet is independent and relatively less influenced by others, as seen in the number and diameter of conduits in the petiole and veins examined here.
Furthermore, the number and diameter of conduits were largest in the petiolule, followed by the main vein and minor vein. There were two possible explanations for this. Firstly, when stomata open for obtaining CO2, absorbed water would be transported from the root to the leaf due to large tension, which would pull water through the conduits in the xylem [28]. Because that conductive capacity is proportional to the fourth power of the conduit diameter [26], widened conduits in the petiole are efficient for water transportation. Secondly, the conduit size-related trade-off between transportation efficiency and safety might be associated with the vasculature within the petiole and leaflet [26]. Wider conduits in the petiole contribute to enhanced transport capacity, which also aligns with low resistance to embolism [26]. However, previous studies have reported that petioles were less vulnerable than leaflets in F. mandshrica and J. mandshrica [29], but no significant differences were observed among the petiole, leaflet, and even pulvini across six herbaceous species [30], or between the leaf and branches across three woody species [31]. For an individual leaf, embolism primarily occurs first in the main vein rather than in the minor vein [32]. Such results seem to be inconsistent with our speculation, which might be related to the hydraulic segmentation originally from the differences in conduit length, cell wall wideness, and even the pit among the petiole and leaflet [28,33]. Further detailed studies are necessary to explore hydraulic efficiency and safety by adopting optical visualization technique coupling anatomical methods.
In this study, we also found that, for the same phyllotaxy, the diameters of the conduits in the petiolule and main vein, as well as the leaf area, were higher in J. mandshurica than those in the other two species. Previous studies have confirmed that the diameter of the conduit is positively related to leaf area [34,35,36], consistent with our observation, i.e., the leaf area of J. manshurica was higher than the other two species (L8 vs. L5–7 in phyllotaxy). Such findings also supported the classical principle that larger leaves would require a larger ‘pipe’ system to supply a greater transpiration surface [37]. The coordination among leaf anatomy and morphology might contribute to the greater growth rate in J. manshurica, manifested as the larger diameter at breast height than other species of the same age. Such growth patterns under different light conditions were also confirmed in seedlings of the three species [38].
Although leaflet and petiole are equally crucial for leaf functioning, the majority of research on leaf functional traits focuses on the leaflet, often neglecting the petiole. For instance, the leaf economics spectrum has excluded the petiole [2,5], resulting in an underestimation of the variations in petiole functional traits. Detailed information on petiole anatomy is urgently needed, and it will be valuable to quantify trait variations across species at broad scales. Furthermore, these distinct variations observed in this study emphasize the necessity of differentiating leaflets along the phyllotaxy when examining the functional vascular traits in ecological studies or exploring the physiological and ecological mechanisms underlying the adaptation of compound leaves to a changing environment.

4.2. Leaf Morphology and Anatomy Differentiation Along Phyllotaxy

In this study, the biomass proportion of the petiole was lower than that of the total leaflets across all three species. Previous studies have confirmed that the relative biomass share between the leaflet and petiole is evolutionarily stable [10,39], but the biomass proportion of the petiole was relatively higher in compound leaves than that of simple leaves, associated with the greater support capacity for the expansion of the larger leaf area [10,11,12,13]. Within a complete leaf, compound or simple, a relatively larger biomass investment in the petiole reduces the resources available for leaflet development (e.g., small leaf area), thereby decreasing light interception. Conversely, greater carbon investment in the leaflet to expanded leaf area, coupled with weaker petiole development, increased the risk of leaf abscission due to inadequate support [40]. Therefore, these results indicated the trade-offs in biomass allocation between the leaflet and petiole in functioning photosynthesis and support [10,14].
Additionally, the optimal arrangement of leaflets along the petiole is essential for maximizing sunlight interception [39]. The self-shading within a compound leaf reduces the efficiency of light interception [41,42,43], meaning that light resources are more effectively available for the distal leaflets rather than the basal ones, which also account for the increase in SLA with ascending phyllotaxy [18]. Such patterns were obvious in P. amurense. At the same time, P. amurense had the shortest and thickest leaves composed mainly of sponge mesophyll tissue in comparison with the other two species. In contrast to J. mandshrica we discussed above, the smaller sizes of mesophyll cells, conduits, and even the whole compound leaf area might induce a lower growth rate [38]. Such heterogeneous leaf development within a compound leaf influences plant growth and performance to some degree [2,44].

5. Conclusions

With ascending phyllotaxy, the number of conduits increased significantly in the petiole across all three woody species but showed less variations in the main and minor veins. Within a leaflet with the same phyllotaxy, the number and diameter of conduits were greatest at the petiolule, followed by the main vein and minor vein. The biomass proportion of the petiole was lower than that of the total leaflets but higher than that of the individual leaflet across all three species. These vasculature and biomass allocations within compound leaves obtained in study indicated the potential trade-off between transportation and safety, expanding leaf area and supporting investment. Our findings provide some important evidence to understand the trait variations in the components in compound leaves in woody species.

Author Contributions

Conceptualization, J.G., Z.L. and Y.W.; data curation, X.G.; funding acquisition, Y.W.; methodology, Z.L. and Y.W.; software, X.G.; validation, X.G.; visualization, Z.L.; writing—original draft, X.G., J.Z., Z.L. and Y.W.; writing—review and editing, J.G. and Y.W. All authors have read and agreed to the published version of the manuscript.

Funding

This work was jointly supported by the National Natural Science Foundation of China (32101514), Shandong Provincial Natural Science Foundation (ZR2024QC118), Open Grant for Laboratory of Sustainable Forest Ecosystem Management (Northeast Forestry University), Ministry of Education (KFJJ2023YB05), and Central Financial Forestry and Grassland Ecological Protection and Restoration Foundation Project of China (ZQTYB240100013).

Data Availability Statement

The original contributions presented in this study are included in the article. Further inquiries can be directed to the corresponding author.

Acknowledgments

The authors thank Dongnan Wang, Hongfeng Wang, and Xueyun Dong for their help with the field sampling, as well as their insightful comments for this manuscript.

Conflicts of Interest

The authors declare that this research was conducted without any commercial or financial relationships that could be construed as potential conflicts of interest.

References

  1. Mommer, L.; Weemstra, M. The role of roots in the resource economics spectrum. New Phytol. 2012, 195, 725–727. [Google Scholar] [CrossRef]
  2. Wright, I.J.; Reich, P.B.; Westoby, M.; Ackerly, D.D.; Baruch, Z.; Bongers, F.; Cavender-Bares, J.; Chapin, T.; Cornelissen, J.H.C.; Diemer, M.; et al. The worldwide leaf economics spectrum. Nature 2004, 428, 821–827. [Google Scholar] [CrossRef]
  3. Fan, X.; Yan, X.; Qian, C.; Bachir, D.G.; Yin, X.; Sun, P.; Ma, X.F. Leaf size variations in a dominant desert shrub, Reaumuria soongarica, adapted to heterogeneous environments. Ecol. Evol. 2020, 10, 10076–10094. [Google Scholar] [CrossRef]
  4. Baird, A.S.; Taylor, S.H.; Pasquet-Kok, J.; Vuong, C.; Zhang, Y.; Watcharamongkol, T.; Scoffoni, C.; Edwards, E.J.; Christin, P.; Osborne, C.P.; et al. Developmental and biophysical determinants of grass leaf size worldwide. Nature 2021, 592, 242–247. [Google Scholar] [CrossRef]
  5. Díaz, S.; Kattge, J.; Cornelissen, J.H.C.; Wright, I.J.; Lavorel, S.; Dray, S.; Reu, B.; Kleyer, M.; Wirth, C.; Colin Prentice, I.; et al. The global spectrum of plant form and function. Nature 2016, 529, 167–171. [Google Scholar] [CrossRef]
  6. Warman, L.; Moles, A.T.; Edwards, W. Not so simple after all: Searching for ecological advantages of compound leaves. Oikos 2011, 120, 813–821. [Google Scholar] [CrossRef]
  7. Bharathan, G.; Sinha, N.R. The regulation of compound leaf development. Plant Physiol. 2001, 127, 1533–1538. [Google Scholar] [CrossRef]
  8. Friedman, W.E.; Moore, R.C.; Purugganan, M.D. The evolution of plant development. Am. J. Bot. 2004, 91, 1726–1741. [Google Scholar] [CrossRef]
  9. Mzoughi, O.; Yahiaoui, I.; Boujemaa, N.; Zagrouba, E. Multiple leaflets-based identification approach for compound leaf species. In Proceedings of the International Workshop on Environmental Multimedia Retrieval (EMR 2014), Glasgow, UK, 1–4 April 2014; Available online: http://ceur-ws.org (accessed on 24 December 2024).
  10. Niinemets, U.; Portsmuth, A.; Tobias, M. Leaf size modifies support biomass distribution among stems, petioles and mid-ribs in temperate plants. New Phytol. 2006, 171, 91–104. [Google Scholar] [CrossRef]
  11. Niinemets, U. Are compound-leaved woody species inherently shade-intolerant? An analysis of species ecological requirements and foliar support costs. Plant Ecol. 1998, 134, 1–11. [Google Scholar] [CrossRef]
  12. Niinemets, U.; Kull, O. Biomass investment in leaf lamina versus lamina support in relation to growth irradiance and leaf size in temperate deciduous trees. Tree Physiol. 1999, 19, 349–358. [Google Scholar] [CrossRef]
  13. Levionnois, S.; Coste, S.; Nicolini, E.; Stahl, C.; Morel, H.; Heuret, P. Scaling of petiole anatomies, mechanics and vasculatures with leaf size in the widespread Neotropical pioneer tree species Cecropia obtusa Trécul (Urticaceae). Tree Physiol. 2020, 40, 245–258. [Google Scholar] [CrossRef]
  14. Niklas, K.J. Research review: A mechanical perspective on foliage leaf form and function. New Phytol. 1999, 143, 19–31. [Google Scholar] [CrossRef]
  15. Li, Y.; Kang, X.; Zhou, J.; Zhao, Z.; Zhang, S.; Bu, H.; Qi, W. Geographic variation in the petiole-lamina relationship of 325 eastern Qinghai-Tibetan woody species: Analysis in three dimensions. Front. Plant Sci. 2021, 12, 748125. [Google Scholar] [CrossRef]
  16. Rutishauser, R.; Peisl, P. Phyllotaxy. In Encyclopedia of Life Sciences; Macmillan Publishers Ltd.: Basingstoke, UK, 2001. [Google Scholar] [CrossRef]
  17. Vidaković, A.; Matijašević, S.; Tumpa, K.; Poljak, I. Leaf phenotypic plasticity of European ash (Fraxinus excelsior) at its northern range in Dinaric Alps. Acta Bot. Croat. 2025, 84, 1–18. [Google Scholar] [CrossRef]
  18. Guo, Y.; Jin, G.; Liu, Z. Effects of phyllotaxy on variation and inner relationships of leaflet traits in compound-leaved plants. Chin. J. Appl. Ecol. 2023, 34, 577–587. (In Chinese) [Google Scholar]
  19. Wang, G.; Chen, B.; Huang, Y. Effects of growing position on leaflet trait variations and its correlations in Fraxinus mandshurica. Chin. J. Plant Ecol. 2022, 46, 712–721. (In Chinese) [Google Scholar] [CrossRef]
  20. McCulloh, K.A.; Sperry, J.S.; Meinzer, F.C.; Lachenbruch, B.; Atala, C. Murray’s law, the ‘Yarrum’ optimum, and the hydraulic architecture of compound leaves. New Phytol. 2009, 184, 234–244. [Google Scholar] [CrossRef]
  21. Franklin, O.; Fransson, P.; Hofhansl, F.; Jansen, S.; Joshi, J. Optimal balancing of xylem efficiency and safety explains plant vulnerability to drought. Ecol. Lett. 2023, 26, 1485–1496. [Google Scholar] [CrossRef]
  22. Wang, Z.; Guo, D.; Wang, X.; Gu, J.; Mei, L. Fine root architecture, morphology, and biomass of different branch orders of two Chinese temperate tree species. Plant Soil 2006, 288, 155–171. [Google Scholar] [CrossRef]
  23. Garnier, E.; Shipley, B.; Roumet, C.; Laurent, G. A standardized protocol for the determination of specific leaf area and leaf dry matter content. Funct. Ecol. 2001, 15, 688–695. [Google Scholar] [CrossRef]
  24. Guo, D.; Li, H.; Mitchell, R.J.; Han, W.; Hendricks, J.J.; Fahey, T.J.; Hendrick, R.L. Fine root heterogeneity by branch order: Exploring the discrepancy in root turnover estimates between minirhizotron and carbon isotopic methods. New Phytol. 2008, 177, 443–456. [Google Scholar] [CrossRef]
  25. Wickham, H.; Chang, W.; Wickham, M.H. An Implementation of the Grammar of Graphics; Package ‘ggplot2’: Tokyo, Japan, 2016. [Google Scholar]
  26. Tyree, M.T.; Ewers, F.W. The hydraulic architecture of trees and other woody plants. New Phytol. 1991, 119, 345–360. [Google Scholar] [CrossRef]
  27. West, G.B.; Brown, J.H.; Enquist, B.J. A general model for the structure and allometry of plant vascular systems. Nature 1999, 400, 664–667. [Google Scholar] [CrossRef]
  28. Taiz, L.; Zeiger, E.; Møller, I.M.; Murphy, A. Water Balance of Plants. In Plant Physiology and Development; Oxford University Press: Oxford, UK, 2017. [Google Scholar]
  29. Song, J.; Trueba, S.; Yin, X.; Cao, K.; Brodribb, T.J.; Hao, G. Hydraulic vulnerability segmentation in compound-leaved trees: Evidence from an embolism visualization technique. Plant Physiol. 2022, 189, 204–214. [Google Scholar] [CrossRef]
  30. Rimer, I.M.; McAdam, S.A.M. Within-leaf variation in embolism resistance is not a rule for compound-leaved angiosperms. Am. J. Bot. 2024, 111, e16447. [Google Scholar] [CrossRef]
  31. Klepsch, M.; Zhang, Y.; Kotowska, M.M.; Lamarque, L.J.; Nolf, M.; Schuldt, B.; Torres-Ruiz, J.M.; Qin, D.; Choat, B.; Delzon, S.; et al. Is xylem of angiosperm leaves less resistant to embolism than branches? Insights from microCT, hydraulics, and anatomy. J. Exp. Bot. 2018, 69, 5611–5623. [Google Scholar] [CrossRef]
  32. Peters, J.M.R.; Choat, B. Out on a limb: Testing the hydraulic vulnerability segmentation hypothesis in trees across multiple ecosystems. Plant Cell Environ. 2024, 1–16. [Google Scholar] [CrossRef]
  33. Brodribb, T.J.; Skelton, R.P.; McAdam, S.A.; Bienaime, D.; Lucani, C.J.; Marmottant, P. Visual quantification of embolism reveals leaf vulnerability to hydraulic failure. New Phytol. 2016, 209, 1403–1409. [Google Scholar] [CrossRef]
  34. Martín-Sánchez, R.; Sancho Knapik, D.; Ferrio, J.P.; Alonso Forn, D.; Losada, J.M.; Peguero Pina, J.J.; Mencuccini, M.; Gil Pelegrín, E. Xylem and phloem in petioles are coordinated with leaf gas exchange in oaks with contrasting anatomical strategies depending on leaf habit. Plant Cell Environ. 2024, 48, 1–18. [Google Scholar] [CrossRef]
  35. Ocheltree, T.W.; Gleason, S.M. Grass veins are leaky pipes: Vessel widening in grass leaves explain variation in stomatal conductance and vessel diameter among species. New Phytol. 2024, 241, 243–252. [Google Scholar] [CrossRef] [PubMed]
  36. Hacke, U.G.; Spicer, R.; Schreiber, S.G.; Plavcová, L. An ecophysiological and developmental perspective on variation in vessel diameter. Plant Cell Environ. 2017, 40, 831–845. [Google Scholar] [CrossRef]
  37. Shinozaki, K.; Yoda, K.; Kira, K.H.A.T. A quantitative analysis of plant form—The pipe model theory. Jpn. J. Ecol. 1964, 14, 97–105. [Google Scholar]
  38. Song, Y.; Zhu, J.; Yu, L.; Wang, K. Photosynthetic characteristics of Juglans mandshurica, Fraxinus mandshurica and Phellodendron amurense under different light regimes. Sci. Silvae Sin. 2009, 45, 29–36. (In Chinese) [Google Scholar]
  39. Li, G.; Yang, D.; Sun, S. Allometric relationships between lamina area, lamina mass and petiole mass of 93 temperate woody species vary with leaf habit, leaf form and altitude. Funct. Ecol. 2008, 22, 557–564. [Google Scholar] [CrossRef]
  40. Yoshinaka, K.; Nagashima, H.; Yanagita, Y.; Hikosaka, K. The role of biomass allocation between lamina and petioles in a game of light competition in a dense stand of an annual plant. Ann. Bot. 2018, 121, 1055–1064. [Google Scholar] [CrossRef]
  41. Perez, R.P.A.; Dauzat, J.; Pallas, B.; Lamour, J.; Verley, P.; Caliman, J.; Costes, E.; Faivre, R. Designing oil palm architectural ideotypes for optimal light interception and carbon assimilation through a sensitivity analysis of leaf traits. Ann. Bot. 2017, 121, 909–926. [Google Scholar] [CrossRef]
  42. Roig-Villanova, I.; Martínez-García, J.F. Plant responses to vegetation proximity: A whole life avoiding shade. Front Plant Sci. 2016, 7, 236. [Google Scholar] [CrossRef]
  43. Bell, D.L.; Galloway, L.F. Plasticity to neighbour shade: Fitness consequences and allometry. Funct. Ecol. 2007, 21, 1146–1153. [Google Scholar] [CrossRef]
  44. Santiago, L.S.; Kitajima, K.; Wright, S.J.; Mulkey, S.S. Coordinated changes in photosynthesis, water relations and leaf nutritional traits of canopy trees along a precipitation gradient in lowland tropical forest. Oecologia 2004, 139, 495–502. [Google Scholar] [CrossRef]
Figure 1. Phyllotaxy in compound leaves, including (A) schematic diagram of a single complete compound leaf. Phyllotaxy is the mode of arrangement of individual leaflets along the petiole; (B) single leaflet dissected from complete compound leaf; (C) typical anatomical traits of petiole, petiolule, and main and minor veins of Fraxinus mandshurica. Specifically, C1, C2, C3, C4, C5, C6, and C7, C8 represent the detailed anatomical structures of the minor vein, main vein, petiolule, and petiole under 4 and 40 magnifies, respectively.
Forests 16 00139 g001
Figure 2. Diameter and number of conduit in the minor vein (A,B), main vein (C,D), petiolule (E,F), and petiole (G,H) along phyllotaxy in Fraxinus mandshurica (FM), Juglans mandshurica (JM), and Phellodendron amurense (PA), respectively. The error bars represent ±1 SE. Different lower-case letters with the same color for each trait category indicate significant differences (p < 0.05) among phyllotaxy within species according to Fisher’s LSD test.
Forests 16 00139 g002
Figure 3. Palisade tissue thickness (A), spongy tissue thickness (B), ratio of palisade tissue thickness to spongy tissue thickness (C), cell tense ratio (D), spongy ratio (E), and leaflet thickness (F) along phyllotaxy in Fraxinus mandshurica (FM), Juglans mandshurica (JM), and Phellodendron amurense (PA), respectively. The error bars represent ±1 SE. Different lower-case letters with same color for each trait category indicate significant differences (p < 0.05) among phyllotaxy within species according to Fisher’s LSD test.
Forests 16 00139 g003
Figure 4. Relative share of biomass (A) and leaflet area (B) along phyllotaxy within compound leaf in Fraxinus mandshurica (FM), Juglans mandshurica (JM), and Phellodendron amurense (PA), respectively. P: petiole; T: terminal leaflet; Li: the ith leaflet along the phyllotaxy.
Forests 16 00139 g004
Figure 5. Specific leaf area (SLA) of individual leaflets along phyllotaxy in Fraxinus mandshurica (FM), Juglans mandshurica (JM), and Phellodendron amurense (PA), respectively. The error bars represent ±1 SE. Different lower-case letters with same color indicate significant differences (p < 0.05) among phyllotaxy within species according to Fisher’s LSD test.
Forests 16 00139 g005
Table 1. Descriptive statistics for all examined traits along phyllotaxy across Fraxinus mandshurica, Juglans mandshurica, and Phellodendron amurense.
TraitSpecies
Fraxinus mandshuricaJuglans mandshuricaPhellodendron amurense
MeanMaximumMinimumCVMeanMaximumMinimumCVMeanMaximumMinimumCV
NC-minor6.859.006.000.1495.326.674.000.1485.747.304.600.189
NC-main181.82250.71117.330.270220.98347.7894.000.447115.17132.1190.000.125
NC-PL587.07712.50348.800.211497.66726.67255.000.321264.00298.33212.600.123
NC-P3127.585974.00614.670.7984229.528963.671037.800.7201666.252821.68277.000.696
DC-minor2.523.171.870.8612.022.331.760.1003.033.852.260.187
DC-main8.549.889.000.08514.1317.9713.780.22211.5611.9412.220.055
DC-PL8.579.699.140.13115.4118.0913.790.14011.1712.0010.200.063
DC-P10.7213.517.740.03914.7316.4916.190.09516.7522.1011.940.278
PT79.7083.5372.670.05351.6460.0338.190.14056.8467.8949.970.114
ST49.3651.5246.090.03521.5524.8715.740.13456.8467.8949.970.114
PT/ST1.621.721.490.0552.432.941.770.1551.071.221.870.121
CTR0.500.520.480.0330.560.600.490.0660.400.440.370.062
SR0.310.340.300.0390.230.290.200.1150.380.430.340.075
LT157.68162.02150.270.03292.21105.5677.530.110146.99157.58132.350.061
PLB12.5021.264.610.00412.3517.855.500.00414.2918.847.830.003
PLA14.2919.746.200.00414.2921.536.400.00416.6721.5910.460.003
SLA23.3025.2520.020.07717.7319.0317.060.04020.4522.0318.620.062
Note: NC-minor (NO.), the number of conduit in minor vein; NC-main (NO.), the number of conduit in main vein; NC-PL (NO.), the number of conduit in petiolule; NC-P (NO.), the number of conduit in petiole; DC-minor (μm), the diameter of conduit in minor vein; DC-main (μm), the diameter of conduit in main vein; DC-PL(μm), the diameter of conduit in petiolule; DC-P (μm), the diameter of conduit in petiole; PT (μm), palisade tissue thickness; ST (μm), spongy tissue thickness; PT/ST, ratio of palisade tissue thickness to spongy tissue thickness; CTR, cell tense ratio; SR, spongy ratio; LT (μm), leaflet thickness; PLB (%), proportions of leaflet biomass; PLA (%), proportions of leaflet area; SLA (cm2·g−1), specific leaf area.
Table 2. Results of three-way (species, leaflet position, and phyllotaxy) factorial ANOVA of the number and diameter of conduits of different components in compound leaves.
Source of VariationF Valuesp Values
Number of Conduit Diameter of Conduit Number of ConduitDiameter of Conduit
Species31.057114.606<0.001<0.001
LP1482.648453.755<0.001<0.001
PI130.21721.732<0.001<0.001
Species × LP13.453148.993<0.001<0.001
Species × PI4.62327.124<0.001<0.001
LP × PI110.55413.038<0.001<0.001
Species × LP × PI3.53121.499<0.001<0.001
Note: LP, leaflet position, i.e., main and minor vein in this study; PI, phyllotaxy.
Table 3. Results of two-way (species and phyllotaxy) factorial ANOVA of leaflet morphology and anatomy traits in compound leaves.
Source of VariationF Valuesp Values
PTSTPT/STCTRSRLTPLBPLASLAPTSTPT/STCTRSRLTPLBPLASLA
Species169.713322.066184.806144.976214.479390.5211.1971.57533.523<0.001<0.001<0.001<0.001<0.001<0.0010.1390.208<0.001
PI5.0092.4953.9443.9402.8064.58732.61821.2663.304<0.0010.020<0.001<0.0010.010<0.001<0.001<0.0010.021
Species × PI2.4001.6073.5702.8222.6152.1063.4622.7240.3860.0090.105<0.0010.0030.0050.025<0.0010.0020.957
Note: PT (μm), palisade tissue thickness; ST (μm), spongy tissue thickness; PT/ST, ratio of palisade tissue thickness to spongy tissue thickness; CTR, cell tense ratio; SR, spongy ratio; LT (μm), leaflet thickness; PLB (%), proportions of leaflet biomass; PLA (%), proportions of leaflet area; SLA (cm2·g−1), specific leaf area.
Disclaimer/Publisher’s Note: The statements, opinions and data contained in all publications are solely those of the individual author(s) and contributor(s) and not of MDPI and/or the editor(s). MDPI and/or the editor(s) disclaim responsibility for any injury to people or property resulting from any ideas, methods, instructions or products referred to in the content.

