Article

Changes in the Timing of Autumn Leaf Senescence of Maple and Ginkgo Trees in South Korea over the Past 30 Years: A Comparative Assessment of Process-Based, Linear Regression, and Machine-Learning Models

1
Department of Agriculture, Forestry and Bioresources, Seoul National University, Seoul 08826, Republic of Korea
2
Department of Environmental Science, Kangwon National University, Chuncheon 24341, Republic of Korea
3
Research Institute for Agriculture and Life Sciences, Seoul National University, Seoul 08826, Republic of Korea
4
Interdisciplinary Program in Agricultural and Forest Meteorology, Seoul National University, Seoul 08826, Republic of Korea
*
Authors to whom correspondence should be addressed.
Forests 2025, 16(1), 174; https://doi.org/10.3390/f16010174
Submission received: 9 December 2024 / Revised: 10 January 2025 / Accepted: 15 January 2025 / Published: 17 January 2025
(This article belongs to the Section Forest Inventory, Modeling and Remote Sensing)

Abstract

:
Changes in vegetation activities driven by climate change serve as both a sensitive indicator and a key driver of climate impacts, underscoring the need for accurate phenological predictions. Delays in leaf senescence due to rising air temperatures increase the risk of damage from early frost, potentially affecting growth and survival in subsequent years. This study aimed to quantify long-term changes in leaf senescence timing for palmate maple and ginkgo trees, explore their associations with environmental factors, and compare the performance of multiple modeling approaches to identify their strengths and limitations for phenological predictions. Using data from 48 sites across South Korea (1989–2020), this study analyzed trends in the timing of leaf senescence for maple and ginkgo trees and compared the performance of process-based models (CDD_T, CDD_P, TP_T, TP_P), a linear regression model, and machine-learning models (random forest, RF; gradient-boosting decision tree, GBTD). Leaf senescence timing for both species has progressively been delayed, with ginkgo trees showing a faster rate of change (0.20 vs. 0.17 days per year, p < 0.05). Delayed senescence was observed in most regions (81% for maple and 75% for ginkgo), with statistically significant delays (p < 0.05) at half of the sites. Machine-learning models demonstrated the highest training accuracy (RMSE < 4.0 days, r > 0.90). Evaluation with independent datasets revealed that the RF and process-based TP_P (including minimum temperature and photoperiod) using a site-specific approach performed best (RMSE < 5.5 days, r > 0.75). Key environmental factors identified by RF included autumn minimum or mean temperatures and a summer photoperiod. By conducting this comparative assessment, the study provides insights into the applicability of different modeling approaches for phenology research and highlights their implications for vegetation management and climate change adaptation.

1. Introduction

The concentration of greenhouse gases in the atmosphere has increased sharply since the Industrial Revolution, driving a continuous rise in global temperatures. According to the Intergovernmental Panel on Climate Change, surface temperatures in the Northern Hemisphere in recent decades have reached their highest levels in the past 1400 years [1], resulting in widespread shifts in vegetation phenology across temperate and boreal forest regions [2,3,4,5,6]. These shifts affect ecosystem structure and function by altering productivity, community composition, and carbon, water, and energy exchanges between ecosystems and the atmosphere [7,8,9], thereby reshaping the climate [10,11]. Understanding and predicting phenological changes, therefore, are critical not only for interpreting climate change impacts but also for informing ecosystem management and adaptation strategies.
Many previous studies on phenological modeling have primarily focused on spring phenology, such as flowering and leaf-out [12,13,14,15,16,17,18,19,20]. In contrast, autumn phenological events, such as leaf senescence and leaf fall, have received less attention due to challenges like ambiguous criteria for field observations, which lead to relatively high uncertainties in the data [21,22]. Additionally, eco-physiological experiments, such as manipulation experiments, have been limited, making it difficult to quantify fall phenological responses to climate change. However, the annual growing season and carbon uptake period of vegetation are jointly determined by spring and autumn phenology [7], and recent studies suggest that changes in autumn phenology may have a greater influence on the length of the growing season [23] and net ecosystem productivity [24] than those in spring. Furthermore, delayed leaf senescence and leaf fall not only extend the growing season but also increase the risk of early frost damage, which can directly impact tree growth and survival in subsequent years [25,26].
Given the growing importance of studying autumn phenology in temperate tree species, research efforts have increasingly turned to models to understand how leaf senescence timing responds to climatic factors. These studies have primarily employed statistical models [27,28,29,30], process-based models [31,32,33,34], and, more recently, machine-learning methods [35,36,37]. Process-based models, which are built on biological mechanisms inferred through experiments, generally outperform simple statistical models [38] such as linear regression that assume linear relationships between climate factors and phenological events. Machine-learning models, with their ability to capture nonlinear relationships and utilize ensemble techniques, have demonstrated even greater predictive performance compared to traditional statistical approaches [27,39,40,41]. As a result, recent studies have increasingly adopted machine-learning algorithms, such as random forest, gradient boosting, and support vector machines, to enhance the accuracy of phenology predictions [35,36,37,42,43]. Moreover, certain machine-learning models, particularly random forest, facilitate the assessment of the importance of climatic factors by ranking them based on their contribution to the model, thereby supporting more reliable projections of phenological responses to future climate conditions. However, the reliance of machine-learning models on large datasets and their limited interpretability compared to process-based models pose challenges for their practical application in ecological research.
Therefore, this study aimed to address these gaps by quantifying long-term changes in leaf senescence timing in deciduous tree species and investigating their associations with environmental factors using a comparative modeling approach. Specifically, we developed and evaluated process-based, linear regression, and machine-learning-based models using data on leaf senescence timing in ginkgo and palmate maple trees (Ginkgo biloba and Acer spp.) observed at over 40 sites nationwide (46 and 43 for ginkgo and maple trees, respectively) between 1989 and 2020. We also analyzed the key climatic and environmental drivers influencing leaf senescence timing to better understand the observed temporal changes and their implications. By conducting this comparative assessment, we aimed to highlight the strengths, limitations, and practical applications of each modeling approach, providing insights for phenology research and broader climate change studies.

2. Materials and Methods

2.1. Data

For this study, we utilized long-term observations of leaf senescence timing for palmate maple (Acer spp.) and ginkgo (Ginkgo biloba) trees across South Korea obtained from the Korea Meteorological Administration (KMA) Data Portal (https://data.kma.go.kr, data collected on 24 May 2021, last accessed on 11 November 2024). The KMA conducts autumn phenological observations on ginkgo and palmate maple trees annually. Observations are made daily from early September to late November at specific KMA weather stations (Figure 1, Table A1), focusing on a single designated tree at each site that was selected for consistent, long-term monitoring of seasonal changes. The onset of leaf coloration is defined as the date when approximately 20% of the tree canopy has changed color, while the peak of coloration is recorded when about 80% of the canopy has turned color [44]. These assessments are made through visual observation by trained personnel. The peak of leaf coloration records was relatively fewer (approximately 86%–87% of onset records), leading us to use the onset of leaf coloration, which is more consistently observed, as an indicator for autumn leaf senescence timing.
To develop and evaluate models for simulating autumn leaf senescence timing, we selected data spanning at least 20 years of phenological observations from 1989 to 2020, covering 46 sites for ginkgo trees and 43 sites for palmate maple trees (Figure 1). All the details about the site name, location, mean senescence dates, etc. are presented in Table A1. Meteorological stations measure various climate variables, including air temperature, precipitation, sunshine duration, solar radiation, humidity, wind speed, and atmospheric pressure. Previous studies have emphasized nighttime and daytime temperatures and photoperiod as the key factors influencing autumn phenology [31,32,33,34,45,46,47,48,49], while additional factors, such as water availability [26,50], nutrient availability [51], insolation [52,53], and the timing of the preceding leaf unfolding [54,55], have also been suggested to contribute to the timing of autumn leaf senescence. Based on these findings and the availability of consistently measured data, we collected daily maximum, minimum, and mean temperatures, precipitation, and sunshine duration. Additionally, the photoperiod was calculated for each observation site and each day using the day of the year and latitude [56]. This calculation was performed using the geosphere package (version 1.5.20) in R (version 4.4.1).

2.2. Model Description

2.2.1. Process-Based Model

In the process-based model for predicting leaf senescence timing, the onset of leaf senescence ( Y ) is defined as the day when the accumulated daily leaf senescence rate ( R s e n ) reaches a threshold value ( S * s e n ) after a specific starting date ( t 1 ) (Equation (1)). In this model, the initiation of leaf senescence ( t 1 ) is determined as the earliest point when environmental conditions fall below a reference temperature or a critical photoperiod.
S * s e n = t 1 Y R s e n
The process-based models used in this study include the CDD (cold degree days) model [31,57,58] and the TPM (low temperature and photoperiod multiplicative) model [33]. Both the CDD and TPM models are categorized into two subtypes based on whether temperature or photoperiod serves as the criterion for determining the onset of leaf senescence (Table 1).
The CDD model assumes that leaf senescence progresses under cold conditions, with the daily senescence rate calculated as the difference between the daily mean temperature and a reference temperature (Table 1). In this study, we designated models using the reference temperature as the sole criterion for the onset of senescence as CDD_T [57], while models considering both the reference temperature and the critical photoperiod as criteria for determining the onset of senescence were labeled as CDD_P [31,58].
Unlike the CDD, the TPM uses the daily minimum temperature instead of the daily mean temperature as its temperature variable ([33], Table 1). According to the TPM model’s senescence rate formula, the leaf senescence rate increases exponentially as both the daily minimum temperature and photoperiod decrease. Similar to the CDD model, TPM models were classified into two types: TP_T and TP_P. The TP_T model defines the onset of senescence as the first day when the daily minimum temperature falls below the reference temperature, while the TP_P model defines it as the first day when the photoperiod drops below the critical threshold.

2.2.2. Linear Regression

For the linear regression model (LR), we used the onset of leaf senescence as the response variable and environmental factors as predictor variables. Regression coefficients were estimated using the least square method. The predictor variables included monthly averages of daily maximum, mean, and minimum temperatures from January to September, monthly average photoperiod, monthly cumulative precipitation, monthly cumulative sunshine duration, latitude, longitude, and elevation. To address multicollinearity and select optimal predictors for the linear regression model, the following steps were undertaken. (1) Pairs of variables with Pearson correlation coefficients exceeding 0.9 were identified to mitigate multicollinearity while retaining relevant predictors [30,59,60]. For each pair, the variable with a weaker correlation to leaf senescence timing was excluded. (2) The stepwise selection method, implemented in the R (version 4.4.1) package leaps (version 3.2), was applied to identify the optimal predictors. The best model was selected based on the Bayes information criterion (BIC). (3) A variance inflation factor (VIF) analysis was conducted to ensure that all retained predictors had VIF values below 10, confirming minimal multicollinearity [60].

2.2.3. Machine-Learning Approach

Ensemble models combine a large number of weak learners, aggregate their predictions, and achieve high overall accuracy. To enhance the prediction of autumn leaf senescence, a machine-learning approach was developed using ensemble techniques like boosting and bagging (bootstrap aggregating) with decision tree models. The random forest model (RF), based on the bagging method, limits the number of variables (features) for consideration at each decision-making. This feature-level randomness, combined with bootstrap sampling, allows the trees in the ensemble to focus on different parts of the data, helping to reduce overfitting and improve generalization. On the other hand, the gradient-boosting decision tree model (GBDT) uses the boosting method, where decision trees are trained one at a time, with each tree improving upon the errors of the previous trees. Each subsequent tree focuses on correcting the errors of the previous one by prioritizing instances that contribute more to the residual errors, guided by the minimization of a loss function.
The predictors used in RF and GBDT were consistent with those in the LR (monthly averages of daily maximum, mean, and minimum temperatures from January to September, monthly mean photoperiod, monthly cumulative precipitation, monthly cumulative sunshine duration, latitude, longitude, and elevation). Monthly data were chosen over weekly data as they demonstrated more reliable results, likely due to reduced variability and noise, which can improve the robustness of the model. To mitigate multicollinearity, pairs of variables with Pearson correlation coefficients exceeding 0.9 were identified, and the variable less strongly correlated with leaf senescence timing was excluded [60]. However, tree-based machine-learning models tend to be less sensitive to multicollinearity due to their inherent structure [61]. Therefore, the additional steps described in Section 2.2.2 were not applied.

2.3. Model Development

The models were developed using two approaches: (1) a multi-site modeling approach, which integrated data from all sites by pooling site-level observations into a single dataset, and (2) a site-specific modeling approach, where the models were independently built for each site. The performance differences between these approaches were compared. The 32 years of leaf senescence timing data were split approximately 8:2, with 80% of the data used for model development and parameter or hyperparameter estimation, and the remaining 20% used for model validation. To ensure consistency in the training and validation periods across all sites, six random years (1994, 1996, 2003, 2005, 2009, and 2019) from the 1989–2020 period were selected for model evaluation. A Wilcoxon rank-sum test was conducted to confirm that there were no statistically significant differences between the distributions of the training and validation datasets.
The parameter estimation was conducted using the R (version 4.4.1) packages GenSA (version 1.1.14.1), xgboost (version 1.7.8.1), and ranger (version 0.17.0). The simulated annealing (SA) algorithm was applied to the four process-based models (CDD_T, CDD_P, TP_T, and TP_P). For the two machine-learning models (RF and GBDT), hyperparameter optimization was performed using a grid search algorithm. In addition, hyperparameter tuning for the GBDT model employed K-fold cross-validation (K = 10 for the integrated model and K = 5 for site-specific models), while the RF model utilized the out-of-bag (OOB) error approach.

2.4. Model Evaluation

The training and validation performance of seven models (CDD_T, CDD_P, TP_T, TP_P, LR, RF, and GBDT) were evaluated. We used root mean square error (RMSE) (Equation (2)), Nash–Sutcliffe efficiency (NSE) (Equation (3)), and the Pearson correlation coefficient (r) (Equation (4)) as performance metrics. The cor() function from the stats (version 4.4.1) package in R (version 4.4.1) was used to compute r.
R M S E = i = 1 n ( d p i d o i ) 2 n
N S E = 1 i = 1 n ( d o i d p i ) 2 i = 1 n ( d o i d o ¯ ) 2
r = i = 1 N d o i d o i ¯ d p i d p i ¯ i = 1 N d o i d o i ¯ 2 · i = 1 N d p i d p i ¯ 2
Here, d o i denotes the date when the phenological event (onset of leaf senescence) was observed in the i t h year, d p i is the predicted date by the model for the same year, and n indicates the total number of observations. The NSE ranges from to 1, where a value closer to 1 indicates greater model efficiency. If the NSE is negative, the model performs worse than predicting the average of the observed dates. In addition, RMSE values were calculated for each site (RMSEsite), and their distributions were compared across the model types and development approaches.

2.5. Statistical Analysis

RMSEsite were used to compare the performance differences across the model types (CDD_T, CDD_P, TP_T, TP_P, LR, RF, and GBDT) and modeling approaches (multi-site modeling and site-specific modeling). Statistical differences among the model types were tested using a one-way analysis of variance (ANOVA), and Tukey’s post hoc test was conducted if significant differences were detected. A paired t-test was performed to compare the performances of the multi-site and site-specific models.
Additionally, to analyze changes in average leaf senescence timing and autumn (September to November) temperatures over 30 years and regional variations, we focused on 16 sites with observation periods exceeding 25 years that continued through 2020 to examine the changes in leaf senescence timing over the study period. Sen’s slope was calculated, and the Mann–Kendall test was conducted using the zyp (version 0.11.1) and wql (version 1.0.1) R (version 4.4.1) packages. All statistical analyses were performed in R (version 4.4.1).

3. Results

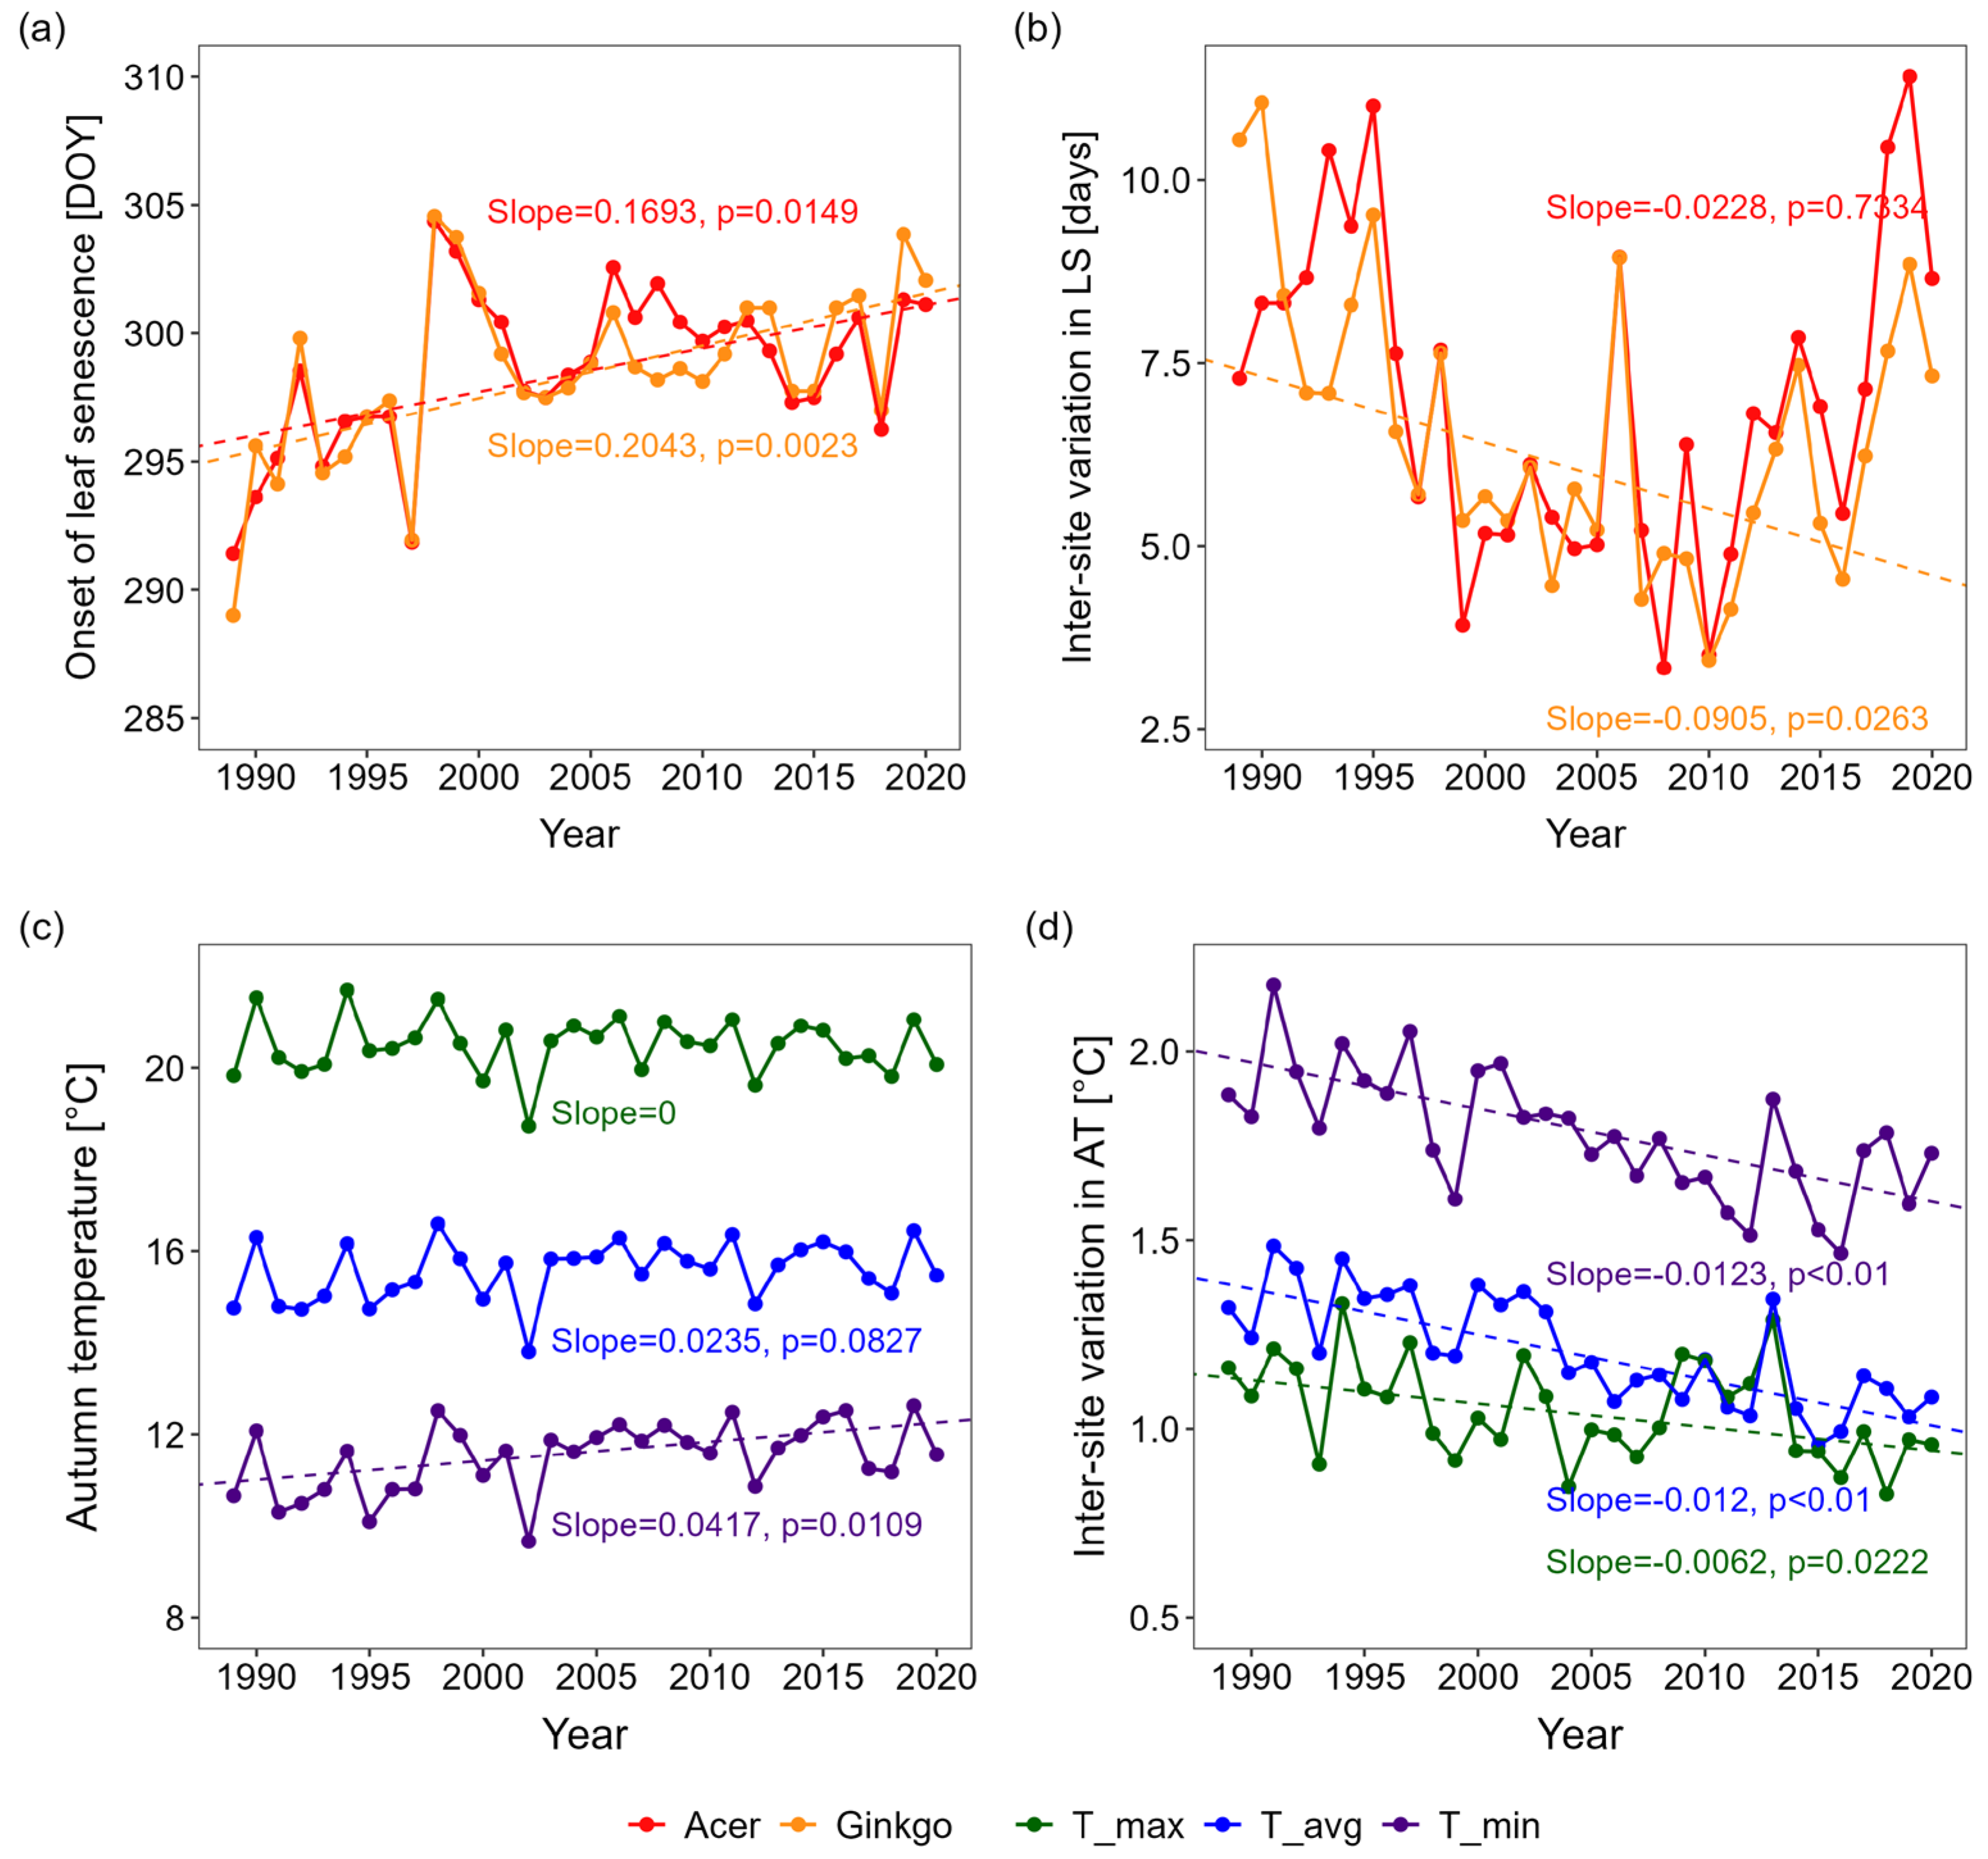
3.1. Changes in Leaf Senescence Timing

Over the past 30 years, the average leaf senescence timing for maple and ginkgo trees across all of the sites has been delayed (Figure 2a). In 1989, the average timing was approximately day of the year (DOY) 290 for both species (maple: 291 ± 7; ginkgo: 289 ± 11). By 2020, these dates had shifted to around DOY 300 (maple: 301 ± 8; ginkgo: 302 ± 7). Such delayed trends in leaf senescence timing were statistically significant for both species (Figure 2a), with ginkgo showing a slightly faster rate (0.204 days year−1, τ = 0.383, p = 0.002) compared to maple (0.169 days year−1, τ = 0.306, p = 0.015).
Over the entire study period (1989–2020), inter-site variation (i.e., the standard deviation among sites) in leaf senescence timing showed a decreasing trend, which was significant for ginkgo trees (−0.09 days year−1, τ = −0.28, p = 0.026, Figure 2b). Similarly, the inter-site variation in autumn temperatures (September–November) decreased (Figure 2d), likely contributing to reduced differences in leaf senescence timing until 2010. However, over the past decade, inter-site variation in leaf senescence timing began increasing again (Figure 2b). For ginkgo, the variation was highest in 1990 (11.0 days) and lowest in 2010 (3.4 days). Similarly, maple showed a steady decline after the mid-1990s, reaching its lowest point in 2008 (3.3 days), but this trend reversed, with variation peaking at 11.4 days in 2019.
In terms of each of the observation locations, most sites showed delayed trends in leaf senescence timing for both maple and ginkgo (13 and 12 out of 16 sites, respectively) (Figure 3). Among these, approximately 50% of the sites (maple: seven sites, ginkgo: nine sites) showed statistically significant delays (p < 0.05). At a few sites, earlier trends were observed, but none were significant.

3.2. Model Comparison for Multi-Site Approach

For the multi-site approach (i.e., blue boxes in Figure 4), the machine-learning models (GBDT, RF) exhibited substantially improved training performance compared to the process-based models and a linear regression model (Table 2, left panels in Figure 4a,b). The GBDT and RF showed RMSEs below 3 days and correlation coefficients above 0.95 (Table 2). Notably, the GBDT explained 94% and 93% of the total variation in maple and ginkgo trees, respectively (Table 2). However, the process-based models showed slightly lower training performance than LM. When RMSEs were calculated separately for each site (RMSEsite in Figure 4), the GBDT and RF had, on average, 3.5–5 days lower RMSEsite than those of the other models. Furthermore, the site-to-site variability in RMSEsite (standard deviation of RMSEsite) was less than half that of the other models. The statistical details are presented in Figure 4.
In the validation dataset (i.e., right panels in Figure 4a,b), the machine-learning models still outperformed the others, while the process-based models showed the lowest performance (Table 2, right panels in Figure 4a,b). However, performance differences among the model types decreased compared to the training dataset. Specifically, GBDT and RF performed relatively worse on the validation dataset compared to their performance on the training dataset (Table 2). Notably, there were no statistically significant differences in RMSEsite between the two machine-learning models and the other models (p < 0.05), except for TP_T in maple and CDD_T in ginkgo (Figure 4).

3.3. Model Comparison for Site-Specific Approach

When models were constructed independently for each site (i.e., red boxes in Figure 4), the machine-learning models (GBDT, RF) still outperformed the other models, which was similar to the results from the multi-site approach (Table 3, left panels in Figure 4a,b). The RMSE of the machine-learning models was less than 4 days, with correlation coefficients exceeding 0.93 (Table 3). The GBDT explained 92% and 91% of the total variation for the senescence dates in maple and ginkgo trees, respectively, while the RF modeled 84% and 85% of the variation (Table 3). GBDT and RF outperformed the other models, with RMSEsite values that were approximately 3.5–5 days lower (p < 0.05, Figure 4). Statistical details are presented in Figure 4.
Interestingly, however, similar to the results from the multi-site model approach, the performance differences between machine learning and some process-based models were reduced in the validation dataset (Table 3, right panels in Figure 4a,b).
The RMSEsite values for RF and TP_P were not statistically significant for either species (Figure 4), although the RF and TP_P showed the best performance for maple and ginkgo, respectively. For maple, RF and TP_P demonstrated significantly lower RMSEsite values compared to the LR (p < 0.05, right panel in Figure 4a). For ginkgo, no statistically significant differences for RMSEsite were observed among the model types (right panel in Figure 4b). Meanwhile, the LR generally exhibited a lower validation performance compared to both the process-based and machine-learning models with a site-specific approach (Table 3, right panels in Figure 4a,b).

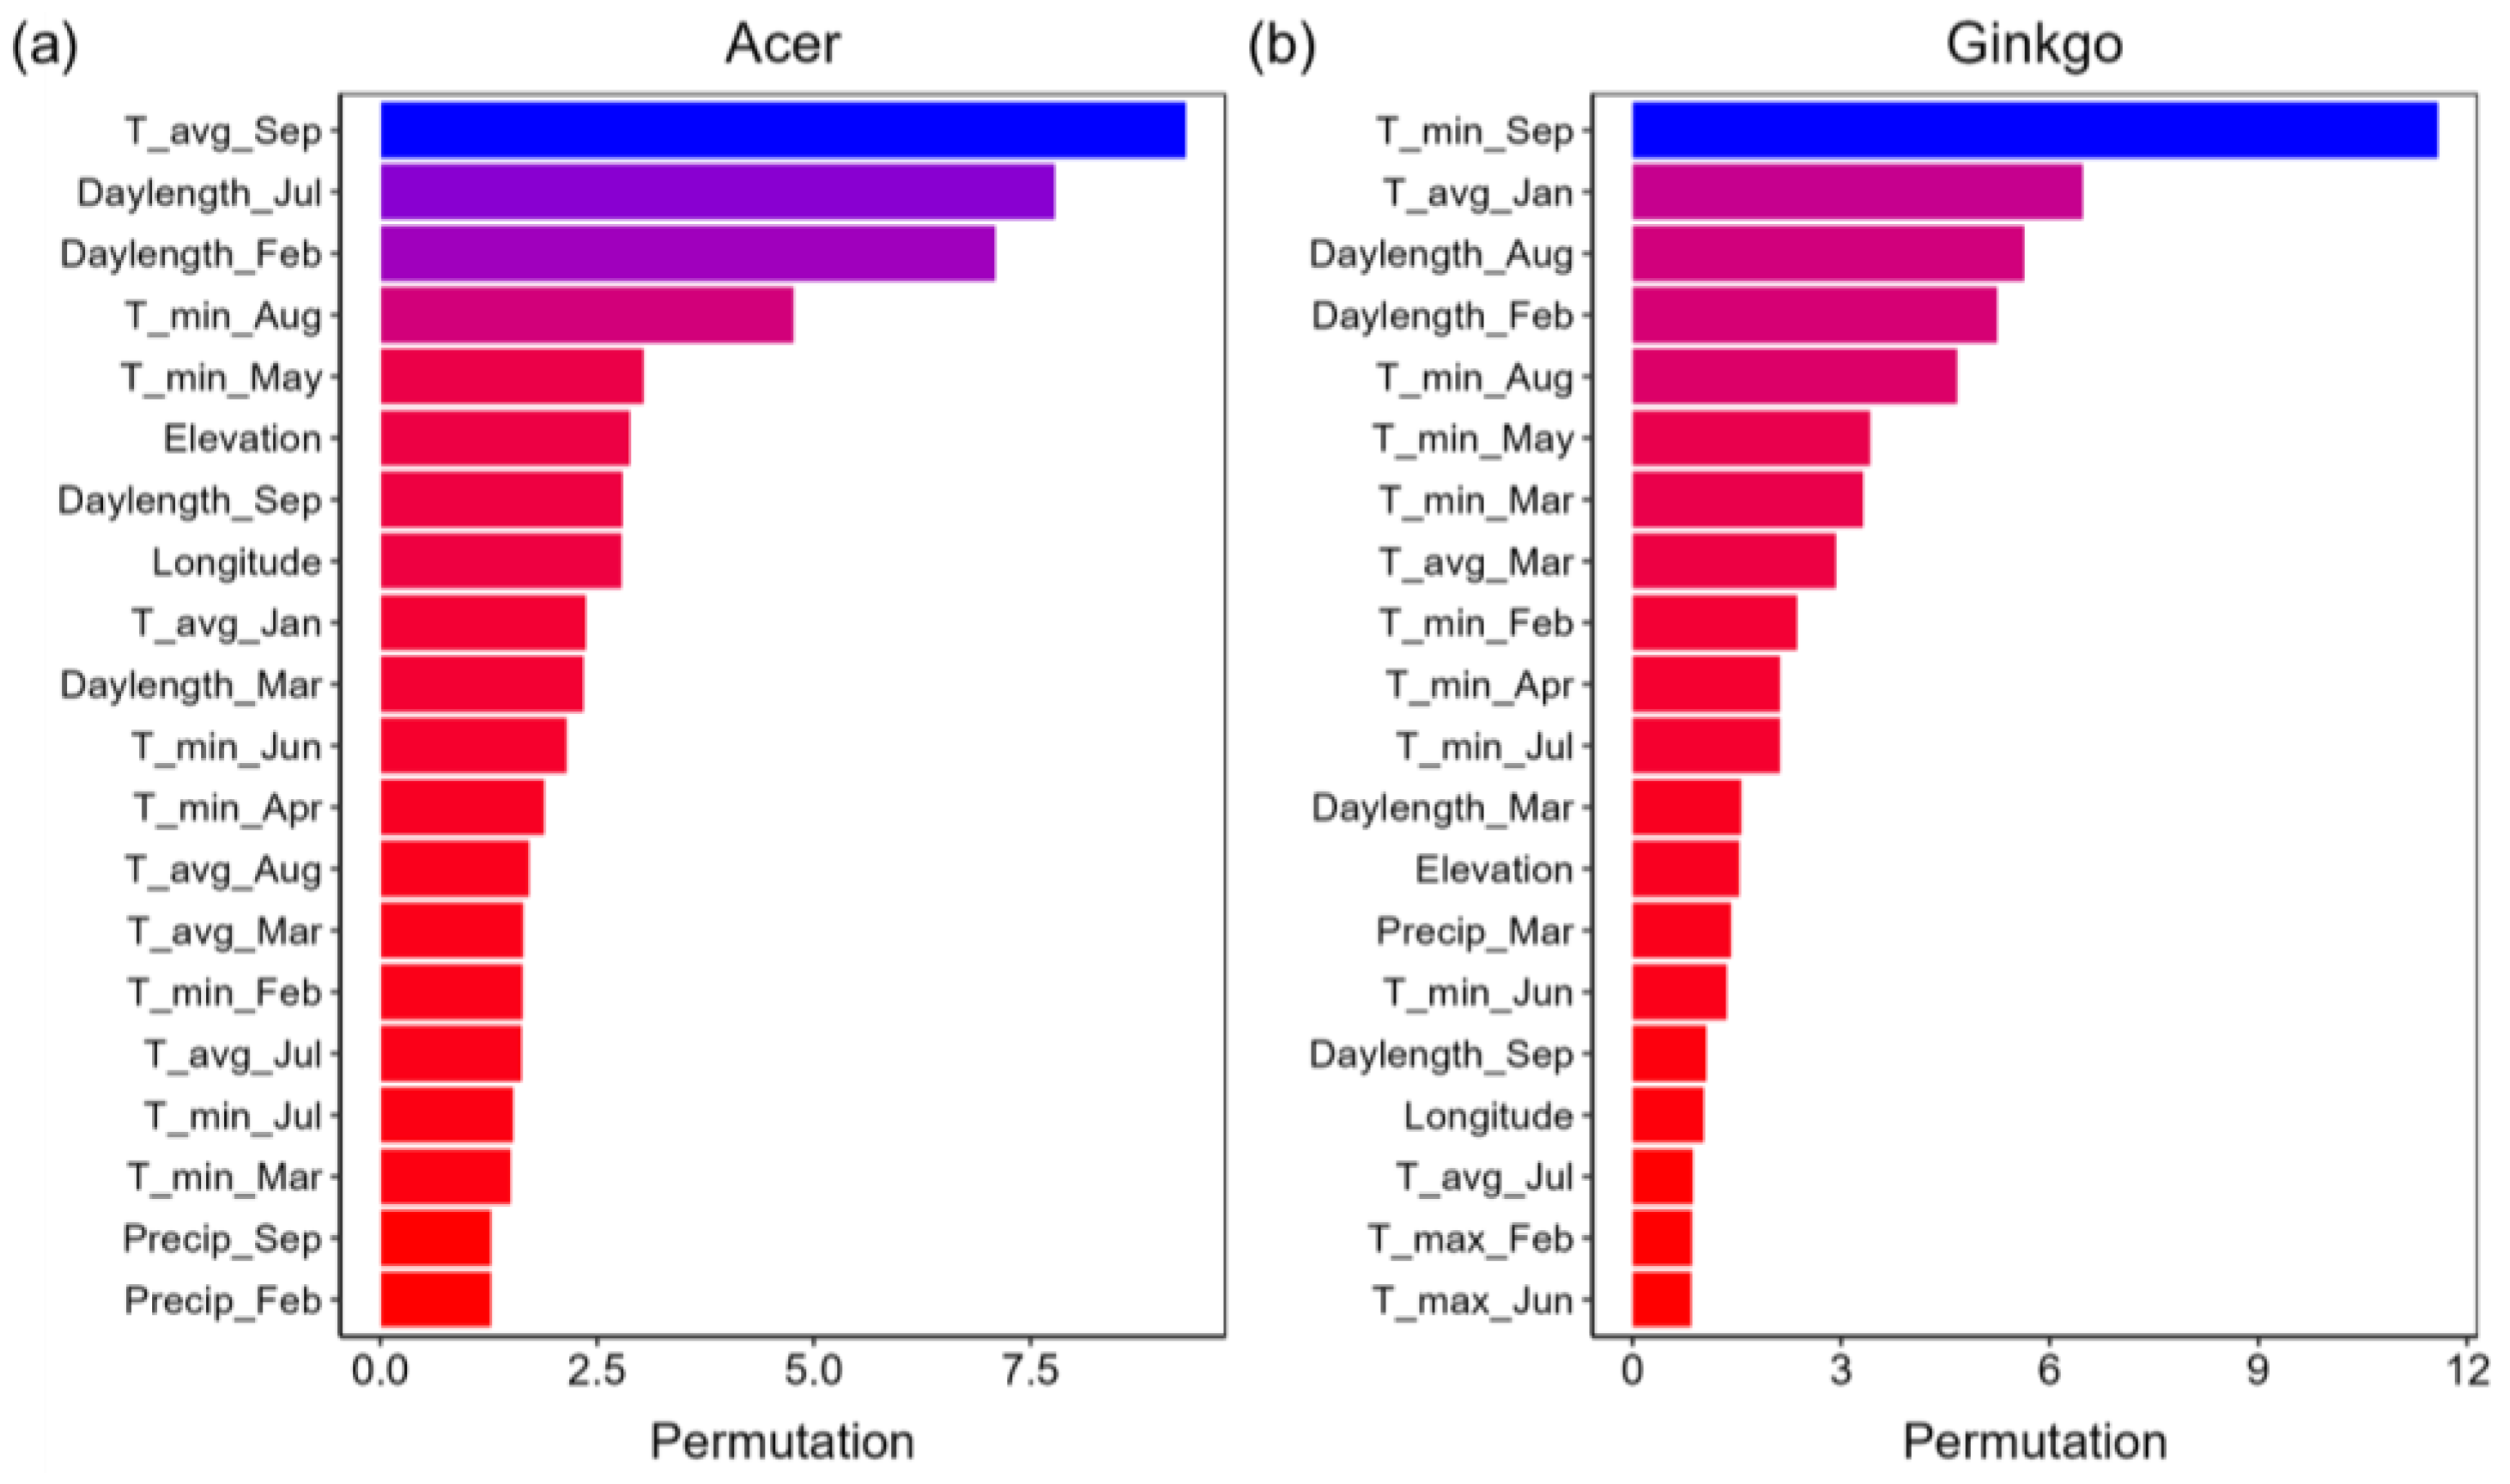
3.4. Importance Analysis

The importance of the predictors for autumn leaf senescence was assessed using permutation importance in the RF (Figure 5). The results showed that September temperatures, just before leaf coloring, were the most important factor for predicting leaf senescence timing in both ginkgo and maple trees. Among temperature variables, daily mean and minimum temperatures had a greater influence than daily maximum temperatures. The summer photoperiod was also identified as a key factor.

4. Discussion

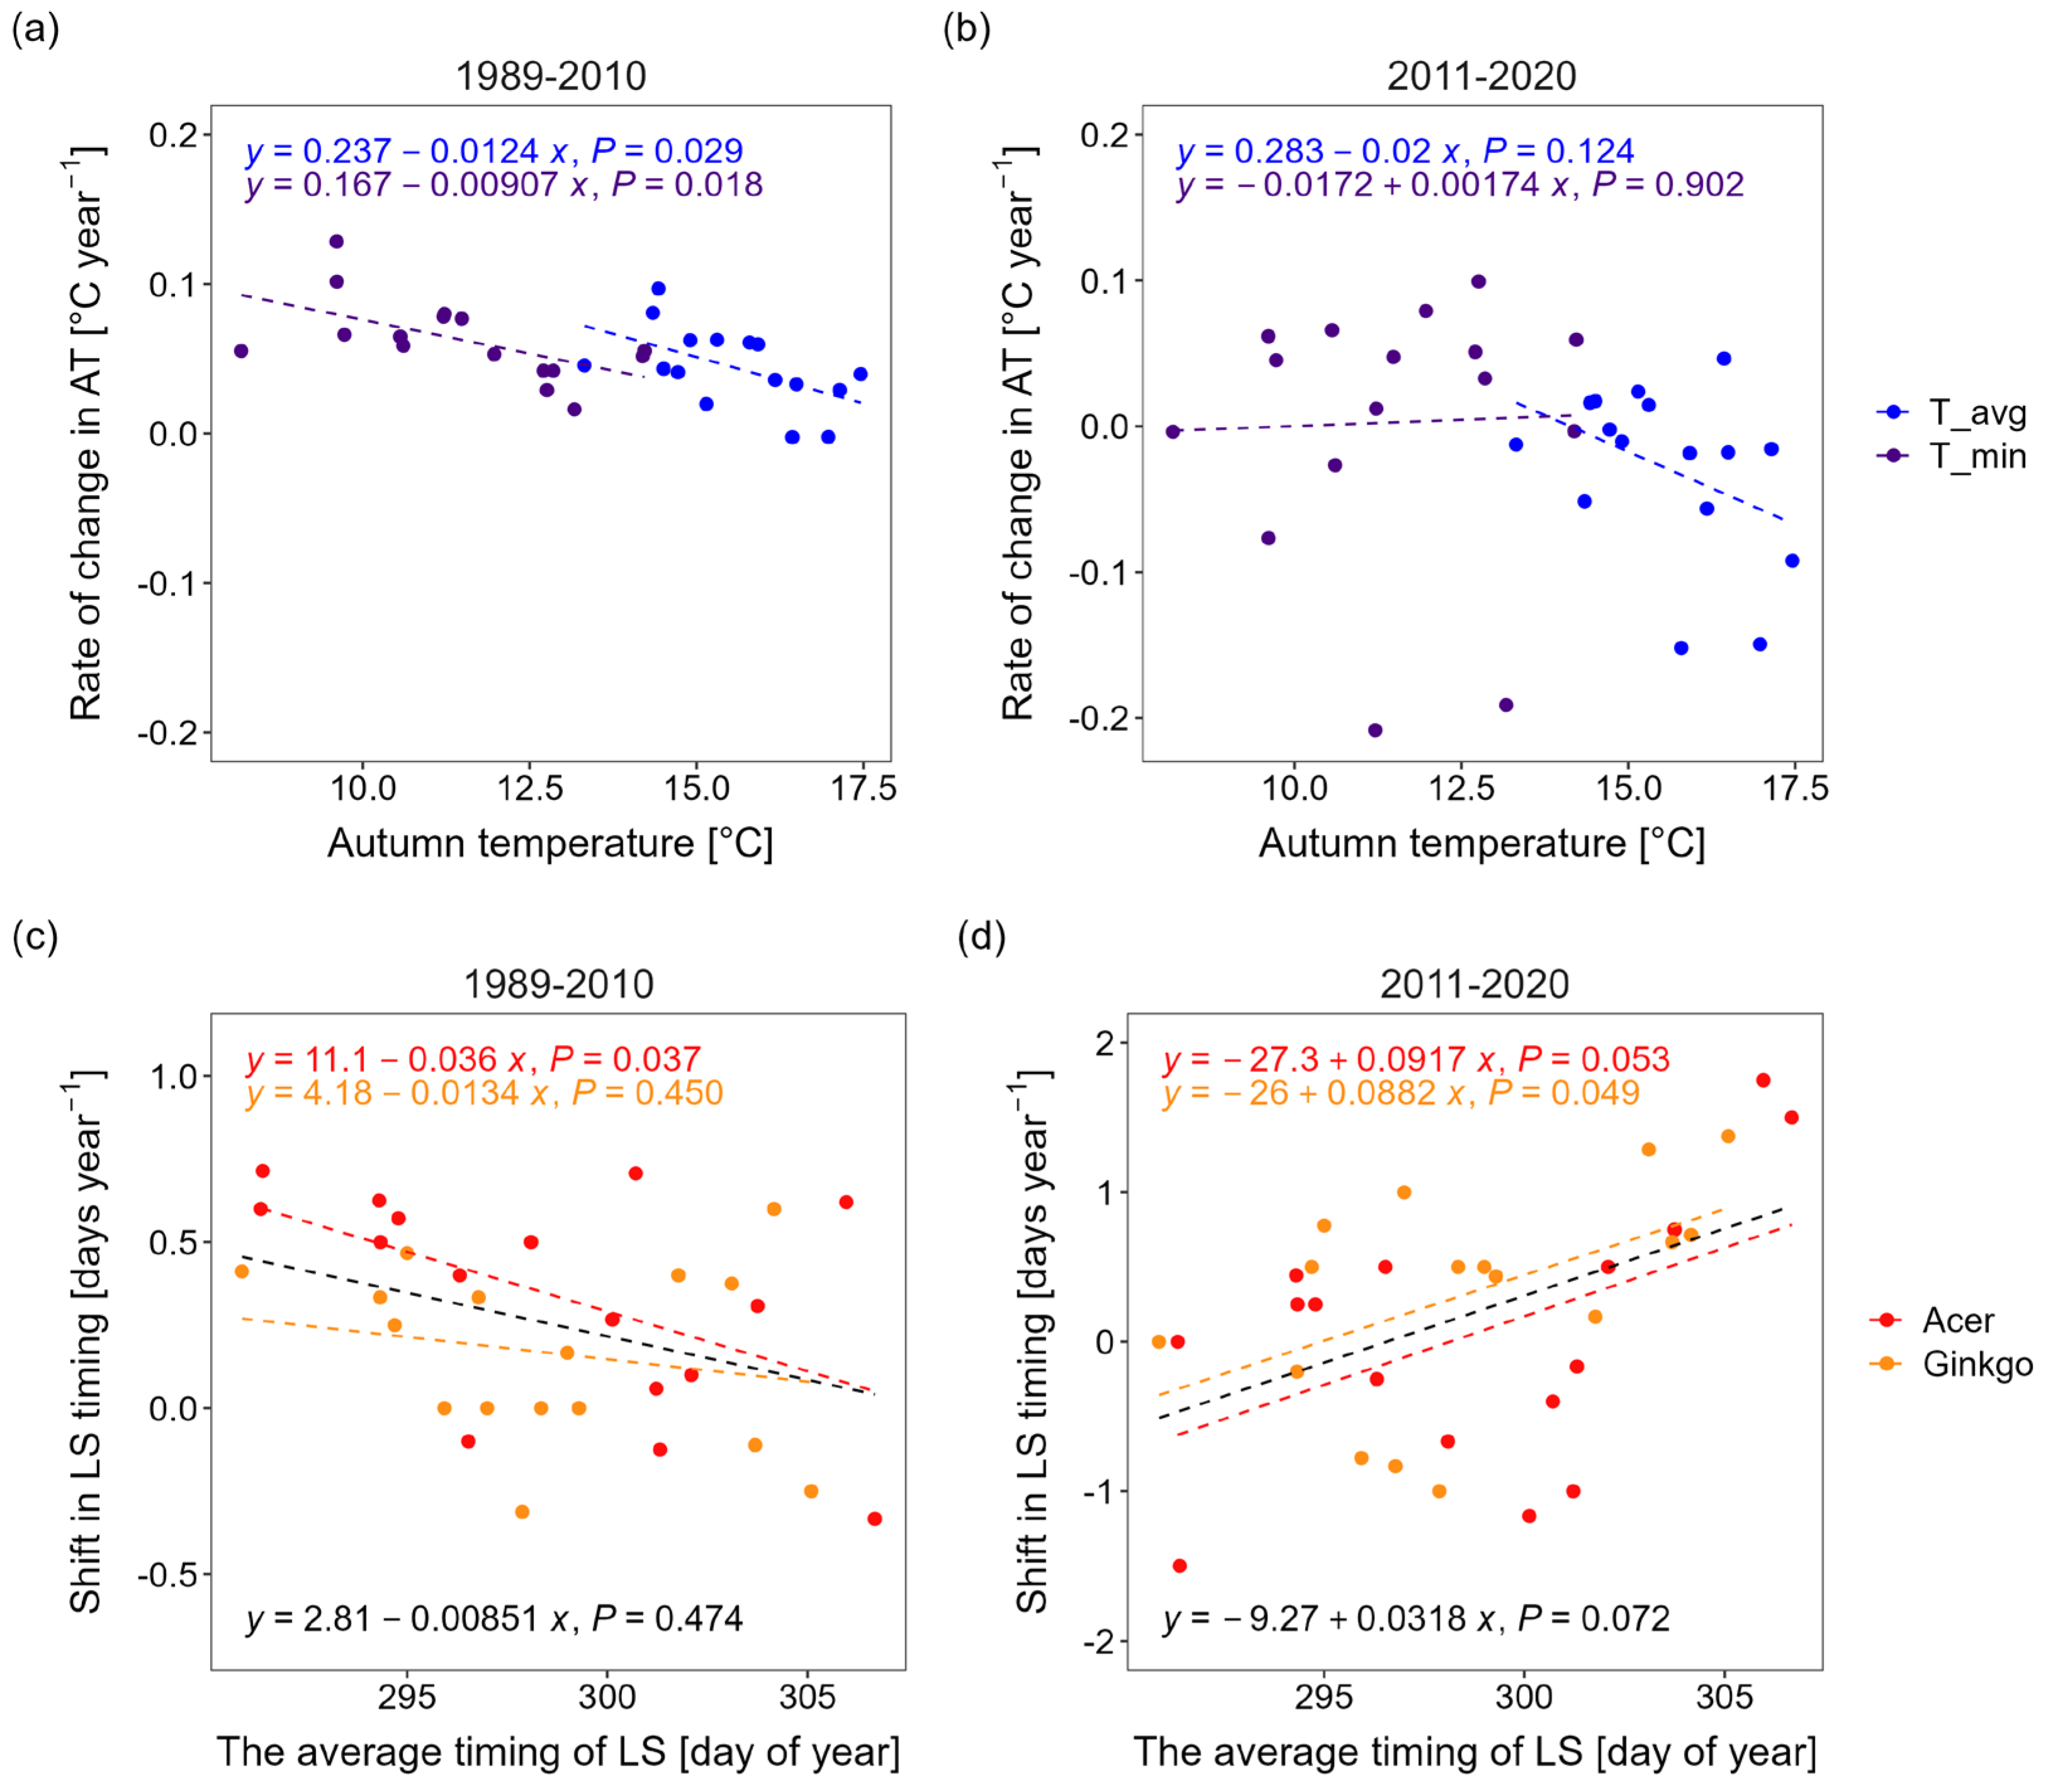
4.1. Environmental Factors Driving Autumn Leaf Senescence

Rising temperatures in the Northern Hemisphere have led to delayed autumn phenological events over the past few decades [2,3,4,6,7,23,62,63], and extended the growing season in temperate and boreal forests [3,7,23]. Similarly, this study reveals that, in South Korea, daily minimum and mean temperatures during autumn have steadily increased over the past 30 years (1989–2020) (Figure 2c), and the timing of leaf senescence for maple and ginkgo has shifted to later compared to the 1990s (Figure 2a).
The variation in autumn leaf senescence timing across sites showed a declining trend until 2010, largely driven by differences in temperature changes among sites. The rate of change in autumn temperatures from 1989 to 2010 reflected that most sites experienced warming, with colder regions generally showing more pronounced temperature increases (p < 0.05, Figure 6a). Sites with higher autumn temperatures and later leaf senescence timing (Table A1) tended to exhibit slower warming rates (Figure 6a). Consequently, sites with earlier leaf senescence experienced greater autumn warming, which led to more pronounced delays in leaf senescence timing compared to warmer sites where leaf coloring occurred later (Figure 6c). This uneven autumn warming likely contributed to the reduction in the differences in leaf senescence timing between sites to narrow over time (Figure 2b). However, since 2011, these differences have started to widen again (Figure 2b). Autumn temperature trends across sites over the past decade (2011–2020) (Figure 6b) revealed that, while the warming trend in average temperatures has slowed in most locations, minimum temperatures have continued to rise at many sites, particularly in warmer areas. This marks a reversal of the patterns observed before 2011. As a result, from 2011 to 2020, the greatest delays in senescence timing were observed at sites with later leaf senescence (Figure 6d), which likely contributed to the renewed increase in site-to-site variation.
Furthermore, as the trend of delayed leaf senescence has recently moderated in many locations (Figure 6c,d), the overall pace of delay in leaf senescence timing appears to be decreasing. Park, Ho, Jeong, Lee and Kim [58] analyzed changes in leaf senescence timing for maple and ginkgo trees in South Korea from 1989 to 2007 using data collected through the same observation network. They reported that the timing of leaf senescence was delayed by approximately 0.45 days per year for maple and ginkgo trees (maple: 0.44 d a y s   y e a r 1 , ginkgo: 0.46 d a y s   y e a r 1 ). In contrast, this study reveals reduced delay rates of +0.1693 d a y s   y e a r 1 for maple and +0.2043 d a y s   y e a r 1 for ginkgo from 1989 to 2020. These rates are about 55%–60% (maple: 55.6%, ginkgo: 61.5%) lower than those reported by Park, Ho, Jeong, Lee and Kim [58].
This phenomenon may be associated with the recent slowdown in autumn warming trends in many locations (Figure 6b). Additionally, the limitations of photoperiod may also have affected the rate of delay in leaf senescence timing. In contrast to spring phenology, which is predominantly driven by temperature [19,64,65], with photoperiod serving as a genetically fixed constraint [66,67], autumn phenology is regulated by both the declining photoperiod and temperature as key environmental cues [32,46,47,49]. In this study, regardless of the modeling approach, the TP_P model outperformed the TP_T model, and the CDD_P model showed better performance than the CDD_T model (Table 2 and Table 3, Figure 3). These findings suggest that the photoperiod after the summer solstice plays a key role in determining the timing of leaf senescence in maple and ginkgo trees. This is consistent with the variable importance analysis from the RF, which identified the summer photoperiod as a key factor in predicting leaf senescence timing (Figure 5).

4.2. Model Performance

Linear regression models have the advantage of simplicity and ease of interpretation, as they are expressed in the form of a single equation. These models predict the response variable based on the assumption of linear relationships with predictor variables, but their limited predictive performance often stems from this linearity assumption. The mechanisms determining leaf senescence timing reflect nonlinear responses to environmental variables [8]. Consequently, in this study, linear regression models exhibited relatively large errors in predicting leaf senescence timing under a site-specific modeling approach (Table 3).
Process-based models that integrate multi-site data (multi-site model) performed worse than machine learning and linear regression models. However, independently developed site-specific models significantly outperformed the multi-site model across all datasets and the process-based model types for both ginkgo and maple trees (Figure 4, Table 2 and Table 3). This suggests that site-specific models capture parameters that reflect the local adaptation of tree species, thereby improving model accuracy. Previous studies indicate that plant species have evolved specific physiological and ecological adaptations to their environmental conditions [68]. Even within the same species, trees can exhibit phenotypic plasticity and phenological plasticity, shaped by long-term adaptation to their surrounding environments [16,69,70,71]. Therefore, when building process-based models across large geographic areas, it is essential to account for the unique traits of local populations to improve model accuracy [38,72,73].
Another limitation of process-based models is that most models used for predicting leaf senescence timing only rely on temperature and photoperiod as predictors. These factors are the most dominant in determining the timing of leaf senescence in temperate deciduous broadleaf trees and have been demonstrated to effectively track leaf senescence timing in previous studies [31,32,33,34]. However, it has been revealed that autumn leaf senescence can be influenced by various environmental factors, in addition to temperature and photoperiod, including heat stress [74,75], nutrient limitations [51], and water stress [26] [75]. As a result, the predictive accuracy of process-based models may differ substantially across regions, depending on the frequency of extreme weather events such as droughts, heatwaves, and heavy rainfall [41]. Ideally, before incorporating additional environmental variables into process-based models, experimental studies should first quantify their effects on leaf senescence timing and elucidate the underlying mechanisms [76]. However, this approach remains a considerable challenge. Wolkovich, et al. [77] emphasized that warming experiments often fail to replicate the changes observed in natural systems, resulting in underestimations of plant phenological responses to climate change. Additionally, introducing new parameters is known to increase the risk of overfitting and uncertainty in parameter estimation [78,79].
Machine-learning models are now widely used in various fields of natural sciences, such as geoscience and ecology, to address complex interactions between vegetation and the environment [37,40,41,43]. In this study, the RF and GBDT based on a multi-site approach showed smaller variations in RMSEsite (RMSE calculated for each site) compared to process-based models with the same approach (Figure 4). These findings suggest that the nonlinear, ensemble-based approach of these models enabled them to account for a range of environmental factors affecting leaf senescence timing, as well as the complex ways these factors interact. Moreover, the RF demonstrated strong performance in predicting leaf-coloring timing in ginkgo and maple trees regardless of the modeling approach. The RF effectively captured the impact of key environmental factors, including autumn temperatures and summer photoperiod (Figure 5), achieving a strong correlation, a high model efficiency, and a low RMSE between observations and predictions (Table 2 and Table 3).
Despite their strong performance, machine-learning models have certain limitations. First, these models can overfit, causing substantial discrepancies between the training and validation results (Table 2 and Table 3). Limited or biased data toward specific environmental conditions may reduce predictive accuracy under new environmental conditions [37,43]. To address overfitting and enhance stability, it is necessary to develop extensive datasets that include a diverse range of environmental conditions [37,80]. Second, while machine-learning models provide the importance of key environmental variables, they cannot directly explain the physiological and ecological mechanisms driving leaf senescence. Although variable importance metrics (e.g., permutation importance) can help identify the primary environmental factors influencing leaf senescence timing for each species, they do not provide insights into “how” these factors affect the leaf senescence process [27,37]. Unlike traditional statistical models or process-based models, machine-learning models face challenges in offering the interpretability needed to explain the underlying mechanisms [81].
Given the results we presented and the discussions above, future research should prioritize improving the interpretability of machine-learning models by linking their outputs to specific physiological mechanisms, such as the leaf senescence processes observed in this study. Incorporating additional environmental factors, like photoperiod, temperature, and precipitation, alongside the biological drivers could provide a more comprehensive understanding of the interactions that govern phenology. These refinements would not only enhance the accuracy and applicability of phenology predictions under novel climate scenarios but also guide the development of targeted ecosystem management strategies tailored to specific species and regions.

5. Conclusions

We investigated the effects of environmental factors on leaf senescence timing in ginkgo and maple trees by utilizing a linear regression model, process-based models, and machine-learning models. Our findings revealed that the machine-learning models, particularly random forest, achieved high predictive accuracy in explaining variations in leaf senescence timing, identifying key factors such as autumn minimum or mean temperatures and summer photoperiod. However, these models require careful calibration to mitigate overfitting risks, emphasizing the need for long-term observational datasets that capture diverse environmental conditions. Site-specific process-based models, particularly TP_P incorporating minimum temperature and photoperiod, demonstrated consistent and robust performance, effectively simulating phenological responses across sites while balancing interpretability and predictive power. These results highlight the value of adopting site-specific modeling approaches to account for local adaptations and the phenological plasticity of species across regions. Future research should prioritize improving the interpretability of machine-learning models by linking their outputs to physiological mechanisms, such as senescence-related temperature thresholds or photoperiodic cues, and by integrating additional environmental and biological drivers. This integrative approach could refine phenology predictions, deepen our understanding of species’ responses to climate change, and guide targeted strategies for ecosystem management in a rapidly changing environment.

Author Contributions

Conceptualization, S.K. and H.S.K.; methodology, S.K. and M.M.; validation, M.M.; investigation, S.K.; data curation, S.K.; writing—original draft, S.K.; writing—review & editing, M.M. and H.S.K.; supervision, M.M. and H.S.K. All authors have read and agreed to the published version of the manuscript.

Funding

This work was supported by the National Institute of Forest Science and the Korea Forest Service (Project No. FE0500-2018-02), as well as by the Korea Environment Industry & Technology Institute and Korea Ministry of Environment (Project No. RS-2023-00232066).

Data Availability Statement

The original contributions presented in the study are included in the article, further inquiries can be directed to the corresponding author.

Conflicts of Interest

The authors declare no conflict of interest.

Appendix A

Table A1. Latitude, longitude, elevation, and autumn mean temperature (AMT; mean temperatures from September to November) for the 48 study sites observing leaf senescence timing (LST) of palmate maple (A; Acer spp.) and ginkgo (G; Ginkgo biloba) trees, with the onset of LST (mean ± standard deviation) for them from 16 sites (indicated in bold) continuously monitored through 2020. LSTA: onset of LST for Acer spp., LSTG: onset of LST for Ginkgo biloba.
Site IDSite NameLatitude [°N]Longitude [°E]Elevation [m]AMT [°C]SpeciesLSTALSTG
90Sokcho38.2509128.564717.5314.66A, G
95Cheorwon38.1479127.3042155.4811.63A, G
101Chuncheon37.9026127.735775.8212.59A, Gr
108Seoul37.5714126.965885.6714.72A, G 300   ± 6 297   ± 8
106Donghae37.5071129.124340.4614.72A, G
202Yangpyeong37.4886127.494547.2612.88G
115Ulleungdo37.4813130.8986221.1415.15A, G 291   ± 8 296   ± 7
112Incheon37.4777126.624968.9914.91A, G 301   ± 6 299   ± 5
114Wonju37.3375127.9466150.1113.09A, G
203Icheon37.2640127.484280.0912.87G
119Suwon37.2575126.983039.8114.35A, G 294   ± 5 294   ± 6
121Yeongwol37.1813128.4574240.5412.38A
216Taebaek37.1704128.9893714.4510.25G
221Jecheon37.1593128.1943264.6211.46G
130Uljin36.9918129.412848.9814.84A, G
127Chungju36.9705127.9525114.8512.87A, G
272Yeongju36.8718128.5169211.3212.70A
129Seosan36.7766126.493925.2514.03A, G
232Cheonan36.7622127.292884.7813.38A, G
131Cheongju36.6392127.440758.714.43A, G 294   ± 4 295   ± 5
136Andong36.5729128.7073141.2613.32A, G 291   ± 5 291   ± 4
277Yeongdeok36.5334129.409340.7114.79A, G
226Boeun36.4876127.7342171.3112.26A, G
133Daejeon36.3720127.372167.7914.51A, G 297   ± 8 295   ± 8
235Boryeong36.3272126.55749.9814.95A, G
135Chupungnyeong36.2203127.9946244.9813.02A, G
279Gumi36.1306128.320649.1713.99A, G
138Pohang36.0320129.38003.9416.50A, G 295   ± 6 298   ± 5
140Gunsan36.0053126.761427.8515.18A, G
143Daegu35.8780128.653054.2715.80A, G 298   ± 6 297   ± 5
146Jeonju35.8409127.117260.4415.31A, G 296   ± 5 297   ± 5
284Geochang35.6674127.9099228.4512.89A, G
152Ulsan35.5824129.334781.1416.18A, G 301   ± 5 302   ± 5
285Hapcheon35.5651128.169926.7214.38A, G
245Jeongeup35.5634126.839068.715.02A, G
247Namwon35.4213127.3965133.4913.76A, G
156Gwangju35.1729126.891670.2815.92A, G 301   ± 6 299   ± 6
155Changwon35.1702128.572834.9716.98A, G 304   ± 6 303   ± 7
192Jinju35.1638128.040029.3514.83A, G
159Busan35.1047129.032069.5617.46A, G 306   ± 8 304   ± 7
256Juam35.0750127.239174.6314.04A, G
162Tongyeong34.8454128.435631.2417.10A, G
165Mokpo34.8173126.381544.716.44A, G 302   ± 6 304   ± 7
168Yeosu34.7393127.740665.9317.15A, G 307   ± 7 305   ± 7
261Haenam34.5538126.569116.3615.40A, G
170Wando34.3959126.701835.3716.73A, G
184Jeju33.5141126.529720.7918.38G
189Seogwipo33.2462126.565351.8619.41A, G

References

  1. IPCC. Climate Change 2014: Synthesis Report. Contribution of Working Groups I, II and III to the Fifth Assessment Report of the Intergovernmental Panel on Climate Change; Core Writing Team, Pachauri, R.K., Meyer, L.A., Eds.; IPCC: Geneva, Switzerland, 2014; p. 151. [Google Scholar]
  2. Menzel, A.; Sparks, T.H.; Estrella, N.; Koch, E.; Aasa, A.; Ahas, R.; Alm-Kübler, K.; Bissolli, P.; Braslavská, O.; Briede, A.; et al. European phenological response to climate change matches the warming pattern. Glob. Change Biol. 2006, 12, 1969–1976. [Google Scholar] [CrossRef]
  3. Jeong, S.-J.; Ho, C.-H.; Gim, H.-J.; Brown, M.E. Phenology shifts at start vs. end of growing season in temperate vegetation over the Northern Hemisphere for the period 1982–2008. Glob. Change Biol. 2011, 17, 2385–2399. [Google Scholar] [CrossRef]
  4. Gill, A.L.; Gallinat, A.S.; Sanders-DeMott, R.; Rigden, A.J.; Short Gianotti, D.J.; Mantooth, J.A.; Templer, P.H. Changes in autumn senescence in northern hemisphere deciduous trees: A meta-analysis of autumn phenology studies. Ann. Bot. 2015, 116, 875–888. [Google Scholar] [CrossRef] [PubMed]
  5. Vitasse, Y.; Signarbieux, C.; Fu, Y.H. Global warming leads to more uniform spring phenology across elevations. Proc. Natl. Acad. Sci. USA 2018, 115, 1004–1008. [Google Scholar] [CrossRef] [PubMed]
  6. Shen, M.; Jiang, N.; Peng, D.; Rao, Y.; Huang, Y.; Fu, Y.H.; Yang, W.; Zhu, X.; Cao, R.; Chen, X.; et al. Can changes in autumn phenology facilitate earlier green-up date of northern vegetation? Agric. For. Meteorol. 2020, 291, 108077. [Google Scholar] [CrossRef]
  7. Piao, S.L.; Friedlingstein, P.; Ciais, P.; Viovy, N.; Demarty, J. Growing season extension and its impact on terrestrial carbon cycle in the Northern Hemisphere over the past 2 decades. Glob. Biogeochem. Cycles 2007, 21. [Google Scholar] [CrossRef]
  8. Piao, S.; Liu, Q.; Chen, A.; Janssens, I.A.; Fu, Y.; Dai, J.; Liu, L.; Lian, X.; Shen, M.; Zhu, X. Plant phenology and global climate change: Current progresses and challenges. Glob. Change Biol. 2019, 25, 1922–1940. [Google Scholar] [CrossRef] [PubMed]
  9. Gao, X.; McGregor, I.R.; Gray, J.M.; Friedl, M.A.; Moon, M. Observations of Satellite Land Surface Phenology Indicate That Maximum Leaf Greenness Is More Associated With Global Vegetation Productivity Than Growing Season Length. Glob. Biogeochem. Cycles 2023, 37, e2022GB007462. [Google Scholar] [CrossRef]
  10. Peñuelas, J.; Rutishauser, T.; Filella, I. Phenology Feedbacks on Climate Change. Science 2009, 324, 887–888. [Google Scholar] [CrossRef]
  11. Richardson, A.D.; Keenan, T.F.; Migliavacca, M.; Ryu, Y.; Sonnentag, O.; Toomey, M. Climate change, phenology, and phenological control of vegetation feedbacks to the climate system. Agric. For. Meteorol. 2013, 169, 156–173. [Google Scholar] [CrossRef]
  12. Cook, B.I.; Wolkovich, E.M.; Parmesan, C. Divergent responses to spring and winter warming drive community level flowering trends. Proc. Natl. Acad. Sci. USA 2012, 109, 9000–9005. [Google Scholar] [CrossRef] [PubMed]
  13. Klosterman, S.; Hufkens, K.; Richardson, A.D. Later springs green-up faster: The relation between onset and completion of green-up in deciduous forests of North America. Int. J. Biometeorol. 2018, 62, 1645–1655. [Google Scholar] [CrossRef] [PubMed]
  14. Meng, L.; Zhou, Y.Y.; Li, X.; Asrar, G.R.; Mao, J.F.; Wanamaker, A.D.; Wang, Y.Q. Divergent responses of spring phenology to daytime and nighttime warming. Agric. For. Meteorol. 2020, 281, 107832. [Google Scholar] [CrossRef]
  15. Yang, Y.; Wu, Z.; Guo, L.; He, H.S.; Ling, Y.; Wang, L.; Zong, S.; Na, R.; Du, H.; Li, M.H. Effects of winter chilling vs. spring forcing on the spring phenology of trees in a cold region and a warmer reference region. Sci. Total Environ. 2020, 725, 138323. [Google Scholar] [CrossRef] [PubMed]
  16. Moon, M.; Seyednasrollah, B.; Richardson, A.D.; Friedl, M.A. Using time series of MODIS land surface phenology to model temperature and photoperiod controls on spring greenup in North American deciduous forests. Remote Sens. Environ. 2021, 260, 112466. [Google Scholar] [CrossRef]
  17. Zeng, Z.Q.; Wu, W.X.; Ge, Q.S.; Li, Z.L.; Wang, X.Y.; Zhou, Y.; Zhang, Z.T.; Li, Y.M.; Huang, H.; Liu, G.X.; et al. Legacy effects of spring phenology on vegetation growth under preseason meteorological drought in the Northern Hemisphere. Agric. For. Meteorol. 2021, 310, 108630. [Google Scholar] [CrossRef]
  18. Zhao, H.; Fu, Y.H.; Wang, X.; Zhang, Y.; Liu, Y.; Janssens, I.A. Diverging models introduce large uncertainty in future climate warming impact on spring phenology of temperate deciduous trees. Sci. Total Environ. 2021, 757, 143903. [Google Scholar] [CrossRef] [PubMed]
  19. Kim, S.; Kim, T.K.; Yoon, S.; Jang, K.; Chun, J.-H.; Won, M.; Lim, J.-H.; Kim, H.S. Quantifying the importance of day length in process-based models for the prediction of temperate spring flowering phenology. Sci. Total Environ. 2022, 843, 156780. [Google Scholar] [CrossRef]
  20. Huang, Z.; Zhou, L.; Chi, Y. Spring phenology rather than climate dominates the trends in peak of growing season in the Northern Hemisphere. Glob. Change Biol. 2023, 29, 4543–4555. [Google Scholar] [CrossRef]
  21. Meier, U.; Bleiholder, H.; Buhr, L.; Feller, C.; Hacks, H.; Hess, M.; Lancashire, P.; Schnock, U.; Stauss, R.; Boom, T.v.d.; et al. The BBCH system to coding the phenological growth stages of plants-history and publications. J. Kult. 2009, 61, 41–52. [Google Scholar]
  22. Mayer, A. Phenology and Citizen Science: Volunteers have documented seasonal events for more than a century, and scientific studies are benefiting from the data. Bioscience 2010, 60, 172–175. [Google Scholar] [CrossRef]
  23. Garonna, I.; de Jong, R.; de Wit, A.J.; Mucher, C.A.; Schmid, B.; Schaepman, M.E. Strong contribution of autumn phenology to changes in satellite-derived growing season length estimates across Europe (1982–2011). Glob. Change Biol. 2014, 20, 3457–3470. [Google Scholar] [CrossRef]
  24. Wu, C.Y.; Chen, J.M.; Black, T.A.; Price, D.T.; Kurz, W.A.; Desai, A.R.; Gonsamo, A.; Jassal, R.S.; Gough, C.M.; Bohrer, G.; et al. Interannual variability of net ecosystem productivity in forests is explained by carbon flux phenology in autumn. Glob. Ecol. Biogeogr. 2013, 22, 994–1006. [Google Scholar] [CrossRef]
  25. Norby, R.J.; Hartz-Rubin, J.S.; Verbrugge, M.J. Phenological responses in maple to experimental atmospheric warming and CO2 enrichment. Glob. Change Biol. 2003, 9, 1792–1801. [Google Scholar] [CrossRef]
  26. Xie, Y.Y.; Wang, X.J.; Wilson, A.M.; Silander, J. Predicting autumn phenology: How deciduous tree species respond to weather stressors. Agric. For. Meteorol. 2018, 250, 127–137. [Google Scholar] [CrossRef]
  27. Rodriguez-Galiano, V.F.; Sanchez-Castillo, M.; Dash, J.; Atkinson, P.M.; Ojeda-Zujar, J. Modelling interannual variation in the spring and autumn land surface phenology of the European forest. Biogeosciences 2016, 13, 3305–3317. [Google Scholar] [CrossRef]
  28. Wu, C.; Wang, X.; Wang, H.; Ciais, P.; Peñuelas, J.; Myneni, R.B.; Desai, A.R.; Gough, C.M.; Gonsamo, A.; Black, A.T.; et al. Contrasting responses of autumn-leaf senescence to daytime and night-time warming. Nat. Clim. Change 2018, 8, 1092–1096. [Google Scholar] [CrossRef]
  29. Zhu, G.; Wang, X.; Xiao, J.; Zhang, K.; Wang, Y.; He, H.; Li, W.; Chen, H. Daytime and nighttime warming has no opposite effects on vegetation phenology and productivity in the northern hemisphere. Sci Total Environ 2022, 822, 153386. [Google Scholar] [CrossRef] [PubMed]
  30. Kloos, S.; Klosterhalfen, A.; Knohl, A.; Menzel, A. Decoding autumn phenology: Unraveling the link between observation methods and detected environmental cues. Glob. Change Biol. 2024, 30, e17231. [Google Scholar] [CrossRef] [PubMed]
  31. Jeong, S.-J.; Medvigy, D. Macroscale prediction of autumn leaf coloration throughout the continental United States. Glob. Ecol. Biogeogr. 2014, 23, 1245–1254. [Google Scholar] [CrossRef]
  32. Lang, W.; Chen, X.; Qian, S.; Schwartz, M.D. Temperature variations impacting leaf senescence initiation pathways alter leaf fall timing patterns in northern deciduous forests. Sci. Total Environ. 2024, 934, 173280. [Google Scholar] [CrossRef]
  33. Lang, W.G.; Chen, X.Q.; Qian, S.W.; Liu, G.H.; Piao, S.L. A new process-based model for predicting autumn phenology: How is leaf senescence controlled by photoperiod and temperature coupling? Agric. For. Meteorol. 2019, 268, 124–135. [Google Scholar] [CrossRef]
  34. Liu, G.H.; Chen, X.Q.; Fu, Y.S.; Delpierre, N. Modelling leaf coloration dates over temperate China by considering effects of leafy season climate. Ecol. Model. 2019, 394, 34–43. [Google Scholar] [CrossRef]
  35. Luedeling, E.; Schiffers, K.; Fohrmann, T.; Urbach, C. PhenoFlex- an integrated model to predict spring phenology in temperate fruit trees. Agric. For. Meteorol. 2021, 307, 108491. [Google Scholar] [CrossRef]
  36. Lee, S.; Jeong, S.; Park, C.E.; Kim, J. A Simple Method of Predicting Autumn Leaf Coloring Date Using Machine Learning with Spring Leaf Unfolding Date. Asia-Pac. J. Atmos. Sci. 2022, 58, 219–226. [Google Scholar] [CrossRef]
  37. Gao, C.; Wang, H.; Ge, Q. Interpretable machine learning algorithms to predict leaf senescence date of deciduous trees. Agric. For. Meteorol. 2023, 340, 109623. [Google Scholar] [CrossRef]
  38. Basler, D. Evaluating phenological models for the prediction of leaf-out dates in six temperate tree species across central Europe. Agric. For. Meteorol. 2016, 217, 10–21. [Google Scholar] [CrossRef]
  39. Thessen, A.E. Adoption of Machine Learning Techniques in Ecology and Earth Science. One Ecosyst. 2016, 1, e8621. [Google Scholar] [CrossRef]
  40. Reichstein, M.; Camps-Valls, G.; Stevens, B.; Jung, M.; Denzler, J.; Carvalhais, N.; Prabhat. Deep learning and process understanding for data-driven Earth system science. Nature 2019, 566, 195–204. [Google Scholar] [CrossRef] [PubMed]
  41. Fu, Y.; Li, X.; Zhou, X.; Geng, X.; Guo, Y.; Zhang, Y. Progress in plant phenology modeling under global climate change. Sci. China Earth Sci. 2020, 63, 1237–1247. [Google Scholar] [CrossRef]
  42. Bogawski, P.; Grewling, L.; Jackowiak, B. Predicting the onset of Betula pendula flowering in Poznan (Poland) using remote sensing thermal data. Sci. Total Environ. 2019, 658, 1485–1499. [Google Scholar] [CrossRef]
  43. Dai, W.; Jin, H.; Zhang, Y.; Liu, T.; Zhou, Z. Detecting temporal changes in the temperature sensitivity of spring phenology with global warming: Application of machine learning in phenological model. Agric. For. Meteorol. 2019, 279, 107702. [Google Scholar] [CrossRef]
  44. Korea Meteorological Administration. Guidelines for Phenological and Seasonal Phenomena Observations. 2016. Available online: https://data.kma.go.kr/data/publication/publicationGlList.do?pgmNo=681 (accessed on 28 December 2024).
  45. Keskitalo, J.; Bergquist, G.; Gardestrom, P.; Jansson, S. A Cellular Timetable of Autumn Senescence. Plant Physiol. 2005, 139, 1635–1648. [Google Scholar] [CrossRef]
  46. Hanninen, H.; Tanino, K. Tree seasonality in a warming climate. Trends Plant Sci. 2011, 16, 412–416. [Google Scholar] [CrossRef] [PubMed]
  47. Way, D.A.; Montgomery, R.A. Photoperiod constraints on tree phenology, performance and migration in a warming world. Plant Cell Environ. 2015, 38, 1725–1736. [Google Scholar] [CrossRef]
  48. Peano, D.; Hemming, D.; Materia, S.; Delire, C.; Fan, Y.; Joetzjer, E.; Lee, H.; Nabel, J.E.M.S.; Park, T.; Peylin, P.; et al. Plant phenology evaluation of CRESCENDO land surface models– Part 1: Start and end of the growing season. Biogeosciences 2021, 18, 2405–2428. [Google Scholar] [CrossRef]
  49. Moon, M.; Richardson, A.D.; O’Keefe, J.; Friedl, M.A. Senescence in temperate broadleaf trees exhibits species-specific dependence on photoperiod versus thermal forcing. Agric. For. Meteorol. 2022, 322, 109026. [Google Scholar] [CrossRef]
  50. Peng, J.; Wu, C.; Zhang, X.; Wang, X.; Gonsamo, A. Satellite detection of cumulative and lagged effects of drought on autumn leaf senescence over the Northern Hemisphere. Glob. Change Biol. 2019, 25, 2174–2188. [Google Scholar] [CrossRef]
  51. Fu, Y.H.; Piao, S.; Delpierre, N.; Hao, F.; Hänninen, H.; Geng, X.; Peñuelas, J.; Zhang, X.; Janssens, I.A.; Campioli, M. Nutrient availability alters the correlation between spring leaf-out and autumn leaf senescence dates. Tree Physiol. 2019, 39, 1277–1284. [Google Scholar] [CrossRef] [PubMed]
  52. Liu, Q.; Fu, Y.H.; Zeng, Z.; Huang, M.; Li, X.; Piao, S. Temperature, precipitation, and insolation effects on autumn vegetation phenology in temperate China. Glob. Change Biol. 2016, 22, 644–655. [Google Scholar] [CrossRef] [PubMed]
  53. Lu, X.; Keenan, T.F. No evidence for a negative effect of growing season photosynthesis on leaf senescence timing. Glob. Change Biol. 2022, 28, 3083–3093. [Google Scholar] [CrossRef]
  54. Keenan, T.F.; Richardson, A.D. The timing of autumn senescence is affected by the timing of spring phenology: Implications for predictive models. Glob. Change Biol. 2015, 21, 2634–2641. [Google Scholar] [CrossRef] [PubMed]
  55. Zani, D.; Crowther, T.W.; Mo, L.; Renner, S.S.; Zohner, C.M. Increased growing-season productivity drives earlier autumn leaf senescence in temperate trees. Science 2020, 370, 1066–1071. [Google Scholar] [CrossRef]
  56. Forsythe, W.C.; Rykiel, E.J., Jr.; Stahl, R.S.; Wu, H.-I.; Schoolfield, R.M.J.E.M. A model comparison for daylength as a function of latitude and day of year. Ecol. Model. 1995, 80, 87–95. [Google Scholar] [CrossRef]
  57. Dufrêne, E.; Davi, H.; François, C.; Maire, G.l.; Dantec, V.L.; Granier, A. Modelling carbon and water cycles in a beech forest: Part I: Model description and uncertainty analysis on modelled NEE. Ecol. Model. 2005, 185, 407–436. [Google Scholar] [CrossRef]
  58. Park, C.-K.; Ho, C.-H.; Jeong, S.-J.; Lee, E.J.; Kim, J.J.P.o. Spatial and temporal changes in leaf coloring date of Acer palmatum and Ginkgo biloba in response to temperature increases in South Korea. PLoS ONE 2017, 12, e0174390. [Google Scholar] [CrossRef] [PubMed]
  59. Mason, C.H.; Perreault, W.D. Collinearity, Power, and Interpretation of Multiple Regression Analysis. J. Mark. Res. 1991, 28, 268–280. [Google Scholar] [CrossRef]
  60. Chan, J.Y.-L.; Leow, S.M.H.; Bea, K.T.; Cheng, W.K.; Phoong, S.W.; Hong, Z.-W.; Chen, Y.-L. Mitigating the Multicollinearity Problem and Its Machine Learning Approach: A Review. Mathematics 2022, 10, 1283. [Google Scholar] [CrossRef]
  61. Chowdhury, S.; Lin, Y.; Liaw, B.; Kerby, L. Evaluation of tree based regression over multiple linear regression for non-normally distributed data in battery performance. In Proceedings of the 2022 International Conference on Intelligent Data Science Technologies and Applications (IDSTA), San Antonio, TX, USA, 5–7 September 2022; pp. 17–25. [Google Scholar]
  62. Ge, Q.; Wang, H.; Rutishauser, T.; Dai, J. Phenological response to climate change in China: A meta-analysis. Glob. Change Biol. 2015, 21, 265–274. [Google Scholar] [CrossRef] [PubMed]
  63. Liu, Q.; Fu, Y.H.; Zhu, Z.; Liu, Y.; Liu, Z.; Huang, M.; Janssens, I.A.; Piao, S. Delayed autumn phenology in the Northern Hemisphere is related to change in both climate and spring phenology. Glob. Change Biol. 2016, 22, 3702–3711. [Google Scholar] [CrossRef] [PubMed]
  64. Laube, J.; Sparks, T.H.; Estrella, N.; Hofler, J.; Ankerst, D.P.; Menzel, A. Chilling outweighs photoperiod in preventing precocious spring development. Glob. Change Biol. 2014, 20, 170–182. [Google Scholar] [CrossRef] [PubMed]
  65. Zhang, X.Y. Reconstruction of a complete global time series of daily vegetation index trajectory from long-term AVHRR data. Remote Sens. Environ. 2015, 156, 457–472. [Google Scholar] [CrossRef]
  66. Basler, D.; Körner, C. Photoperiod sensitivity of bud burst in 14 temperate forest tree species. Agric. For. Meteorol. 2012, 165, 73–81. [Google Scholar] [CrossRef]
  67. Korner, C.; Basler, D. Plant science. Phenology under global warming. Science 2010, 327, 1461–1462. [Google Scholar] [CrossRef] [PubMed]
  68. Caffarra, A.; Donnelly, A. The ecological significance of phenology in four different tree species: Effects of light and temperature on bud burst. Int. J. Biometeorol. 2011, 55, 711–721. [Google Scholar] [CrossRef] [PubMed]
  69. Tanino, K.K.; Kalcsits, L.; Silim, S.; Kendall, E.; Gray, G.R. Temperature-driven plasticity in growth cessation and dormancy development in deciduous woody plants: A working hypothesis suggesting how molecular and cellular function is affected by temperature during dormancy induction. Plant Mol. Biol. 2010, 73, 49–65. [Google Scholar] [CrossRef]
  70. Duputié, A.; Rutschmann, A.; Ronce, O.; Chuine, I.J.G.c.b. Phenological plasticity will not help all species adapt to climate change. Glob. Change Biol. 2015, 21, 3062–3073. [Google Scholar] [CrossRef] [PubMed]
  71. Wu, Z.F.; Lin, C.F.; Wang, S.X.; Gong, Y.F.; Zhao, Y.P.; Tang, J.; De Boeck, H.J.; Vitasse, Y.; Fu, Y.S. The sensitivity of ginkgo leaf unfolding to the temperature and photoperiod decreases with increasing elevation. Agric. For. Meteorol. 2022, 315, 108840. [Google Scholar] [CrossRef]
  72. Caffarra, A.; Eccel, E. Increasing the robustness of phenological models for Vitis vinifera cv. Chardonnay. Int. J. Biometeorol. 2010, 54, 255–267. [Google Scholar] [CrossRef] [PubMed]
  73. Pereira, M.R.; Ribeiro, H.; Abreu, I.; Eiras-Dias, J.; Mota, T.; Cunha, M. Predicting the flowering date of Portuguese grapevine varieties using temperature-based phenological models: A multi-site approach. J. Agric. Sci. 2018, 156, 865–876. [Google Scholar] [CrossRef]
  74. Liu, G.; Chen, X.; Zhang, Q.; Lang, W.; Delpierre, N. Antagonistic effects of growing season and autumn temperatures on the timing of leaf coloration in winter deciduous trees. Glob. Change Biol. 2018, 24, 3537–3545. [Google Scholar] [CrossRef] [PubMed]
  75. Bigler, C.; Vitasse, Y. Premature leaf discoloration of European deciduous trees is caused by drought and heat in late spring and cold spells in early fall. Agric. For. Meteorol. 2021, 307, 108492. [Google Scholar] [CrossRef]
  76. Hanninen, H.; Kramer, K.; Tanino, K.; Zhang, R.; Wu, J.; Fu, Y.H. Experiments are necessary in process-based tree phenology modelling. Trends Plant Sci. 2019, 24, 199–209. [Google Scholar] [CrossRef] [PubMed]
  77. Wolkovich, E.M.; Cook, B.I.; Allen, J.M.; Crimmins, T.M.; Betancourt, J.L.; Travers, S.E.; Pau, S.; Regetz, J.; Davies, T.J.; Kraft, N.J.; et al. Warming experiments underpredict plant phenological responses to climate change. Nature 2012, 485, 494–497. [Google Scholar] [CrossRef] [PubMed]
  78. Olsson, C.; Jönsson, A.M. Process-based models not always better than empirical models for simulating budburst of Norway spruce and birch in Europe. Glob. Change Biol. 2014, 20, 3492–3507. [Google Scholar] [CrossRef]
  79. Gao, X.; Richardson, A.D.; Friedl, M.A.; Moon, M.; Gray, J.M. Thermal forcing versus chilling? Misspecification of temperature controls in spring phenology models. Glob. Ecol. Biogeogr. 2024, 33, e13932. [Google Scholar] [CrossRef]
  80. Czernecki, B.; Nowosad, J.; Jabłońska, K. Machine learning modeling of plant phenology based on coupling satellite and gridded meteorological dataset. Int. J. Biometeorol. 2018, 62, 1297–1309. [Google Scholar] [CrossRef]
  81. Freiesleben, T.; König, G.; Molnar, C.; Tejero-Cantero, Á. Scientific Inference with Interpretable Machine Learning: Analyzing Models to Learn About Real-World Phenomena. Minds Mach. 2024, 34, 32. [Google Scholar] [CrossRef]
Figure 1. Observation site locations. The map illustrates 48 sites where autumn phenological events of palmate maple (Acer spp.) and ginkgo (Ginkgo biloba) trees were observed. Data from 16 sites (marked with red-outlined circles), which have been continuously monitored from 1989 to 2020, were used for a Mann–Kendall trend analysis to assess changes in the timing of autumn leaf senescence.
Forests 16 00174 g001
Figure 2. (a) Changes in the mean autumn leaf senescence timing [ d a y s   y e a r 1 ] for palmate maple (Acer; Acer spp.) and ginkgo (Ginkgo; Ginkgo biloba) trees over all sites from 1989 to 2020, (b) inter-site variation in leaf senescence timing [ d a y s   y e a r 1 ], (c) changes in the autumn temperatures [°C y e a r 1 ] over all sites from 1989 to 2020, and (d) inter-site variation in autumn temperatures [°C y e a r 1 ]. Inter-site variation indicates the standard deviation among all sites, and the p-values represent the statistical significance of the trends, as determined by the Mann–Kendall test. LS: leaf senescence timing, AT: autumn temperatures (mean values of T_max, T_avg, and T_min from September to November), DOY: day of year, T_max: daily maximum temperature, T_avg: daily average temperature, T_min: daily minimum temperature.
Forests 16 00174 g002
Figure 3. Rate of change in leaf senescence timing [ d a y s   y e a r 1 ] for (a) palmate maple (Acer spp.) and (b) ginkgo (Ginkgo biloba) trees at each site from 1989 to 2020. The color of the points represents the average onset date of leaf coloring over the study period at each site [ d a y   o f   y e a r ], and larger points indicate a statistically significant trend, as determined by the Mann–Kendall test ( p < 0.05 ).
Forests 16 00174 g003
Figure 4. Box plots showing the distribution of RMSE calculated for each site (RMSEsite) for (a) palmate maple (Acer spp.) and (b) ginkgo (Ginkgo biloba) trees, grouped by modeling approach (multi-site: blue boxes, site-specific: red boxes) and model type (GBDT, RF, LR, TP_P, TP_T, CDD_P, CDD_T). Each panel presents results for the training set (left) and validation set (right). Different letters and bold-outlined boxes indicate significant differences in RMSEsite among model types and between modeling approaches, respectively (p < 0.05). Letter colors denote the modeling approach (blue: multi-site, red: site-specific), and the absence of letters indicates no significant differences.
Forests 16 00174 g004
Figure 5. Permutation importance of predictors for leaf senescence timing in (a) palmate maple (Acer spp.) and (b) ginkgo (Ginkgo biloba) trees based on a random forest model constructed by integrating all sites.
Forests 16 00174 g005
Figure 6. Rate of change in autumn temperatures at each site [°C y e a r 1 ] during (a) 1989–2010 and (b) 2011–2020. Rate of change in leaf senescence timing [ d a y s   y e a r 1 ] for palmate maple (Acer; Acer spp.) and ginkgo (Ginkgo; Ginkgo biloba) at each site [ d a y s   y e a r 1 ] during (c) 1989–2010 and (d) 2011–2020, plotted against the average timing of leaf senescence at each site. Autumn temperatures (AT) represent the mean values of T_avg and T_min from September to November), and leaf senescence (LS) timing represents the onset date of leaf coloring. T_avg: daily mean temperature, T_min: daily minimum temperature.
Forests 16 00174 g006
Table 1. Parameter, initiating conditions for leaf senescence, and daily leaf senescence rate in four process-based models (CDD_T, CDD_P, TP_T, TP_P).
ModelParameterInitiation ConditionDaily Leaf Senescence Rate
CDD_T T B ,   S * s e n T m i < T B m a x T B T m i , 0
CDD_P T B ,   P s t a r t ,   S * s e n P i < P s t a r t
TP_T T B ,   S * s e n ,   a ,   b T n i < T B   1 1 + e a × T n i × P i b ,     i t 1 0                   ,                 i < t 1
TP_P P s t a r t ,   S * s e n ,   a ,   b P i < P s t a r t
t 1 : start date of the leaf senescence, T m i : mean temperature in a day i , T n i : minimum temperature in a day i , P i : photoperiod in a day i , T B : temperature threshold, P s t a r t : photoperiod threshold, a and b: parameters controlling the rate of leaf senescence.
Table 2. Performance of models using a multi-site approach, including machine-learning models (GBDT, RF), a linear regression model (LR), and process-based models (TP_P, TP_T, CDD_P, CDD_T), for predicting leaf senescence timing in (a) palmate maple (Acer spp.) and (b) ginkgo (Ginkgo biloba) trees. RMSE: root mean square error; NSE: Nash–Sutcliffe efficiency; r: Pearson correlation coefficient.
(a)
ModelTraining PerformanceValidation Performance
RMSENSErRMSENSEr
GBDT2.040.940.985.900.510.72
RF2.670.900.965.900.500.71
LR5.960.490.706.380.420.65
TP_P7.300.230.557.210.260.58
TP_T8.260.020.588.56−0.040.57
CDD_P6.750.340.616.860.330.60
CDD_T7.350.220.617.780.140.59
(b)
ModelTraining PerformanceValidation Performance
RMSENSErRMSENSEr
GBDT2.230.930.975.620.540.74
RF3.000.880.955.450.570.75
LR6.070.510.715.800.510.72
TP_P6.910.360.656.630.360.67
TP_T7.450.250.667.000.290.70
CDD_P6.480.440.676.140.450.70
CDD_T7.340.280.687.270.230.69
Table 3. Performances of models using a site-specific approach, including machine-learning models (GBDT, RF), a linear regression model (LR), and process-based models (TP_P, TP_T, CDD_P, CDD_T), for predicting leaf senescence timing in (a) palmate maple (Acer spp.) and (b) ginkgo (Ginkgo biloba) trees. RMSE: root mean square error; NSE: Nash–Sutcliffe efficiency; r: Pearson correlation coefficient.
(a)
ModelTraining PerformanceValidation Performance
RMSENSErRMSENSEr
GBDT2.430.920.965.900.500.72
RF3.310.840.935.360.590.77
LR6.530.380.626.930.320.57
TP_P5.380.580.765.480.570.76
TP_T5.720.530.746.180.460.70
CDD_P5.500.560.755.760.530.73
CDD_T6.000.480.716.180.460.69
(b)
ModelTraining PerformanceValidation Performance
RMSENSErRMSENSEr
GBDT2.570.910.965.730.520.74
RF3.330.850.945.370.580.76
LR6.280.470.696.000.480.69
TP_P5.400.610.785.270.600.77
TP_T5.690.570.765.920.490.73
CDD_P5.570.580.765.500.560.75
CDD_T6.040.510.736.100.460.71
Disclaimer/Publisher’s Note: The statements, opinions and data contained in all publications are solely those of the individual author(s) and contributor(s) and not of MDPI and/or the editor(s). MDPI and/or the editor(s) disclaim responsibility for any injury to people or property resulting from any ideas, methods, instructions or products referred to in the content.

