Article

Vegetation Health in China Is Severely Compromised by Drought, Wet and Heat Stress Events

1
College of Geography and Remote Sensing Sciences, Xinjiang University, Urumqi 830046, China
2
Xinjiang Key Laboratory of Oasis Ecology, Xinjiang University, Urumqi 830046, China
3
Xinjiang Grassland General Station, Urumqi 830046, China
*
Author to whom correspondence should be addressed.
Forests 2025, 16(1), 38; https://doi.org/10.3390/f16010038
Submission received: 18 November 2024 / Revised: 23 December 2024 / Accepted: 27 December 2024 / Published: 28 December 2024
(This article belongs to the Section Forest Ecophysiology and Biology)

Abstract

:
Stress events induced by global warming pose severe threats to vegetation health. Assessing the impact of these stress events on the health and growth of vegetation ecosystems in China is crucial. This study constructed three vegetation health assessment systems and selected the one that most effectively reflects vegetation health. By identifying the characteristics of stress events, and employing trend analysis, sensitivity analysis, anomaly change analysis, and modified residual analysis, this study explores the dynamic changes in vegetation health and their responses to stress events across China from 2001 to 2020. The results indicate that the Pressure–State–Response (PSR) model has the best evaluation performance, achieving the highest fit to Solar-Induced Chlorophyll Fluorescence (SIF) with an goodness of fit (R2) of up to 0.74. Overall, vegetation health exhibits more negative anomalies than positive ones and shows the strongest positive sensitivity to Cumulative Precipitation Anomaly (CPA) and the strongest negative sensitivity to Cumulative Heat (CH). Among different vegetation types, alpine vegetation has the highest stability in health, while meadows and grasslands are the most sensitive to stress events. Additionally, stress events have a greater contribution rate to vegetation health than other events. Our findings will provide important data for climate change adaptation policies and extreme environmental early warning while also contributing to the formulation of policies aimed at improving vegetation health. These results are of significant importance for enhancing carbon sequestration capacity, refining carbon market policies, and promoting the sustainable development of ecosystems.

1. Introduction

The Vegetation Health Index, recognized as an effective indicator for evaluating vegetation health [1], is crucial for regulating interactions between terrestrial ecosystems and the atmosphere [2]. However, ongoing global warming, along with increasing frequency of extreme precipitation and drought events [3,4], has had widespread negative impacts on vegetation health within ecosystems [5,6]. Among these extreme events, vegetation health is significantly impacted by drought stress, wet stress, and heat stress (hereafter referred to collectively as stress events), which in turn have important impacts on the energy balance, water cycle, and biogeochemical cycles of ecosystems. Therefore, comprehensively assessing the impact of stress events on vegetation health is crucial for the stable and healthy development of ecosystems in the face of climate change.
Stress events impact vegetation health through carbon storage, water cycling, and changes in biodiversity, while temperature and moisture are key factors influencing vegetation growth [7,8]. Amidst the continuous breaking of global temperature records, the carbon sequestration capacity of vegetation has markedly declined, particularly compromising the health of crops and natural vegetation [9]. Heat stress inhibits plant growth by exacerbating water stress in plants [10,11]. The 2003 European heatwave led to a 30% decline in total primary productivity of vegetation [12], and the 2018 slowdown in the growth rate of forests and grasslands in China also serves as evidence [13]. Accompanying heat stress, the most pronounced is drought stress. Drought, one of the most widespread and common natural disasters in China [14], is characterized by an imbalance between water supply and demand and has significant ecological and socioeconomic consequences. Drought stress reduces soil moisture and limits plant water use efficiency, thereby greatly reducing photosynthetic efficiency and plant productivity [15,16]. This accelerates ecosystem degradation and leads to a sharp decline in biodiversity [17,18]. Drought stress typically accompanies heat stress [19], while heat stress events increase the probability of precipitation [20]. Wet stress, or excessive rainfall, leads to insufficient soil oxygen, inhibiting root respiration and nutrient absorption, thereby affecting plant growth and health [21]. Under the influence of global warming, extreme precipitation events have exacerbated the vulnerability of ecosystems in areas prone to soil erosion, such as the Loess Plateau, while benefiting vegetation growth in coastal regions [22]. For instance, wet stress during the rainy season in southeast China has increased vegetation cover by 5% to 10% [23]. Different ecosystems exhibit significant variations in their responses to these climate stress events, with certain ecosystems, such as temperate grasslands and warm temperate deciduous broadleaf forests, showing higher sensitivity to these events [24]. Previous studies have primarily focused on the impacts of drought and heat stress on vegetation, while specific investigations into wet stress remain limited. Wet stress, as an important climatic stress, has been significantly underestimated in its effects on vegetation health. Moreover, prior research lacks a robust verification of optimal model selection. Additionally, the contributions of stress events to vegetation health have seldom been quantitatively assessed. This study incorporates wet stress alongside drought and heat stress to comprehensively explore the impacts of stress events on vegetation health and employs residual analysis to quantify the contributions of stress events to vegetation health. In general, these studies provide a comprehensive assessment of the impact of long-term climate change on vegetation growth, which is primarily based on one or several vegetation growth indicators to explore the effects of climate on vegetation growth. However, vegetation growth results from a complex interaction of internal and external environmental factors, and relying on a single vegetation index or related indicator remains insufficient for assessing whether vegetation is growing healthily. Therefore, a comprehensive health evaluation system is needed to more thoroughly investigate vegetation health. Additionally, different vegetation types exhibit varying levels of resistance and resilience to drought stress, wet stress, and heat stress events [25], making it crucial to urgently assess the impact of these stress events on vegetation health.
China, located in East Asia and bordering the Pacific Ocean, boasts a rich diversity of vegetation types. The country has demonstrated strong leadership and commitment to global ecosystem stability by addressing climate change, reducing carbon emissions, and developing green energy. According to the “14th Five-Year Plan for Forestry and Grassland Protection and Development”, China aims to achieve a forest coverage rate of 24.1%, a forest stock volume of 19 billion cubic meters, and an overall grassland vegetation coverage of 57% by 2025 [26]. The interwoven distribution of various vegetation types plays a crucial role in maintaining the stability of China’s ecosystems. However, existing studies on vegetation health primarily focus on small regional scales and evaluate the impact on ecosystem health using average temperature and precipitation with relatively simplistic models [27,28]; simultaneously, research on the health of various types of vegetation across China still needs improvement.
This study employs the Comprehensive Index Method (CIM), the Technique for Order of Preference by Similarity to Ideal Solution (TOPSIS), and the Pressure–State–Response (PSR) model to construct three vegetation health assessment systems. We selected three vegetation indicators—Leaf Area Index (LAI), Net Primary Productivity (NPP), and Solar-Induced Chlorophyll Fluorescence (SIF)—to validate the effectiveness of these systems. A comprehensive assessment of vegetation health impacted by drought stress, wet stress, and heat stress from 2000 to 2020 was conducted to address the following questions: (1) What are the patterns of vegetation health changes from 2000 to 2020, and which assessment system most effectively represents vegetation health? (2) How does China’s vegetation health respond to stress events? (3) What is the contribution of stress events to vegetation health, and which type of stress event will have a significant impact on future vegetation health predictions? This study provides insights into the response mechanisms of vegetation health to climate change in China, which may facilitate the formulation of rational management strategies and promote the sustainable development of vegetation ecosystems.

2. Materials and Methods

2.1. Study Area

China is located in East Asia and features a complex and variable geographical environment. From the coastal plains in the east to the mountains and plateaus in the west, China’s land area reaches 9.6 million square kilometers. Most of China’s terrain consists of mountains, plateaus, and hills with plains and basins comprising about one third of the total land area (Figure 1a). China’s complex terrain, including plains, plateaus, and basins, creates varied environmental conditions for vegetation distribution and ecosystem diversity. This study delineates nine subregions based on vegetation distribution characteristics: R1–R9 represent the Northeast Plain, Yunnan–Guizhou Plateau, Northern Arid and Semi-Arid Region, South China, Sichuan Basin and surrounding areas, Middle and Lower Yangtze River Region, Qinghai–Tibet Plateau, Loess Plateau, and Huang–Huai–Hai Plain (Figure 1b). For example, the Northeast Plain Region (R1) and the Huang–Huai–Hai Plain Region (R9) represent typical plain ecosystems, which are ideal for studies on temperate grassland and farmland vegetation. The Qinghai–Tibet Plateau (R7) exemplifies alpine meadows and scrub vegetation in high-altitude environments, while the Sichuan Basin and its surrounding areas (R6) demonstrate basin ecosystems under a humid subtropical climate. Across different climatic zones, these subregions range from arid and semi-arid areas (R2) to humid regions (R4, R5, R6), reflecting a vegetation gradient from deserts to forests. Driven by climate, the interaction between various vegetation types and climate change has shaped China’s vast and diverse landscape. The differences in temperature and precipitation are key factors in shaping the vegetation growth environments between the north and south. The southern regions, with abundant annual rainfall, offer favorable conditions for vegetation growth, resulting in relatively stable ecological environments. In contrast, the northern regions face harsh climatic conditions where, except for high-altitude mountainous areas, the insufficient water uptake by vegetation roots cannot support the growth of canopy branches and leaves, resulting in shorter plants predominantly consisting of meadows, grasslands, and shrubs. Using a 1:1,000,000 scale digital vegetation type map of China, this study evaluates the changes in different vegetation health under stress events (Figure 1c).

2.2. Data

The data used in this study include climate data (temperature, precipitation, PDSI, PM2.5, maximum temperature, etc.), soil attributes (TN, TP, SOM), socioeconomic data (GDP, tertiary industry value added, population density, nighttime lights), vegetation type data, and vegetation-related indices (GPP, NDVI, LAI, NPP, etc.). Meteorological data were used to construct the vegetation health assessment system and identify stress events, while soil attributes, socioeconomic data, and some vegetation indices were utilized to develop the vegetation health system. The LAI, NPP, and SIF data were employed to validate the model’s performance and accuracy (Table 1). We determined the performance of the vegetation health system using goodness of fit ( R 2 ) and Pearson correlation coefficients. The vegetation type data at a 1:1,000,000 scale was masked to retain only vegetation areas.
To ensure the spatial resolution consistency of vegetation health data across China, bilinear interpolation was applied to resample all data to a resolution of 0.1° × 0.1°. This technique estimates the value for a specific location by utilizing the four nearest data points surrounding it. It applies the principle of two-dimensional linear interpolation, deriving an interpolated value to approximate the value at the designated point [29].

2.3. Methods

2.3.1. Construction of the Vegetation Health Assessment System

The Comprehensive Index Method (CIM) combines the importance of various indicators through weighted aggregation to derive a composite index, which is used to evaluate the advantages and disadvantages between different schemes or objects [30]. The selection of evaluation indicators is based on physical, chemical, and other influencing factors that affect vegetation growth, including meteorological indicators, soil texture indicators, socioeconomic indicators, and vegetation growth outcome indicators. The weights for these indicators are provided in Table S1.
C I M = i = 1 n w i × x i
where x i represents the standardized value of the i t h indicator, and w i represents weight.
The Technique for Order of Preference by Similarity to Ideal Solution (TOPSIS) is a commonly used method for multi-criteria decision-making problems. It determines the ranking of various schemes by calculating their similarity to the ideal solution and the negative ideal solution [31]. Here, we interpret vegetation health solely based on the composite score. Assuming there are n evaluation objects and m attributes, the original decision matrix X can be represented as
X = x 11 x 12 x 21 x 22                       x 1 m x 2 m x n 1 x n 2 x n m
The standardized matrix R , R with elements r i j , is calculated as follows:
r i j = x i j k = 1 n x k j 2
where x i j represents the value of the i t h evaluation object with respect to the j t h attribute. Multiplying the weights of the attributes by the standardized decision matrix R , each element in R is weighted to obtain the weighted standardized matrix V :
v i j = w j r i j
where w j is the weight of the j t h attribute and r i j is the standardized value of the i t h evaluation object with respect to the j t h attribute.
The ideal solution A + is the set of the best values for each attribute, and the negative ideal solution A is the set of the worst values for each attribute:
A + = max i v i j j J
A = min i v i j j J
where J represents the set of all attributes.
The Euclidean distance from each alternative i to the ideal solution A + and the negative ideal solution A is calculated as follows:
S i + = j = 1 m ( v i j A j + ) 2
S i = j = 1 m ( v i j A j ) 2
Finally, the relative closeness C i of each alternative i is calculated as the ratio of the distance to the negative ideal solution to the sum of the distances to both the ideal and negative ideal solutions:
C i = S i + S i + + S i
The closer C i is to 1, the nearer an alternative is to the ideal solution, indicating greater optimality.
The Pressure–State–Response (PSR) model is a commonly used method for environmental assessment, dividing environmental issues into three components: Pressure, State, and Response [32], with detailed information on the indicators provided in Table 2 and Table S2. The PSR model evaluates vegetation health comprehensively and systematically through a hierarchical framework. It categorizes environmental issues into three main levels—Pressure, State, and Response—and meticulously classifies and assigns indicators within each level. At each level, the model selects appropriate indicators to reflect specific environmental factors and ecological conditions. By independently assessing the indicators at each level, the PSR model calculates indices for each sublevel and ultimately integrates these sublevel indices into a comprehensive VHI. This step-by-step structure allows the PSR model to account for multiple factors while maintaining logical consistency and scientific rigor. At the Pressure level, the model identifies and quantifies external factors that influence vegetation health. At the State level, it focuses on the actual health status of vegetation, while at the Response level, it considers vegetation’s reaction to changes in pressure. Through this process from individual indicator selection to hierarchical construction and overall assessment, the PSR model provides a comprehensive and detailed evaluation framework for vegetation health.
V H I n = ( 1 P n ) × S n × R n 3
where P n , S n and R n represent the Pressure, State, and Response layers, respectively.
P n ( S n , R n ) = i = 1 n w i × x i
where x i and w i are the same as in (1).

2.3.2. Model Effectiveness Verification

Based on the differences in the results calculated using the CIM, TOPSIS, and PSR methods, we evaluated the effectiveness of the models and identified the optimal model for further analysis of vegetation health responses and feedback to stress events. The Leaf Area Index (LAI), Net Primary Productivity (NPP), and Solar-Induced Chlorophyll Fluorescence (SIF) are selected as validation indicators for vegetation health. Their scientific basis and advantages are reflected in their ecological significance, measurability, and comparison with other potential indicators. In our model selection process, the vegetation types chosen include Mixed Coniferous and Broadleaf Forest (MCBF), Coniferous Forest (CF), Thicket (TK), Broadleaf Forest (BF), Shrubland (SL), Cultivated Vegetation (CV), Meadow (MD), Grassland (GL), and Alpine Vegetation (AV). These vegetation types represent different ecological environments within the study area, encompassing forests, shrubs, grasslands, and other ecosystems. This selection helps to comprehensively assess the adaptability and accuracy of the vegetation health model.

2.3.3. Trend Analysis

Theil–Sen [33] and Mann–Kendall [34] methods were used to analyze the trends in vegetation health in China from 2000 to 2020. The Hurst exponent ( H ), based on the rescaled range ( R / S ) analysis method, is used to quantitatively describe the long-term dependence of time series. For instance, an overall increasing trend in the past will continue to increase in the future, and the closer H is to 1, the more obvious and stronger the overall trend and regularity; conversely, this is also referred to as persistence.

2.3.4. Identification of Stress Events

Vegetation health is influenced by various factors with temperature and water being fundamental requirements for its growth. Stable and suitable climatic conditions are crucial for maintaining vegetation health; conversely, extreme climate events pose significant threats. Therefore, this study focuses on exploring the changes in vegetation health under drought, wet, and heat stress conditions. In this study, drought stress is categorized into meteorological drought stress and soil drought stress. Meteorological drought stress is defined as the sum of monthly Standardized Precipitation-Evapotranspiration Index ( S P E I )   1.5 , while soil drought stress is identified as the sum of monthly Soil Moisture ( S M )   Z s c o r e s < 1.0 , with the annual drought stress intensity being the cumulative result [35]; wet stress is defined as the cumulative precipitation anomaly index, which includes monthly precipitation anomalies exceeding 300 mm [36]. Heat stress is defined as the cumulative amount of excess heat with summer temperatures exceeding the 90th percentile [37].
S P E I   C D = c u m ( S P E I 1.5 )
S M   C D = c u m ( Z S M 1.0 )
C P A = C u m u l a t i v e   P r e c i p i t a t i o n   a n o m a l y > 300
C H = c u m ( T T 90 t h )

2.3.5. Sensitivity Analysis

For the sensitivity analysis of vegetation health to climate anomalies from 2000 to 2020 (with SPEI data starting from 2001), we first convert the climate anomalies to absolute values for all grids, which are measured in standard deviation units (std). Considering each type of extreme climate and vegetation type, we divide the vegetation health anomalies (std) by the climate event anomalies (std). The resulting ratio is considered the sensitivity of vegetation health to climate anomalies [37], including four types of climate anomaly events: meteorological drought stress, soil drought stress, wet stress, and heat stress, which are normalized as follows:
S e n s i t i v i t y = Z V H I Z S t r e s s   e v e n t s
where Z V H I and Z S t r e s s   e v e n t s indicate the standardized anomalies of VHI and the standardized anomalies of stress events, respectively.

2.3.6. Modified Residual Analysis

Residual analysis based on the linear relationship between climate variables and vegetation is simple and easy to use, and it is widely employed to separate the respective contributions of climate change (CC) and human activities (HAs) to vegetation [38]; however, these analyses typically consider only the average states of temperature and precipitation, the most direct influences on vegetation, and do not address the contributions of stress (extreme) events. Therefore, this study proposes an improved residual analysis that accounts for stress events to quantify the contributions of both stress events and other factors to vegetation health.
s l o p e = n · i = 1 n i · y i ( i = 1 n i ) ( i = 1 n y i ) n · i = 1 n i 2 ( i = 1 n i ) 2
where s l o p e represents the rate of change in vegetation health in response to a specific climate variable over time, y represents the time series, i is the sequence number of the i t h year, y i is the time series value of the year, and n is the number of years. The analysis considers drought stress, wet stress, and heat stress as follows:
V H I C C = a · S P E I   C D + b · S M   C D + c · C P A + d · C H + e
V H I o t h e r s = V H I o b s V H I C C
where V H I C C represents the predicted vegetation health index due to stress events, a to d represent regression coefficients, e represents the intercept, and V H I o b s represents the observed vegetation health index. The residual, V H I o t h e r s , represents the impact of factors other than stress events on vegetation health.

2.3.7. Statistical Methods

This study employs Z s c o r e s to calculate stress events and the sensitivity of vegetation health to these stress events. The least squares linear fitting method is used to explore the reasonableness of the health system construction by examining the relationship between vegetation health and LAI, NPP, and SIF. The Pearson correlation coefficient [39] and R2 are used to validate the accuracy or goodness of fit of the assessment system.
Z = x x ¯ σ
where x is the original variable, x ¯ is the mean value of the variable, and σ is the standard deviation of the variable.
The vegetation health system was constructed using CIM, TOPSIS, and PSR models, selecting the most appropriate system. The impact of stress events on vegetation health was explored based on anomaly analysis, sensitivity analysis, and modified residual analysis. The specific flowchart is illustrated in Figure 2.

3. Results

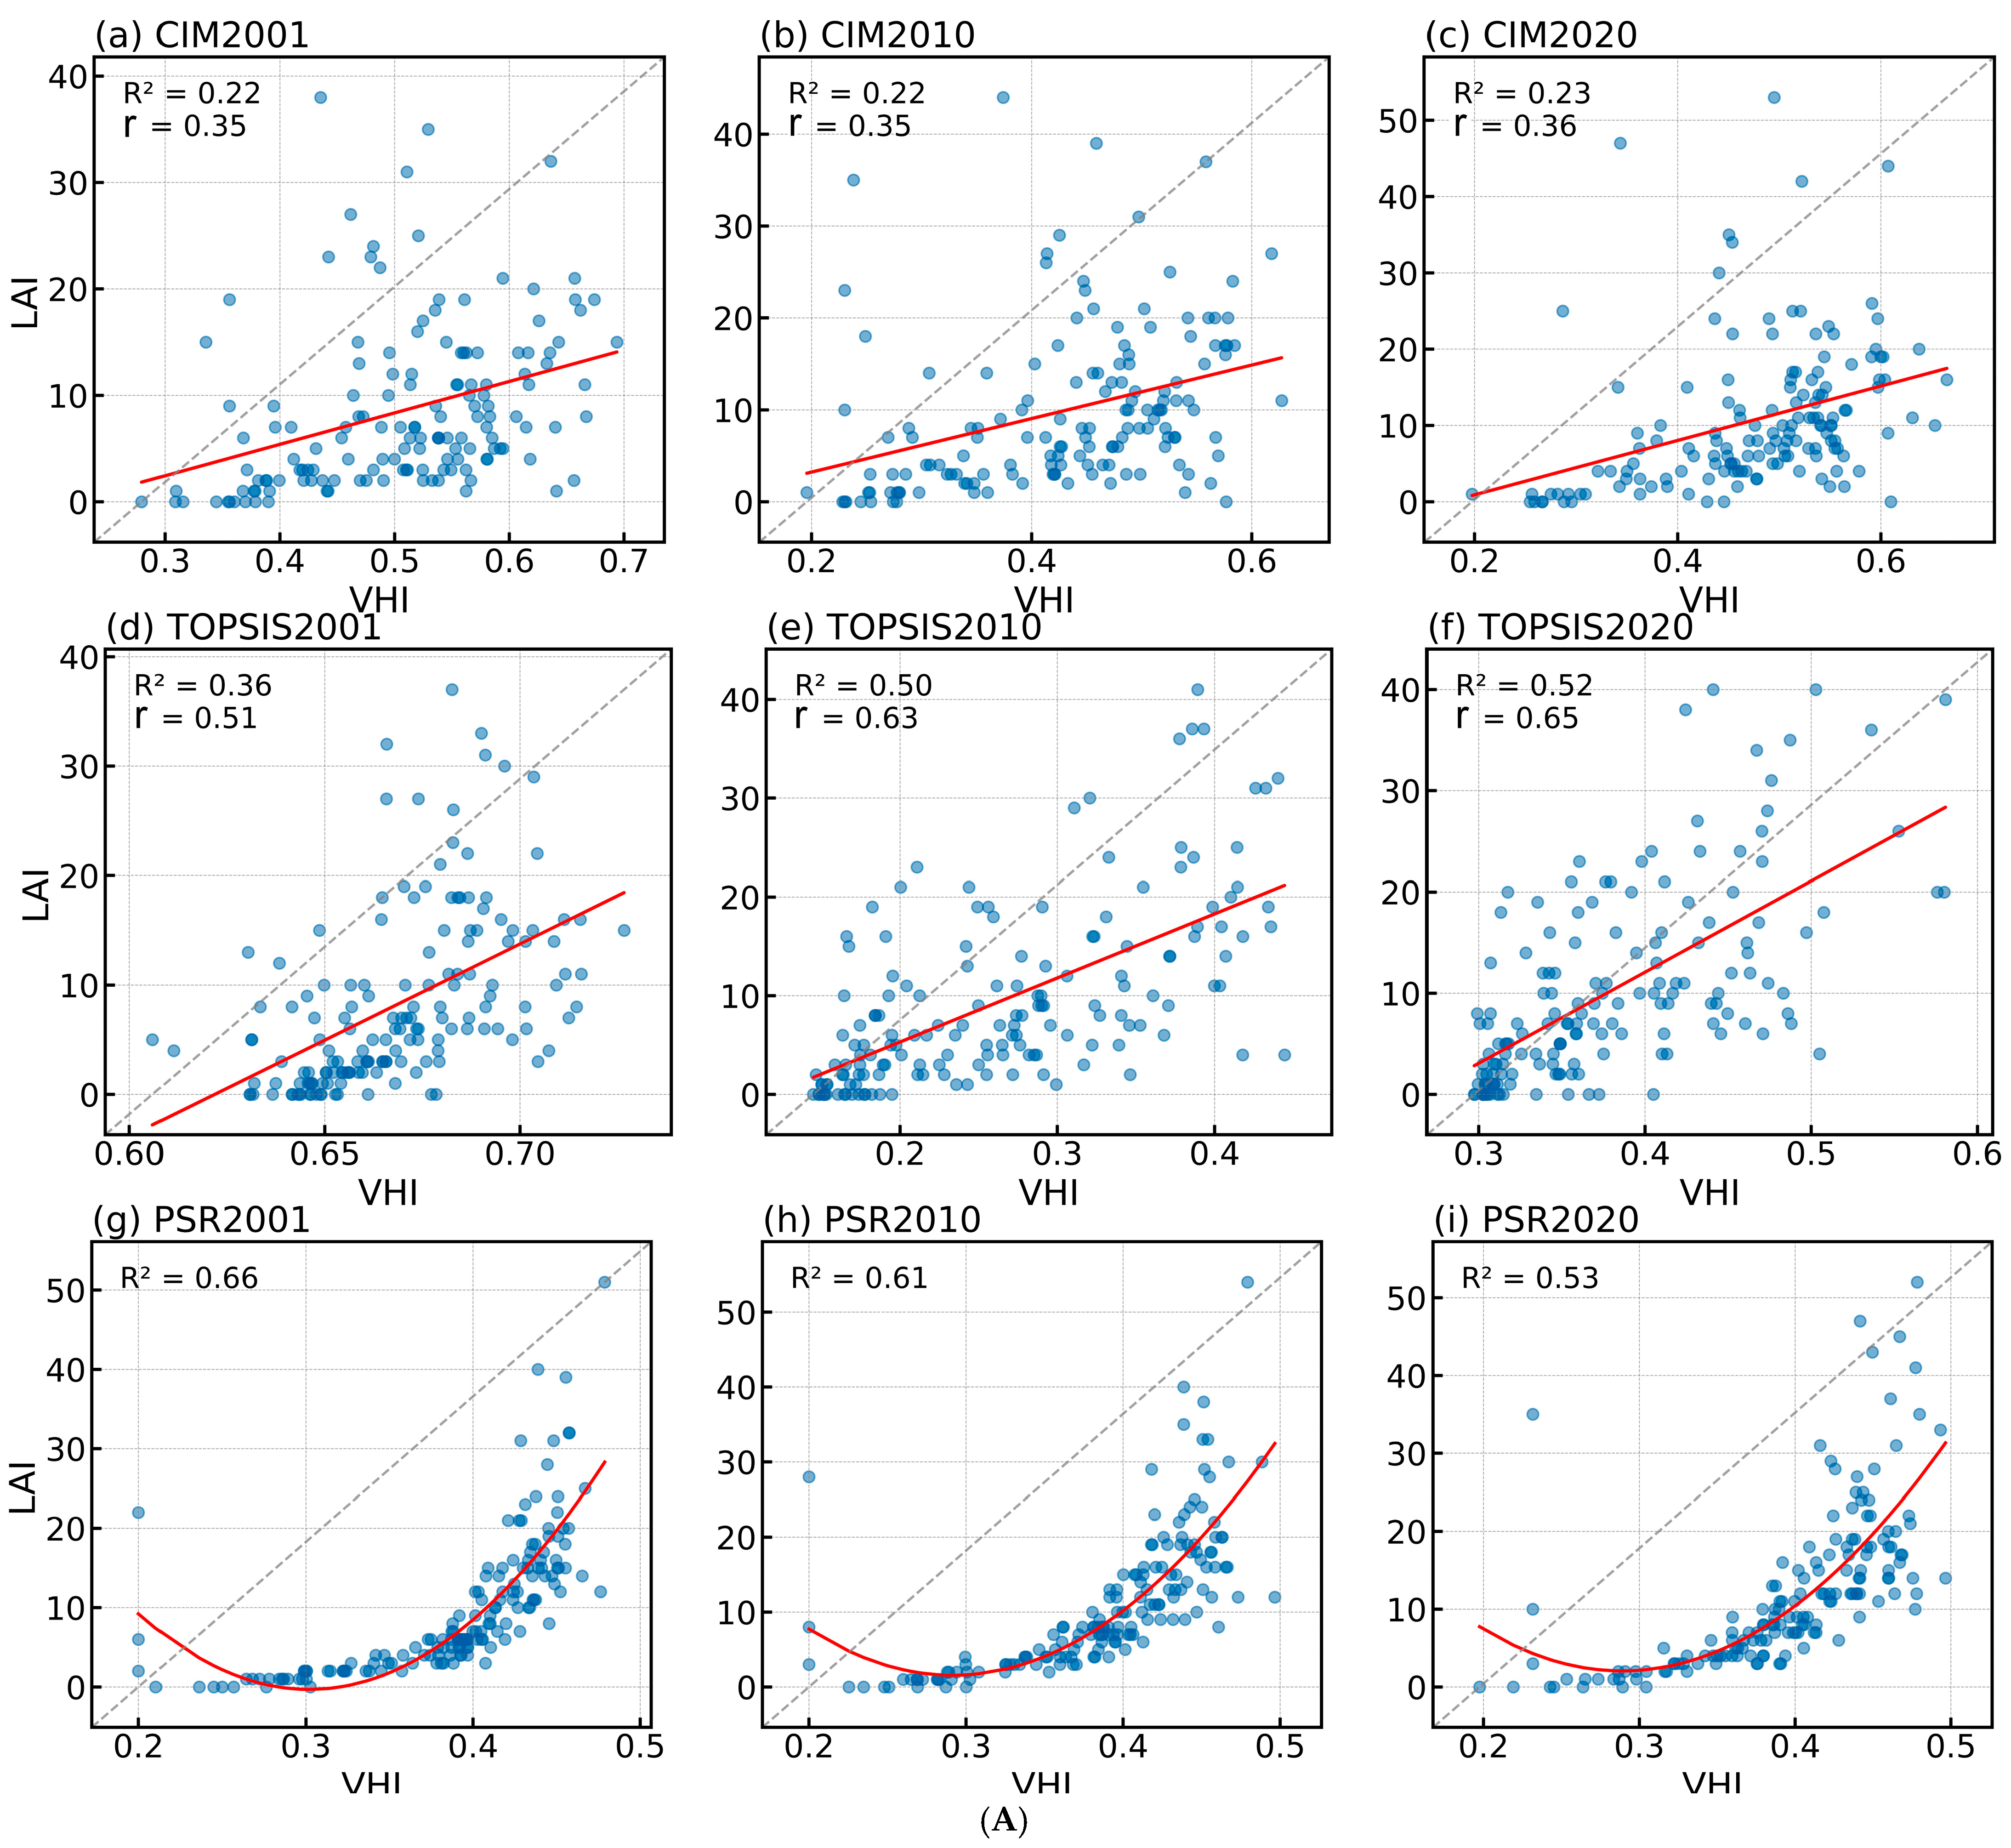
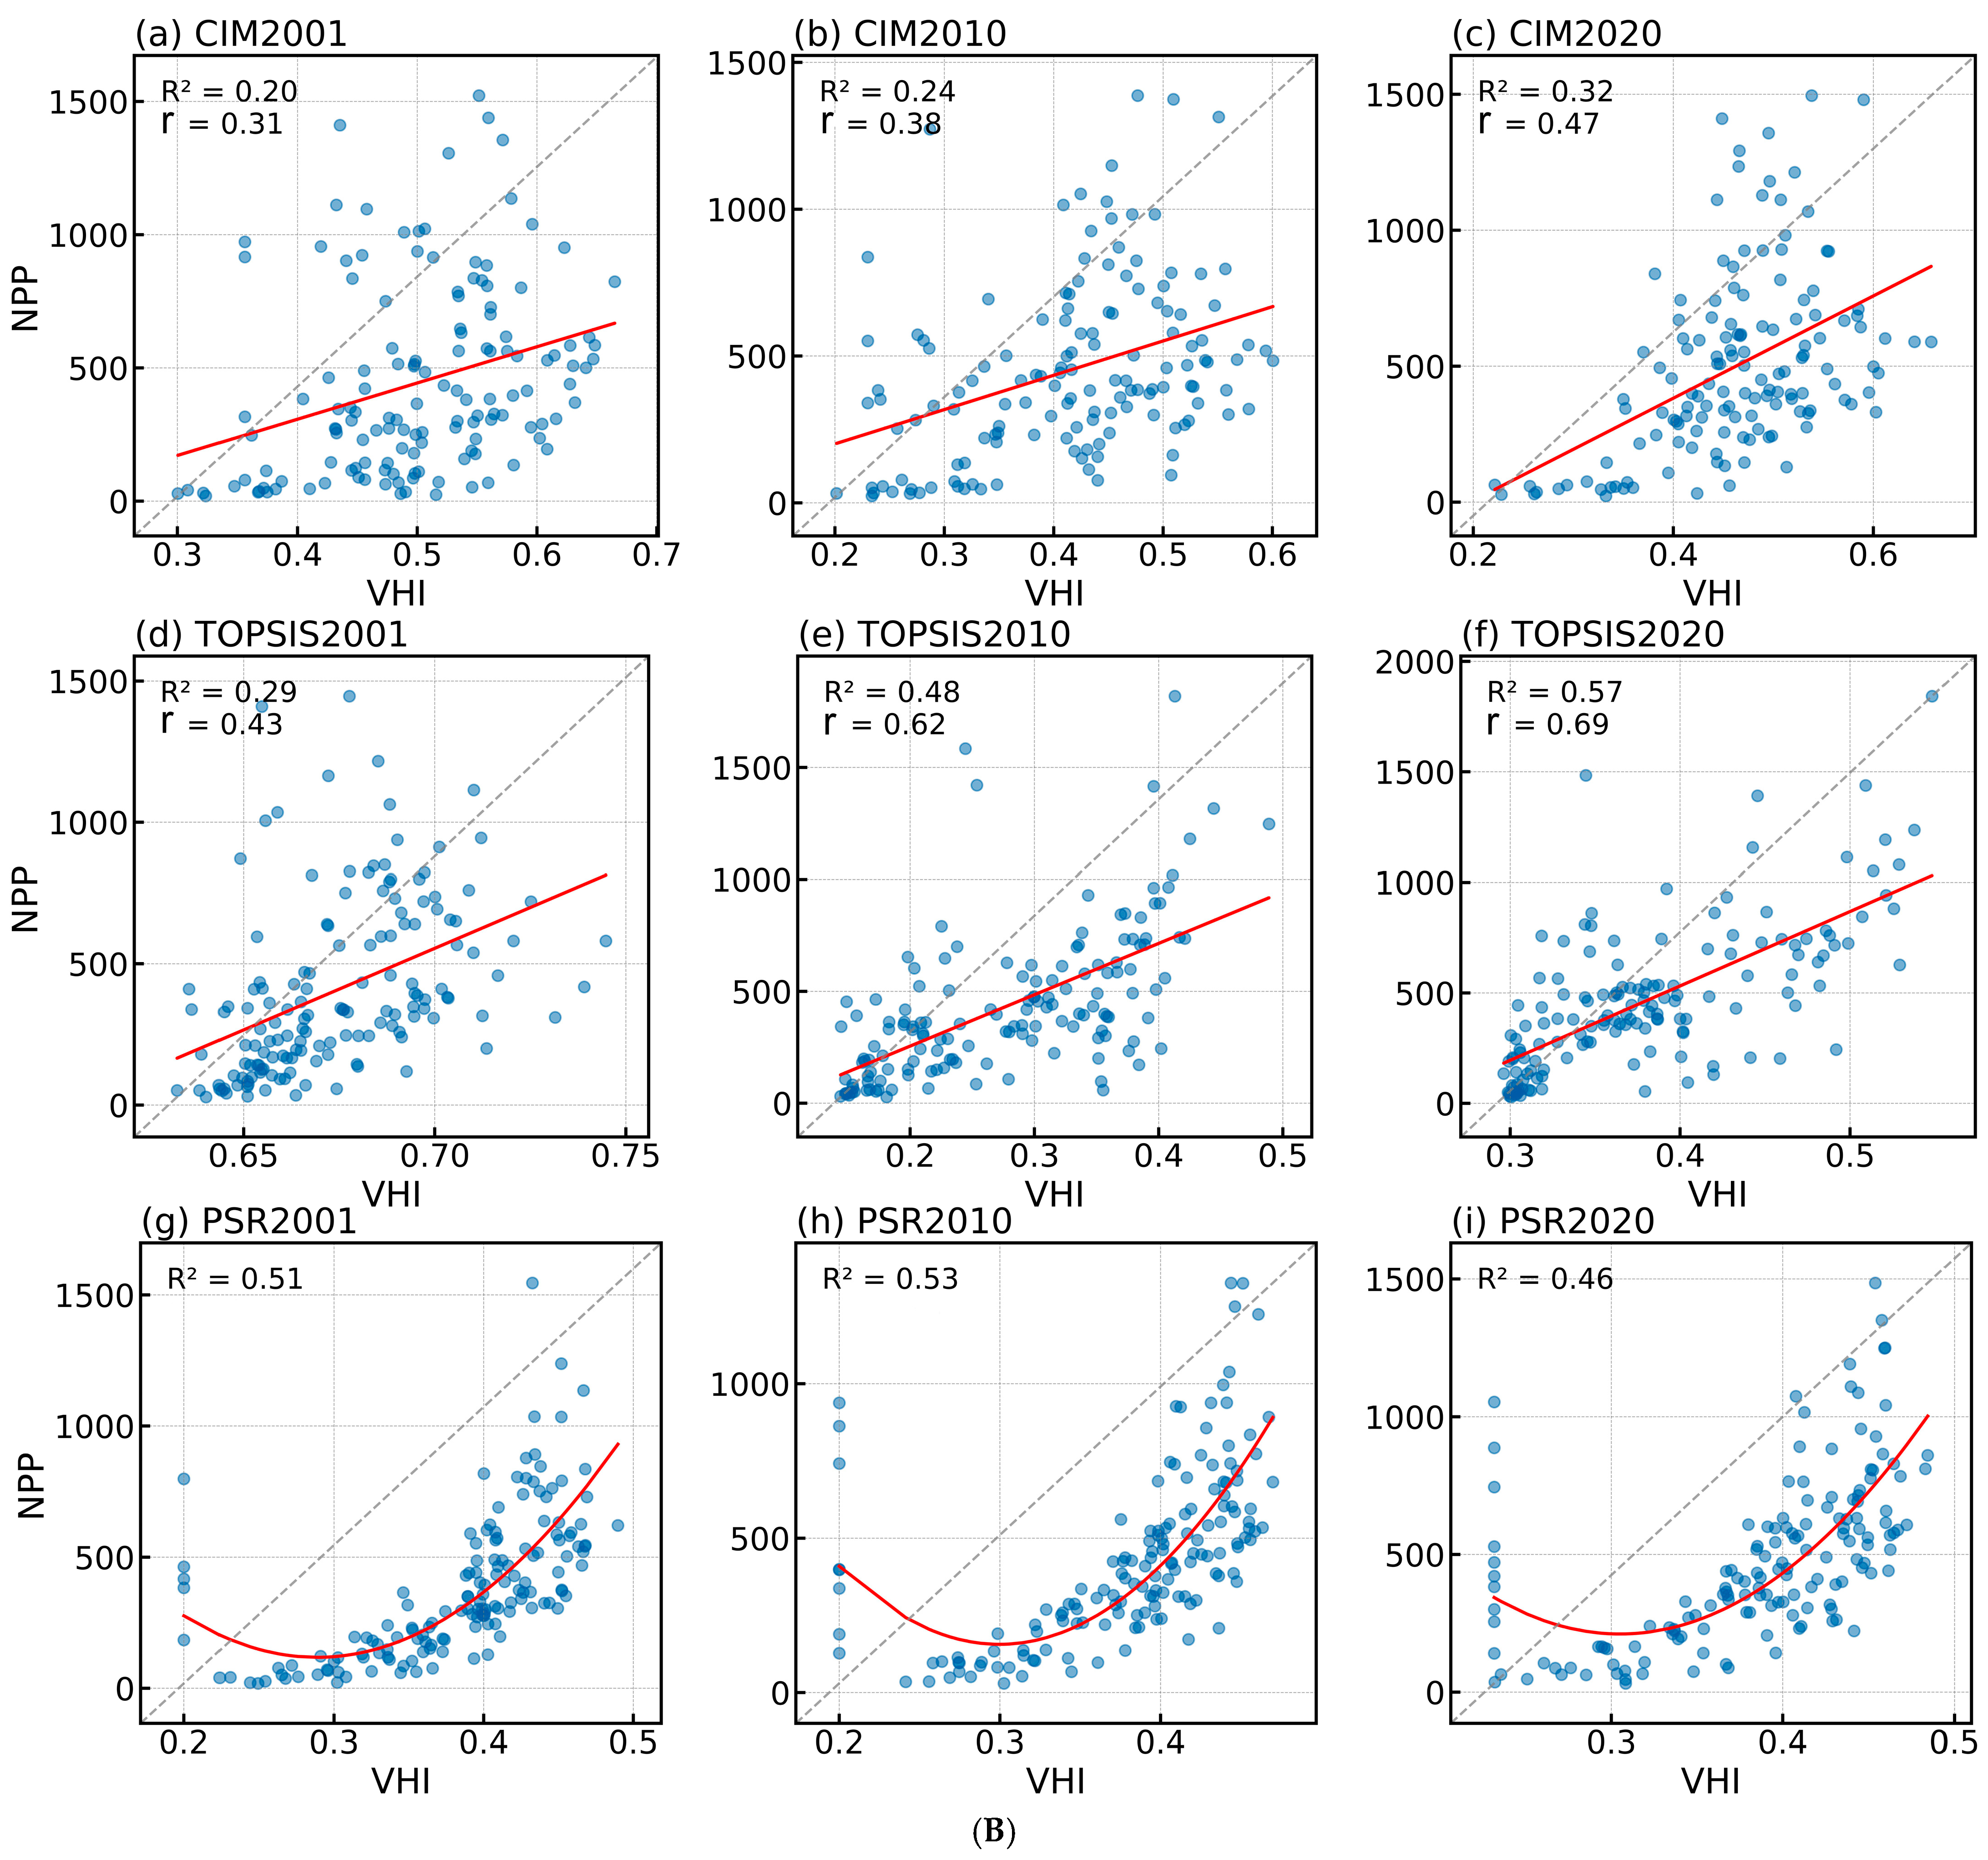
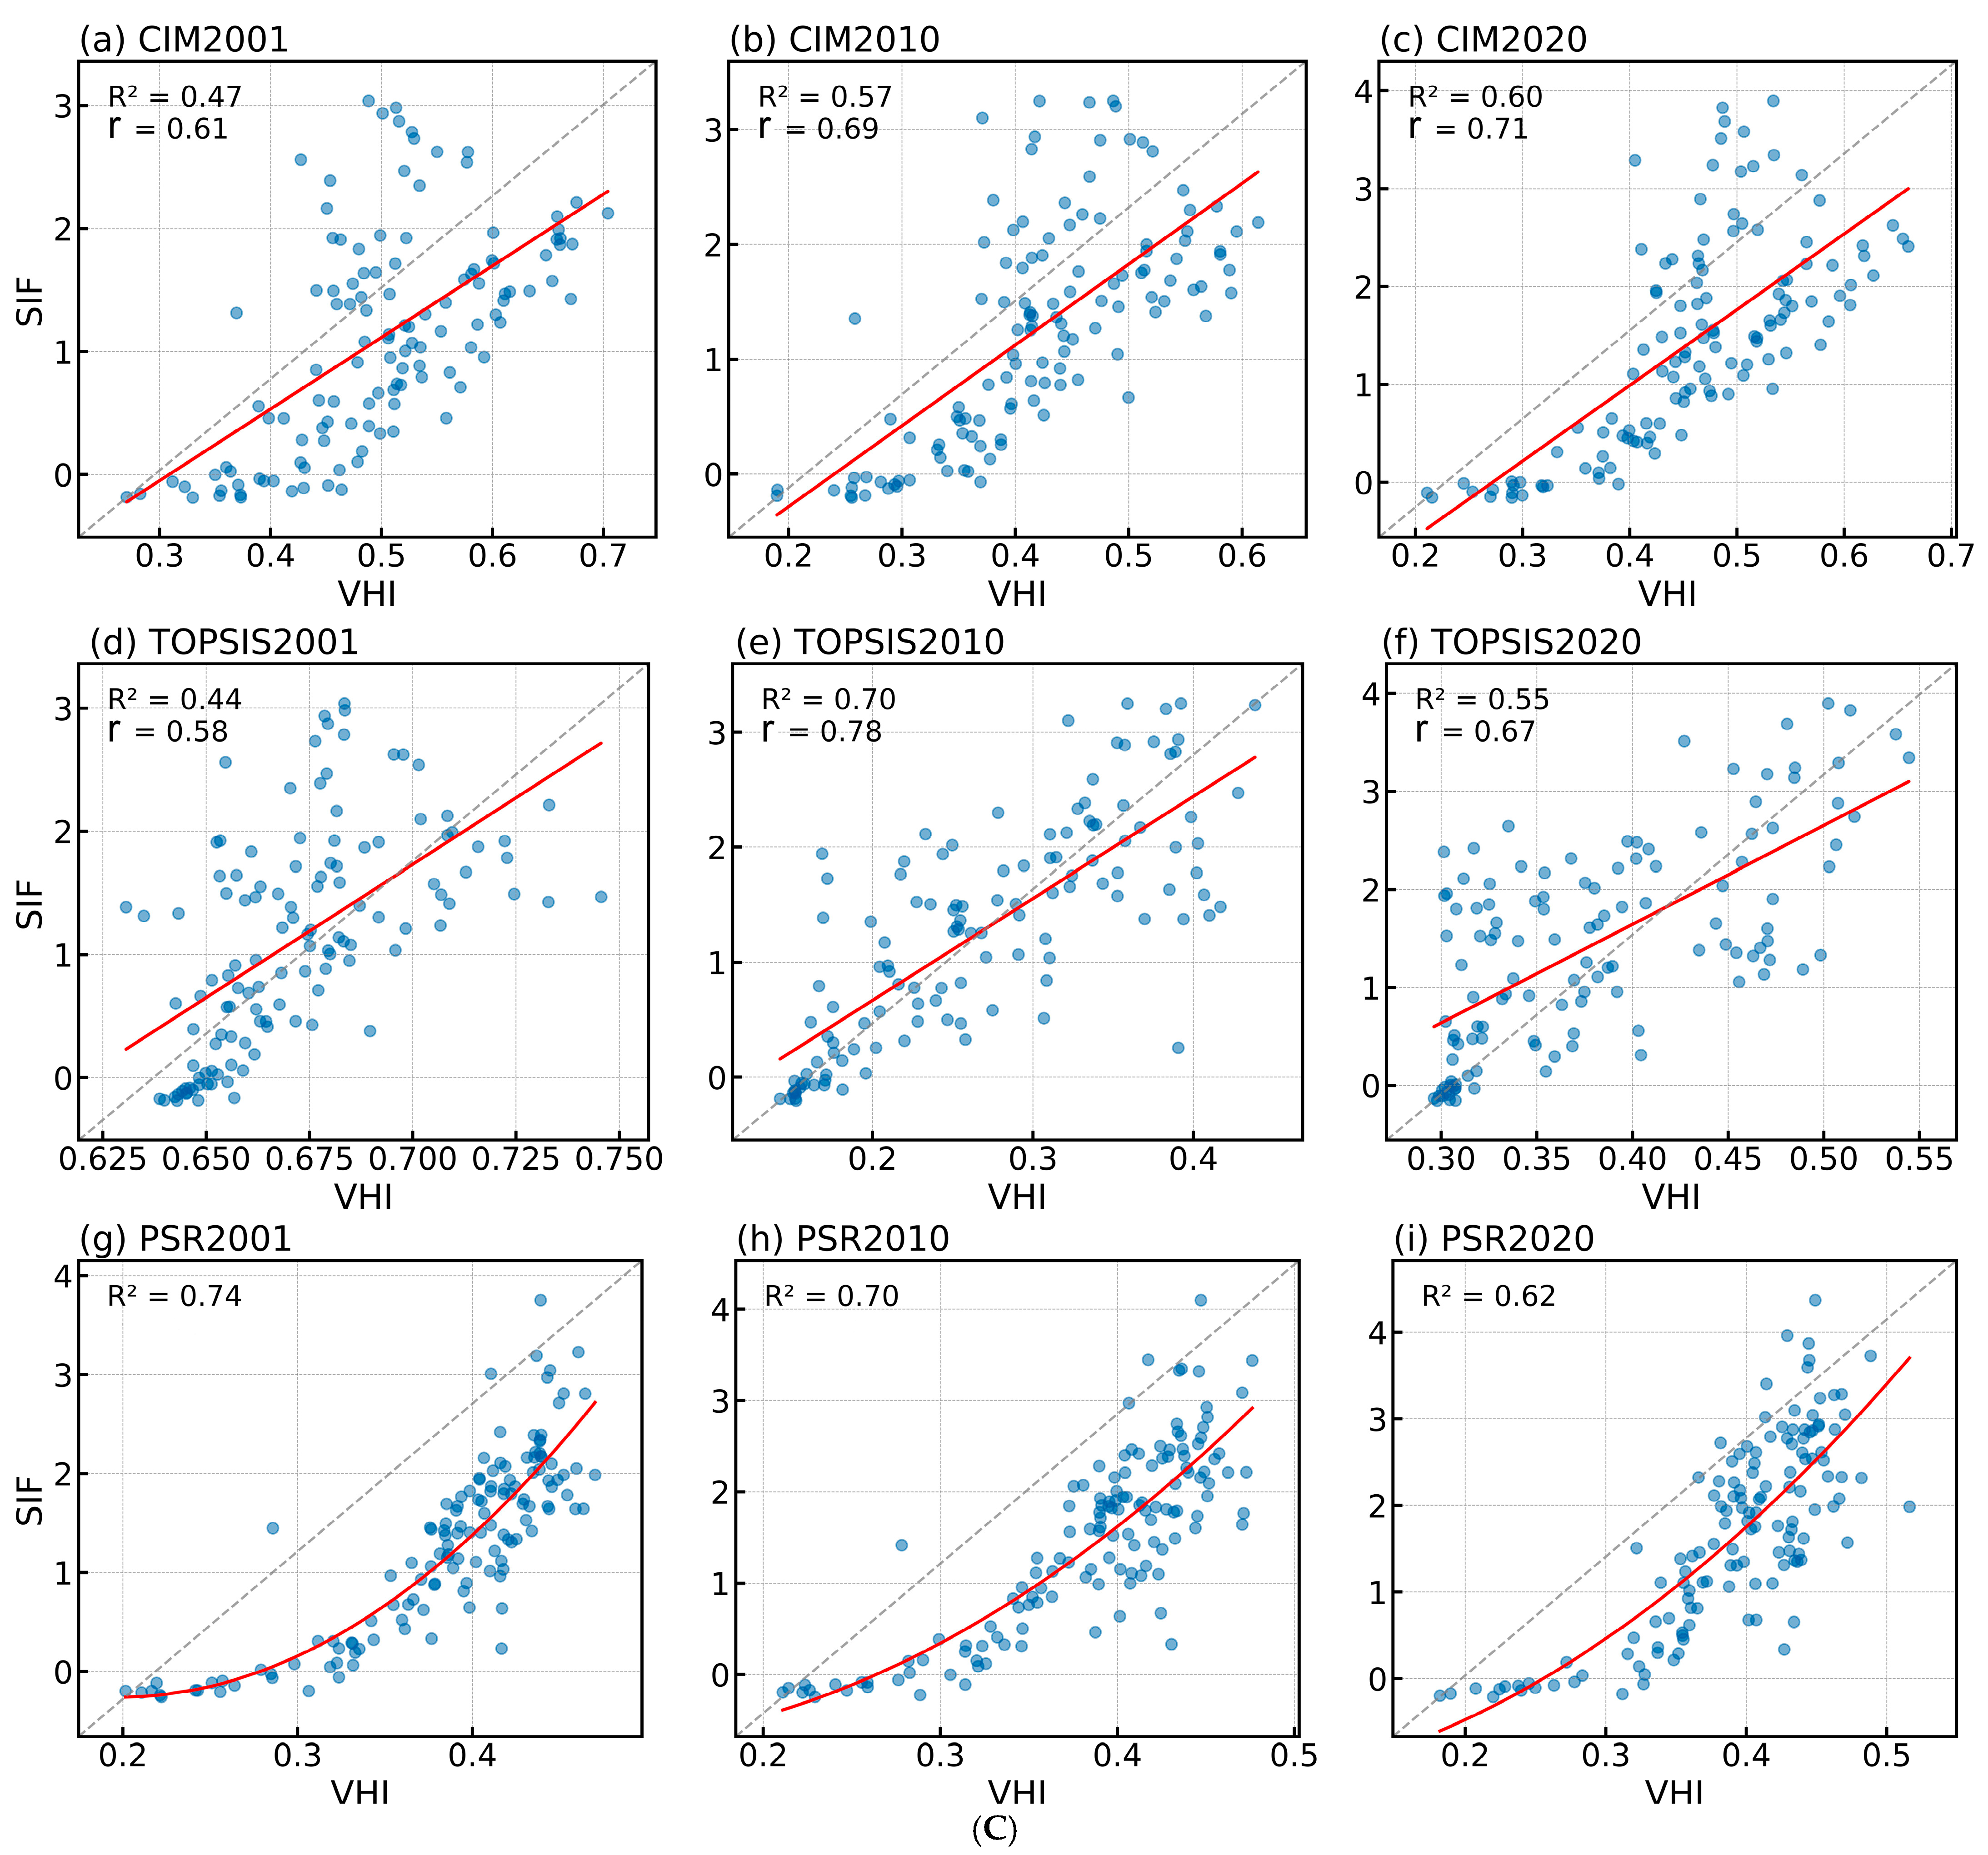
3.1. PSR Models Most Accurately Reflect Vegetation Health

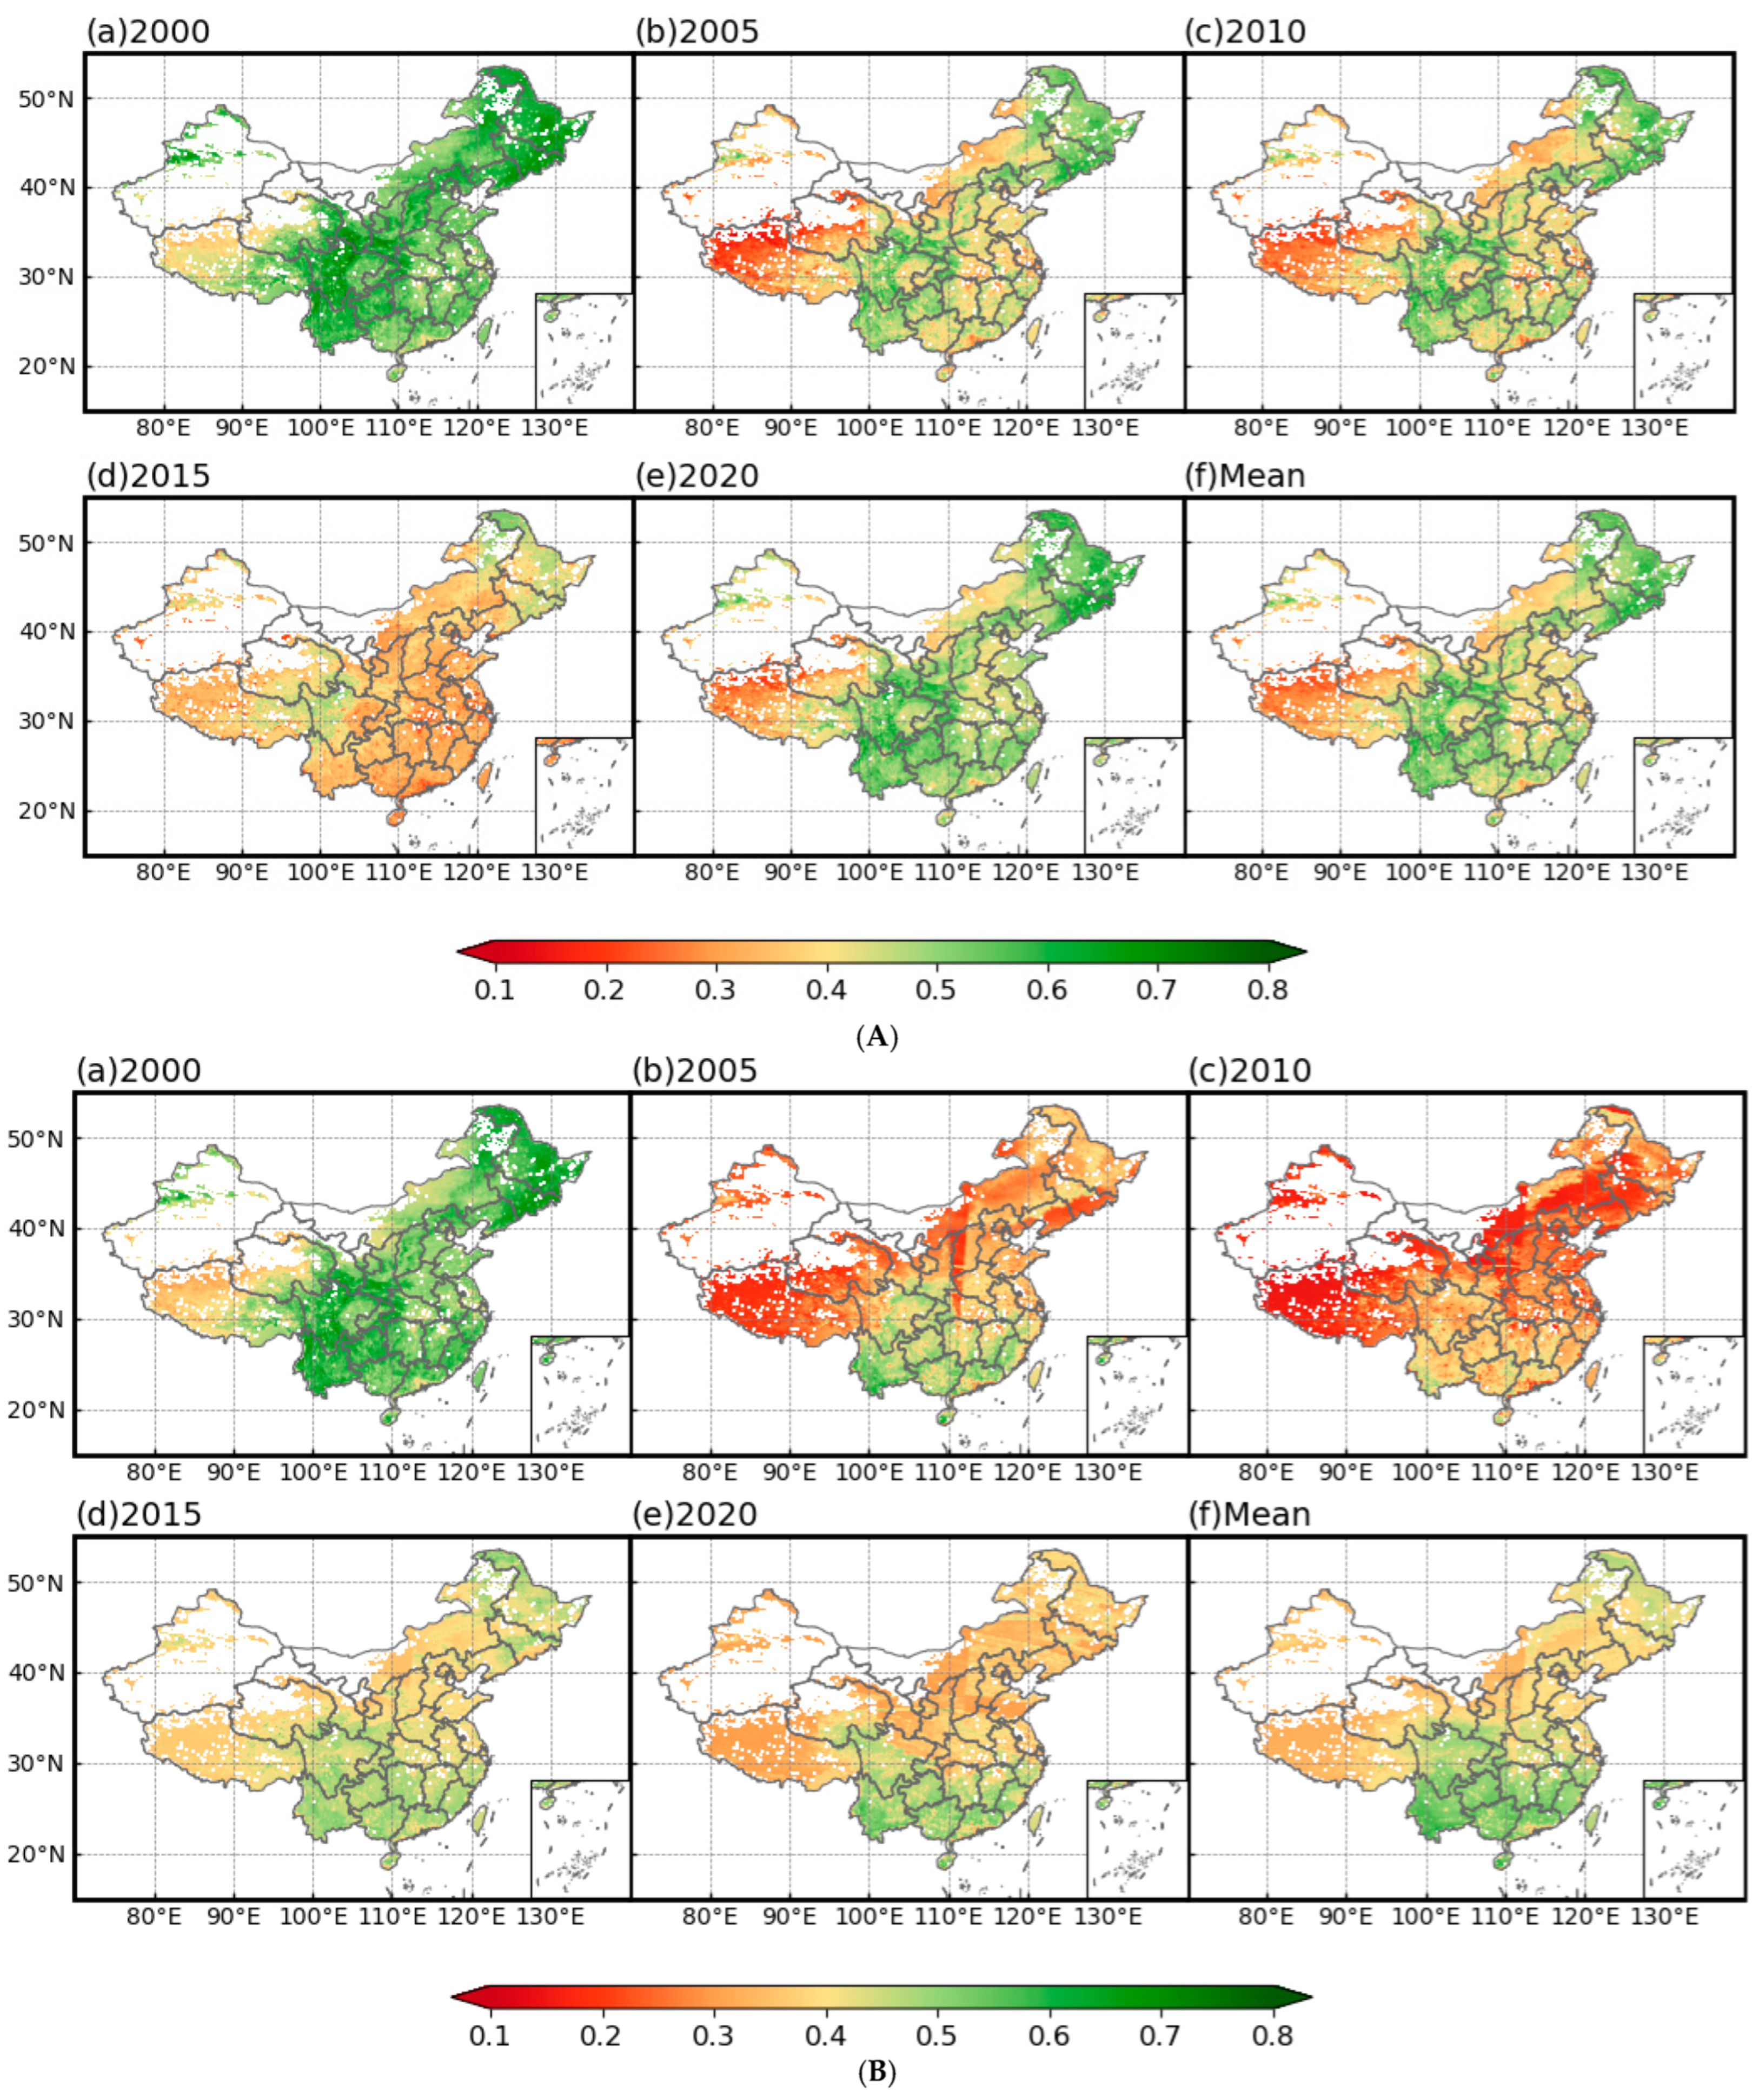
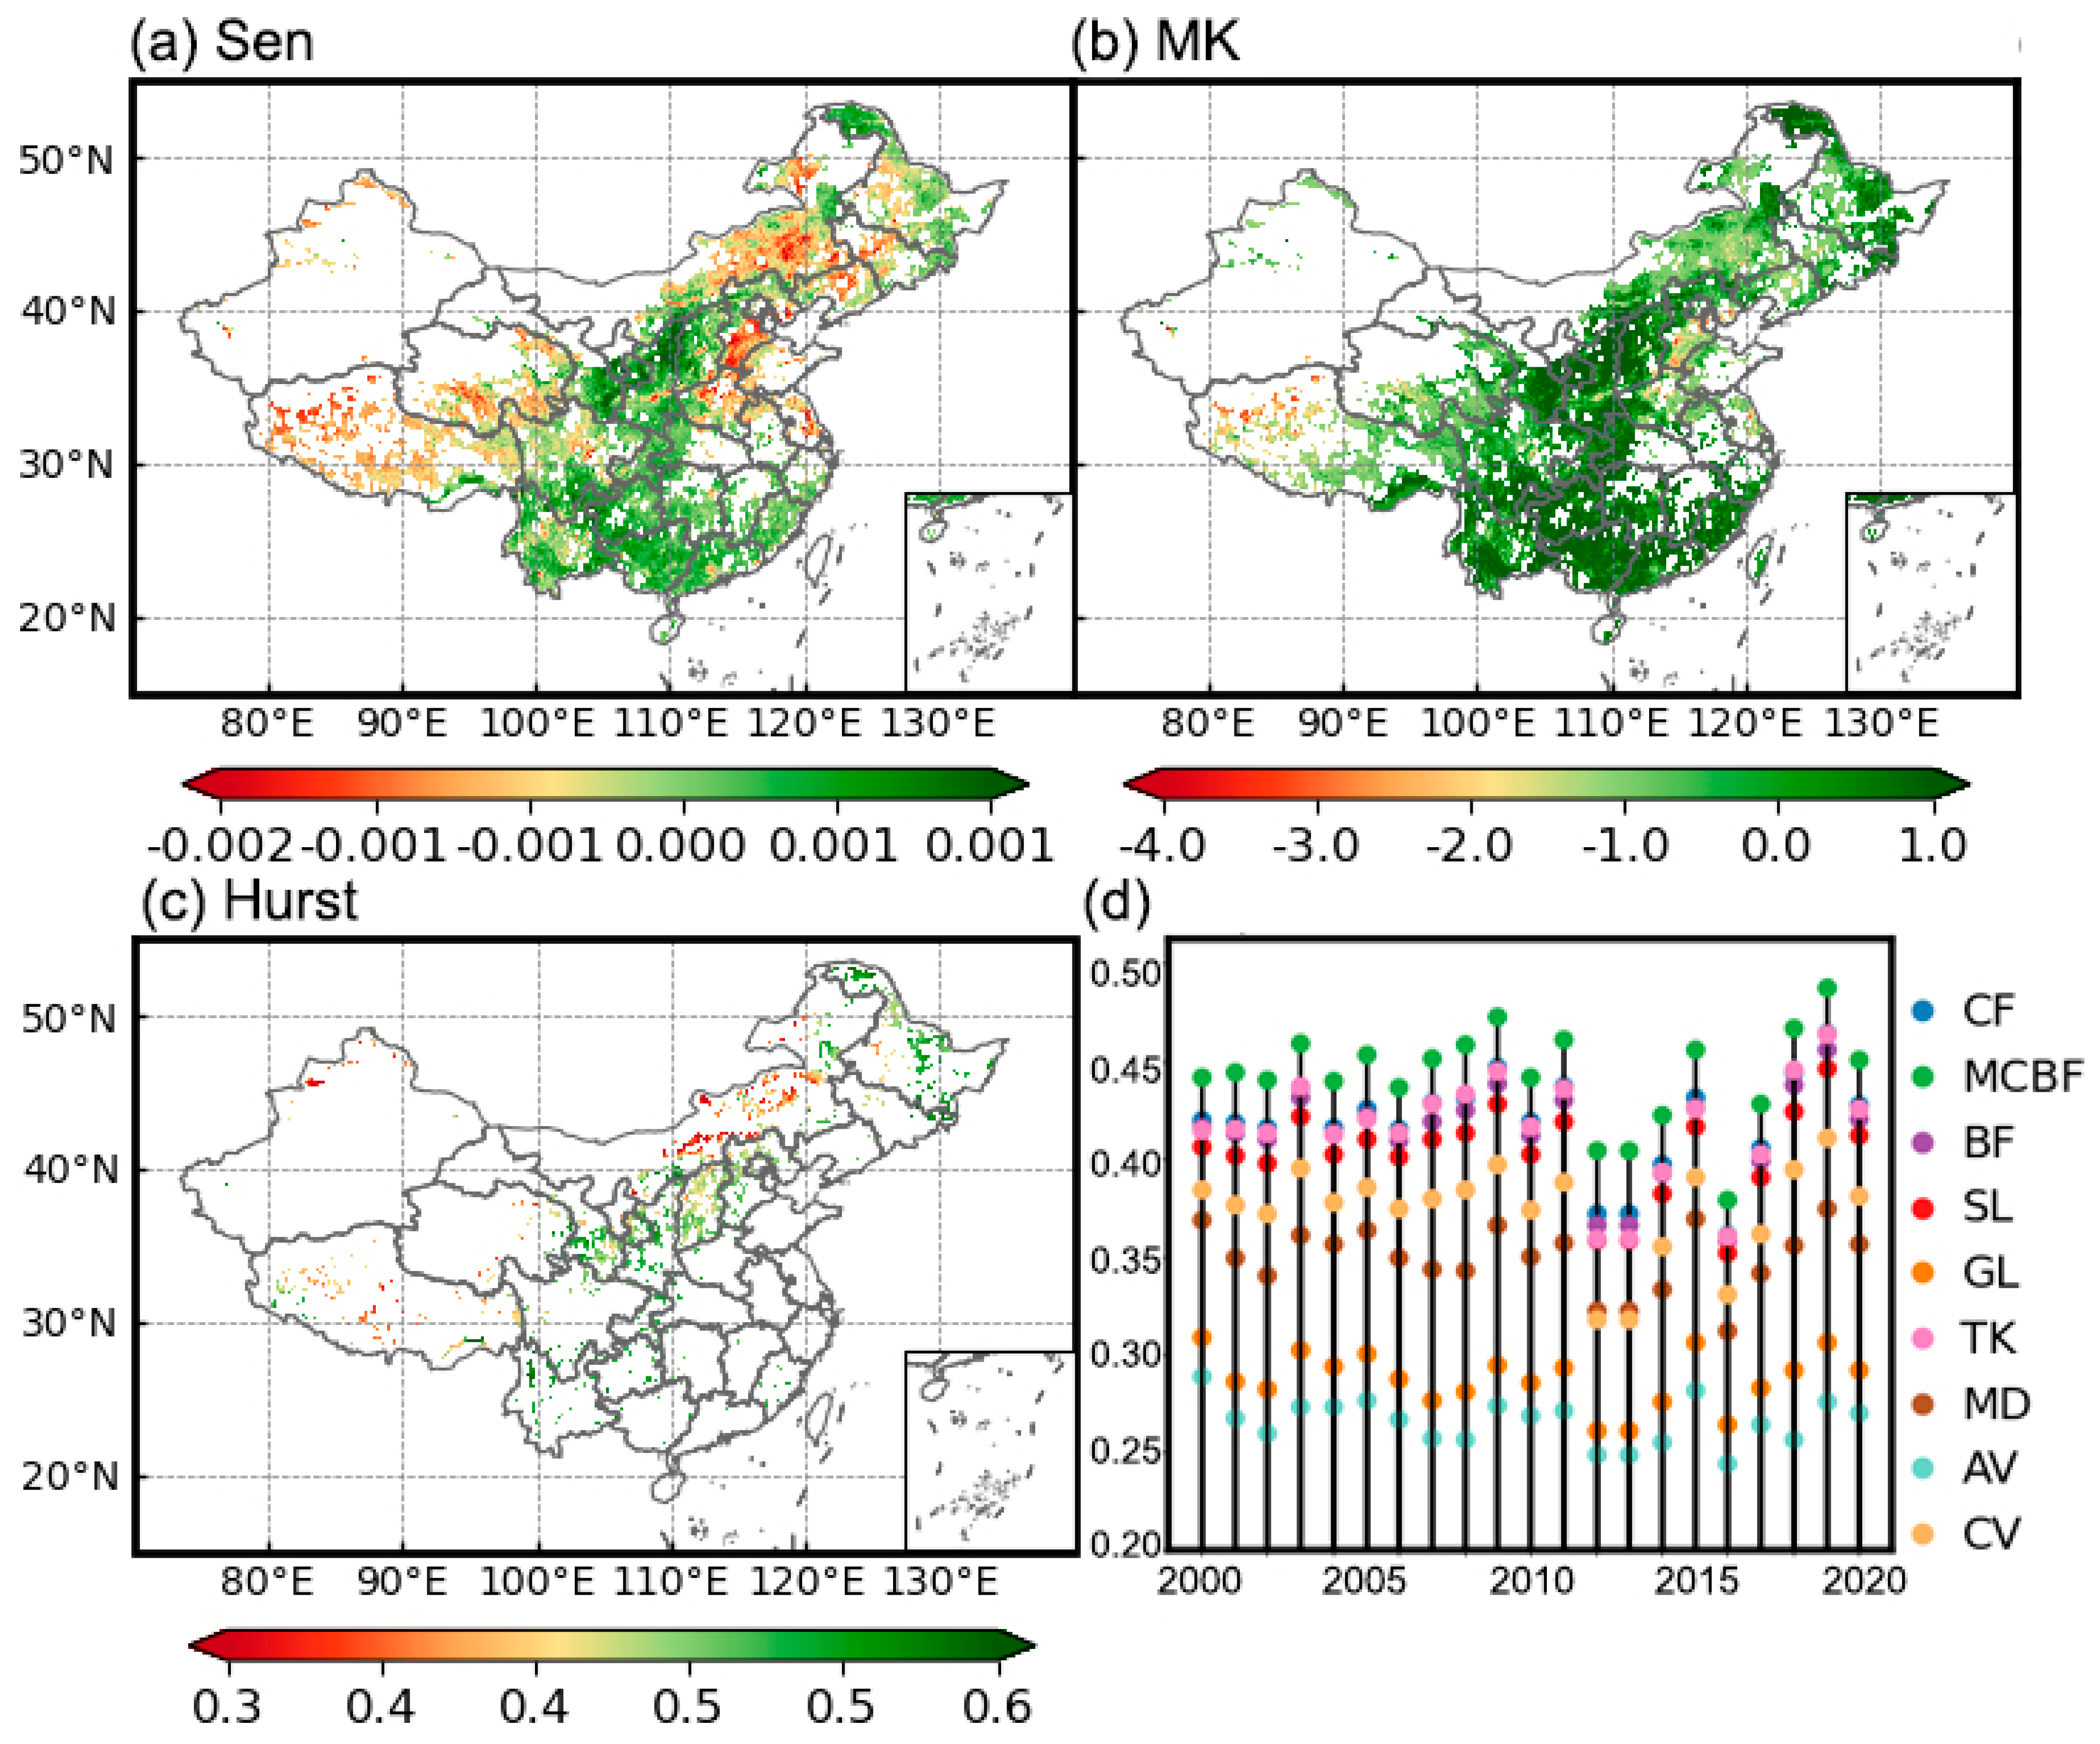
3.1.1. Temporal Trends of Vegetation Health

The VHIs constructed using the CIM, TOPSIS, and PSR models exhibit significant regional differences across China with higher levels of VHI in the central and southern regions and relatively lower levels in the western and northern regions. This spatial heterogeneity is consistently observed across all three health assessment systems. Except for the Ili Valley, VHI levels in northwest China are generally low. Influenced by the ecological and climatic conditions of the three northeastern provinces, the eastern part of Inner Mongolia, adjacent to these provinces, shows higher VHI levels. The vegetation in the Qinghai–Tibet Plateau, characterized by an alpine climate, is highly sensitive to climate responses, resulting in lower VHI levels compared to other regions. In contrast, Sichuan, Yunnan, Guizhou, and Chongqing consistently maintain high VHI levels throughout the year. The CIM and TOPSIS models exhibit more pronounced variations, while the PSR model shows more stable changes in the vegetation health system (Figure 3A–C, Figures S1 and S2).

3.1.2. Evaluation of the Vegetation Health Assessment System Construction Effectiveness

The LAI is a crucial ecological indicator for measuring vegetation health, effectively assessing the physiological state and overall health of vegetation [40]. Compared to the Normalized Difference Vegetation Index (NDVI), LAI represents half of the total leaf area per unit ground area, which is a fundamental property of vegetation and a critical climatic variable. It provides a more accurate depiction of canopy structural dynamics and vegetation responses to stress [41]. This study evaluates the construction effectiveness of the vegetation health assessment system by analyzing the fitting results and correlation between the VHI and the LAI over each decade. The results indicate that the CIM assessment system shows low correlation and explanatory power for the years 2001 (R2 = 0.22, r = 0.35), 2010 (R2 = 0.22, r = 0.35), and 2020 (R2 = 0.23, r = 0.36) (Figure 4A), suggesting a weak linear relationship with LAI. This implies that the CIM’s ability to evaluate vegetation health during these periods is limited. In contrast, the TOPSIS assessment system shows progressively increasing correlation and explanatory power over each decade, rising from R2 = 0.36, r = 0.51 in 2001 to R2 = 0.52, r = 0.65 in 2020. This trend indicates that the TOPSIS method increasingly aligns with LAI measurements over time, as its comprehensive calculation method more thoroughly considers multiple factors related to vegetation health (Figure 4A(d–f)). Additionally, the PSR model consistently demonstrates strong correlation and explanatory power across all three years, with a particularly high R2 = 0.66 in 2001, indicating a stable positive relationship with LAI (Figure 4A(g–i)).
NPP, as a key indicator of an ecosystem’s carbon capture capacity, reflects the efficiency of vegetation in fixing carbon from the atmosphere through photosynthesis. Generally, high NPP indicates healthy and actively growing vegetation. Healthy vegetation can effectively absorb more carbon dioxide, enhancing carbon sequestration and thereby contributing to combating climate change [42]. Compared to GPP, NPP places greater emphasis on net carbon gain, making it more suitable for evaluating long-term vegetation growth trends and the impacts of environmental stress.
The results indicate that for the CIM system, the correlation and explanatory power with NPP gradually increase over the years, with R2 = 0.20, r = 0.31 in 2001, R2 = 0.24, r = 0.38 in 2010, and R2 = 0.32, r = 0.47 in 2020 (Figure 4B(a–c)), showing a slow but steady strengthening of the relationship between CIM and NPP over time. The TOPSIS method demonstrates a significant upward trend during the same period with correlation and explanatory power increasing from R2 = 0.29, r = 0.43 in 2001 to R2 = 0.57, r = 0.69 in 2020 (Figure 4B(d–f)). This notable improvement indicates that the TOPSIS method has become more effective in explaining the relationship between NPP and vegetation health, reflecting an increased fitness over time. The PSR model also shows stable growth during the evaluation period with the correlation increasing from R2 = 0.51 in 2001 to R2 = 0.53 in 2010 (Figure 4B(g–i)). Although there was a slight decline in 2020, the overall performance remains stable.
SIF is a critical indicator for assessing vegetation photosynthetic efficiency. It is measured by detecting the faint fluorescence emitted by vegetation leaves when exposed to sunlight. This fluorescence is closely related to the photosynthetic activity of vegetation; healthy vegetation typically exhibits higher photosynthetic levels and stronger fluorescence signals. Compared to traditional indices such as NDVI and EVI (Enhanced Vegetation Index), which rely on reflected light, SIF is more sensitive to photosynthetic activity, particularly under high-stress conditions, where it can detect subtle changes [43]. Thus, SIF serves as a powerful tool for evaluating vegetation health and vitality.
Fitting results between SIF and the VHI reveal that for the CIM system, the correlation and explanatory power between VHI and SIF increase annually: R2 = 0.47, r = 0.61 in 2001, R2 = 0.57, r = 0.69 in 2010, and R2 = 0.60, r = 0.71 in 2020, indicating that CIM is increasingly capable of accurately capturing the key factors affecting SIF (Figure 4C(a–c)). The TOPSIS method also shows a clear annual improvement trend, with correlation and explanatory power rising from R2 = 0.44, r = 0.58 in 2001 to R2 = 0.55, r = 0.67 in 2020, further demonstrating the enhanced effectiveness of TOPSIS in explaining the relationship between SIF and vegetation health (Figure 4C(d–f)). Meanwhile, the PSR model consistently demonstrates the best fitting performance across all years with correlation and explanatory power evolving from R2 = 0.74 in 2001 to R2 = 0.70 in 2010 (Figure 4C(g,h)). The PSR method provides consistent explanatory power and shows significant statistical correlation and high goodness of fit. Its stable performance indicates that the PSR model effectively balances environmental pressures, states, and response factors influencing SIF, thereby reliably predicting SIF trends.
In summary, three models show an increasing trend over time to varying degrees. The VHI constructed using the PSR model demonstrates higher R2 values and stronger correlations with the three indices reflecting vegetation health compared to CIM and TOPSIS. Over time, the PSR model may prove more suitable for applications in vegetation ecological carbon monitoring. Therefore, this study explores the response of the VHI to stress events based on calculations from the PSR model.

3.1.3. Trends in Vegetation Health

From 2000 to 2020, the VHI in southern China exhibited a sustained positive growth trend with the maximum growth rate reaching 0.001·a−1 (Figure 5a). In contrast, the vegetation health in the Qinghai–Tibet Plateau, Inner Mongolia, and southern Hebei showed a significant degradation trend. Notably, the growth rate of VHI in southern Gansu, Ningxia, and northern Shaanxi is comparable to that in Guangdong and Guangxi. However, most areas in Henan and Jiangsu displayed a sustained and significant decline with the maximum decline rate being 0.002·a−1 (Figure 5a,b). Except for the central and northeastern regions, where vegetation health showed strong persistence, the persistence in other regions was relatively weak (Figure 5c).
Due to differences in physiological structure, vegetation exhibits varying resistance and resilience to stress events, resulting in different health statuses. The results show that MCBF consistently maintain relatively high VHI levels. CFs also exhibit high health values. Coniferous forests generally have strong resistance and adaptability to cold climatic conditions, resulting in high VHI levels. SL, BF, and TK show considerable interannual health fluctuations, yet they consistently display high health values across all health systems (Figure 5d). Their biodiversity and complex structures contribute to ecosystem stability and health. Shrubs demonstrate strong environmental adaptability. GL and MD, with their shallow root systems, show lower health values due to drought and soil erosion. CV’s health values are the lowest among all types. AV also shows low VHI, which is likely due to harsh conditions in alpine environments, such as low temperatures, wind erosion, and low soil fertility.

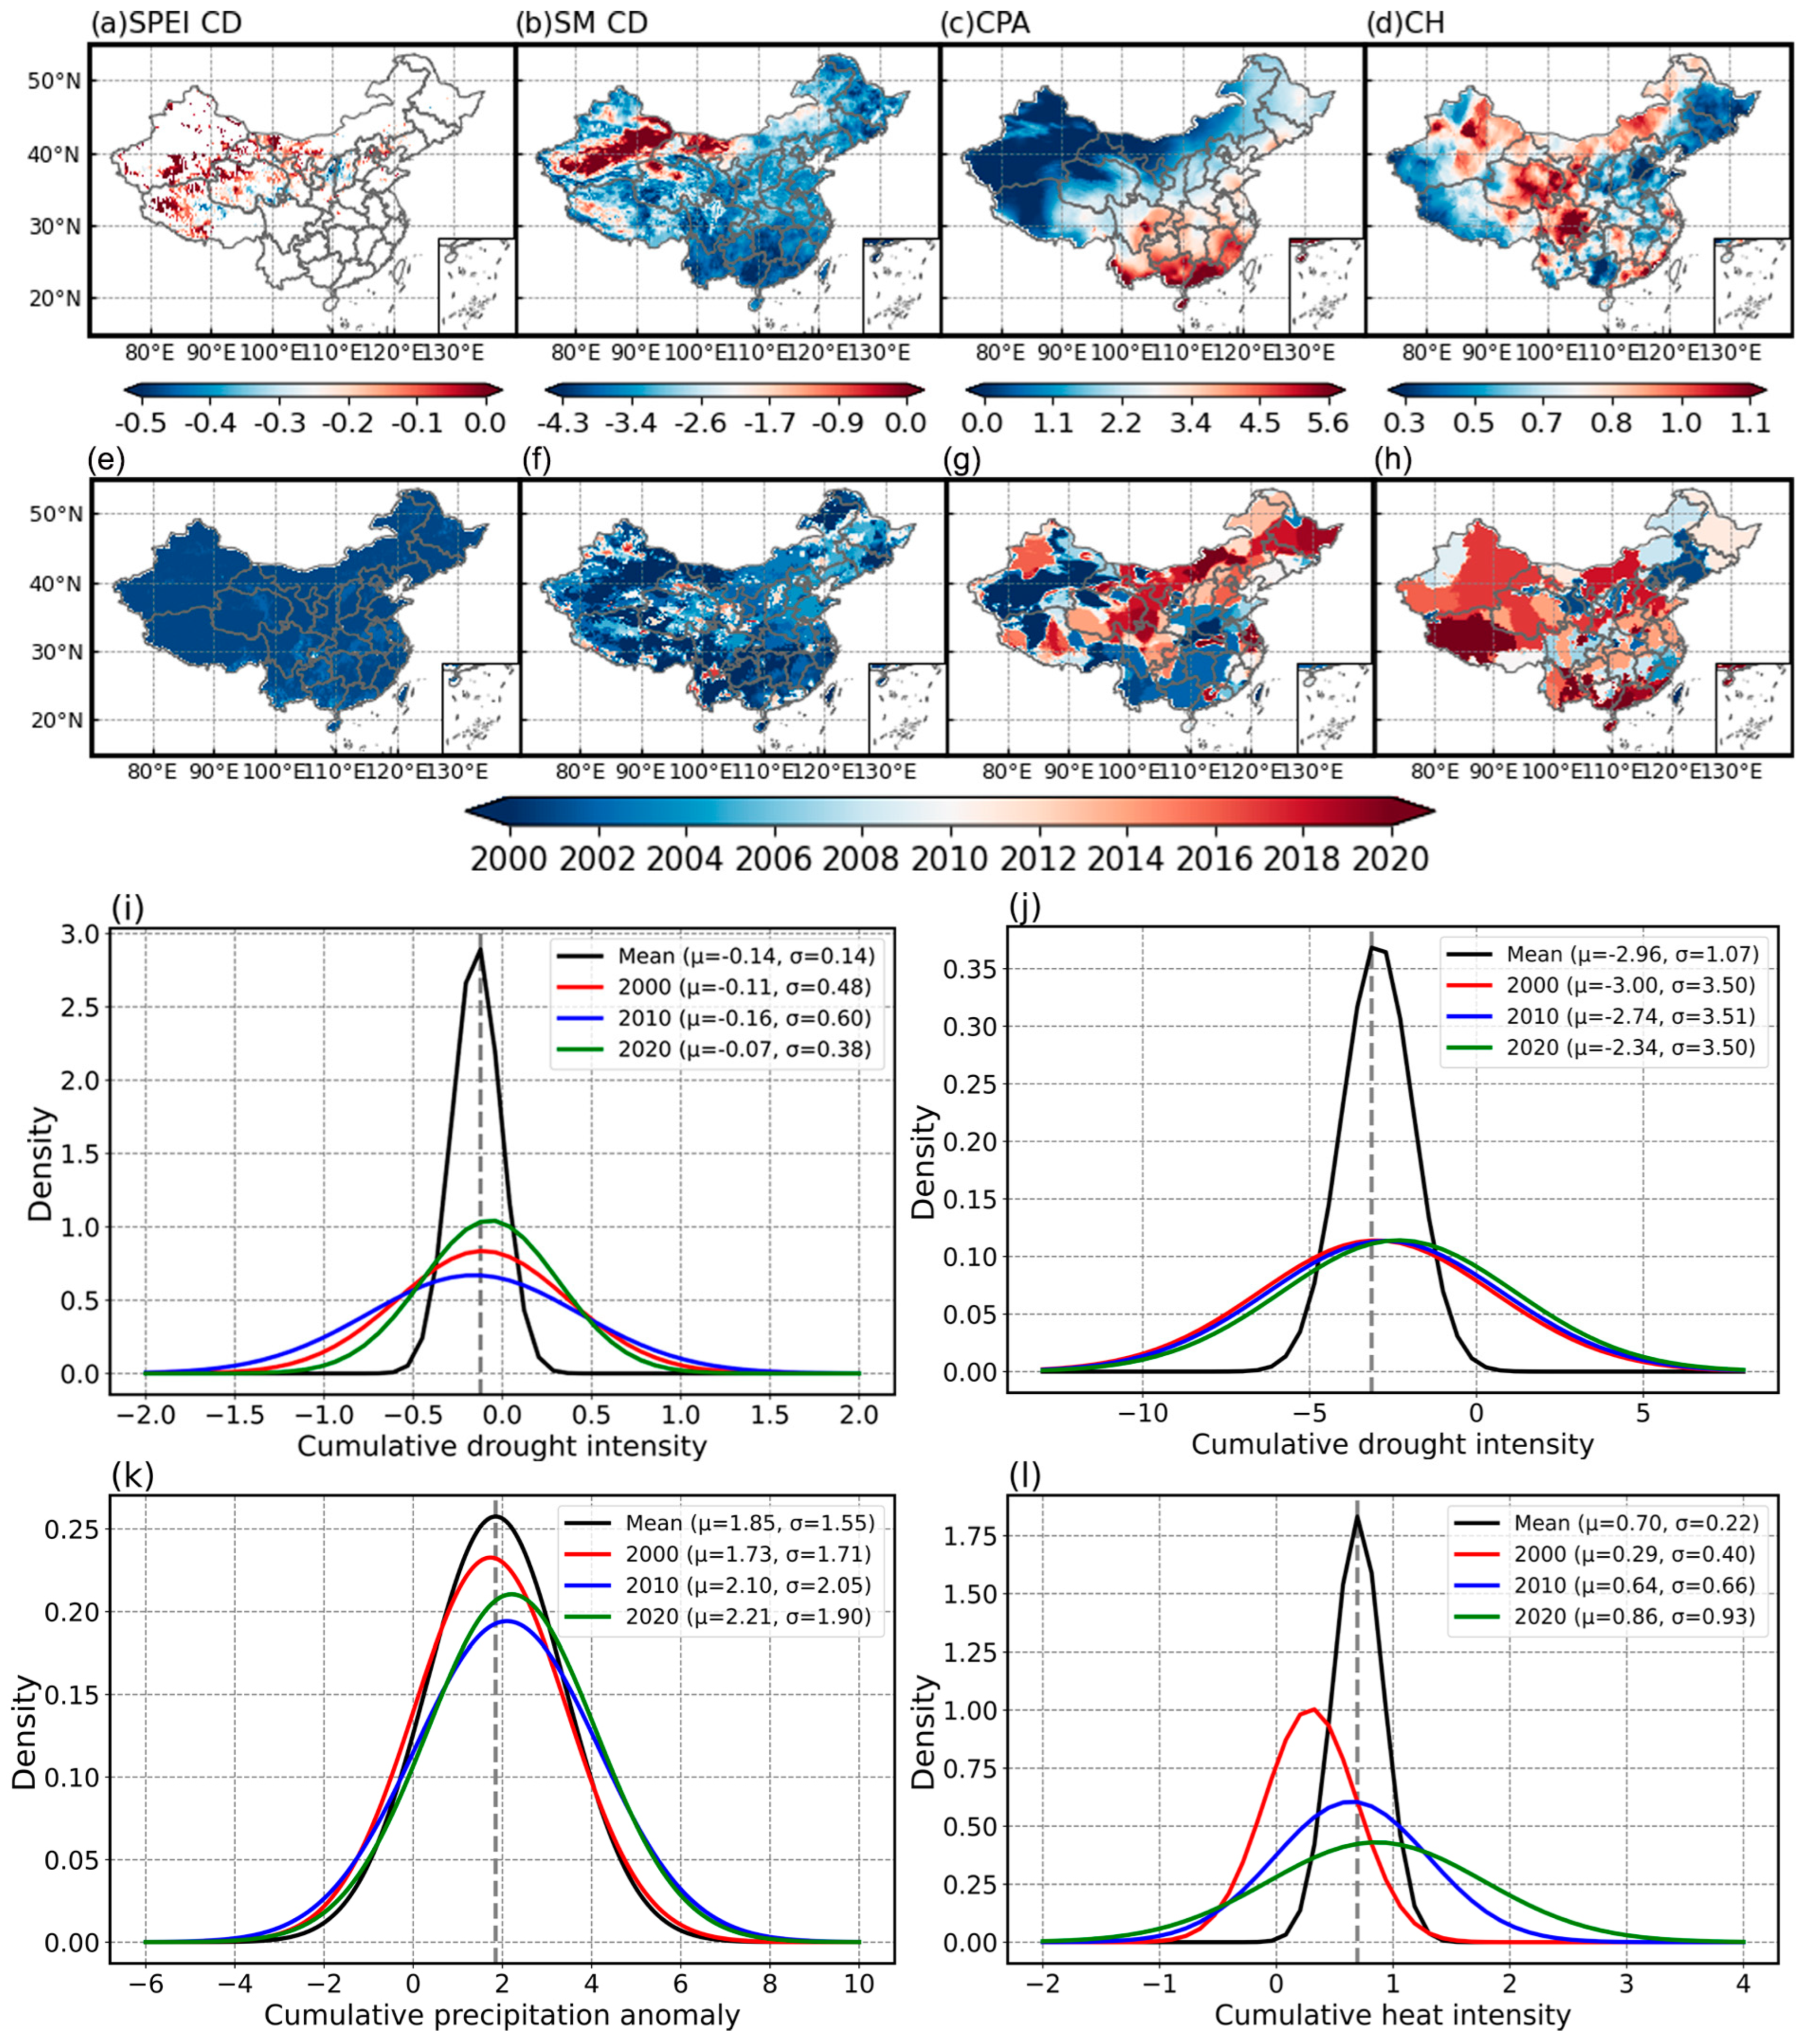
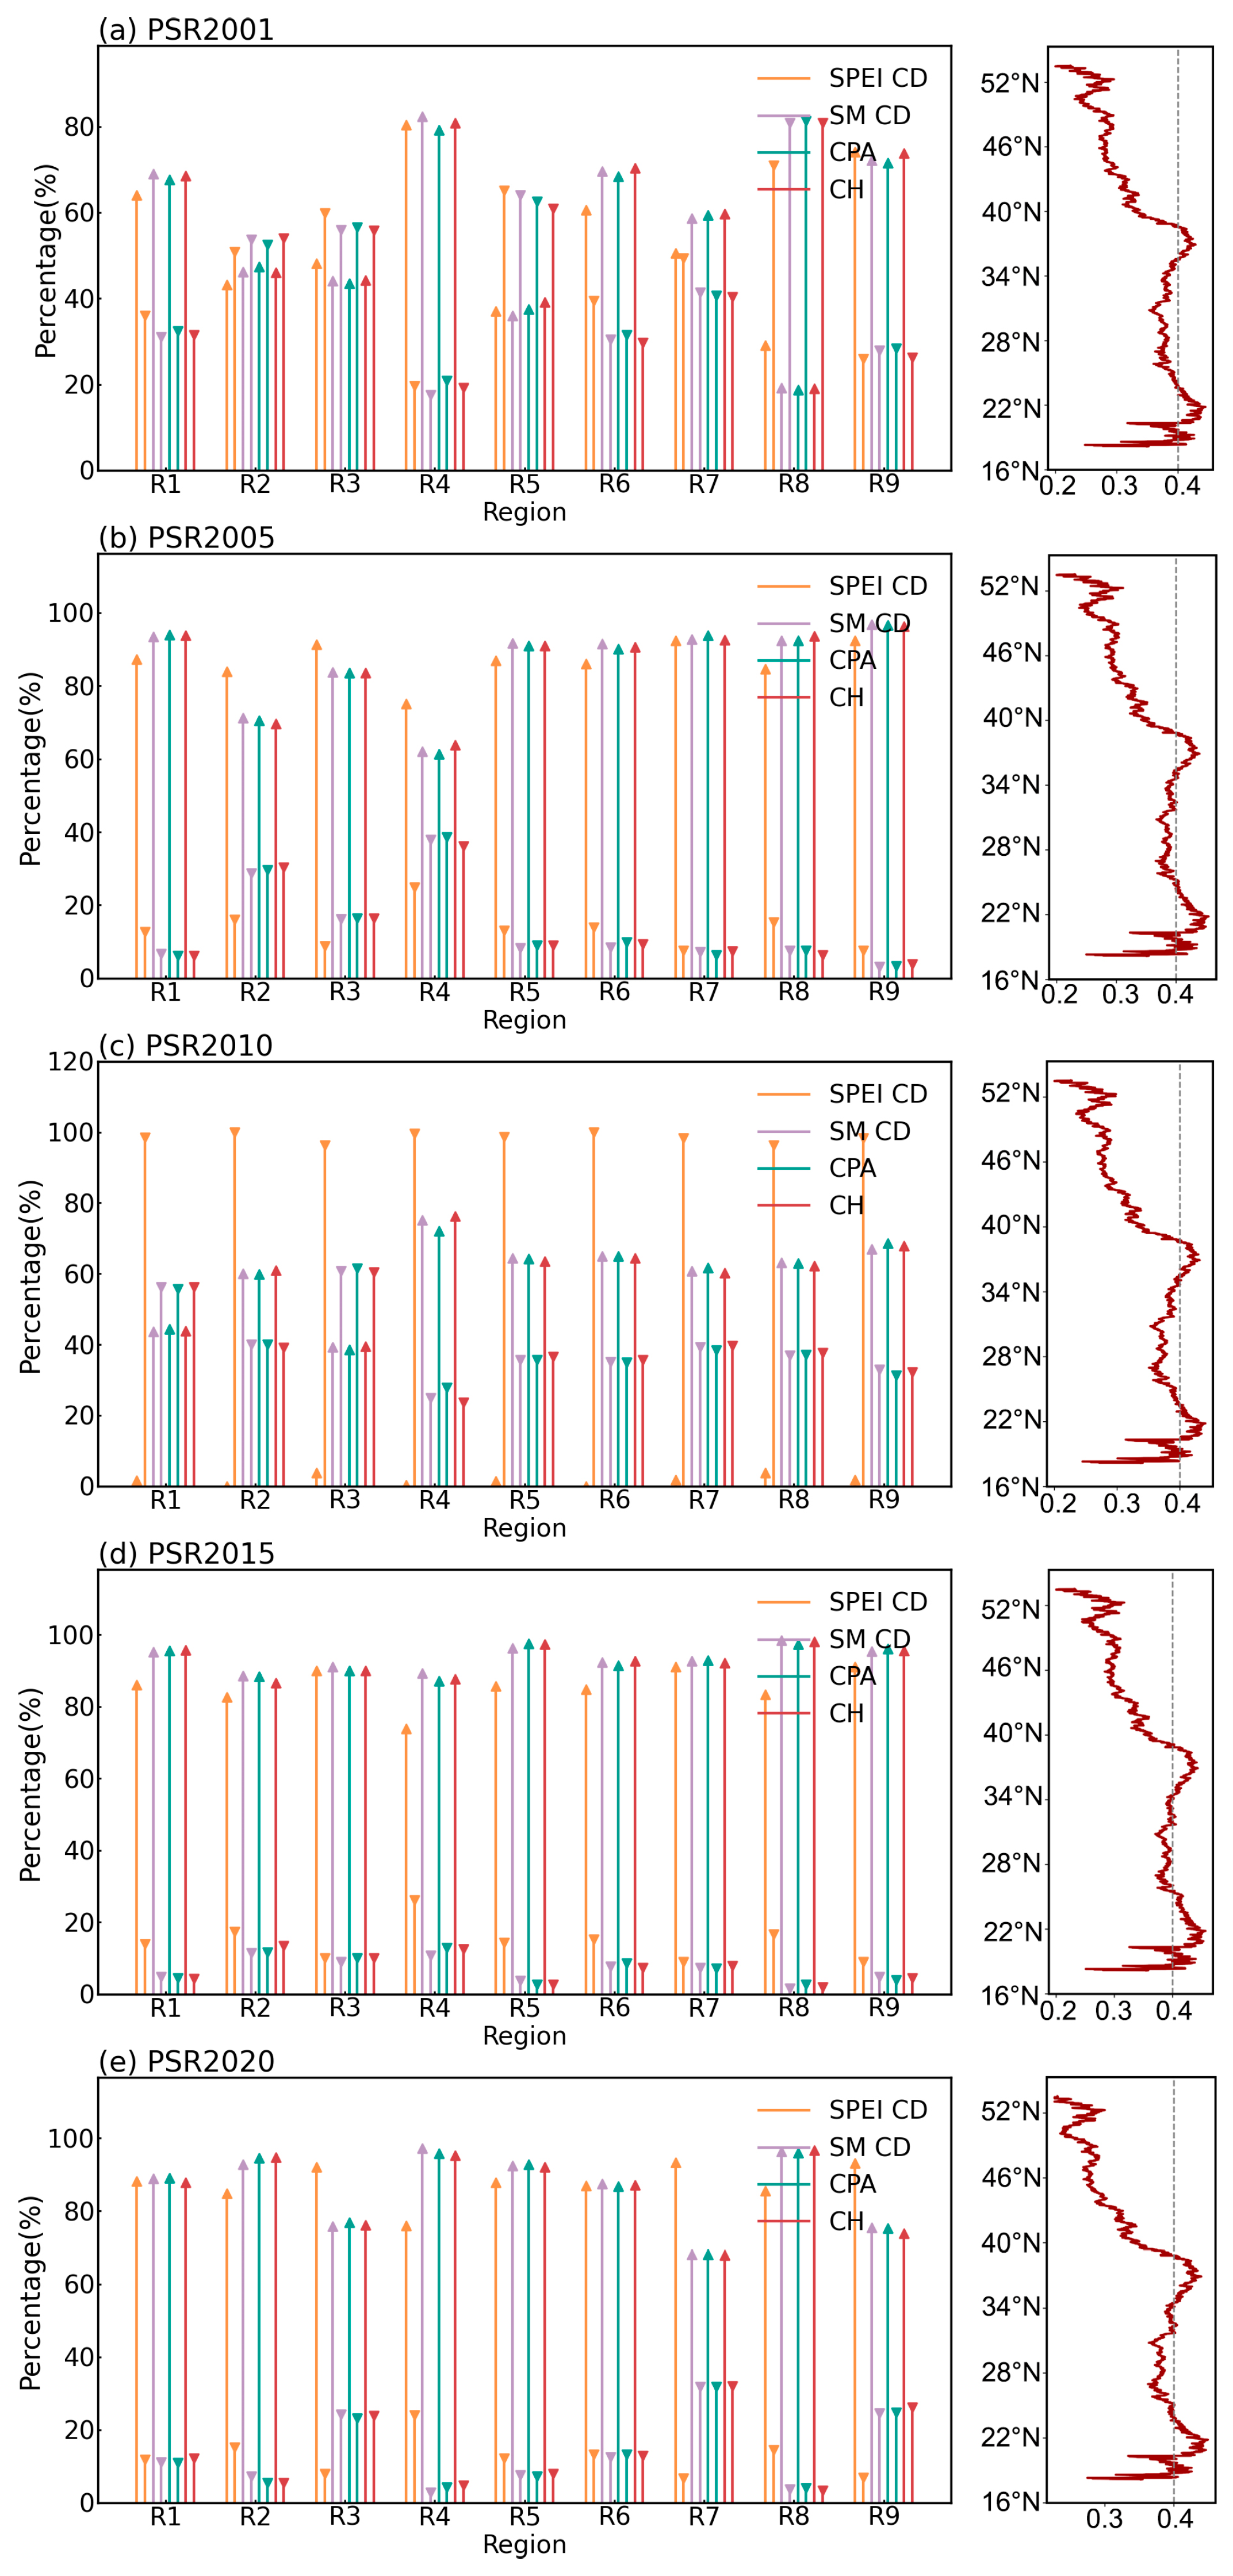
3.2. Characteristics of Stress Events

China is experiencing a trend of warming and increased humidity, particularly in the western regions where the climate has become more humid over the past decade [42]. Drought stress has shifted from widespread and stable to more extreme. The average impact area of SPEI CD stress is significantly smaller than that of SM CD, occurring only in parts of Tibet, Qinghai, and Shaanxi (Figure 6a). In 2019, the SPEI CD in the three northeastern provinces reached a peak drought intensity of −8.2965. SM CD reached its peak in 2001, impacting all regions except the Tarim Basin in Xinjiang, southwestern Tibet, parts of Qinghai, and western Inner Mongolia, and persisted throughout 2000 to 2020. In the three northeastern provinces, western Qinghai, Yunnan, western Sichuan, Guangxi, Hunan, and parts of Fujian, SM CD values exceeded −4. In 2008, the maximum intensity of SM CD reached −41.8675 (Figure 6b) with the most severe drought years concentrated before 2010. Notably, the Yunnan–Guizhou Plateau experienced severe drought stress in 2010 with Z values surpassing −20. However, in parts of Xinjiang, Tibet, Gansu, and Yunnan, the most intense drought stress occurred after 2010 (Figure 6f).
In the northern arid and semi-arid regions, influenced by a temperate continental climate, CPA is extremely low. As latitude decreases, CPA significantly increases in southern regions. The highest CPA was recorded in Guangxi in 2001 at 17.4597 m, while the lowest was in 2003 at 7.24901 m. After 2010, CPA decreased by an average of at least 61.02% compared to levels before 2010. Most parts of China experienced the strongest CPA post-2010, especially in the northern regions and the Northeast Plain (Figure 6c). Meanwhile, the average CH is relatively strong in central and eastern Xinjiang, most of Qinghai, Inner Mongolia, parts of Sichuan, Guangdong, and Yunnan. In 2020, the strongest CH was observed in Tibet, Yunnan, and south China, reaching 5.48 °C, exceeding the annual average CH (0.7 °C) by 4.78 °C (Figure 6d).
In 2020, CPA increased by 0.36 m to 2.21 m compared to the annual average of 1.85 m (Figure 6k), and it showed increases of 0.11 m and 0.48 m compared to 2010 (2.10 m) and 2000 (1.73 m), respectively. Correspondingly, drought stress as indicated by SPEI CD has generally declined over the past few decades, reaching its lowest average value of 0.07 in 2020 (Figure 6i). SM CD exhibited a similar downward trend, decreasing by 22% in 2020 compared to 2000 and by 20.67% relative to the annual average. Conversely, CH has continually increased over these decades, rising from 0.29 °C in 2000 to 0.86 °C in 2020, which is 22.85% higher than the annual average (Figure 6l).
Simultaneously, in 2020, the probability of CH occurring in SM CD was 36.75%, which was an increase of 27.09% from 2000 (9.66%) and 13.03% higher than the annual average (23.72%). From 2000 to 2020, stress events have gradually shifted toward a warm and humid trend with a higher frequency of occurrence near latitude 30–40° (Figure S7). This change is characterized by increased CPA and decreased SPEI CD and SM CD, which is consistent with the increase in atmospheric moisture and more intense water cycle processes induced by global warming.

3.3. Responses of Vegetation Health to Stress Events

3.3.1. Anomalies in Vegetation Health Due to Stress Events

In regions experiencing increased temperatures and decreased precipitation, there has been a significant rise in negative anomalies of vegetation health. In 2001, 53.99% of R2, 55.83% of R3, 60.84% of R5, and 80.9% of R8 experienced a decline in VHI (Figure 7a). Conversely, vegetation in other regions tended to remain healthy. By 2010, the area of vegetation health degradation due to SPEI CD had increased with 56.17% of R1 and 60.46% of R2 experiencing degradation (Figure 7c). However, in 2015 and 2020, all nine regions exhibited a continuous trend of healthy VHI (Figure 7d,e). With increasing latitude, especially above 38.17°, more pronounced VHI degradation was visible. The VHI in the R1 region was minimally affected by the four types of stress events, while the R2 and R3 regions were significantly impacted by SPEI CD. Vegetation in the R4 to R9 regions showed less variation in response to SM CD, CPA, and CH.

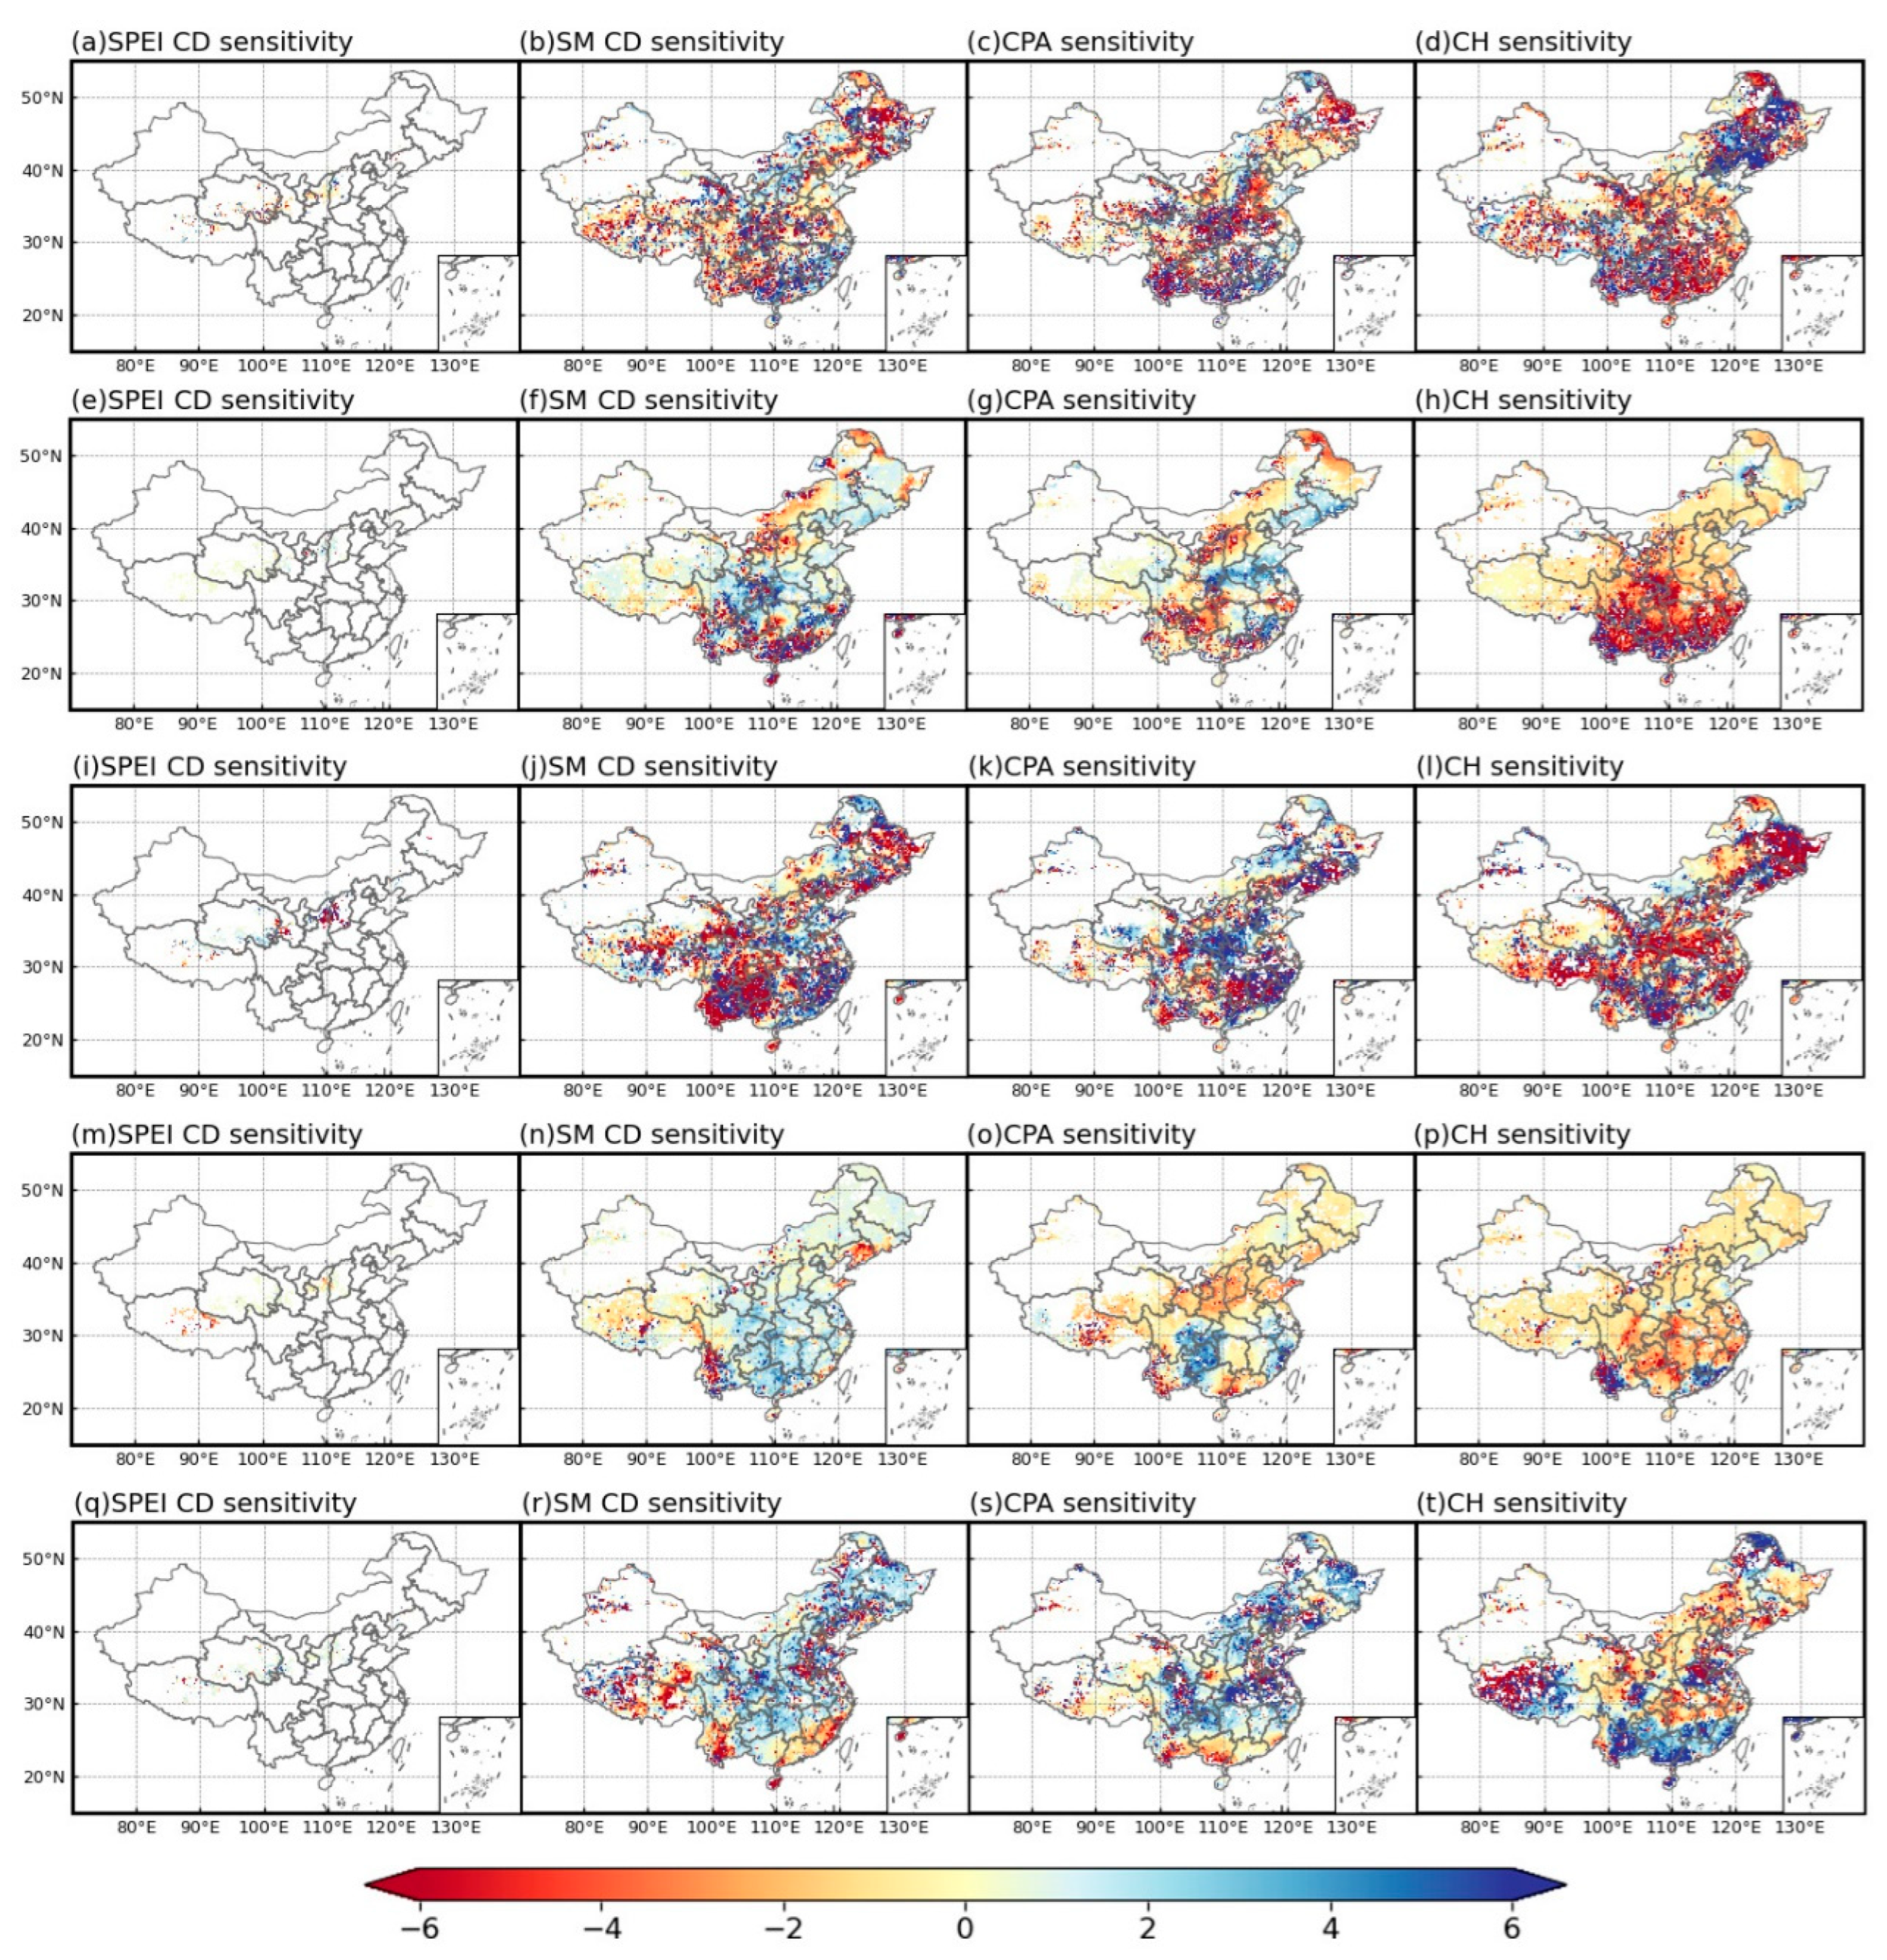
3.3.2. Vegetation Health Dominated by Negative Sensitivity to Stress Events

The VHI exhibits overall negative sensitivity to stress events. Specifically, the VHI shows almost no or negative sensitivity to SPEI CD (Figure 8a,e,i,m,q), while its sensitivity to SM CD, CPA, and CH stress events is very strong. In 2001, the Northeast Plain, in 2005, the South China region, and in 2010, the Yunnan–Guizhou Plateau and the Northeast Plain exhibited strong negative sensitivity of VHI to SM CD, with proportions reaching 47.47%, 35.63%, and 46.96%, respectively. However, in 2015 and 2020, this negative sensitivity significantly decreased or turned into positive sensitivity with the negative sensitivity proportions dropping to 23.67% and 32.67%, respectively. The South China region showed increasing negative sensitivity to SM CD, while the central and northern regions gradually shifted to positive sensitivity, indicating that SM CD stress is intensifying in South China while weakening in other regions (Figure 8b,f,i,n,r).
The negative sensitivity of VHI to CPA is primarily concentrated in the South China region and the Loess Plateau. In the South China region, extreme rainfall events and natural disasters such as typhoons negatively impact vegetation health. In the Loess Plateau, precipitation-induced soil erosion leads to vegetation degradation, thereby reducing vegetation health. In 2015, the negative sensitivity to CPA was significantly greater than the positive sensitivity, accounting for 67.82%, with the central and northern regions increasingly showing negative sensitivity of VHI to CPA.
CH exhibits the most pronounced sensitivity to vegetation health, with 59.21% of vegetation health nationwide showing negative sensitivity to CH. In 2005, 81.61% of VHI exhibited negative sensitivity to CH, which was particularly evident in regions below 35 degrees latitude. By 2015, the negative sensitivity of VHI to CH increased to 83.57%, significantly surpassing the negative sensitivity to other stress events, although no extreme phenomena were observed (Figure 8p). By 2020, 49.6% of regions displayed a positive sensitivity of VHI to CH, especially in South China, the Qinghai–Tibet Plateau, and parts of Heilongjiang. Overall, VHI’s negative sensitivity to CH is the most pronounced, aligning with the impacts of global warming.
In addition, this study analyzed the sensitivity of different vegetation types to various stress events. In 2001, the vegetation with the highest negative sensitivity to SM CD was MCBF, with a value of −39.22, followed by TK, which showed significant negative sensitivity to CH. Conversely, AV exhibited the strongest positive sensitivity to CH with a value of 9.7 (Figure 9a). In 2005, vegetation overall exhibited the strongest sensitivity to CH with TK demonstrating the most pronounced negative sensitivity and SL showing the highest positive sensitivity (Figure 9b). In 2010, MCBF and MD exhibited strong sensitivity to CH and SM CD, respectively. Specifically, AV had a negative sensitivity to CH reaching −39.19, while MD’s sensitivity to SM CD and CH was −15.54 and −15.78, respectively. SL’s sensitivity to SM CD also exceeded −15, whereas CV displayed a high positive sensitivity to SM CD of up to 22.25, reflecting its significant human influence and annual growth cycle (Figure 9c). Overall, vegetation demonstrated a strong positive sensitivity to CPA, with MD reaching 5.03. By 2020, vegetation displayed a general positive sensitivity to stress events with MCBF showing a notable positive sensitivity to SPEI CD of 24.15 (Figure 9e).
In summary, the sensitivity of VHI to stress events decreases in the following order: CH > CPA > SPEI-CD > SM. The sensitivity of vegetation to stress events follows this ranking: Meadow > Grassland > Cultivated Vegetation > Shrubland > Thicket > Broadleaf Forest > Coniferous Forest > Mixed Coniferous and Broadleaf Forest > Alpine Vegetation. Grasslands, meadows, and shrubland ecosystems typically have shallower root systems, which limit their ability to access deeper soil moisture during droughts, making them more sensitive to dry conditions. Extreme high temperatures and droughts can significantly increase the risk of natural disasters, such as fires, which not only damage vegetation but also alter soil properties and nutrient cycles, leading to long-term impacts on ecosystem recovery. Conversely, alpine vegetation usually experiences shorter growing seasons, which restricts its ability to accumulate resources and undergo physiological adjustments. When faced with extreme heat or drought, these plants are unable to rapidly adapt to abrupt environmental changes, weakening their resilience and recovery capacity, and ultimately impairing their survival [44].

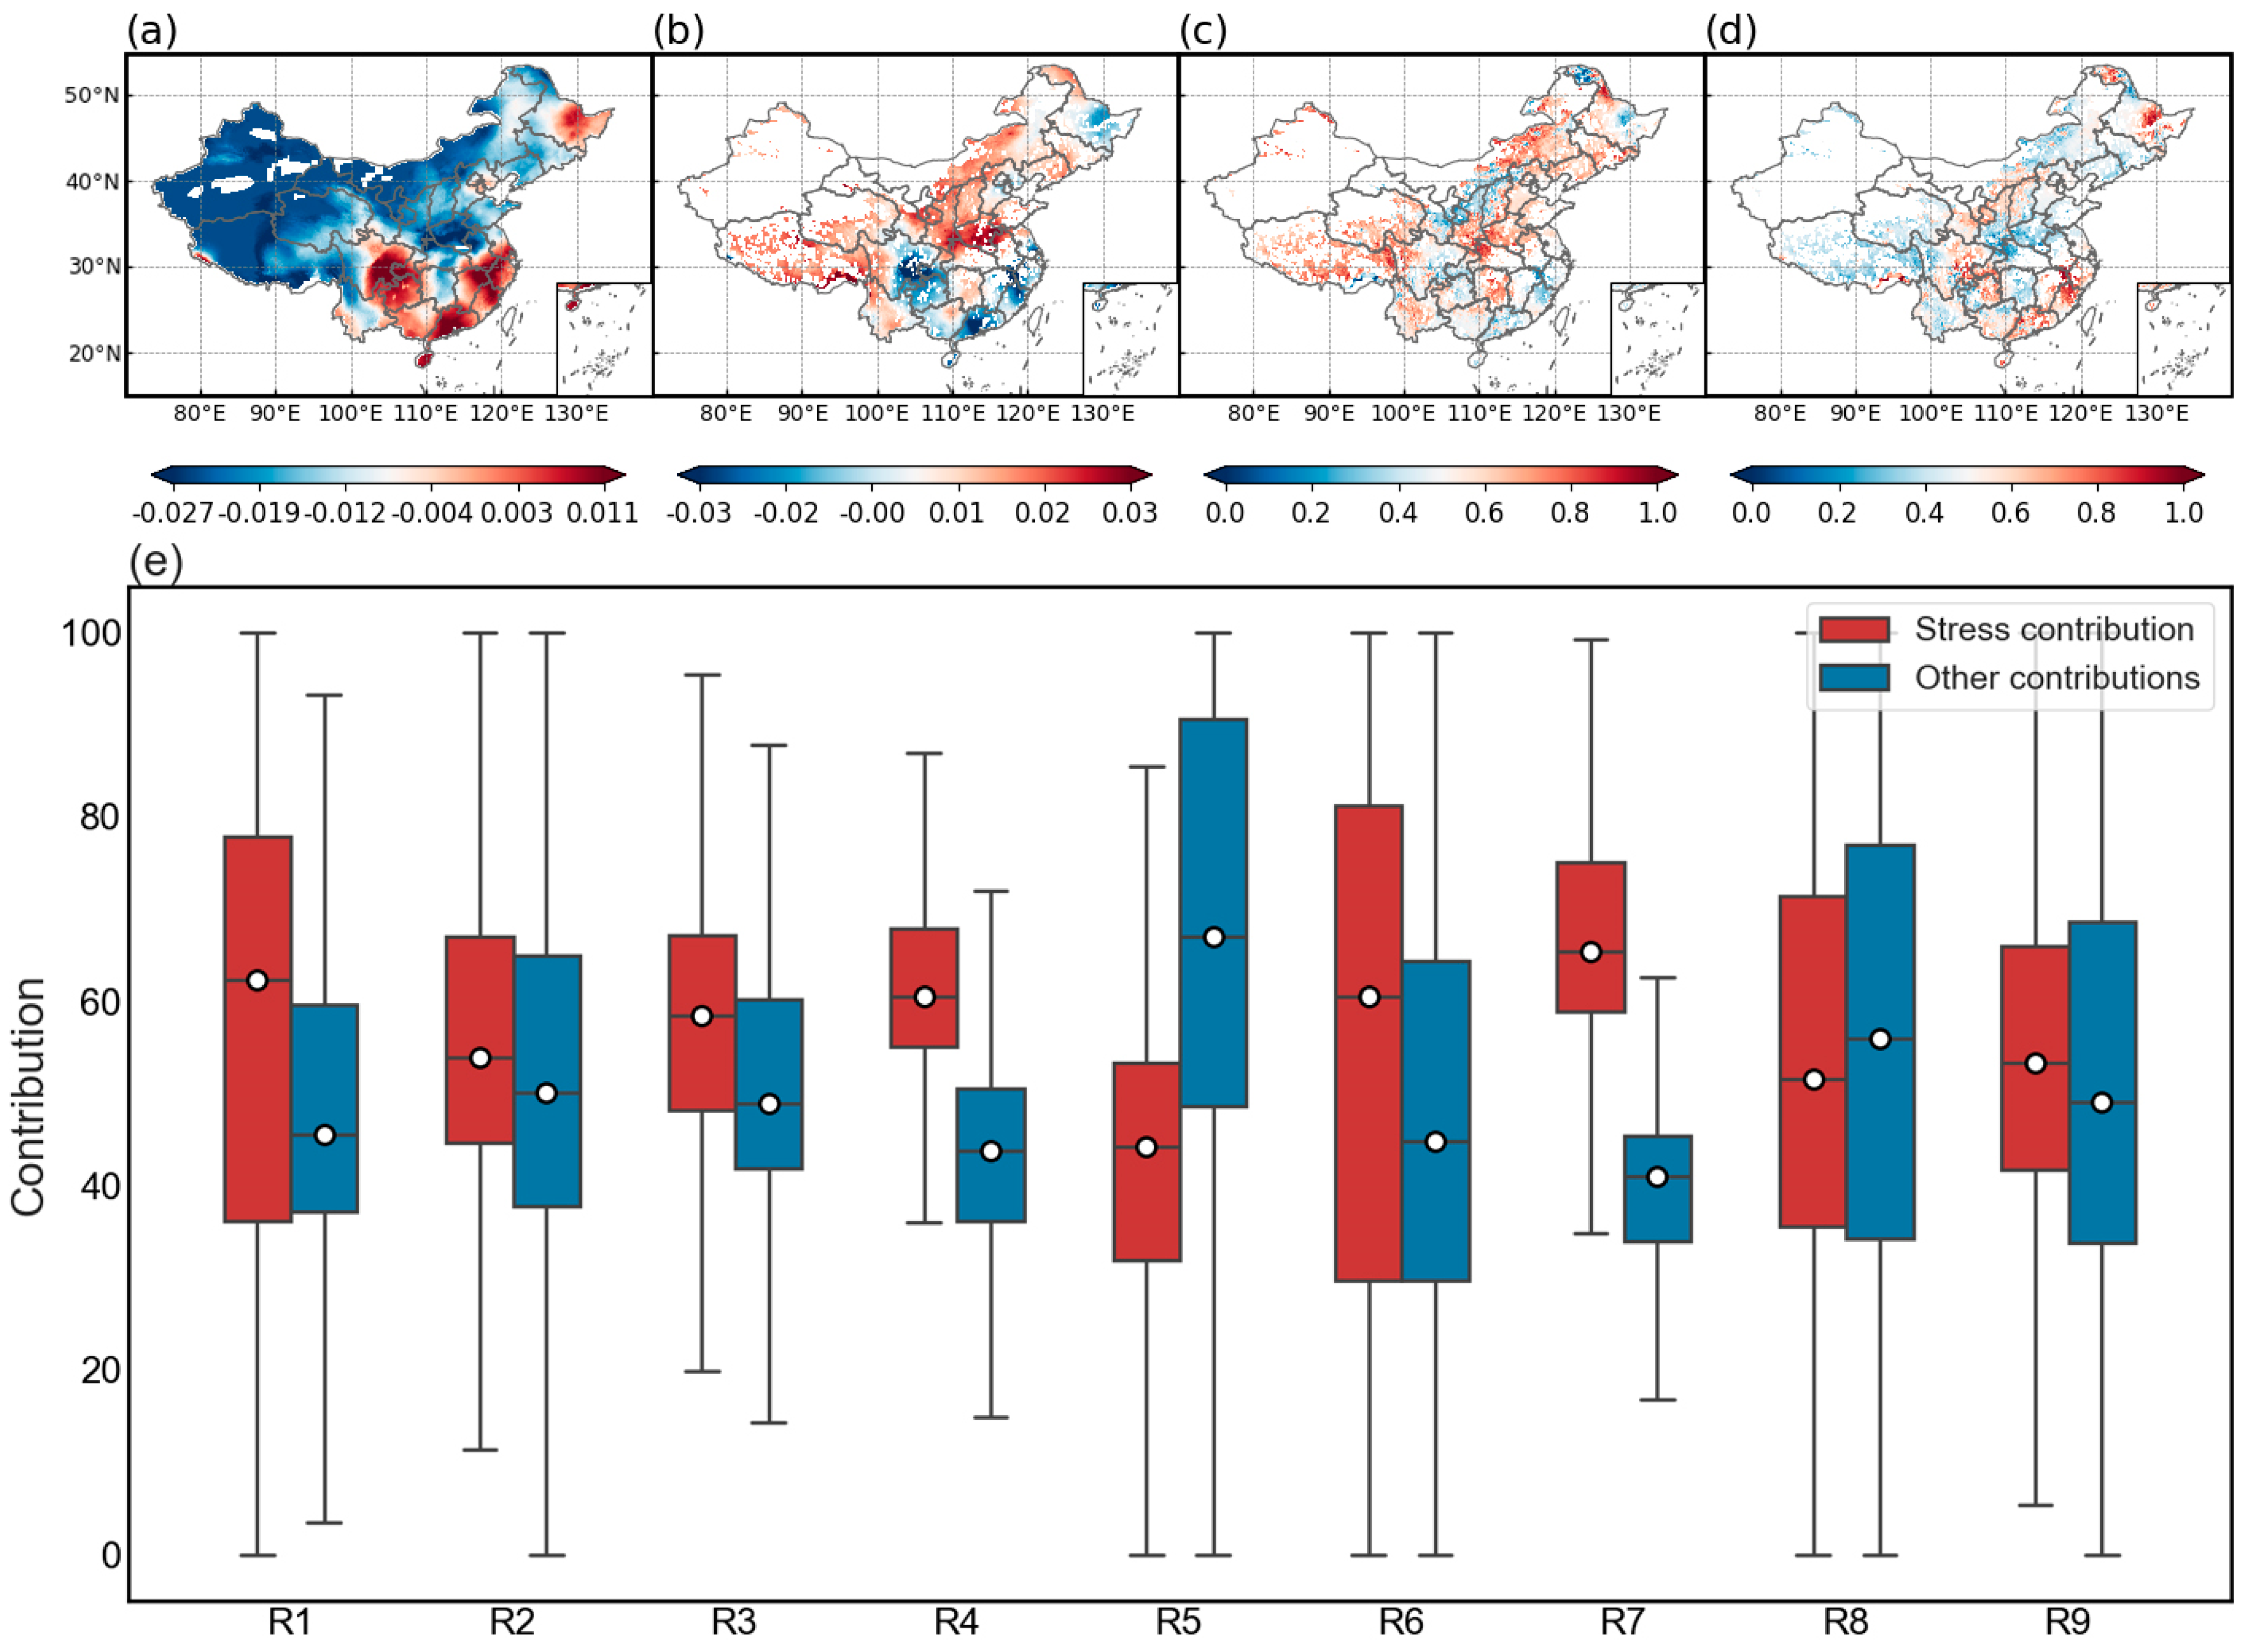
3.4. Stress Events Have a Greater Impact on Vegetation Health Compared to Other Factors

The predicted trends for stress events are predominantly negative, accounting for 85.64% of the cases. Excluding the Yunnan–Guizhou Plateau, South China, and parts of Heilongjiang, other regions show a negative trend with the maximum trend being −0.027·a−1 (Figure 10a,b). In contrast, other events exhibit an opposite trend, with the maximum trend reaching −0.03·a−1, representing 27.16% of the total. The contribution of stress events to vegetation health significantly exceeds that of other events, with areas where stress events contribute more than 50% accounting for 69.41% (Figure 10c,d). The contribution rates of stress events are the lowest in South China and the southern arid and semi-arid regions of northern China. Overall, except for R5, stress events contribute more than 50% to vegetation health across the country with R7 showing the highest contribution at 65.4%. Conversely, R5 exhibits the highest contribution from other events at 66.9%. The contribution rates of stress events across regions R1 to R9 are ranked as follows: R7 > R1 > R6 > R4 > R3 > R2 > R9 > R8 > R5. In R1, R6, and R8, stress events contribute up to 100% (Figure 10e).

4. Discussion

4.1. Evaluation of the Effectiveness and Trend Changes of Vegetation Health Assessment Systems

This study developed a comprehensive vegetation health assessment system to evaluate the health status of vegetation in China. We constructed vegetation health systems using CIM, TOPSIS, and PSR models, and we conducted fitting analysis with LAI, NPP, and SIF. To reveal the robustness and applicability of the models at different time points, this study systematically and comprehensively evaluated the optimal model for constructing a vegetation health system using a combined analysis of R2 and Pearson correlation coefficients (r). In nonlinear fitting, R2 was used to assess the effectiveness of the vegetation health models. The results indicated that the overall R2 of the PSR model was higher than that of the CIM and TOPSIS models. Specifically, the PSR model better captured the relationships between VHI and LAI, NPP, and SIF, whereas the CIM and TOPSIS models relied more on linear assumptions, potentially overlooking key nonlinear mechanisms in vegetation health responses. Particularly for the SIF indicator, the PSR model achieved an R2 as high as 0.74 (2001). Therefore, the PSR model demonstrates stronger reliability in constructing VHI evaluations. Compared to models CIM and TOPSIS, the PSR model stands out for its comprehensiveness and systematic approach. The CIM often focuses on specific causal relationships, potentially overlooking multidimensional influencing factors, while TOPSIS prioritizes ranking alternatives based on similarity, which, although useful for decision making, fails to fully account for the interactions and feedback across different levels in ecosystems affected by multiple environmental factors. Through its hierarchical analytical structure, the PSR model better captures the complex relationships among various pressure sources, vegetation states, and responses, thereby providing a more accurate and comprehensive assessment of vegetation health. Thus, the vegetation health assessment system based on the PSR model was used for subsequent research.
The analysis revealed significant trends in VHI. In the Tibetan Plateau and northern arid regions, VHI showed a significant decline with the maximum change trend being −0.002·a−1. Conversely, the Yunnan–Guizhou Plateau, South China, and the Loess Plateau exhibited an increasing VHI trend. This indicates that increased precipitation has provided favorable conditions for vegetation growth and recovery in these regions [45].

4.2. Characteristics of Stress Events and Their Impact on Vegetation Health

Various mechanisms such as drought, heat, and wet stress have physiological and yield impacts on vegetation [46]. We focus on the dynamics of vegetation health under drought, wet, and heat stresses. The results indicate that the probability of simultaneous occurrence of drought and heat stress events has gradually increased [47], and drought stress events have gradually weakened from 2001 to 2020, while wet stress has increased. Climate stress events are shifting toward a warmer and wetter pattern with increasing extremity, particularly in northern regions. Recent studies suggest that extreme heat can enhance precipitation, as warmer air carries and transports 7% more water vapor per degree Celsius, leading to heavier rainfall intensity, especially on hourly to daily scales [48]; this increases the frequency and synchronicity of extreme events. Meanwhile, low CPA leads to frequent occurrences of low VHI in the northern arid and semi-arid regions of China and the Tibetan Plateau despite the frequent extreme heat stress events in the South China and Yangtze River Basin regions [49]. However, they still maintain a high VHI due to ample precipitation. High temperatures can directly affect the efficiency of photosynthesis in plants, and when temperatures exceed a certain threshold, the enzyme activity in plant chloroplasts is inhibited, impacting the formation of photosynthetic products. Heat waves increase the transpiration rate, and if water is not replenished in time, it leads to a decline in plant water potential, significantly affecting cell expansion and growth. In water-scarce drought conditions, vegetation closes stomata to reduce water loss, limiting CO2 intake. Similar to heat stress, if conditions exceed a certain threshold, plants cannot complete carbon absorption, resulting in decreased productivity [50,51]. However, if water is replenished in a timely manner, vegetation can quickly return to a normal state due to its inherent recovery ability and physiological resilience [52,53].
The response of vegetation growth to heat stress and drought stress varies among different ecosystem types. Our results generally show that forest ecosystems are less sensitive to stress events compared to non-forest ecosystems, which is likely due to the following mechanisms. Responses of vegetation types to drought stress are closely linked to their water demand and root system structure. MCBF and BF, characterized by high transpiration rates and biomass, exhibit significant sensitivity under drought conditions. Drought reduces soil water availability, suppressing photosynthesis and transpiration, which directly lowers carbon sequestration and increases risks of leaf shedding and tree mortality [54]. In contrast, CF, with its lower transpiration rates and higher water-use efficiency, demonstrates greater tolerance to drought. GL and MD, heavily reliant on surface soil moisture due to their shallow root systems, experience pronounced declines in productivity under drought, thereby weakening their carbon sink capacity [55]. AV, adapted to arid environments with deep root structures and water storage mechanisms, shows robust drought tolerance. In contrast, wet stress causes significant impacts on vegetation health due to excessive soil moisture and oxygen deficiency. BF and MCBF are particularly sensitive to wet stress, as oxygen limitation in saturated soils restricts root respiration and increases vulnerability to root rot, impairing overall vegetation health [56]. Similarly, GL and MD are highly sensitive to wet stress, where excessive moisture promotes the expansion of wet-tolerant species, altering native community structures and reducing ecosystem productivity and stability [57]. While AV is well adapted to extreme conditions, prolonged precipitation under wet stress, especially in specific topographic settings, may result in nutrient leaching and restricted productivity. Notably, heat stress negatively affects all vegetation types but varies in magnitude. Forest ecosystems, such as MCBF and BF, may undergo shifts in species composition and reduced carbon sink capacity under prolonged heat stress. Elevated temperatures accelerate respiration and suppress photosynthesis, directly reducing carbon fixation [58]. GL and MD may experience severe species loss and altered community functions under heat stress, further compromising their ecosystem services [59,60]. Although AV is more resilient to heat stress due to long-term adaptation to low-temperature environments, extreme heat can still damage its photosystem.
Moreover, global climate change has intensified the frequency of stress events, resulting in increased negative anomalies in vegetation health. This is particularly evident under warm and humid climatic conditions, where vegetation exhibits heightened sensitivity to moisture and temperature changes [61]. The differences in vegetation responses to stress across regions are primarily determined by their respective geographic and climatic characteristics [62,63]. For example, vegetation in the northern arid and semi-arid regions, having adapted to low precipitation over the years, exhibits lower positive sensitivity to CPA stress. In contrast, vegetation in more humid areas, such as South China, may display higher positive sensitivity to the same stress. These differences manifest as significant spatial heterogeneity, with certain areas like the Northeast Plain, Huang–Huai–Hai Plain, and Yunnan–Guizhou Plateau showing more pronounced sensitivity to specific stresses. Additionally, residual analysis based on the linear relationship between climate variables and vegetation, due to its simplicity and ease of use, is widely employed to separate the contributions of climate change and human activities to vegetation. As the impact of global climate change intensifies, contributions from stress events and other factors to vegetation should also be considered.
Our results indicate that stress events play a dominant role in influencing vegetation health, whereas the effects of other factors, such as human activities, are gradually diminishing. The abrupt nature of these stress events impairs the ability of vegetation to adjust its physiological activities. SM CD causes difficulties in water uptake by vegetation roots, and CH reduces the normal physiological functioning of vegetation leaves exposed to the air. The concurrent occurrence of stress events exerts cumulative negative impacts on vegetation growth [64], ultimately leading to a decline in vegetation health.

4.3. Uncertainty Analysis

This study also has certain uncertainties. Firstly, vegetation health is influenced by multiple factors, including natural factors such as temperature, precipitation, and humidity, as well as human activities. Although the vegetation health system constructed in this study aims to cover all potential influencing factors, many factors are still excluded due to data limitations, which may lead to discrepancies between the study results and the actual vegetation health status. Secondly, this study used modified residuals to analyze the impact of stress events on vegetation health. However, when distinguishing between the attribution and contribution of stress events and other events, it is challenging to draw clear boundaries. Human activities, such as urbanization, may exacerbate the occurrence of stress events. To address this issue, future research should focus on identifying and accumulating data that are more sensitive to the impacts on vegetation health. Finally, compared to previous studies, our paper lacks an in-depth investigation into the recovery mechanisms following the impacts of stress events. In the future, research will focus on the finer-scale effects of such events on vegetation health and their recovery mechanisms [65].

5. Conclusions

This study developed a vegetation health assessment system for China using the CIM, TOPSIS, and PSR models. Through comprehensive evaluation and fitting with LAI, NPP, and SIF, the PSR model was selected as the preferred framework for assessing vegetation health. The highlight of this study lies in exploring the response of vegetation health in China to stress events by incorporating drought, wet stress, and heat stress into the modified residual analysis, providing valuable insights for promoting regional ecological construction and the sustainable development of vegetation ecosystems. The main conclusions are as follows:
(1)
VHI levels in eastern China are higher than in the western regions, and they exhibit a significant upward trend as a whole. The frequency of drought stress occurring alongside heat stress is gradually increasing, but there is a trend toward a warmer and wetter climate with climate change becoming increasingly extreme.
(2)
Among the vegetation types, meadows, grasslands, and cultivated vegetation are most sensitive to stress events with CH having a greater impact on vegetation health than other stress events. Regionally, vegetation health is most affected by stress events in areas R4 and R8 with a significant decline in vegetation health occurring at latitudes greater than 35°.
(3)
The contribution of stress events to vegetation health is predominant and may continue to increase in the future.
The study offers policy-oriented recommendations for precision ecological management, including prioritizing the restoration of grassland and meadow ecosystems, enhancing monitoring in alpine regions, and developing region-specific vegetation protection and restoration strategies tailored to local climatic conditions.

Supplementary Materials

The following supporting information can be downloaded at https://www.mdpi.com/article/10.3390/f16010038/s1, Figure S1: Spatial distribution of stress from 2000 to 2019; Figure S2: Spatial distribution of pressure from 2000 to 2019; Figure S3: Spatial distribution of response from 2000 to 2019; Figure S4: Spatial distribution of vegetation health evaluation system constructed using Comprehensive Index Method; Figure S5: Spatial distribution of vegetation health evaluation system constructed using TOPSIS; Figure S6: Spatial distribution of vegetation health evaluation system constructed using PSR; Figure S7: Frequency of stress events by latitude from 2000 to 2020. (a–d) Represent SPEI CD, SM CD, CPA, and CH, respectively; Table S1: Abbreviations and full name in the article; Table S2: Indicator weights.

Author Contributions

P.M.: conceptualization, methodology, software, writing—review and editing. J.P.: formal analysis, supervision, funding acquisition. J.Z.: writing—review and editing, visualization, supervision, funding. L.L.: methodology, formal analysis, supervision. X.Y.: methodology, resources, supervision. W.L.: resources, supervision. All authors have read and agreed to the published version of the manuscript.

Funding

This study was funded by the Commissioned Project of Xinjiang Grassland General Station (202334140016).

Data Availability Statement

Temperature is sourced from http://www.geodata.cn/data/datadetails.html?dataguid=67669514169502&docId=4 (accessed on 12 March 2024). Precipitation is sourced from https://www.geodata.cn/data/datadetails.html?dataguid=113786088533256&docId=6 (accessed on 12 March 2024). 2 m temperature is sourced from https://cds.climate.copernicus.eu/datasets/reanalysis-era5-land-monthly-means?tab=overview (accessed on 12 March 2024). GPP is sourced from https://lpdaac.usgs.gov/products/mod17a2hv061/ (accessed on 6 May 2023). Land Surface Temperature, Surface Runoff, and Relative Humidity are sourced from https://cds.climate.copernicus.eu/#!/home (accessed on 15 March 2024). Transpiration and Soil Moisture (SM) are sourced from https://www.gleam.eu/ (accessed on 17 March 2024). Slope and DEM are sourced from https://www.gscloud.cn/ (accessed on 18 March 2024). PM2.5 is sourced from https://data.tpdc.ac.cn/ (accessed on 18 March 2024). PDSI is sourced from https://crudata.uea.ac.uk/cru/data/drought/#global (accessed on 18 March 2024). Nighttime Light is sourced from http://nnu.geodata.cn/data/datadetails.html?dataguid=8213124601985&docid=0 (accessed on 20 March 2024). Soil properties are sourced from https://data.tpdc.ac.cn/zh-hans/data/8ba0a731-5b0b-4e2f-8b95-8b29cc3c0f3a (accessed on 20 March 2024). GDP and Tertiary Industry Added Value are sourced from https://github.com/thestarlab/ChinaGDP (accessed on 25 March 2024). Population density is sourced from https://landscan.ornl.gov (accessed on 25 March 2024). NDVI is sourced from https://www.geodata.cn/main/#/face_science_detail?guid=197351408897313 (accessed on 30 March 2024). LAI is sourced from https://doi.org/10.3974/geodb.2023.10.03.V1 (accessed on 30 March 2024). SIF is sourced from https://cstr.cn/18406.11.Ecolo.tpdc.271751 (accessed on 3 April 2024). NPP is sourced from https://www.plantplus.cn (accessed on 3 April 2024). The 1:1,000,000 Vegetation Types in China dataset is sourced from https://www.plantplus.cn (accessed on 5 April 2024).

Conflicts of Interest

The authors declare no conflicts of interest.

References

  1. Kogan, F.; Yang, B.; Wei, G.; Pei, Z.; Jiao, X. Modelling Corn Production in China Using AVHRR-Based Vegetation Health Indices. Int. J. Remote Sens. 2005, 26, 2325–2336. [Google Scholar] [CrossRef]
  2. Pei, F.; Wu, C.; Liu, X.; Xia, L.; Yang, K.; Zhou, Y.; Wang, K.; Xu, L.; Xia, G. Monitoring the Vegetation Activity in China Using Vegetation Health Indices. Agric. For. Meteorol. 2018, 248, 215–227. [Google Scholar] [CrossRef]
  3. Calvin, K.; Lee, H.; Romero, J.; Dasgupta, D.; Krinner, G.; Mukherji, A.; Thorne, P.; Trisos, C.; Aldunce, P.; Barret, K.; et al. Climate Change 2023: Synthesis Report. Contribution of Working Groups I, II and III to the Sixth Assessment Report of the Intergovernmental Panel on Climate Change; IPCC: Geneva, Switzerland, 2023. [Google Scholar] [CrossRef]
  4. Perkins-Kirkpatrick, S.E.; Lewis, S.C. Increasing Trends in Regional Heatwaves. Nat. Commun. 2020, 11, 3357. [Google Scholar] [CrossRef] [PubMed]
  5. Deng, Y.; Wang, X.; Wang, K.; Ciais, P.; Tang, S.; Jin, L.; Li, L.; Piao, S. Responses of Vegetation Greenness and Carbon Cycle to Extreme Droughts in China. Agric. For. Meteorol. 2021, 298–299, 108307. [Google Scholar] [CrossRef]
  6. Ghanbari, M.; Arabi, M.; Georgescu, M.; Broadbent, A.M. The Role of Climate Change and Urban Development on Compound Dry-Hot Extremes across US Cities. Nat. Commun. 2023, 14, 3509. [Google Scholar] [CrossRef] [PubMed]
  7. Li, X.; Piao, S.; Huntingford, C.; Peñuelas, J.; Yang, H.; Xu, H.; Chen, A.; Friedlingstein, P.; Keenan, T.F.; Sitch, S.; et al. Global Variations in Critical Drought Thresholds That Impact Vegetation. Natl. Sci. Rev. 2023, 10, nwad049. [Google Scholar] [CrossRef] [PubMed]
  8. Li, X.; He, D.; Chen, G.; Yang, J.; Yang, Z.; Guo, X.J.; Wang, C.; Zhu, S.; Huang, Y.; Chen, H.; et al. Responses of Leaf Functional Traits to Different Hydrological Regimes and Leaf Economics Spectrum in the Water Level Fluctuation Zone of Three Gorges Reservoir, China. Front. Plant Sci. 2022, 13, 939452. [Google Scholar] [CrossRef] [PubMed]
  9. Piao, S.; Zhang, X.; Chen, A.; Liu, Q.; Lian, X.; Wang, X.; Peng, S.; Wu, X. The Impacts of Climate Extremes on the Terrestrial Carbon Cycle: A Review. Sci. China Earth Sci. 2019, 62, 1551–1563. [Google Scholar] [CrossRef]
  10. Zhao, J.; Lu, Z.; Wang, L.; Jin, B. Plant Responses to Heat Stress: Physiology, Transcription, Noncoding RNAs, and Epigenetics. Int. J. Mol. Sci. 2020, 22, 117. [Google Scholar] [CrossRef] [PubMed]
  11. Zhao, L.; Chen, D. Dynamic Assessment of Alpine Pasture Grassland Ecosystem Health: A Case Study from the Gannan Region. Pratacultural Sci. 2017, 34, 16–29. [Google Scholar] [CrossRef]
  12. Ciais, P.; Reichstein, M.; Viovy, N.; Granier, A.; Ogée, J.; Allard, V.; Aubinet, M.; Buchmann, N.; Bernhofer, C.; Carrara, A.; et al. Europe-Wide Reduction in Primary Productivity Caused by the Heat and Drought in 2003. Nature 2005, 437, 529–533. [Google Scholar] [CrossRef] [PubMed]
  13. Ji, Y.; Zhou, G.; Luo, T.; Yakir, D.; Zhou, L.; Lv, X. Variation of Net Primary Productivity and Its Drivers in China’s Forests during 2000–2018. For. Ecosyst. 2020, 7, 15. [Google Scholar] [CrossRef]
  14. Wang, F.; Wang, Z.; Yang, H.; Zhao, Y. Study of the Temporal and Spatial Patterns of Drought in the Yellow River Basin Based on SPEI. Sci. China Earth Sci. 2018, 61, 1098–1111. [Google Scholar] [CrossRef]
  15. Li, X.; Meng, X.; Ji, X.; Zhou, J.; Pan, C.; Gao, N. Zoning Technology for the Management of Ecological and Clean Small-Watersheds via k-Means Clustering and Entropy-Weighted TOPSIS: A Case Study in Beijing. J. Clean. Prod. 2023, 397, 136449. [Google Scholar] [CrossRef]
  16. Fathi-Taperasht, A.; Shafizadeh-Moghadam, H.; Kouchakzadeh, M. MODIS-based evaluation of agricultural drought, water use efficiency, and post-drought in Iran: Considering the influence of heterogeneous climatic regions. J. Clean. Prod. 2022, 374, 133836. [Google Scholar] [CrossRef]
  17. Funk, C.; Dettinger, M.D.; Michaelsen, J.C.; Verdin, J.P.; Brown, M.E.; Barlow, M.; Hoell, A. Warming of the Indian Ocean Threatens Eastern and Southern African Food Security but Could Be Mitigated by Agricultural Development. Proc. Natl. Acad. Sci. USA 2008, 105, 11081–11086. [Google Scholar] [CrossRef] [PubMed]
  18. Rowhani, P.; Lobell, D.B.; Linderman, M.; Ramankutty, N. Climate Variability and Crop Production in Tanzania. Agric. For. Meteorol. 2011, 151, 449–460. [Google Scholar] [CrossRef]
  19. Sutanto, S.J.; Vitolo, C.; Di Napoli, C.; D’Andrea, M.; Van Lanen, H.A.J. Heatwaves, Droughts, and Fires: Exploring Compound and Cascading Dry Hazards at the Pan-European Scale. Environ. Int. 2020, 134, 105276. [Google Scholar] [CrossRef]
  20. Sauter, C.; Fowler, H.J.; Westra, S.; Ali, H.; Peleg, N.; White, C.J. Compound Extreme Hourly Rainfall Preconditioned by Heatwaves Most Likely in the Mid-Latitudes. Weather. Clim. Extrem. 2023, 40, 100563. [Google Scholar] [CrossRef]
  21. Schweiger, R.; Maidel, A.-M.; Renziehausen, T.; Schmidt-Schippers, R.; Müller, C. Effects of Drought, Subsequent Waterlogging and Redrying on Growth, Physiology and Metabolism of Wheat. Physiol. Plant. 2023, 175, e13874. [Google Scholar] [CrossRef] [PubMed]
  22. Marengo, J.A.; Ambrizzi, T.; Alves, L.M.; Barreto, N.J.C.; Reboita, M.S.; Ramos, A.M. Changing Trends in Rainfall Extremes in the Metropolitan Area of São Paulo: Causes and Impacts. Front. Clim. 2020, 2, 3. [Google Scholar] [CrossRef]
  23. Yu, F.; Price, K.P.; Ellis, J.; Shi, P. Response of Seasonal Vegetation Development to Climatic Variations in Eastern Central Asia. Remote Sens. Environ. 2003, 87, 42–54. [Google Scholar] [CrossRef]
  24. Yu, Y.; You, Q.; Zuo, Z.; Zhang, Y.; Cai, Z.; Li, W.; Jiang, Z.; Ullah, S.; Tang, X.; Zhang, R.; et al. Compound Climate Extremes in China: Trends, Causes, and Projections. Atmos. Res. 2023, 286, 106675. [Google Scholar] [CrossRef]
  25. Smith, T.; Traxl, D.; Boers, N. Empirical Evidence for Recent Global Shifts in Vegetation Resilience. Nat. Clim. Chang. 2022, 12, 477–484. [Google Scholar] [CrossRef]
  26. The State Council of the People’s Republic of China. Notice from the General Office of the State Council on Printing and Distributing the “14th Five-Year Plan” Employment Promotion Plan. The Central People’s Government of the People’s Republic of China. Available online: https://www.gov.cn/xinwen/2021-08/19/content_5632124.htm (accessed on 6 May 2024).
  27. Wu, C.; Chen, W. Indicator System Construction and Health Assessment of Wetland Ecosystem—Taking Hongze Lake Wetland, China as an Example. Ecol. Indic. 2020, 112, 106164. [Google Scholar] [CrossRef]
  28. Zhu, X.; Jiao, L.; Wu, X.; Du, D.; Wu, J.; Zhang, P. Ecosystem Health Assessment and Comparison of Natural and Constructed Wetlands in the Arid Zone of Northwest China. Ecol. Indic. 2023, 154, 110576. [Google Scholar] [CrossRef]
  29. Guan, Y.; Lu, H.; Yin, C.; Xue, Y.; Jiang, Y.; Kang, Y.; He, L.; Heiskanen, J. Vegetation Response to Climate Zone Dynamics and Its Impacts on Surface Soil Water Content and Albedo in China. Sci. Total Environ. 2020, 747, 141537. [Google Scholar] [CrossRef] [PubMed]
  30. Abdollahzadeh, G.; Sharifzadeh, M.S.; Sklenička, P.; Azadi, H. Adaptive Capacity of Farming Systems to Climate Change in Iran: Application of Composite Index Approach. Agric. Syst. 2023, 204, 103537. [Google Scholar] [CrossRef]
  31. Liu, L.; Zheng, J.; Guan, J.; Han, W.; Liu, Y. Grassland Cover Dynamics and Their Relationship with Climatic Factors in China from 1982 to 2021. Sci. Total Environ. 2023, 905, 167067. [Google Scholar] [CrossRef]
  32. Qu, L.; Chen, J.; Dong, G.; Jiang, S.; Li, L.; Guo, J.; Shao, C. Heat Waves Reduce Ecosystem Carbon Sink Strength in a Eurasian Meadow Steppe. Environ. Res. 2016, 144, 39–48. [Google Scholar] [CrossRef]
  33. Sen, P.K. Estimates of the Regression Coefficient Based on Kendall’s Tau. J. Am. Stat. Assoc. 1968, 63, 1379–1389. [Google Scholar] [CrossRef]
  34. Mann, H.B. Nonparametric Tests against Trend. Econometrica 1945, 13, 245–259. [Google Scholar] [CrossRef]
  35. Zhang, L.; Yu, X.; Zhou, T.; Zhang, W.; Hu, S.; Clark, R. Understanding and Attribution of Extreme Heat and Drought Events in 2022: Current Situation and Future Challenges. Adv. Atmos. Sci. 2023, 40, 1941–1951. [Google Scholar] [CrossRef]
  36. Leng, S.; Huete, A.; Cleverly, J.; Lu, X.; Ma, X.; Gao, S.; Yu, Q. Response of Dryland Vegetation under Extreme Wet Events with Satellite Measures of Greenness and Fluorescence. Sci. Total Environ. 2022, 842, 156860. [Google Scholar] [CrossRef]
  37. Xu, W.; Yuan, W.; Wu, D.; Zhang, Y.; Shen, R.; Xia, X.; Ciais, P.; Liu, J. Impacts of Record-Breaking Compound Heatwave and Drought Events in 2022 China on Vegetation Growth. Agric. For. Meteorol. 2024, 344, 109799. [Google Scholar] [CrossRef]
  38. Ma, M.; Wang, Q.; Liu, R.; Zhao, Y.; Zhang, D. Effects of Climate Change and Human Activities on Vegetation Coverage Change in Northern China Considering Extreme Climate and Time-Lag and -Accumulation Effects. Sci. Total Environ. 2023, 860, 160527. [Google Scholar] [CrossRef] [PubMed]
  39. Pearson, K. Regression, Heredity, and Panmixia. Philos. Trans. R. Soc. A Math. Phys. Eng. Sci. 1896, 187, 253–318. [Google Scholar] [CrossRef]
  40. Qi, J.; Kerr, Y.H.; Moran, M.S.; Weltz, M.; Huete, A.R.; Sorooshian, S.; Bryant, R. Leaf Area Index Estimates Using Remotely Sensed Data and BRDF Models in a Semiarid Region. Remote Sens. Environ. 2000, 73, 18–30. [Google Scholar] [CrossRef]
  41. Fang, H.; Baret, F.; Plummer, S.; Schaepman-Strub, G. An overview of global leaf area index (LAI): Methods, products, validation, and applications. Rev. Geophys. 2019, 57, 739–799. [Google Scholar] [CrossRef]
  42. Zhang, Y.; Song, C.; Zhang, K.; Cheng, X.; Band, L.E.; Zhang, Q. Effects of Land Use/Land Cover and Climate Changes on Terrestrial Net Primary Productivity in the Yangtze River Basin, China, from 2001 to 2010. J. Geophys. Res. Biogeosci. 2014, 119, 1092–1109. [Google Scholar] [CrossRef]
  43. Mohammed, G.H.; Colombo, R.; Middleton, E.M.; Rascher, U.; van der Tol, C.; Nedbal, L.; Goulas, Y.; Pérez-Priego, O.; Damm, A.; Meroni, M.; et al. Remote sensing of solar-induced chlorophyll fluorescence (SIF) in vegetation: 50 years of progress. Remote Sens. Environ. 2019, 231, 111177. [Google Scholar] [CrossRef] [PubMed]
  44. Zhang, C.; Ren, Y.; Cao, L.; Wu, J.; Zhang, S.; Hu, C.; Zhujie, S. Characteristics of Dry-Wet Climate Change in China during the Past 60 Years and Its Trends Projection. Atmosphere 2022, 13, 275. [Google Scholar] [CrossRef]
  45. Bakala, H.S.; Devi, J.; Singh, G.; Singh, I. Drought and Heat Stress: Insights into Tolerance Mechanisms and Breeding Strategies for Pigeonpea Improvement. Planta 2024, 259, 123. [Google Scholar] [CrossRef] [PubMed]
  46. Chen, S.; Zhang, Q.; Chen, Y.; Zhou, H.; Xiang, Y.; Liu, Z.; Hou, Y. Vegetation Change and Eco-Environmental Quality Evaluation in the Loess Plateau of China from 2000 to 2020. Remote Sens. 2023, 15, 424. [Google Scholar] [CrossRef]
  47. Lesk, C.; Anderson, W.; Rigden, A.; Coast, O.; Jägermeyr, J.; McDermid, S.; Davis, K.F.; Konar, M. Compound Heat and Moisture Extreme Impacts on Global Crop Yields under Climate Change. Nat. Rev. Earth Environ. 2022, 3, 872–889. [Google Scholar] [CrossRef]
  48. Alizadeh, M.R.; Adamowsk, J.; Nikoo, M.R.; AghaKouchak, A.; Dennison, P.; Sadegh, M. A Century of Observations Reveals Increasing Likelihood of Continental-Scale Compound Dry-Hot Extremes. Sci. Adv. 2020, 6, eaaz4571. [Google Scholar] [CrossRef] [PubMed]
  49. Fowler, H.J.; Lenderink, G.; Prein, A.F.; Westra, S.; Allan, R.P.; Ban, N.; Barbero, R.; Berg, P.; Blenkinsop, S.; Do, H.X.; et al. Anthropogenic Intensification of Short-Duration Rainfall Extremes. Nat. Rev. Earth Environ. 2021, 2, 107–122. [Google Scholar] [CrossRef]
  50. Wang, D.; Sun, Y.; Hu, T.; Yin, H. The 2022 Record-Breaking Heat Event over the Middle and Lower Reaches of the Yangtze River: The Role of Anthropogenic Forcing and Atmospheric Circulation. Bull. Am. Meteorol. Soc. 2024, 105, E200–E205. [Google Scholar] [CrossRef]
  51. Chaves, M.M.; Maroco, J.P.; Pereira, J.S. Understanding Plant Responses to Drought—From Genes to the Whole Plant. Funct. Plant Biol. 2003, 30, 239–264. [Google Scholar] [CrossRef] [PubMed]
  52. Wu, J.; Wang, X.; Chen, M.; Xu, X.; Wang, Z.; Wang, C.; Piao, S.; Lin, W.; Miao, G.; Deng, M.; et al. Responses of Terrestrial Ecosystems to Temperature and Precipitation Variability in the Northern Hemisphere. Glob. Chang. Biol. 2018, 24, 5093–5106. [Google Scholar] [CrossRef]
  53. Grossiord, C.; Granier, A.; Ratcliffe, S.; Bouriaud, O.; Bruelheide, H.; Chećko, E.; Forrester, D.I.; Dawud, S.M.; Finér, L.; Pollastrini, M.; et al. Tree Diversity Does Not Always Improve Resistance of Forest Ecosystems to Drought. Proc. Natl. Acad. Sci. USA 2014, 111, 14812–14817. [Google Scholar] [CrossRef]
  54. Anderegg, W.R.L.; Trugman, A.T.; Badgley, G.; Anderson, C.M.; Bartuska, A.; Ciais, P.; Cullenward, D.; Field, C.B.; Freeman, J.; Goetz, S.J.; et al. Climate-driven risks to the climate mitigation potential of forests. Science 2020, 368, eaaz7005. [Google Scholar] [CrossRef] [PubMed]
  55. Zia, R.; Nawaz, M.S.; Siddique, M.J.; Hakim, S.; Imran, A. Plant survival under drought stress: Implications, adaptive responses, and integrated rhizosphere management strategy for stress mitigation. Microbiol. Res. 2021, 242, 126626. [Google Scholar] [CrossRef] [PubMed]
  56. Huang, J.; Li, Y.; Fu, C.; Chen, F.; Fu, Q.; Dai, A.; Shinoda, M.; Ma, Z.; Guo, W.; Li, Z.; et al. Dryland climate change: Recent progress and challenges. Rev. Geophys. 2017, 55, 719–778. [Google Scholar] [CrossRef]
  57. Sun, Y.; Zhao, G.; Zheng, Z.; Zhu, Y.; Zhu, J.; Di, Y.; Gao, J.; Cai, M.; Zhang, Y. Wetting-warming climate increases ecosystem carbon use efficiency of Chinese arid and semi-arid ecosystem. Agric. For. Meteorol. 2024, 351, 110018. [Google Scholar] [CrossRef]
  58. Su, J.; Zhang, Y.; Xu, F. Divergent responses of grassland productivity and plant diversity to intra-annual precipitation variability across climate regions: A global synthesis. J. Ecol. 2023, 111, 1921–1934. [Google Scholar] [CrossRef]
  59. Verrall, B.; Pickering, C.M. Alpine vegetation in the context of climate change: A global review of past research and future directions. Sci. Total Environ. 2020, 748, 141344. [Google Scholar] [CrossRef]
  60. Zahra, N.; Hafeez, M.B.; Ghaffar, A.; Kausar, A.; Al Zeidi, M.; Siddique, K.H.M.; Farooq, M. Plant photosynthesis under heat stress: Effects and management. Environ. Exp. Bot. 2023, 206, 105178. [Google Scholar] [CrossRef]
  61. Turner, M.G. Disturbance and Landscape Dynamics in a Changing World. Ecology 2010, 91, 2833–2849. [Google Scholar] [CrossRef] [PubMed]
  62. Ji, Z.; Wang, L. Differential Responses of Vegetation Phenology to Climatic Elements during Extreme Events on the Chinese Loess Plateau. Sci. Total Environ. 2024, 933, 173146. [Google Scholar] [CrossRef]
  63. Oswald-Spring, D.Ú. Climate Change 2014: Impacts, Adaptation, and Vulnerability; Cambridge University Press: Cambridge, UK, 2014. [Google Scholar] [CrossRef]
  64. Zhang, L.; Hu, X.; Austrheim, G.; Speed, J.D.M.; Zhao, W.; Cherubini, F. Disentangling the Effects of Climate Variability and Herbivory on Spatial and Temporal Changes in Northern Vegetation Greening. Ecol. Indic. 2024, 159, 111700. [Google Scholar] [CrossRef]
  65. Fathi-Taperasht, A.; Shafizadeh-Moghadam, H.; Sadian, A.; Xu, T.; Nikoo, M.R. Drought-induced vulnerability and resilience of different land use types using time series of MODIS-based indices. Int. J. Disaster Risk Reduct. 2023, 91, 103703. [Google Scholar] [CrossRef]
Figure 1. Spatial distribution of (a) elevation, (b) subregions of China and (c) vegetation types.
Forests 16 00038 g001
Figure 2. The flowchart of data processing and analysis.
Forests 16 00038 g002
Figure 3. (A) Spatial distribution of CIM-constructed vegetation health systems. (B) Spatial distribution of TOPSIS-constructed vegetation health systems. (C) Spatial distribution of PSR-constructed vegetation health systems. Five-year VHI changes constructed using CIM, TOPSIS, and PSR models. (ae) show the spatiotemporal patterns of VHI for the years 2000, 2005, 2010, 2015, and 2020, respectively. (f) illustrates the spatial pattern of the average VHI from 2000 to 2020.
Forests 16 00038 g003aForests 16 00038 g003b
Figure 4. (A) Fitting graph of VHI and LAI. (B) Fitting graph of vegetation health and NPP (units: g C/m2). (C) Fitting graph of vegetation health and SIF.
Forests 16 00038 g004aForests 16 00038 g004bForests 16 00038 g004c
Figure 5. Trend and future persistence of VHI changes. (ac) represent the spatial distribution of Sen’s slope, MK test, and Hurst exponent, respectively. (d) shows the changes in VHI for different vegetation types from 2000 to 2020.
Forests 16 00038 g005
Figure 6. Characteristics of stress events from 2000 to 2020. (ad) show the climatology of SPEI CD, SM CD, CPA (units: m), and CH (units: °C), respectively. (eh) depict the years when the maximum values of SPEI CD, SM CD, CPA, and CH occurred. (il) present the normal distribution of SPEI CD, SM CD, CPA, and CH.
Forests 16 00038 g006
Figure 7. Anomalies in vegetation health due to stress events and latitudinal variation. (ae) depict the abnormal changes in vegetation health due to stress events and latitudinal variation in different subregions for the years 2001, 2005, 2010, 2015, and 2020, respectively. Upright triangles represent positive anomalies, inverted triangles represent negative anomalies, and the gray dashed line indicates VHI = 0.4, serving as the threshold for vegetation health.
Forests 16 00038 g007
Figure 8. Sensitivity of vegetation health to stress events. (a,e,i,m,q), (b,f,j,n,r), (c,g,k,o,s), and (d,h,l,p,t) represent the sensitivity of vegetation health to SPEI CD, SM CD, CPA, and CH, respectively.
Forests 16 00038 g008
Figure 9. Sensitivity of different vegetation types to stress events. (ae) correspond to the same years as in Figure 7.
Forests 16 00038 g009
Figure 10. Contribution of stress and other events to vegetation health. (a,b) Slopes of stress and other events, (c,d) contribution rates, and (e) contribution rates of stress and other events across nine subregions.
Forests 16 00038 g010
Table 1. Details of data.
Data TypeSpatial ResolutionTemporal ResolutionSource
Temperature 0.0083333°Yearlyhttp://www.geodata.cn/data/datadetails.html?dataguid=67669514169502&docId=4 (accessed on 12 March 2024)
Precipitationhttps://www.geodata.cn/data/datadetails.html?dataguid=113786088533256&docId=6 (accessed on 12 March 2024)
2 m temperature0.1°Monthlyhttps://cds.climate.copernicus.eu/datasets/reanalysis-era5-land-monthly-means?tab=overview (accessed on 12 March 2024)
GPP500 m8 dayhttps://lpdaac.usgs.gov/products/mod17a2hv061/ (accessed on 6 May 2023)
Land Surface Temperature, SR, RH0.1°Monthlyhttps://cds.climate.copernicus.eu/#!/home (accessed on 15 March 2024)
ET, SM0.25°Yearlyhttps://www.gleam.eu/ (accessed on 17 March 2024)
Slope, DEM1 kmYearlyhttps://www.gscloud.cn/ (accessed on 18 March 2024)
PM2.51 kmMonthlyhttps://data.tpdc.ac.cn/ (accessed on 18 March 2024)
PDSI1 kmMonthlyhttps://crudata.uea.ac.uk/cru/data/drought/#global (accessed on 18 March 2024)
Nighttime Light500 mYearlyhttp://nnu.geodata.cn/data/datadetails.html?dataguid=8213124601985&docid=0 (accessed on 20 March 2024)
Soil properties1 kmYearlyhttps://data.tpdc.ac.cn/zh-hans/data/8ba0a731-5b0b-4e2f-8b95-8b29cc3c0f3a (accessed on 20 March 2024)
GDP, Tertiary industry added value1 kmYearlyhttps://github.com/thestarlab/ChinaGDP (accessed on 25 March 2024)
Population density1 kmYearlyhttps://landscan.ornl.gov (accessed on 25 March 2024)
NDVI1 kmYearlyhttps://www.geodata.cn/main/#/face_science_detail?gugu=197351408897313 (accessed on 30 March 2024)
LAI0.05°Yearlyhttps://doi.org/10.3974/geodb.2023.10.03.V1 (accessed on 30 March 2024)
SIF0.05°4 dayhttps://cstr.cn/18406.11.Ecolo.tpdc.271751 (accessed on 3 April 2024)
NPP500 mYearlyhttps://lpdaac.usgs.gov/product_search/?view=listhttpl://lpdaac.usgs.gov/product_search/?view=list (accessed on 3 April 2024)
1:1,000,000 vegetation types in China1 km https://www.plantplus.cn (accessed on 5 April 2024)
Table 2. Indicators of the vegetation health assessment system.
SystemSubsystemPrimary Indicator LayerSecondary Indicator LayerAttributes
China Vegetation Health SystemPressureHuman activity pressurePopulation Density
Climate pressureRelative Humidity+
Temperature
Precipitation+
PDSI
SM+
StateVegetation growth stateNDVI+
LAI+
Soil attributes statePH
SOM+
Total Nitrogen+
Total Phosphorus+
Terrain stateSlope
DEM
ResponseVegetation responseFVC+
GPP+
Transpiration
Production activity responseTertiary Industry Value Added
Nighttime Lights
PM2.5
GDP
Disclaimer/Publisher’s Note: The statements, opinions and data contained in all publications are solely those of the individual author(s) and contributor(s) and not of MDPI and/or the editor(s). MDPI and/or the editor(s) disclaim responsibility for any injury to people or property resulting from any ideas, methods, instructions or products referred to in the content.

