
Long-Term Growth Trends of 18 Native and Non-Native Tree Species Based on Data from Experimental Plots Since 1878 in Brandenburg, Germany


Abstract
1. Introduction
2. Materials and Methods
2.1. Tree Data
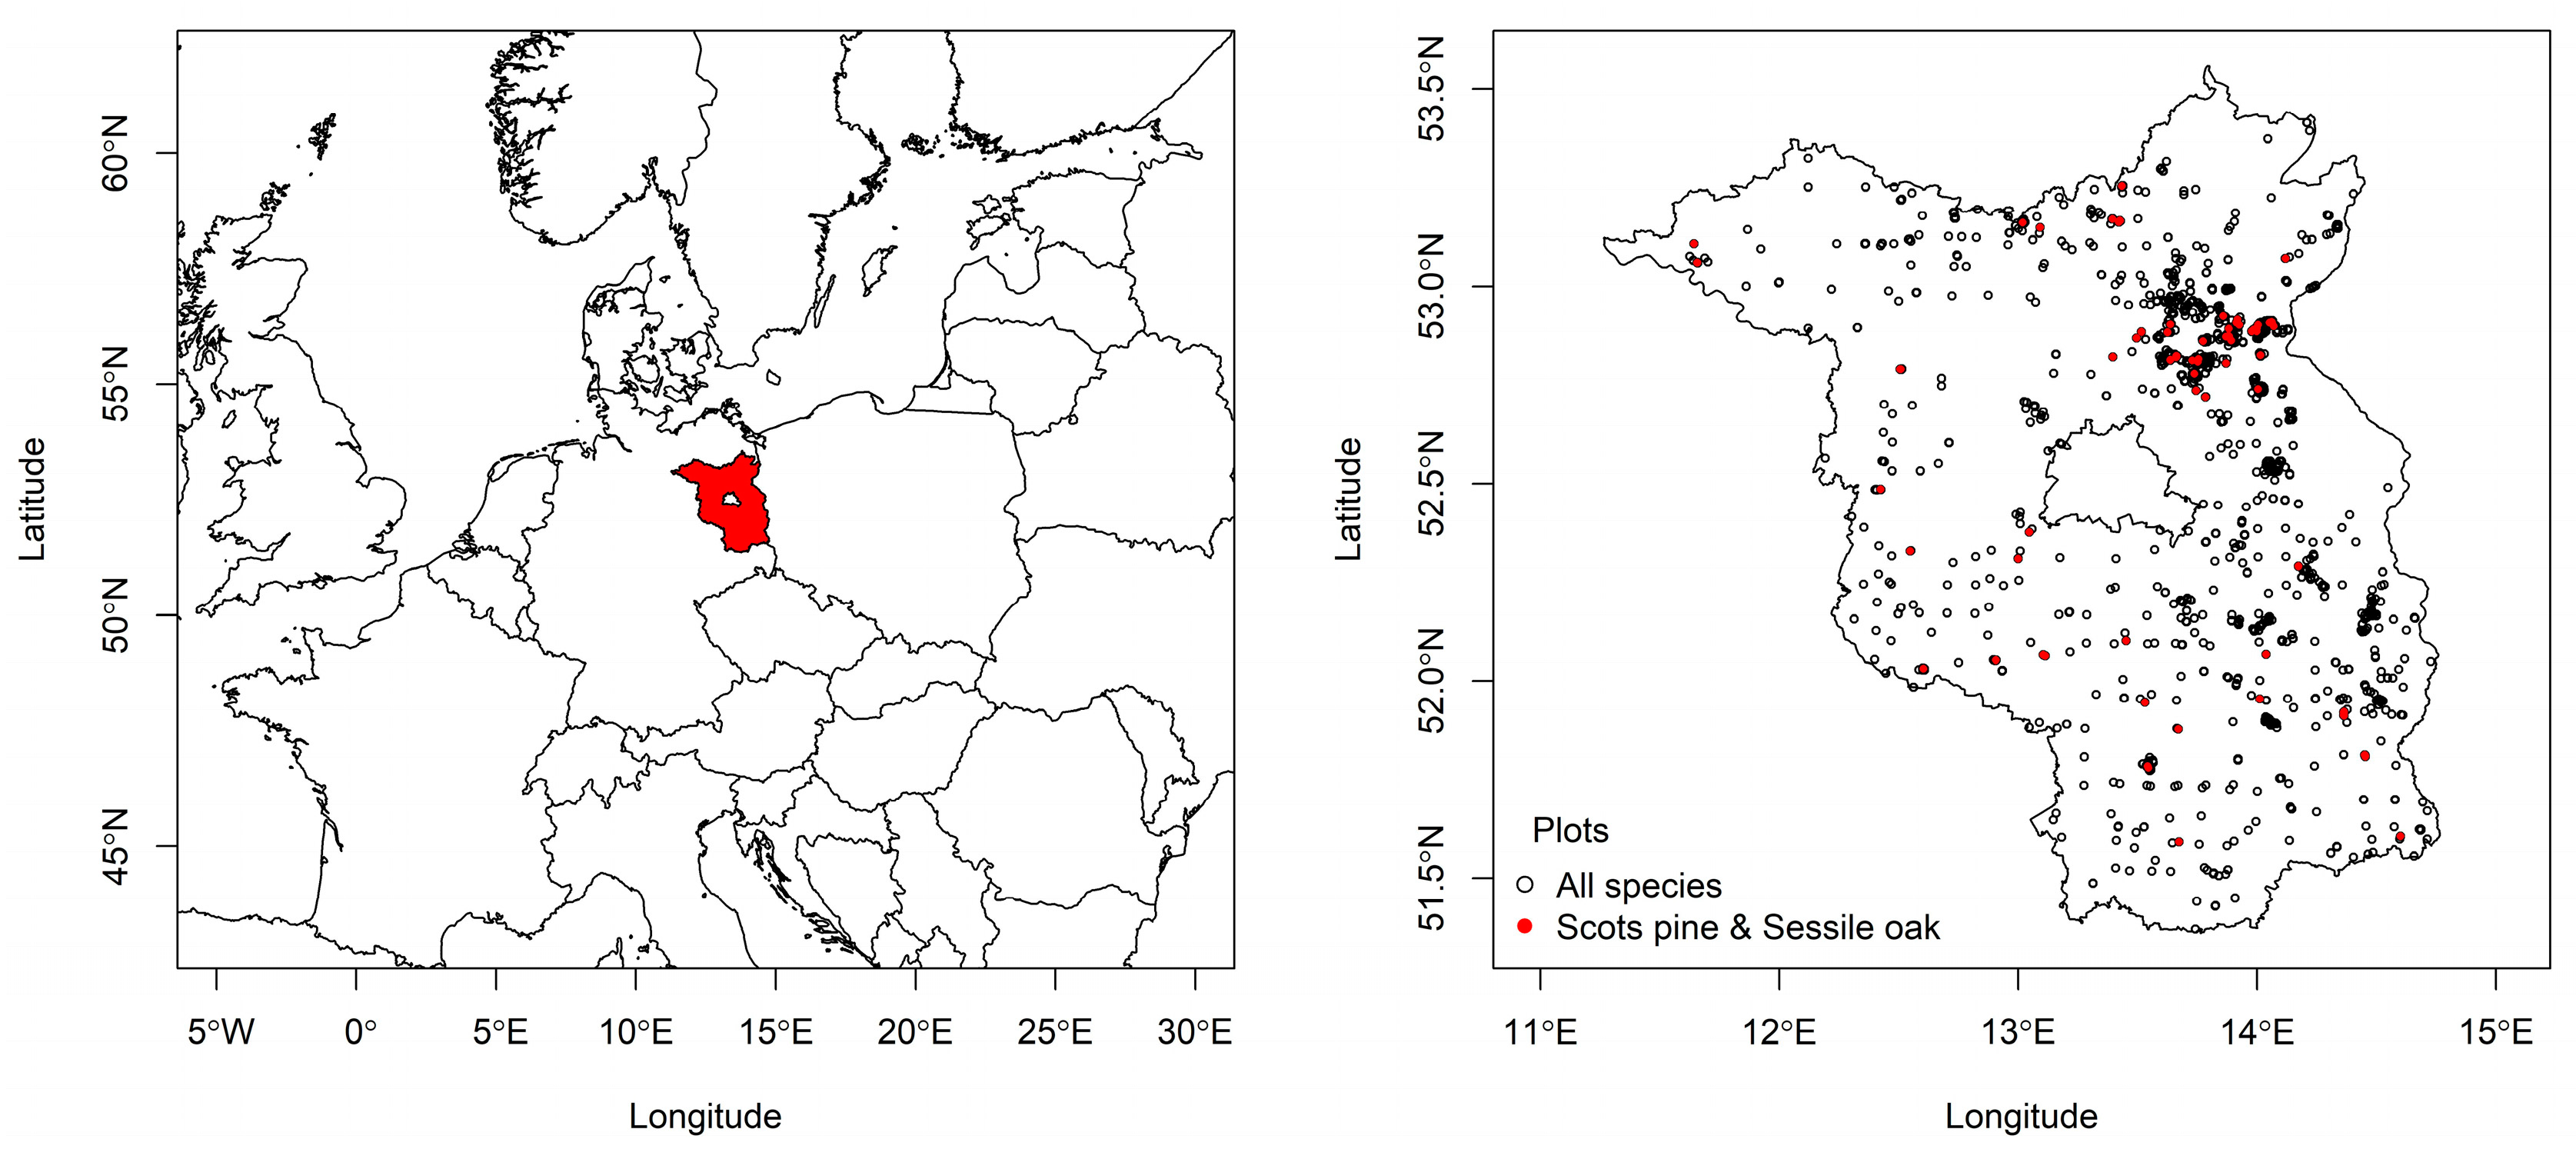
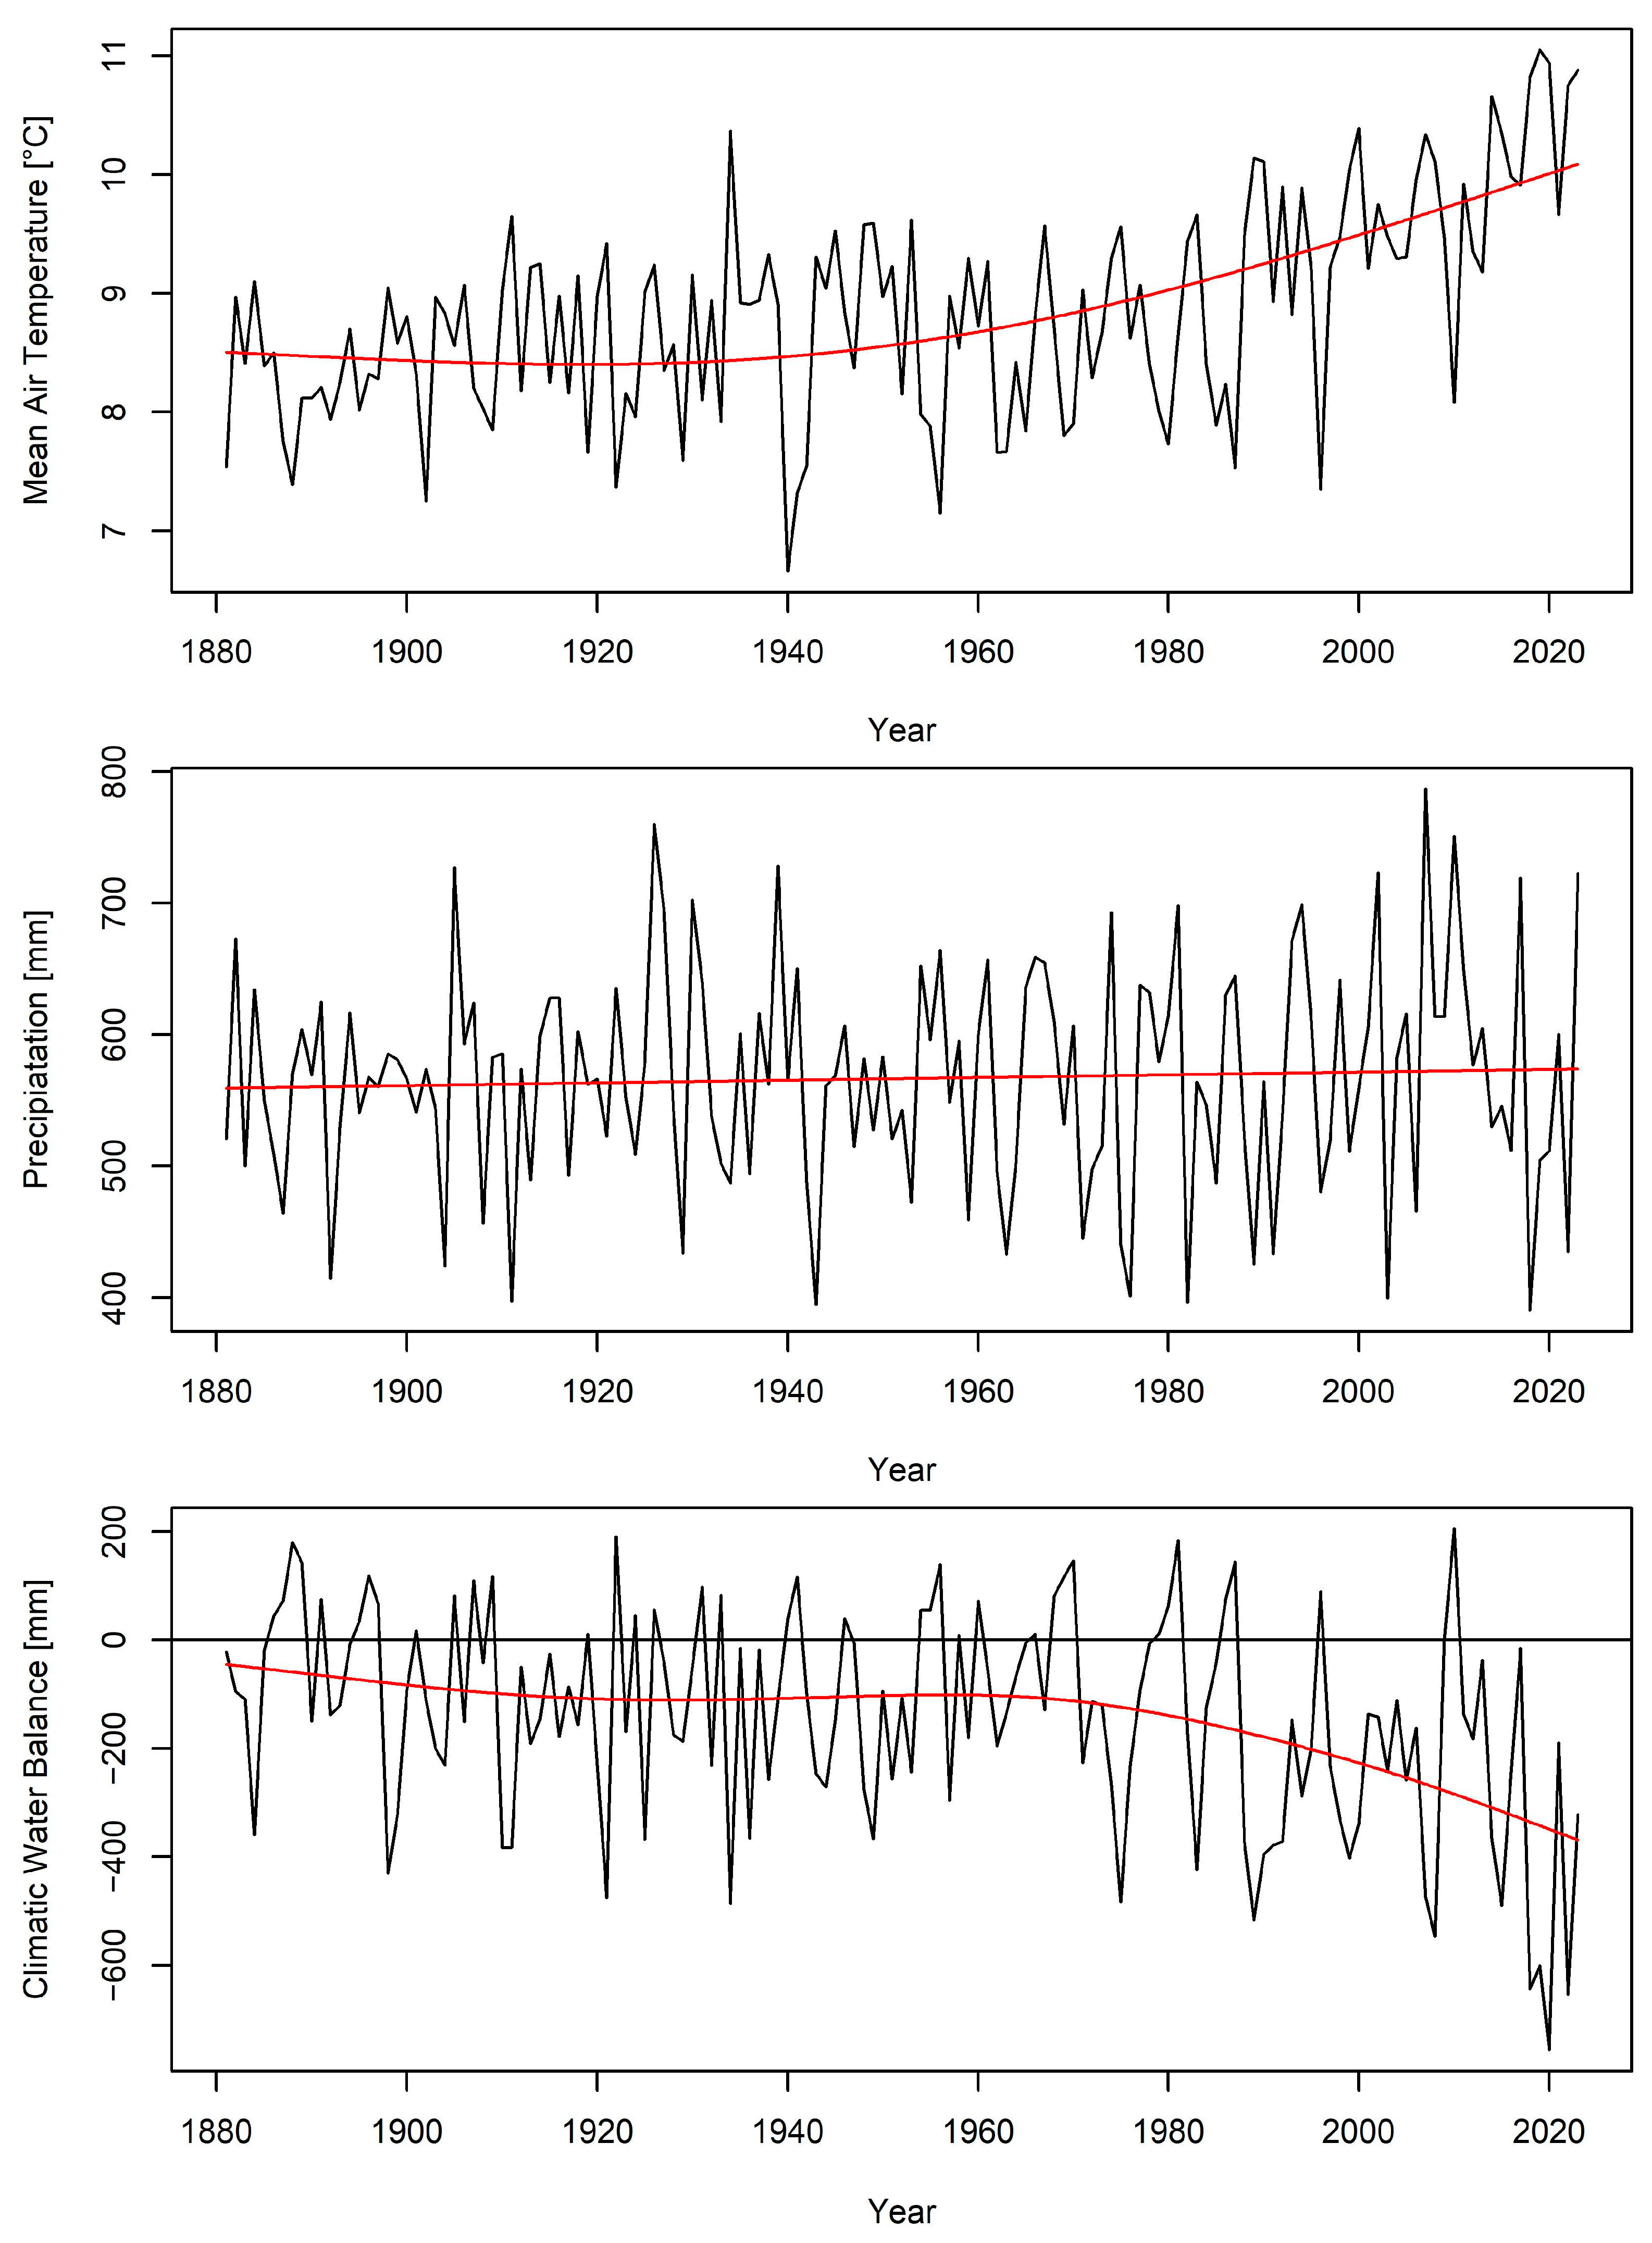
2.2. Study Region
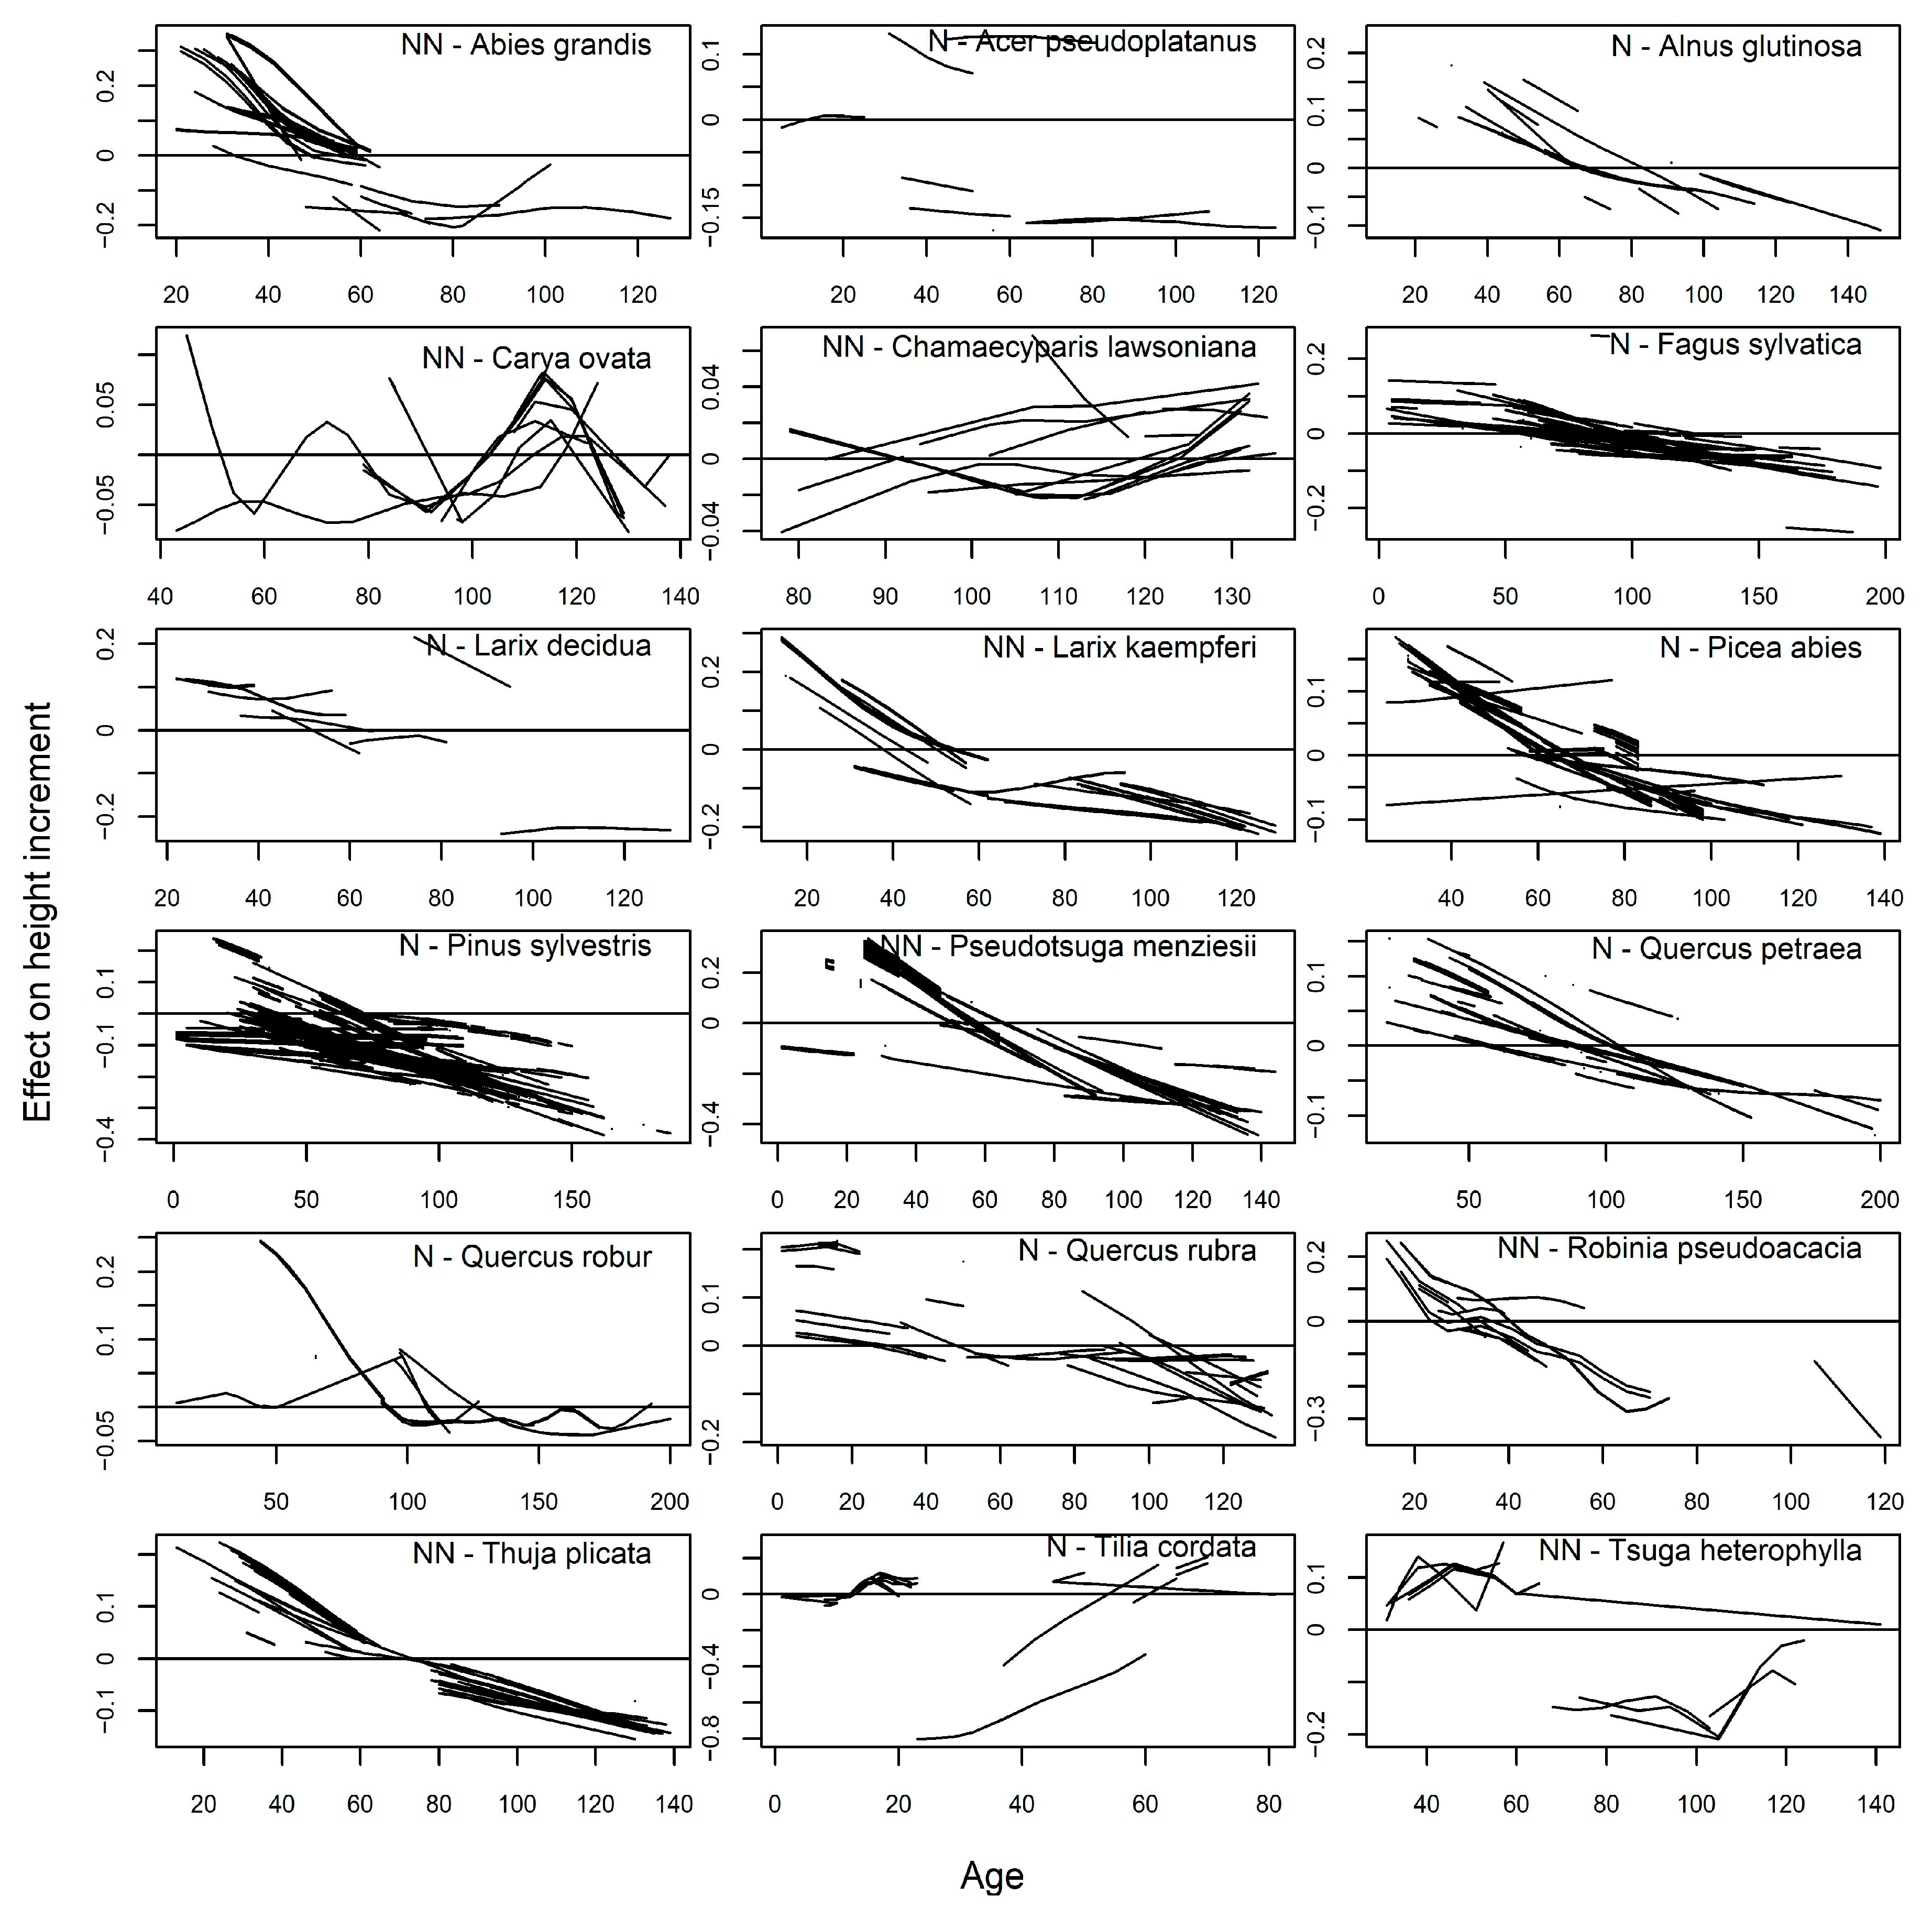
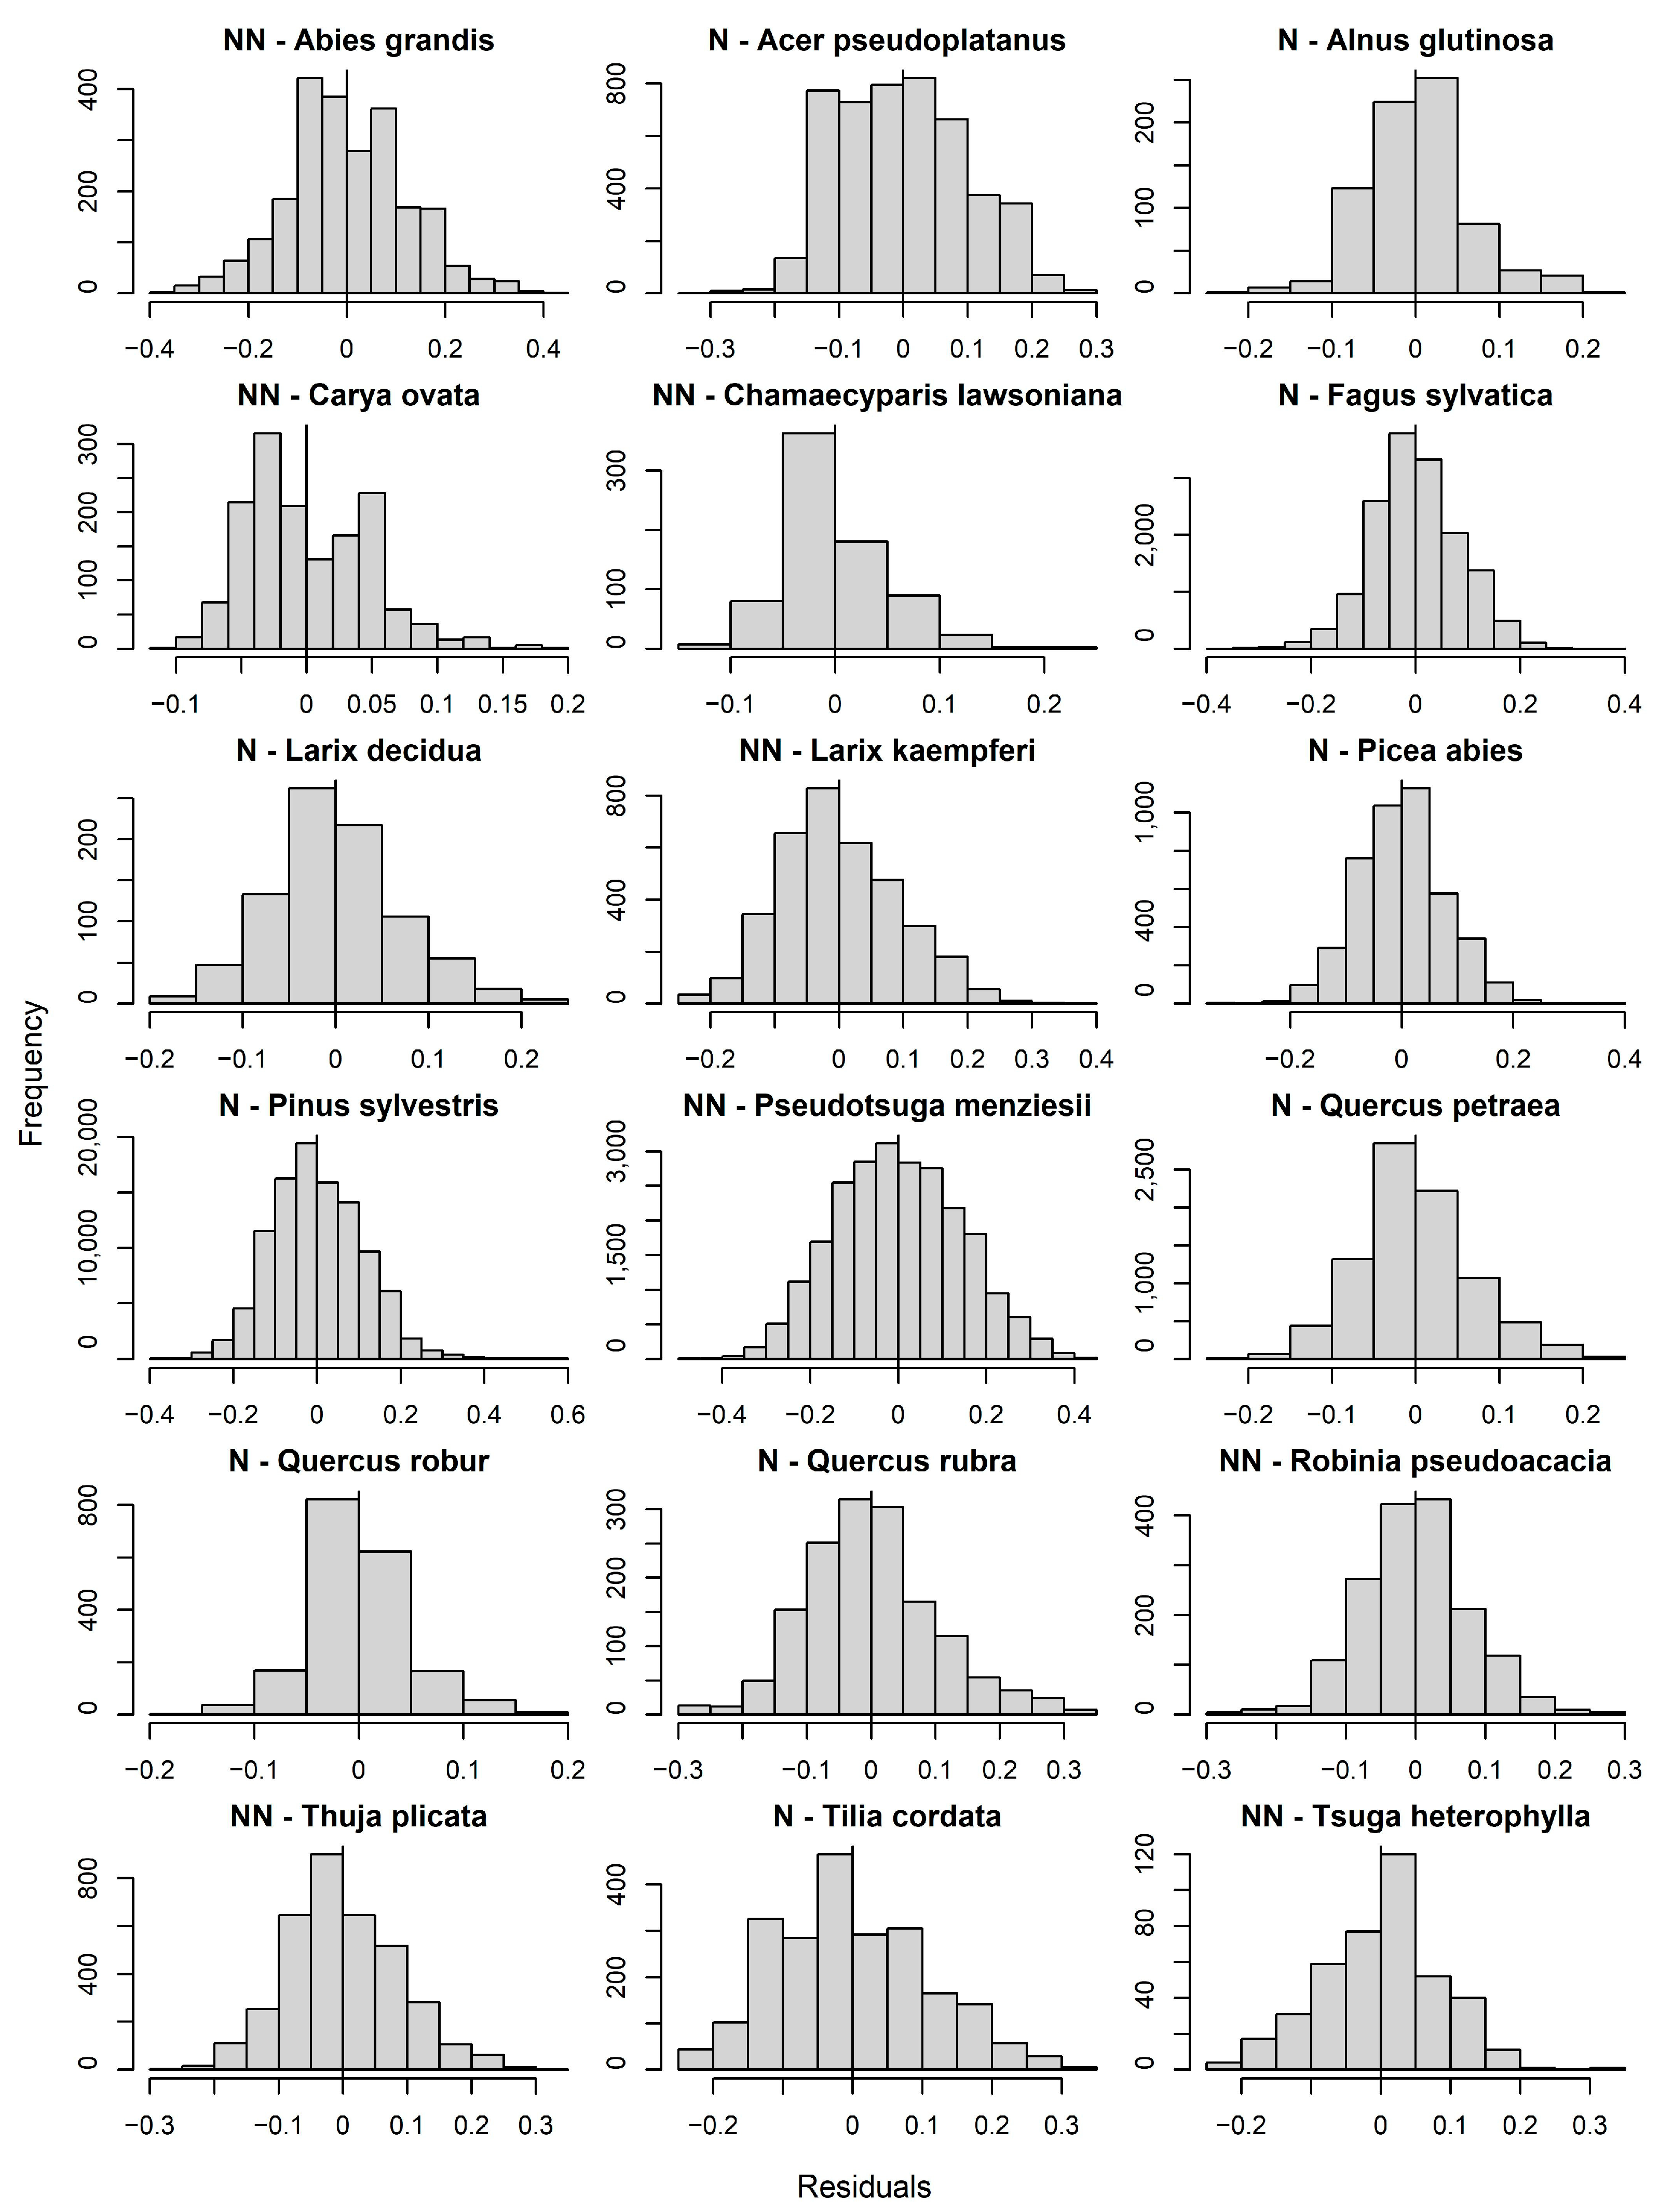
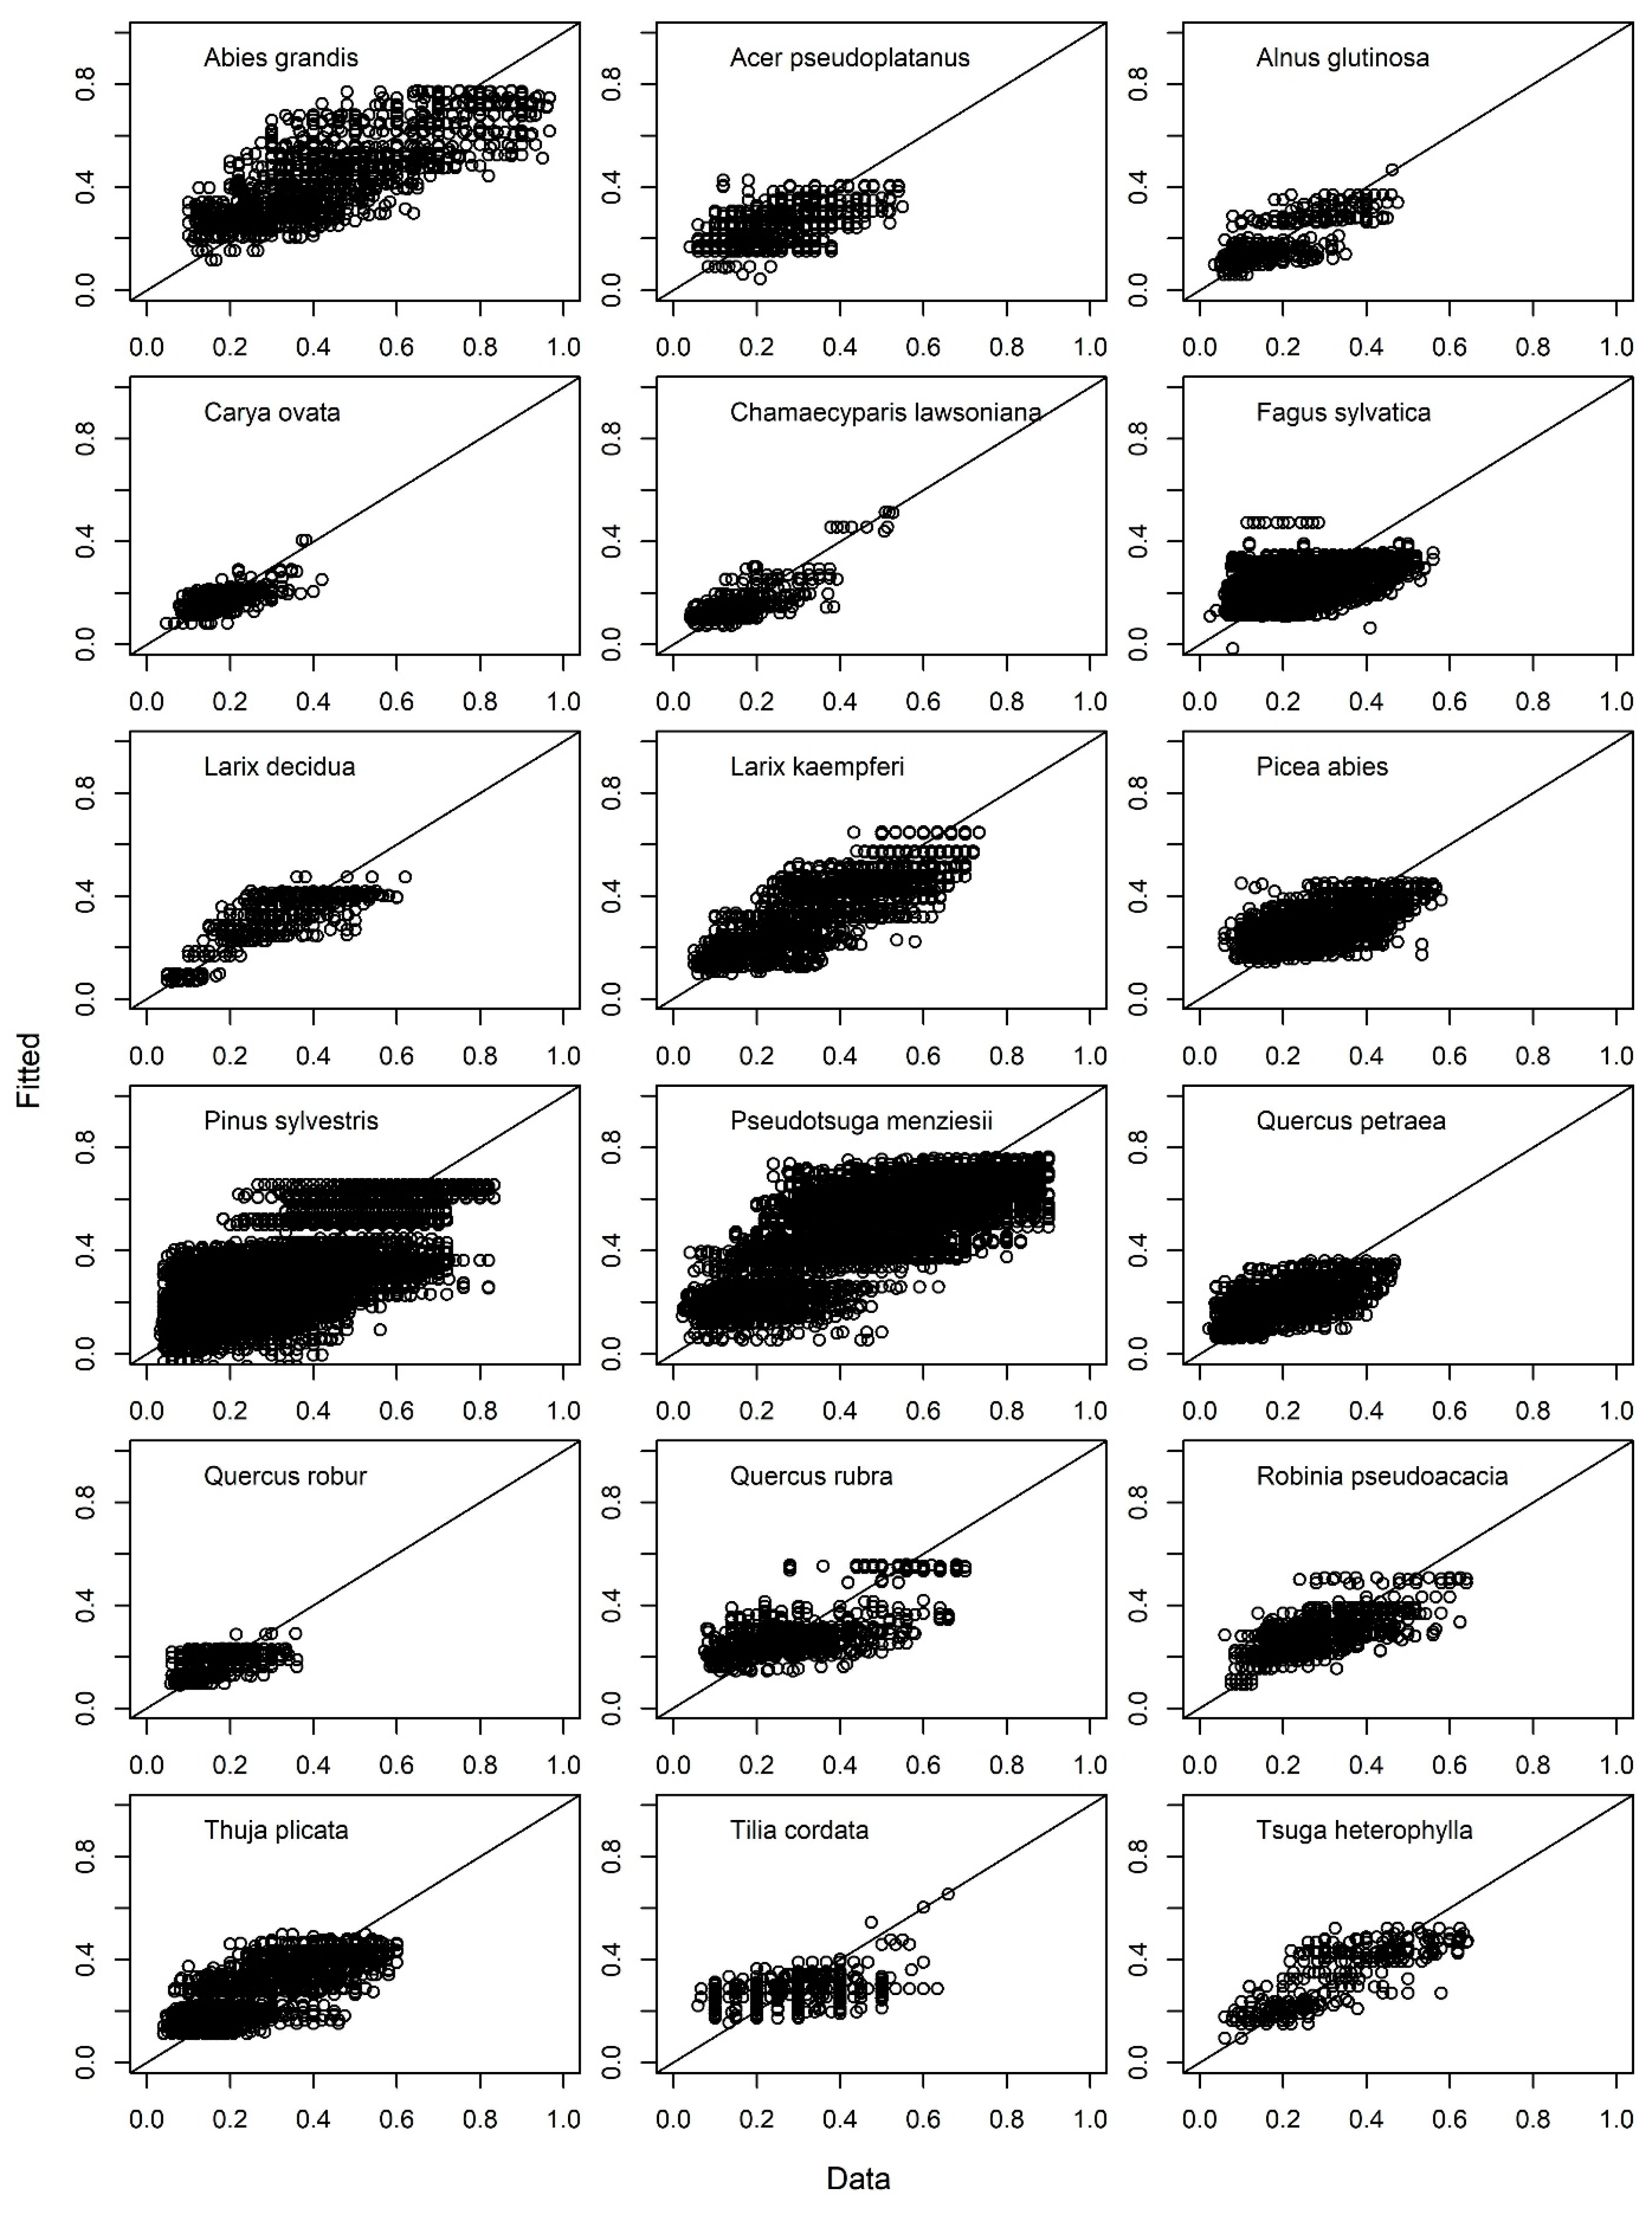
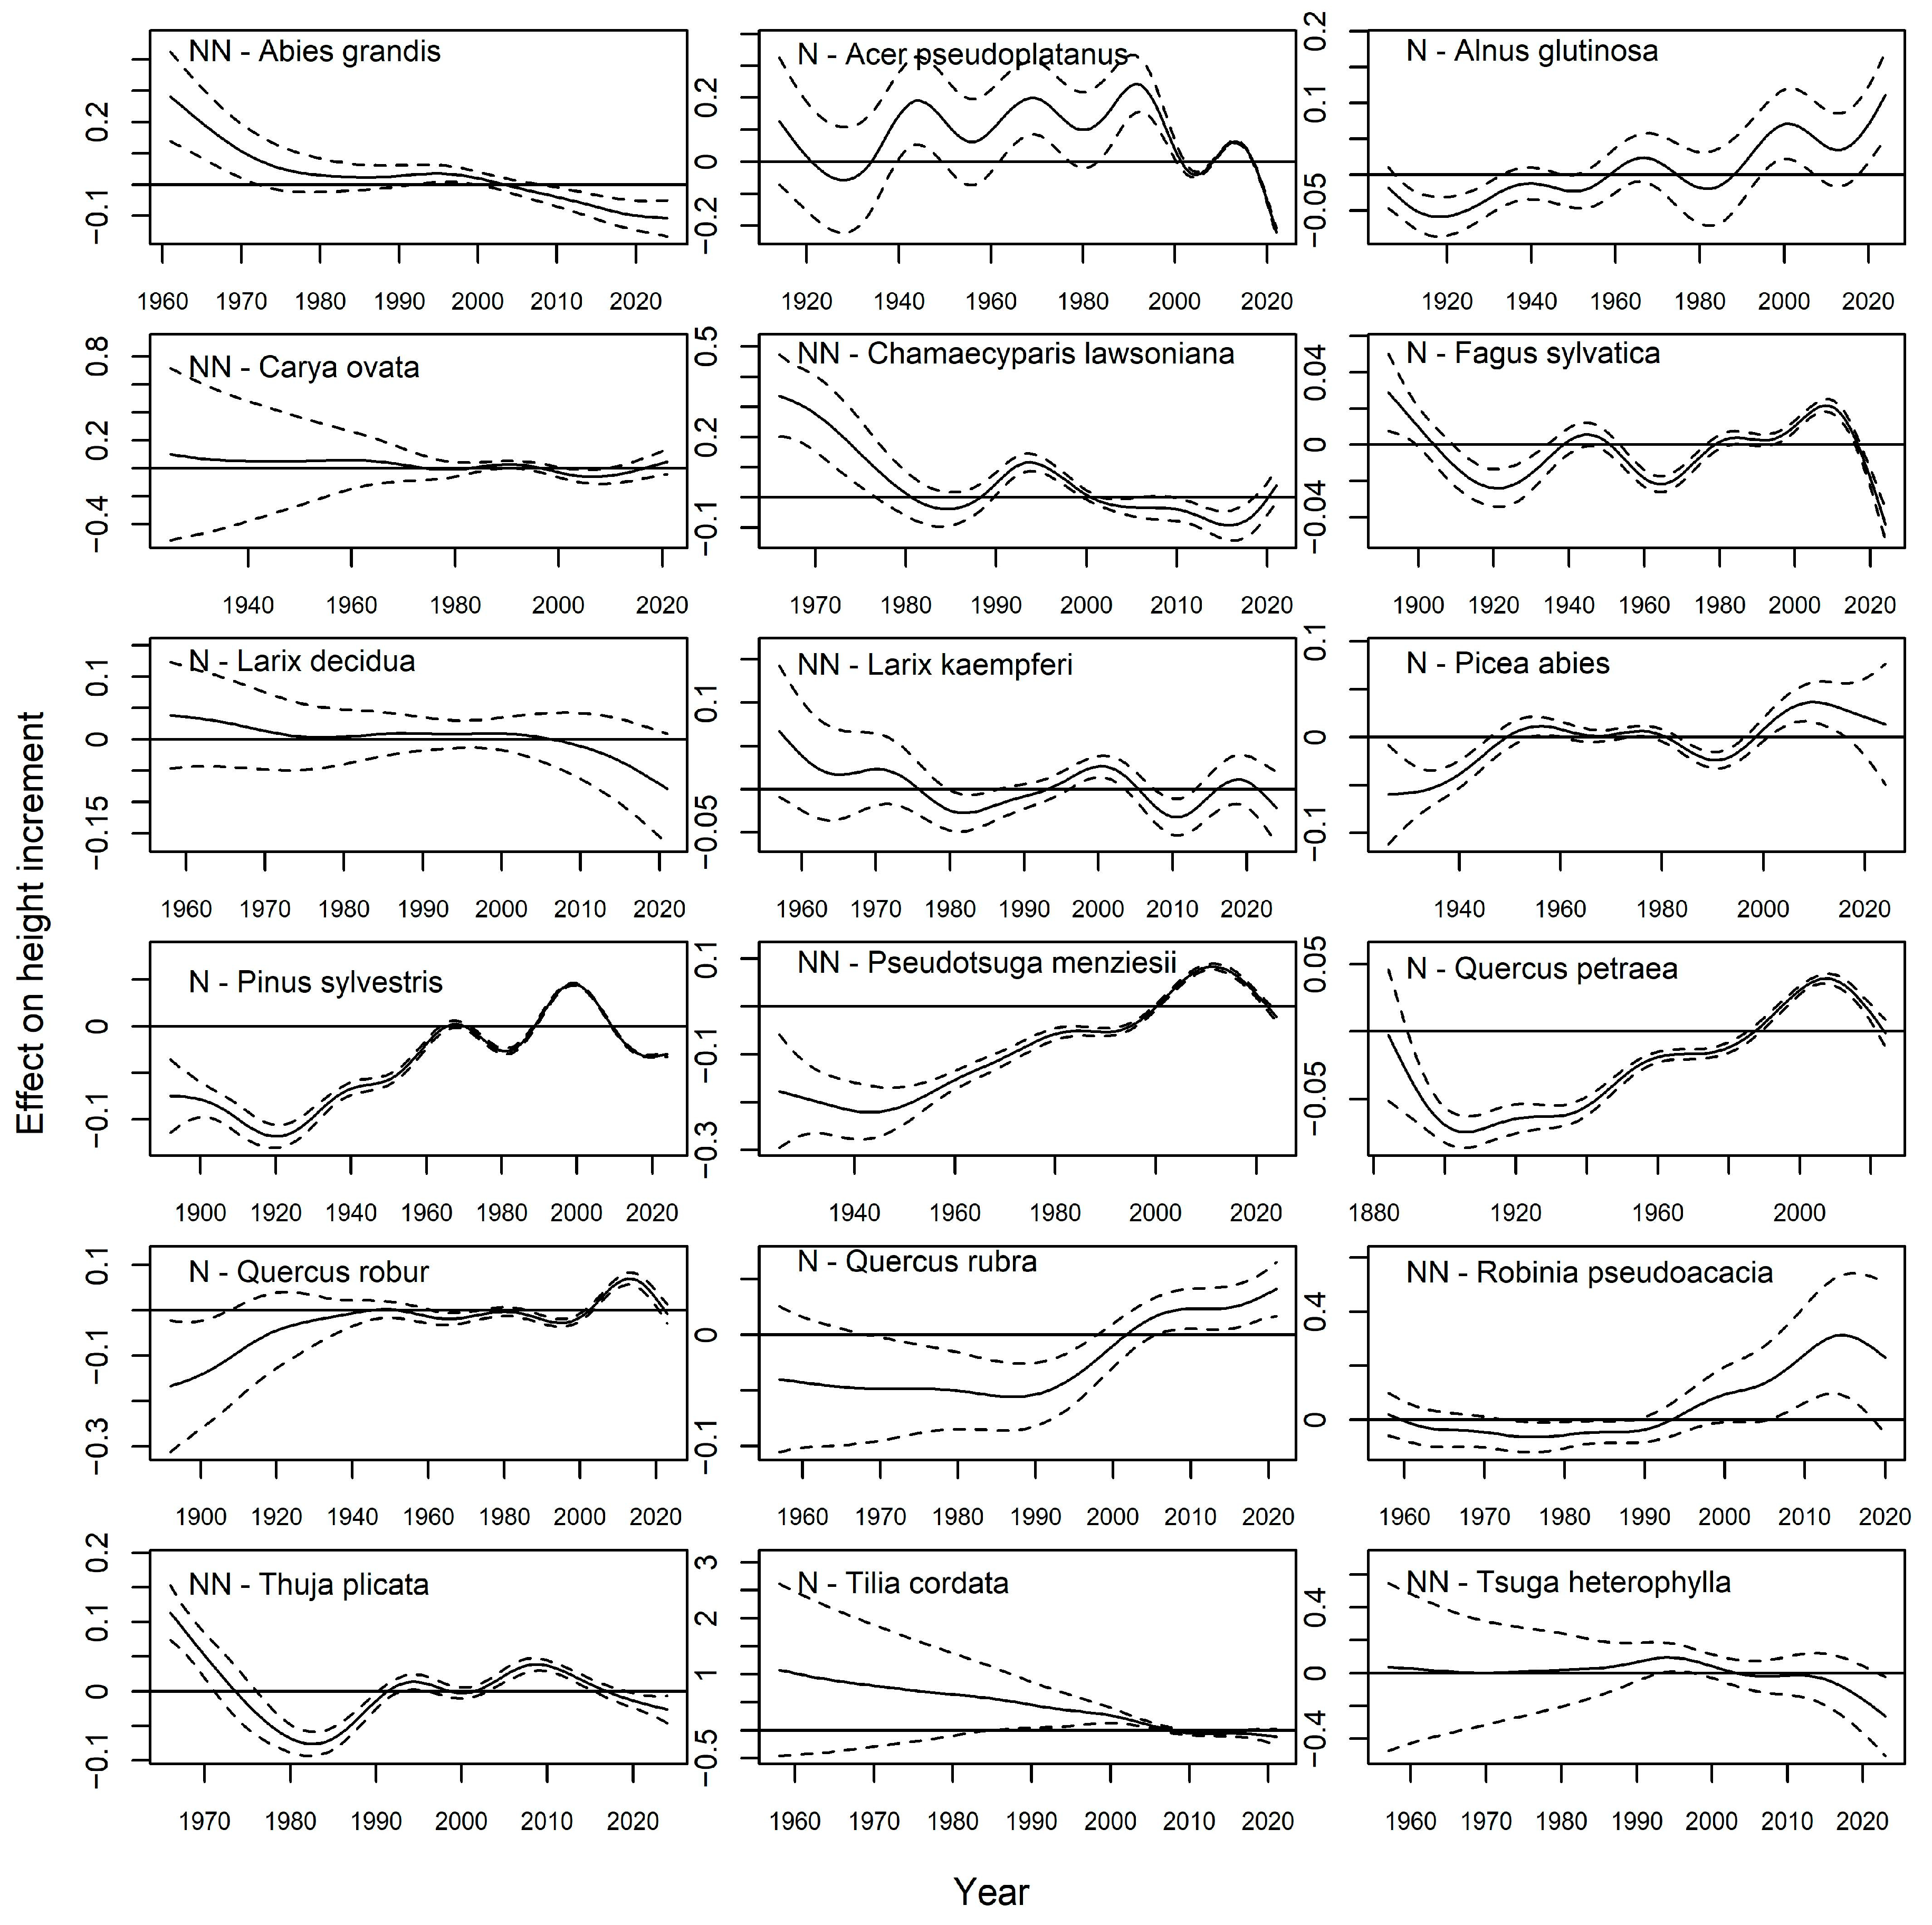
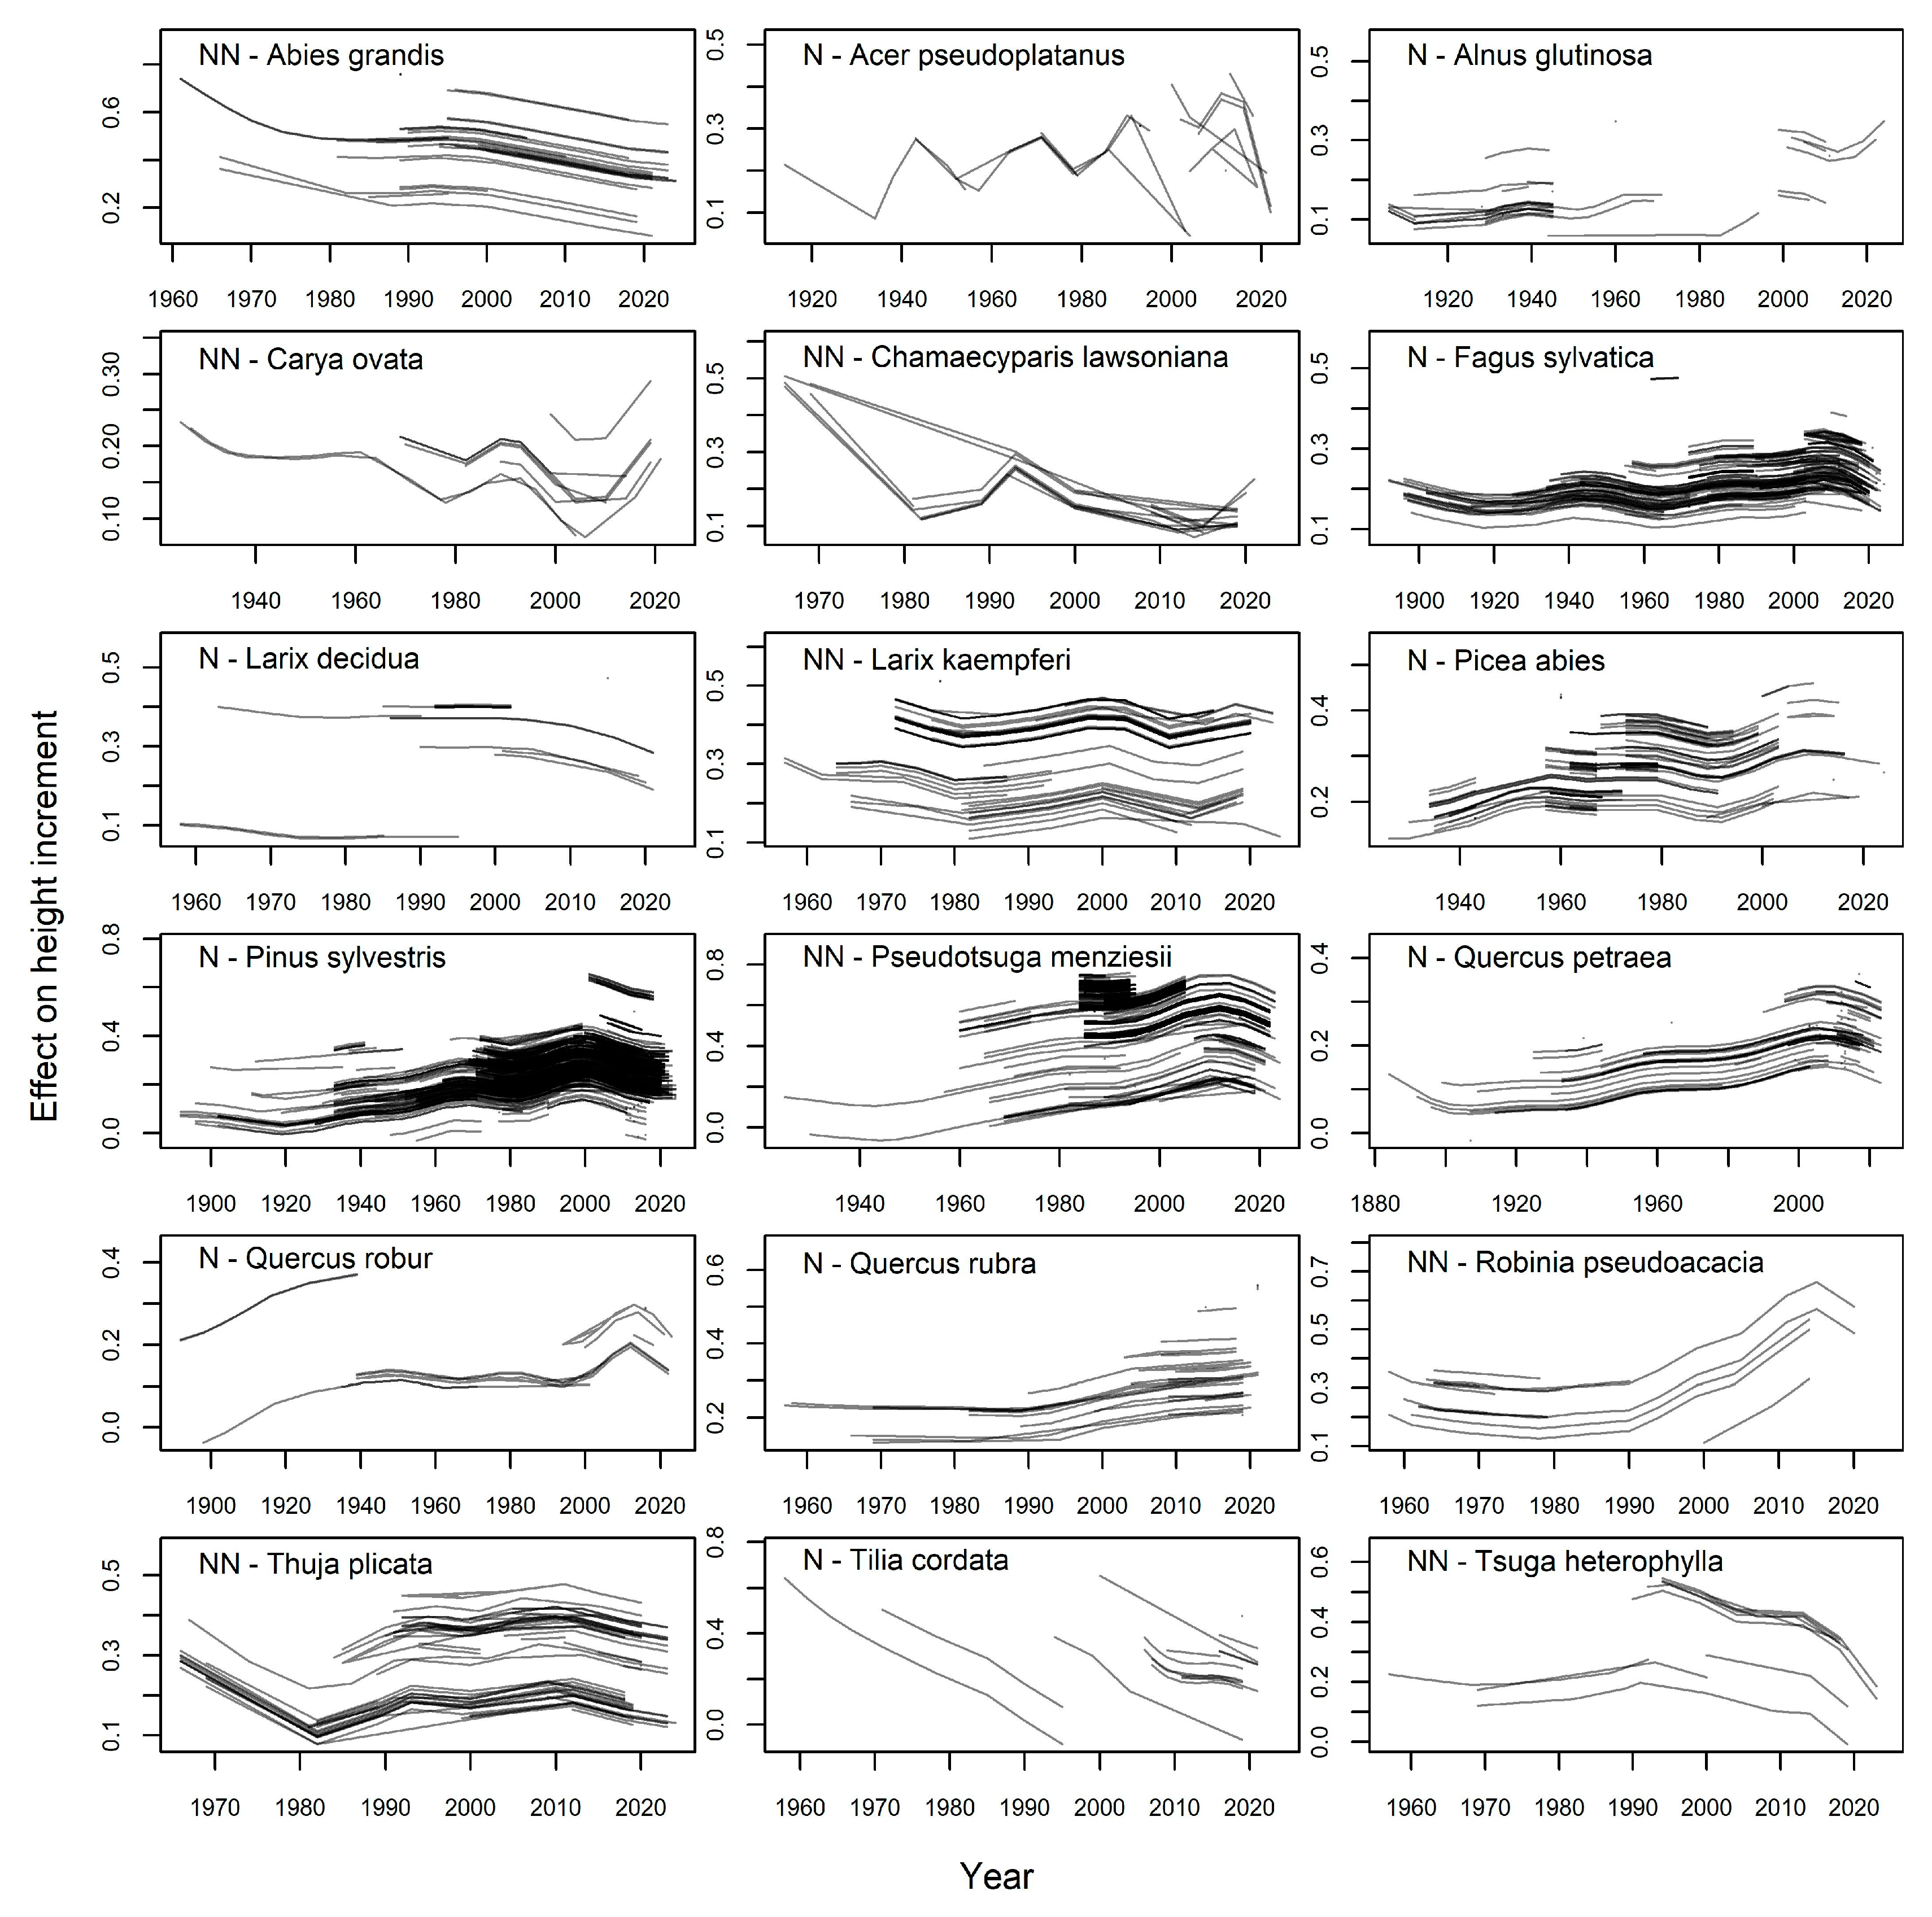
2.3. Tree Height Increment Modeling
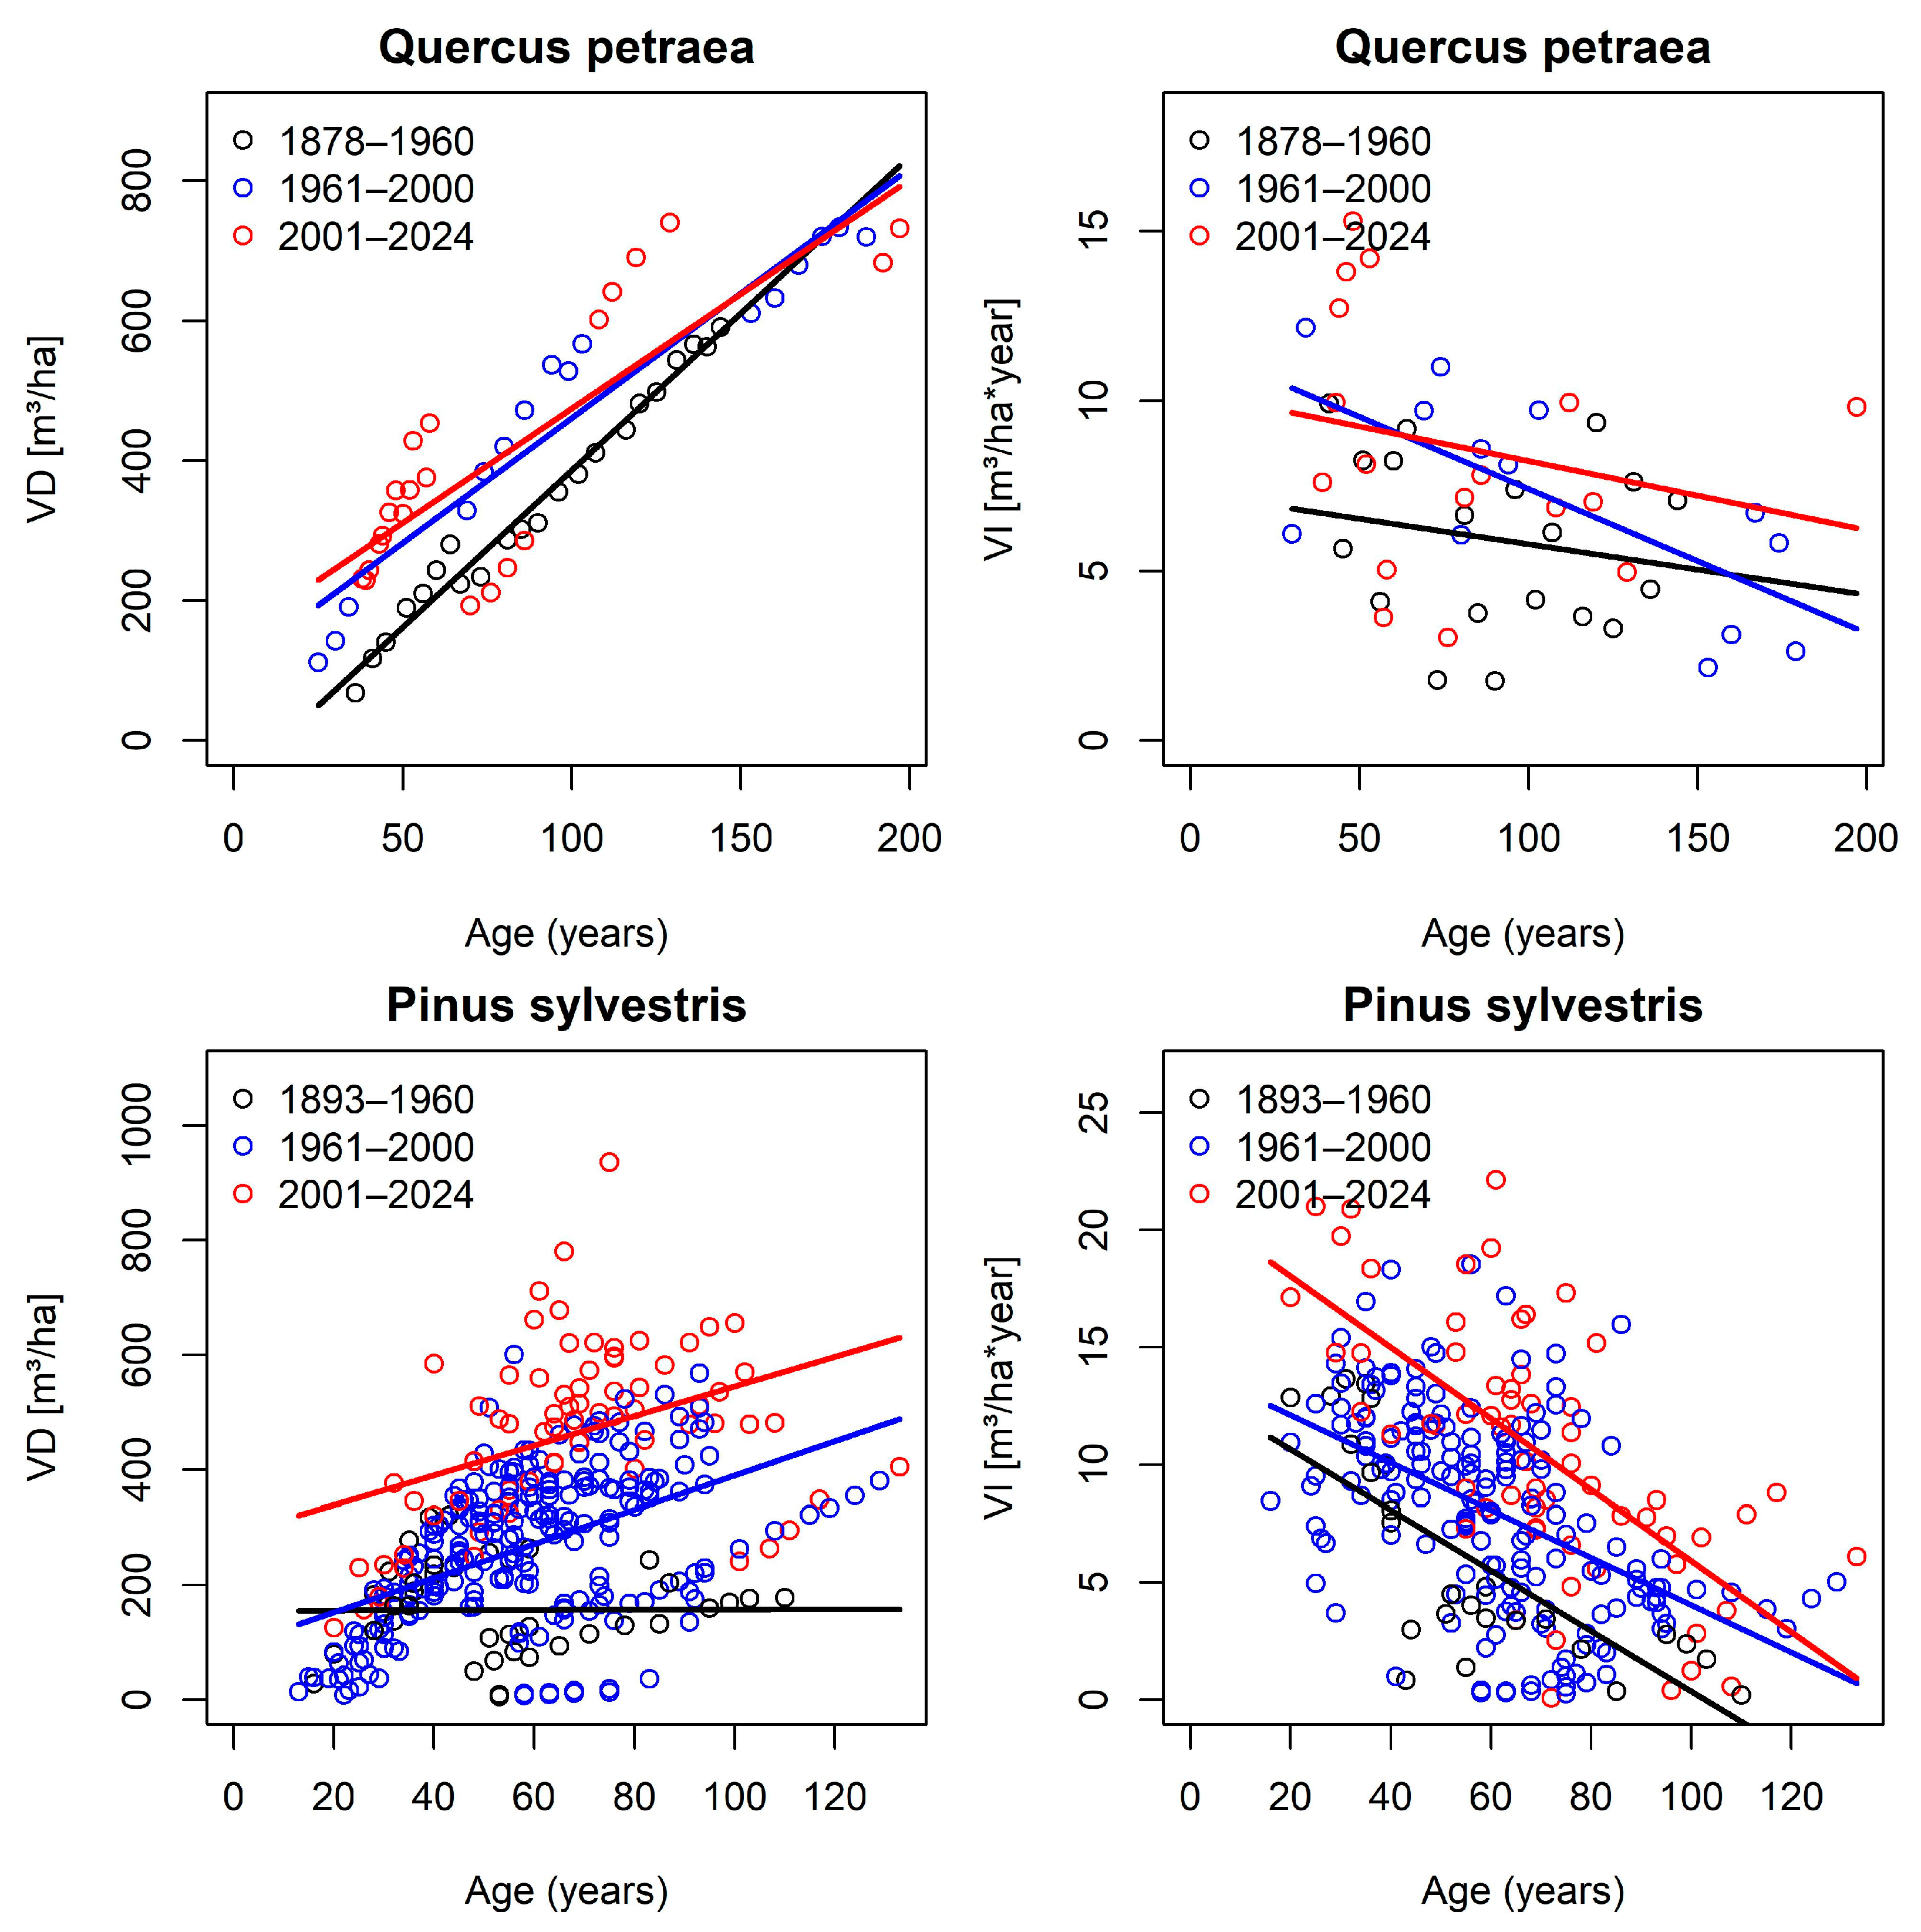
2.4. Forest Stand Growth Analysis
3. Results
4. Discussion
5. Conclusions
Author Contributions
Funding
Data Availability Statement
Acknowledgments
Conflicts of Interest
Appendix A

| Species | NbIncr | Dev.Expl. | AIC | BIC | RMSE | |
|---|---|---|---|---|---|---|
| 1 | Abies grandis (Douglas ex D. Don) Lindl. | 2298 | 0.66 | −3098.89 | −2901.86 | 0.12 |
| 2 | Acer pseudoplatanus L. | 4739 | 0.28 | −8474.64 | −8325.57 | 0.10 |
| 3 | Alnus glutinosa (L.) Gaertn. | 751 | 0.63 | −2030.33 | −1898.28 | 0.06 |
| 4 | Carya ovata (Mill.) K. Koch | 1480 | 0.37 | −4811.24 | −4630.23 | 0.05 |
| 5 | Chamaecyparis lawsoniana (A. Murr.) Parl. | 746 | 0.63 | −2339.16 | −2210.56 | 0.05 |
| 6 | Fagus sylvatica L. | 15,192 | 0.34 | −32,418.84 | −32,119.48 | 0.08 |
| 7 | Larix decidua Mill. | 852 | 0.77 | −2072.77 | −1950.82 | 0.07 |
| 8 | Larix kaempferi (Lamb.) Carrière | 3604 | 0.64 | −6859.32 | −6631.49 | 0.09 |
| 9 | Picea abies (L.) H. Karst. | 4384 | 0.42 | −9854.33 | −9611.36 | 0.08 |
| 10 | Pinus sylvestris L. | 103,078 | 0.73 | −167,620.05 | −167,239.88 | 0.11 |
| 11 | Pseudotsuga menziesii (Mirbel) Franco | 23,538 | 0.43 | −25,536.73 | −25,226.38 | 0.14 |
| 12 | Quercus petraea (Mattuschka) Liebl. | 8651 | 0.37 | −22,097.66 | −21,825.20 | 0.07 |
| 13 | Quercus robur L. | 1881 | 0.40 | −6166.94 | −5973.88 | 0.05 |
| 14 | Quercus rubra L. | 1496 | 0.54 | −2511.86 | −2326.67 | 0.10 |
| 15 | Robinia pseudoacacia L. | 1648 | 0.53 | −3722.69 | −3533.86 | 0.08 |
| 16 | Thuja plicata Donn ex D. Don. | 3545 | 0.60 | −7175.57 | −6956.55 | 0.09 |
| 17 | Tilia cordata Mill. | 2215 | 0.20 | −3485.10 | −3314.52 | 0.11 |
| 18 | Tsuga heterophylla (Raf.) Sarg. | 413 | 0.67 | −789.06 | −667.54 | 0.09 |
References
- Vacek, Z.; Vacek, S.; Cukor, J. European forests under global climate change: Review of tree growth processes, crises and management strategies. J. Environ. Manag. 2023, 332, 117353. [Google Scholar] [CrossRef]
- Charru, M.; Seynave, I.; Hervé, J.-C.; Bertrand, R.; Bontemps, J.-D. Recent growth changes in Western European forests are driven by climate warming and structured across tree species climatic habitats. Ann. For. Sci. 2017, 74, 33. [Google Scholar] [CrossRef]
- Patacca, M.; Lindner, M.; Lucas-Borja, M.E.; Cordonnier, T.; Fidej, G.; Gardiner, B.; Hauf, Y.; Jasinevičius, G.; Labonne, S.; Linkevičius, E.; et al. Significant increase in natural disturbance impacts on European forests since 1950. Glob. Change Biol. 2023, 29, 1359–1376. [Google Scholar] [CrossRef]
- Schmitz, A.; Sanders, T.G.M.; Bolte, A.; Bussotti, F.; Dirnböck, T.; Peñuelas, J.; Pollastrini, M.; Prescher, A.-K.; Sardans, J.; Verstraeten, A.; et al. Responses of forest ecosystems in Europe to decreasing nitrogen deposition. In Atmospheric Nitrogen Deposition to Global Forests; Spatial Variations, Impacts, and Management Implications; Du, E., de Vries, W., Eds.; Academic Press: Cambridge, MA, USA, 2024; pp. 227–245. [Google Scholar] [CrossRef]
- Pretzsch, H.; Biber, P.; Schütze, G.; Uhl, E.; Rötzer, T. Forest stand growth dynamics in Central Europe have accelerated since 1870. Nat. Commun. 2014, 5, 4967. [Google Scholar] [CrossRef] [PubMed]
- Pretzsch, H.; Del Rio, M.; Arcangeli, C.; Bielak, K.; Dudzinska, M.; Forrester, D.I.; Klädtke, J.; Kohnle, U.; Ledermann, T.; Matthews, R.; et al. Forest growth in Europe shows diverging large regional trends. Sci. Rep. 2023, 13, 15373. [Google Scholar] [CrossRef]
- Kašpar, J.; Tumajer, J.; Altman, J.; Altmanová, N.; Čada, V.; Čihák, T.; Doležal, J.; Fibich, P.; Janda, P.; Kczka, R.; et al. Major tree species in Central European forests differ in their proportion of positive, negative, and nonstationary growth trends. Glob. Change Biol. 2024, 30, e17146. [Google Scholar] [CrossRef]
- Del Castillo, E.M.; Zang, C.S.; Buras, A.; Hacket-Pain, A.; Esper, J.; Serrano-Notivoli, R.; Hartl, C.; Weigel, R.; Klesse, S.; de Dios, V.R.; et al. Climate-change-driven growth decline of European beech forests. Commun. Biol. 2022, 5, 163. [Google Scholar] [CrossRef]
- Mensah, A.A.; Holmström, E.; Petersson, H.; Nyström, K.; Mason, E.G.; Nilsson, U. The millennium shift: Investigating the relationship between environment and growth trends of Norway spruce and Scots pine in northern Europe. For Ecol. Manag. 2021, 481, 118727. [Google Scholar] [CrossRef]
- Puchalka, R.; Dyderski, M.K.; Vitková, M.; Sádlo, J.; Klisz, M.; Netsvetov, M.; Prokopuk, Y.; Matisons, R.; Mionskowski, M.; Wojda, T.; et al. Black locust (Robinia pseudoacacia L.) range contraction and expansion in Europe under changing climate. Glob. Change Biol. 2020, 27, 1587–1600. [Google Scholar] [CrossRef]
- Frank, A.; Howe, G.T.; Sperisen, C.; Brang, P.; Clair, J.B.S.; Schmatz, D.R.; Heiri, C. Risk of genetic maladaption due to climate change in three major European species. Glob. Change Biol. 2017, 23, 5358–5371. [Google Scholar] [CrossRef]
- Mauri, A.; Girardello, M.; Forzieri, G.; Manca, F.; Beck, P.S.A.; Cescatti, A.; Strona, A. Assisted migration can reduce but not avert the decline of forest ecosystem services in Europe. Glob. Environ. Change 2023, 80, 102676. [Google Scholar] [CrossRef]
- Gömöry, D.; Krajmerová, D.; Hrivnák, M.; Longauer, R. Assisted migration vs clos-to-nature forestry: What are the prospects for tree populations under climate change? Cent. Eur. For. J. 2020, 66, 63–70. [Google Scholar] [CrossRef]
- Xu, W.; Prescott, C.E. Can assisted migration mitigate climate-change impacts on forests? For Ecol. Manag. 2024, 556, 121738. [Google Scholar] [CrossRef]
- Pretzsch, H.; del Rio, M.; Biber, P.; Arcangeli, C.; Bielak, K.; Brang, P.; Dudzinska, M.; Forrester, D.I.; Klädtke, J.; Kohnle, U.; et al. Maintenance of long-term experiments for unique insights into forest growth dynamics and trends: Review and perspectives. Eur. J. For. Res. 2019, 138, 165–185. [Google Scholar] [CrossRef]
- Degenhardt, A. Forstliche Versuchsflächen im Spannungsfeld zwischen Tradition, Innovation und Machbarkeit. Eberswalder Forstliche Schriftenreihe 2017, 65, 13–26. [Google Scholar]
- Landesforstanstalt Eberswalde. Ausländische Baumarten in Brandenburgs Wäldern. Ministerium für Landwirtschaft, Umweltschutz und Raumordnung; Hendrik Bäßler: Berlin, Germany, 2017; 232p. [Google Scholar]
- Sharma, R.P.; Brunner, A.; Eid, T.; Øyen, B.-H. Modeling dominant height growth from national forest inventory individual tree data with short time series and large age errors. For Ecol. Manag. 2011, 262, 2162–2175. [Google Scholar] [CrossRef]
- Engel, M.; Mette, T.; Falk, W.; Poschenrieder, W.; Fridman, J.; Skudnik, M. Modeling dominant tree heights of Fagus sylvatica L. using function-on-scalar regression based on forest inventory data. Forests 2023, 14, 304. [Google Scholar] [CrossRef]
- Pretzsch, H. Forest Dynamics, Growth and Yield. From Measurement to Model; Springer: Berlin/Heidelberg, Germany, 2009; pp. 187–189. [Google Scholar]
- DWD. Climate Data Center (CDC): Annual Regional Averages of Precipitation Height (Annual Sum) in mm, Version v21.3. Available online: https://cdc.dwd.de/portal/ (accessed on 8 October 2024).
- DWD. Climate Data Center (CDC): Annual Regional Averages of Air Temperature (Annual Mean) in °C (2 m Above Ground). Version v21.3. Available online: https://cdc.dwd.de/portal/ (accessed on 8 October 2024).
- Thornthwaite, C.W. An Approach toward a Rational Classification of Climate. Geogr. Rev. 1948, 38, 55–94. [Google Scholar] [CrossRef]
- Sachsenmeier, L.; Schnabel, F.; Dietrich, P.; Eisenhauer, N.; Ferlian, O.; Quosh, J.; Richter, R.; Wirth, C. Forest growth resistance and resilience to the 2018–2020 drought depend on tree diversity and mycorrhizal type. J. Ecol. 2024, 112, 1787–1803. [Google Scholar] [CrossRef]
- Thom, D.; Buras, A.; Heym, M.; Klemmt, H.-J.; Wauer, A. Varying growth responses of Central European tree species to the extraordinary drought period of 2018–2020. Agric. Forest Meteorol. 2023, 338, 109506. [Google Scholar] [CrossRef]
- Holsten, A.; Vetter, T.; Vohland, K.; Krysanova, V. Impact of climate change on soil moisture dynamics in Brandenburg with a focus on nature conservation areas. Ecol. Model. 2009, 220, 2076–2087. [Google Scholar] [CrossRef]
- Schmitz, A.; Sanders, T.G.M.; Bolte, A.; Bussotti, F.; Dirnböck, T.; Johnson, J.; Peñuelas, J.; Pollastrini, M.; Prescher, A.-K.; Sardans, J.; et al. Responses of forest ecosystems in Europe to decreasing nitrogen deposition. Environ. Pollut. 2019, 224, 980–994. [Google Scholar] [CrossRef]
- Pedersen, E.J.; Miller, D.L.; Simpson, G.L.; Ross, N. Hierarchical generalized additive models in ecology: An introduction with mgcv. PeerJ 2019, 7, e6876. [Google Scholar] [CrossRef]
- Wood, S.N. Generalized Additive Models: An Introduction with R, 2nd ed.; Chapman and Hall/CRC: Boca Raton, FL, USA, 2017; 476p. [Google Scholar]
- Calama, R.; Madrigal, G.; del Rio, M.; López-Senespleda, E.; Pardos, M.; Ruiz-Peinado, R.; Menéndez-Miguélez, M. Dynamic height growth equations and site index-based biomass models for young native species afforestations in Spain. Forests 2024, 15, 827. [Google Scholar] [CrossRef]
- Yue, C.; Kahle, H.-P.; Klädtke, J.; Kohnle, U. A growth-effective age-based periodic site-index for the estimation of dynamic forest site productivity under environmental changes. Ann. For. Sci. 2024, 81, 33. [Google Scholar] [CrossRef]
- Bozdogan, H. model selection and Akaike’s Information Criterion (AIC): The general theory and its analytical extensions. Psychometrika 1987, 52, 345–370. [Google Scholar] [CrossRef]
- Sutherland, C.; Hare, D.; Johnson, P.J.; Linden, D.W.; Montgomery, R.A.; Droge, E. Practical advice on variable selection and reporting Akaike information criterion. Proc. R. Soc. B 2023, 290, 2007. [Google Scholar] [CrossRef]
- Schwarz, G. Estimating the dimension of a model. Ann. Stat. 1978, 6, 461–464. [Google Scholar]
- Marra, G.; Wood, S.N. Practical variable selection for generalized additive models. Comput. Stat. Data An. 2011, 55, 2372–2387. [Google Scholar] [CrossRef]
- R Core Team. R: A Language and Environment for Statistical Computing; R Foundation for Statistical Computing: Vienna, Austria, 2023. [Google Scholar]
- Wood, S.N. Fast stable restricted maximum likelihood and marginal likelihood estimation of semiparametric generalized linear models. J. R. Statist. Soc. B 2011, 73, 3–36. [Google Scholar]
- Degenhardt, A. Algorithmen und Programme zur Waldwachstumskundlichen Auswertung von Versuchs- und Probeflächen; Landesforstanstalt Eberswalde: Eberswalde, Germany, 2001; 120p. [Google Scholar]
- Kauppi, P.E.; Posch, M.; Pirinen, P. Large impacts of climatic warming on growth of Boreal forests since 1960. PLoS ONE 2014, 9, e111340. [Google Scholar] [CrossRef]
- Sperlich, D.; Nadal-Sala, D.; Gracia, C.; Kreuzwieser, J.; Hanewinkel, M.; Yousefpour, R. Gains or losses in forest productivity under climate change? The Uncertainty of CO2 fertilization and climate effects. Forests 2020, 8, 141. [Google Scholar] [CrossRef]
- Etzold, S.; Ferretti, M.; Reinds, G.J.; Solberg, S.; Gessler, A.; Waldner, P.; Schaub, M.; Sompson, D.; Benham, S.; Hansen, K.; et al. Nitrogen deposition is the most important environmental driver of growth of pure, even-aged and managed European forests. For. Ecol. Manag. 2020, 458, 117762. [Google Scholar] [CrossRef]
- Gao, S.; Liang, E.; Liu, R.; Babst, F.; Camarero, J.J.; Fu, Y.H.; Piao, S.; Rossi, S.; Shen, M.; Wang, T.; et al. An earlier start of the thermal growing season enhances tree growth in cold humid areas but not in dry areas. Nat. Ecol. Evol. 2022, 6, 397–404. [Google Scholar] [CrossRef] [PubMed]
- Marqués, L.; Madrigal-González, J.; Zavala, M.A.; Camarero, J.J.; Hartig, F. Last-century forest productivity in a managed dry-edge Scots pine population: The two sides of climate warming. Ecol. Appl. 2018, 28, 95–105. [Google Scholar] [CrossRef]
- Thabeet, A.; Vennetier, M.; Gadbin-Henry, C.; Denelle, N.; Roux, M.; Caraglio, Y.; Vila, B. Response of Pinus sylvestris L. to recent climatic events in the French Mediterranean region. Trees 2009, 23, 843–853. [Google Scholar] [CrossRef]
- Taccoen, A.; Piedallu, C.; Seynave, I.; Perez, I.; Gégout-Petit, A.; Nageleisen, L.-M.; Bontemps, J.-D.; Gégout, J.-C. Background mortality drivers of European tree species: Climate change matters. Proc. R. Soc. B 2019, 286, 1900. [Google Scholar] [CrossRef]
- Reyer, C.P.O.; Bathgate, S.; Blennow, K.; Borges, J.G.; Bugmann, H.; Delzon, S.; Faias, S.P.; Garcia-Gonzalo, J.; Gardiner, B.; Gonzalez-Olabarria, J.R.; et al. Are forest disturbances amplifying or canceling out climate change-induced productivity changes in European forests? Environ. Res. Lett. 2017, 12, 034027. [Google Scholar] [CrossRef]
- Gazol, A.; Camarero, J.J. Compound climate events increase tree drought mortality across European forests. Sci. Tot. Environ. 2022, 816, 151604. [Google Scholar] [CrossRef]
- Senf, C.; Buras, A.; Zang, C.S.; Rammig, A.; Seidl, R. Excess forest mortality is consistently linked to drought across Europe. Nat. Commun. 2020, 11, 6200. [Google Scholar] [CrossRef]
- Senf, C.; Seidl, R. Persistent impacts of the 2018 drought on forest disturbance regimes in Europe. Biogeosciences 2021, 18, 5223–5230. [Google Scholar] [CrossRef]
- Wilczyński, S.; Kulej, M. The growth of seven Abies grandis provenances in the climatic conditions of the Polish Carpathian mountains. Dendrobiololgy 2019, 81, 1–13. [Google Scholar] [CrossRef]
- Cedro, A.; Nowak, G. A comparison of the chronologies of introduced versus native coniferous species growing in Northwestern Poland during periods of global warming. Sustainability 2024, 16, 2215. [Google Scholar] [CrossRef]
- Danek, M.; Danek, T. Recent changes in the climate-growth response of European larch (Larix decidua Mill.) in the Polish Sudetes. Trees 2022, 36, 803–817. [Google Scholar] [CrossRef]
- Rukh, S.; Sanders, T.G.M.; Krüger, I.; Schad, T.; Bolte, A. Distinct responses of European beech (Fagus sylvatica L.) to drought intensity and length—A review of the impacts of the 2003 and 2018-2019 drought events in Central Europe. Forests 2023, 14, 248. [Google Scholar] [CrossRef]
- Chakraborty, T.; Reif, A.; Matzarakis, A.; Saha, S. How does radial growth of water-stressed populations of European beech (Fagus sylvatica L.) trees vary under multiple drought events? Forests 2021, 12, 129. [Google Scholar] [CrossRef]
- Skovsgaard, J.P.; Vanclay, J.K. Forest site productivity: A review of the evolution of dendrometric concepts for even-aged stands. Forestry 2008, 81, 13–31. [Google Scholar] [CrossRef]
- Skovsgaard, J.P.; Vanclay, J.K. Forest site productivity: A review of spatial and temporal variability in natural site conditions. Forestry 2013, 86, 305–315. [Google Scholar] [CrossRef]
- Brandl, S.; Mette, T.; Falk, W.; Vallet, P.; Rötzer, T.; Pretzsch, H. Static site indices from different national forest inventories: Harmonization and prediction from site conditions. Ann. For. Sci. 2018, 758, 56. [Google Scholar] [CrossRef]
- Combaud, M.; Cordonnier, T.; Dupire, S.; Vallet, P. Climate change altered the dynamics of stand dominant height in forests during the past century—Analysis of 20 European tree species. For. Ecol. Manag. 2024, 553, 121601. [Google Scholar] [CrossRef]
- Socha, J.; Solberg, S.; Tymińska-Czabańska, L.; Tompalski, P.; Vallet, P. Height growth rate of Scots pine in Central Europe increased by 29% between 1900 and 2000 due to changes in site productivity. For. Ecol. Manag. 2021, 491, 119102. [Google Scholar] [CrossRef]
- Treml, V.; Mašsek, J.; Tumajer, J.; Rydval, M.; Čada, V.; Ledvinka, O.; Svoboda, M. Trends in climatically driven extreme growth reductions of Picea abies and Pinus sylvestris in Central Europe. Glob. Change Biol. 2021, 28, 557–570. [Google Scholar] [CrossRef] [PubMed]
- D’Andrea, G.; Šimůnek, V.; Pericolo, O.; Vacek, Z.; Vacek, S.; Corleto, R.; Olejár, L.; Ripullone, F. Growth response of Norway spruce (Picea abies [L.] Karst.) in Central Bohemia (Czech Republic) to climate change. Forests 2023, 14, 1215. [Google Scholar] [CrossRef]
- Brichta, J.; Šimůnek, V.; Bilek, L.; Vacek, Z.; Gallo, J.; Drozdowski, S.; Bravo-Fernández, J.A.; Mason, B.; Gomez, S.R.; Hájek, V.; et al. Effects of climate change on Scots pine (Pinus sylvestris L.) growth across Europe: Decrease of tree-ring fluctuation and amplification of climate stress. Forests 2024, 15, 91. [Google Scholar] [CrossRef]
- Mészáros, I.; Adorján, B.; Nyitrai, B.; Kanalas, P.; Oláh, V.; Levanič, T. Long-term radial growth and climate-growth relationships of Quercus petraea (Matt.) Liebel. and Quercus cerris L. in a xeric low elevation site from Hungary. Dendrochronologia 2022, 76, 126014. [Google Scholar] [CrossRef]
- Camarero, J.J.; Gazol, A.; Sangüesa-Barreda, G.; Vergarechea, M.; Alfaro-Sánchez, R.; Cattaneo, N.; Vicente-Serrano, S.M. Tree growth is more limited by drought in rear-edge forests most of the times. For. Ecosyst. 2021, 8, 25. [Google Scholar] [CrossRef]
- Diers, M.; Weigel, R.; Leuschner, C. Both climate sensitivity and growth trend of European beech decrease in the North German lowlands, while Scots pine still thrives, despite growing sensitivity. Trees 2022, 37, 523–543. [Google Scholar] [CrossRef]
- Thurm, E.A.; Hernandez, L.; Baltensweiler, A.; Ayan, S.; Rasztovits, E.; Bielak, K.; Zlatanov, T.M.; Hladnik, D.; Balic, B.; Freudenschuss, A.; et al. Alternative tree species under climate warming in managed European forests. For. Ecol. Manag. 2018, 430, 485–497. [Google Scholar] [CrossRef]
- Chakraborty, D.; Ciceu, A.; Ballian, D.; Garzón, M.B.; Bolte, A.; Bozic, G.; Buchacher, R.; Čepl, J.; Cremer, E.; Ducousso, A.; et al. Assisted migration can preserve the European forest carbon sink under climate change. Nat. Clim. Change 2024, 14, 845–852. [Google Scholar] [CrossRef]
- Schueler, S.; George, J.-P.; Karanitsch-Ackerl, S.; Mayer, K.; Klumpp, R.T.; Grabner, M. Evolvability of drought response in four native and non-native conifers: Opportunities for forest and genetic resource management in Europe. Front. Plant Sci. 2021, 12, 648312. [Google Scholar] [CrossRef]
- Petrik, P.; Grote, R.; Gömöry, D.; Kurjak, D.; Petek-Petrik, A.; Lamarque, L.J.; Konópková, A.S.; Mukarram, M.; Debta, H.; Fleischer, P. The role of provenance for the projected growth of juvenile European beech under climate change. Forests 2023, 14, 26. [Google Scholar] [CrossRef]
- Kormann, J.M.; van der Maaten, E.; Liesebach, M.; Liepe, K.J.; van der Maaten-Theunissen, M. High risk, high gain? Trade-offs between growth and resistance to extreme events differ in northern red oak (Quercus rubra L.). Front. Plant Sci. 2024, 15, 1374498. [Google Scholar] [CrossRef]
- Unterholzner, L.; Stolz, J.; van der Maaten-Theunissen, M.; Liepe, K.; van der Maaten, E. Site conditions rather than provenance drive tree growth, climate sensitivity and drought responses in European beech in Germany. For. Ecol. Manag. 2024, 572, 122308. [Google Scholar] [CrossRef]
| Species | Orig | Age | Years | Nb Plots | Nb Incr | Incr [m/Year] | |
|---|---|---|---|---|---|---|---|
| 1 | Abies grandis (Douglas ex D. Don) Lindl. | NN | 20–127 | 1955–2024 | 32 | 2298 | 0.1–1 |
| 2 | Acer pseudoplatanus L. | N | 5–124 | 1909–2022 | 14 | 4739 | 0–0.5 |
| 3 | Alnus glutinosa (L.) Gaertn. | N | 12–149 | 1900–2024 | 31 | 751 | 0–0.5 |
| 4 | Carya ovata (Mill.) K. Koch | NN | 43–138 | 1914–2021 | 8 | 1480 | 0–0.5 |
| 5 | Chamaecyparis lawsoniana (A. Murr.) Parl. | NN | 78–135 | 1955–2021 | 14 | 746 | 0–0.5 |
| 6 | Fagus sylvatica L. | N | 3–198 | 1884–2023 | 194 | 15,003 | 0–0.6 |
| 7 | Larix decidua Mill. | N | 22–130 | 1954–2021 | 17 | 852 | 0–0.6 |
| 8 | Larix kaempferi (Lamb.) Carrière | NN | 14–129 | 1953–2024 | 49 | 3604 | 0.1–0.7 |
| 9 | Picea abies (L.) H.Karst. | N | 25–139 | 1915–2023 | 112 | 4376 | 0.1–0.6 |
| 10 | Pinus sylvestris L. | N | 1–187 | 1886–2024 | 649 | 103,070 | 0–0.8 |
| 11 | Pseudotsuga menziesii (Mirbel) Franco | NN | 1–144 | 1914–2024 | 410 | 23,538 | 0–0.9 |
| 12 | Quercus petraea (Mattuschka) Liebl. | N | 20–200 | 1878–2023 | 96 | 8650 | 0–0.5 |
| 13 | Quercus robur L. | N | 12–200 | 1890–2023 | 14 | 1881 | 0.1–0.4 |
| 14 | Quercus rubra L. | NN | 1–134 | 1953–2021 | 33 | 1496 | 0.1–0.7 |
| 15 | Robinia pseudoacacia L. | NN | 14–119 | 1954–2020 | 13 | 1648 | 0.1–0.6 |
| 16 | Thuja plicata Donn ex D. Don. | NN | 13–139 | 1954–2024 | 55 | 3545 | 0–0.6 |
| 17 | Tilia cordata Mill. | N | 1–81 | 1954–2021 | 15 | 2215 | 0.1–0.6 |
| 18 | Tsuga heterophylla (Raf.) Sarg. | NN | 31–141 | 1953–2023 | 9 | 413 | 0.1–0.6 |
Disclaimer/Publisher’s Note: The statements, opinions and data contained in all publications are solely those of the individual author(s) and contributor(s) and not of MDPI and/or the editor(s). MDPI and/or the editor(s) disclaim responsibility for any injury to people or property resulting from any ideas, methods, instructions or products referred to in the content. |
© 2025 by the authors. Licensee MDPI, Basel, Switzerland. This article is an open access article distributed under the terms and conditions of the Creative Commons Attribution (CC BY) license (https://creativecommons.org/licenses/by/4.0/).
Share and Cite
Engel, M.; Hagemann, U.; Schröder, J. Long-Term Growth Trends of 18 Native and Non-Native Tree Species Based on Data from Experimental Plots Since 1878 in Brandenburg, Germany. Forests 2025, 16, 225. https://doi.org/10.3390/f16020225
Engel M, Hagemann U, Schröder J. Long-Term Growth Trends of 18 Native and Non-Native Tree Species Based on Data from Experimental Plots Since 1878 in Brandenburg, Germany. Forests. 2025; 16(2):225. https://doi.org/10.3390/f16020225
Chicago/Turabian StyleEngel, Markus, Ulrike Hagemann, and Jens Schröder. 2025. "Long-Term Growth Trends of 18 Native and Non-Native Tree Species Based on Data from Experimental Plots Since 1878 in Brandenburg, Germany" Forests 16, no. 2: 225. https://doi.org/10.3390/f16020225
APA StyleEngel, M., Hagemann, U., & Schröder, J. (2025). Long-Term Growth Trends of 18 Native and Non-Native Tree Species Based on Data from Experimental Plots Since 1878 in Brandenburg, Germany. Forests, 16(2), 225. https://doi.org/10.3390/f16020225