Article

Wood Species Differentiation: A Comparative Study of Direct Analysis in Real-Time and Chromatography Mass Spectrometry

1
New Zealand Forest Research Institute Ltd. (Scion), Rotorua 3010, New Zealand
2
ChemCentre, Resources and Chemistry Precinct, Cnr Manning Road and Townsing Drive, Bentley, WA 6102, Australia
3
The National Centre for Timber Durability and Design Life, University of Sunshine Coast, Brisbane, QLD 4102, Australia
*
Author to whom correspondence should be addressed.
Forests 2025, 16(2), 255; https://doi.org/10.3390/f16020255
Submission received: 19 December 2024 / Revised: 17 January 2025 / Accepted: 28 January 2025 / Published: 30 January 2025
(This article belongs to the Section Wood Science and Forest Products)

Abstract

:
This study reports for the first time the fingerprinting extractives analysis of the indigenous wood species of Podocarpus totara from New Zealand, Eucalyptus saligna from Australia and Pinus radiata imported from California, USA and grown in New Zealand. We evaluated the use of analytical techniques for wood species discrimination. We compared the chemical fingerprinting of extractive compounds obtained using traditional chromatographic techniques with direct analysis in real-time–time of flight-mass spectrometry (DART-TOF-MS) with the auxiliary of chemometrics and principal component analysis. The traditional wet chemistry analysis of wood extracts provided a comprehensive characterisation of all extractive components. However, the more eco-friendly, sustainable and faster DART-TOF-MS technique effectively distinguished between wood species when heartwood and sapwood samples were combined. Notably, neither wet chemistry nor DART-TOF-MS could clearly differentiate between heartwood and sapwood within the same wood species. DART-TOF-MS analysis demonstrates potential as a reliable quality control tool for identifying wood species necessary in commercial and timber trading markets as well as for detecting the illicit trade of counterfeit wood products.

1. Introduction

In New Zealand, the forest industry plays a pivotal role in the country’s economy, ranking as the third-largest source of export income, contributing NZD 6 billion annually. The sector encompasses a mix of native and exotic species, necessitating precise species identification for sustainable management and compliance with trade regulations. New Zealand is home to unique native tree species used for solid wood, many of which are highly valued for their ecological importance and timber properties. The mostly traded native species are: Kauri (Agathis australis), Rimu (Dacrydium cupressinum), Tōtara (Podocarpus totara), Matai (Prumnopitys taxifolia) and Kahikatea (Dacrycarpus dacrydiodes). Meanwhile, the country’s commercial forestry is dominated by exotic species which are used for plantation forestry, such as Radiata pine (Pinus radiata), Douglas-fir (Pseudotsuga menziesii) and Eucalyptus species. Moreover, the conservation of native wood species delivers significant ecological, cultural and economic benefits. This aligns with key objectives of New Zealand’s timber industry, such as biodiversity preservation and promoting high-value timber market. Sustainable harvesting can supply specialty timber for niche markets while complementing plantation forestry for commercial species like Pinus radiata. Prioritising the conservation of native species enables New Zealand to strike a balance between environmental stewardship and economic growth, fostering a thriving timber industry alongside a healthy natural ecosystem.
In recent years, plantation-grown tōtara has been investigated for the commercialisation of its high-value timber; however, few challenges remain unsolved, and research for an adaptive management strategy, which incorporates all life stages of tōtara, the specie’s ecological characteristics, growth patterns and potential for sustainable commercialisation, is underway [1,2].
Accurate wood species identification is critical across industries, such as forestry, conservation, law enforcement, and trade. The commonly used methods are visual methods (macroscopic and microscopic analysis and wood anatomy databases such as CITESwoodID and InsideWood); genetic methods (DNA barcoding and fingerprinting), and chemical methods (near infrared spectroscopy; stable isotope mass spectrometry (MS), radiocarbon MS and conventional MS). The visual methods are mainly used as diagnostic tools for genus identification, and their application is often limited by the availability of skilled anatomists [3,4]. DNA barcoding requires a case-specific identification system to be developed [5], but its efficiency and applicability is increasing with the development of online databases [6]. Among the chemical methods, near-infrared spectroscopy provides promising results in differentiating certain species [7,8], and Fourier transform infrared spectroscopy has been implemented with multivariate analysis for fast differentiation at low costs [9]; however, they both require a reference database, which are currently regional specific. All these methods have similar requirements, provide opportunities, and present similar challenges; however, they all would benefit from an improved access to reference material which will enable the development of effective tests.
In light of this and given the limited information available on New Zealand wood species differentiation, we have conducted the first-ever investigation into the use of mass spectrometry as a tool for species identification. Mass spectrometry represents a powerful tool extensively used in a wide range of applications because it delivers comprehensive chemical information about the constituents of a given sample. It relies on the use of mass spectral databases which are commercially available including plant databases (CITES, PlantCyc, METLIN, etc.). It is often coupled with chromatography to allow the separation of compounds based on their polarity before mass composition characterisation of the complex sample extracts. Depending on the extract’s compounds chemical properties, gas or liquid chromatography mass spectrometry is used (GC-MS and LC-MS). In 2005, a new direct analysis in real time (DART) MS source was developed and applied for the direct detection of chemicals on surfaces [10]. DART ionisation coupled with time of flight (TOF) MS allows the analysis of solid, liquid, or gaseous samples directly in the source of the spectrometer with no prior solvent extraction required. It has been used for a variety of applications across a range of disciplines [3,11,12,13]. Due to the lack of separation, this technique is often used in combination with known reference samples to generate statistical models in order to distinguish between different classes. This approach has been utilised in tree science—to distinguish between similar tree species [14] or between wild-type and cultivated trees [15]. Some studies have compared MS data from DART with data from traditional wet chemistry extraction followed by GC-MS and LC-MS analysis. Unsurprisingly, for some applications such as distinguishing different pen inks on paper, the lack of separation limited the use of the technique as a stand-alone analysis [16]. DART was not able to detect different fluorescent compounds between inks but could detect different polymer fragments from carrier molecules within the inks. However, when combined with robust statistical models, Liang et al. [17] found that DART was better than LC-MS or GC-MS at discriminating between black pepper samples from different countries of origin. The development of a high-throughput method for unprocessed crude materials and the accurate identification of marker components by DART-TOF-MS has increasingly attracted interest for various applications, including polar and nonpolar small molecule metabolites in wood tissues and timber samples.
The use of DART-TOF-MS coupled with statistical analysis enabled the rapid differentiation of two morphologically similar species Pterocarpus santalinus and Pterocarpus tinctorius [18]; the geographical origin of Angelica gigas roots collected in China and Korea [19]; the species differentiation of hardwood of white oak and northern red oak used in commercial use [20]; the analysis of selected Dalbergia and trade timber evaluating and distinguishing agarwood products [15,21]; the discrimination of the selected Convention on International Trade in Endangered Species of Wild Fauna and Flora (CITES)-protected Araucariaceae [22], and the source identification of western Oregon Douglas-fir wood cores [23].
MS is traditionally coupled with chromatography techniques like GC-MS or LC-MS to enable the separation and identification of complex mixtures. However, these methods are time-intensive and rely heavily on solvent extraction. Recent advancement, such as DART-TOF-MS, has revolutionised the field by allowing direct sample analysis without extensive preparation. DART-TOF-MS has been successfully employed in various applications, including timber species differentiation, geographic origin identification, and the detection of counterfeit wood products. Studies have demonstrated its potential and its limitations for distinguishing morphologically similar tree species, evaluating trade timber, and analysing CITES-protected species [24]. Despite its growing use, data on New Zealand’s indigenous and exotic wood species differentiation remain scarce.
In our study, we address this critical gap by comparing traditional chromatographic methods (GC-MS and LC-MS) with the DART-TOF-MS technique for analysing a selection of New Zealand’s wood species. By examining wood extractive content and employing chemometric analyses, we aim to evaluate the efficiency and accuracy of DART-TOF-MS as a species differentiation tool. The findings of our scoping study could pave the way for enhanced quality control, conservation efforts, and regulatory compliance in both local and international timber markets.

2. Materials and Methods

2.1. Sample Preparation

This study analysed Podocarpus totara as a representative of New Zealand’s indigenous species due to its ecological and cultural significance. To provide a comparative analysis of exotic species relevant to the forestry sector, samples of Pinus radiata and Eucalyptus globoidea were also included. These species were selected based on their prominence in commercial forestry operations within New Zealand. For each species, heartwood and sapwood samples of six trees were collected with approximate tree age varying from 40 to 100 years and were analysed in triplicate.
For wet chemistry, i.e., GC-MS and LC-MS analyses, oven-dried chips were ground to a powder using a Wiley mill grinder prior to being processed as per the method below. For DART-TOF-MS analysis, small slivers (10 × 2 mm, 9 for each sample) were cut off with a razor blade from each wood sample and put in a capillary tube. For the samples analysed by DART-TOF-MS with solvent, a small aliquot (10 µL) of solvent was added to a wood sliver on the top of the tube (enough to wet) just prior to putting it into the instrument’s probe.

2.1.1. Extraction Method for LC-MS

In order to qualitatively characterise water-soluble components of the wood extracts, solvent extraction with polar solvents was applied. The extraction procedure was adapted from one previously published by Zhu et al. [25]. Powdered wood samples (100 mg each) were suspended in 80% methanol/water (5 mL each) (Merck Life Science Ltd., Auckland, New Zealand, hypergrade for LC-MS LiChrosolv grade; MilliQ water), and the samples ultrasonicated for 20 min. The samples were centrifuged at 3900 rpm for 10 min. Supernatant (1 mL) was removed and transferred to 2 mL Eppendorf tubes. The tubes were centrifuged at 14,000 rpm for 10 min. An aliquot (800 µL) of supernatant was removed, filtered through a 0.22 µm PTFE filter, transferred to an LC-MS vial, and analysed directly.

2.1.2. Extraction Method for GC-MS

In order to qualitatively characterise water-insoluble components of the wood extracts, solvent extraction with apolar solvents was applied. Powered wood samples were extracted using a SoxtecTM 8000 instrument (FOSS, Hilleroed, Denmark). The sample (2.5 g) was weighed into a cellulose thimble with a cotton layer to avoid splashing and 5 glass balls to avoid solvent bubbles. The thimble was placed into the sample holder, and the sample was extracted with 60 mL n-hexane (Merck Life Science Ltd., for liquid chromatography LiChrosolv grade) at 130 °C for 120 min including equilibration time. After evaporation, the solid extract was dissolved in 1 mL of dichloromethane and transferred to a GC-MS glass vial. Trimethylsilyl derivatives were obtained by adding 50 µL pyridine and 50 µL N,O-bis(trimethylsilyl)trifluoroacetamide (BSTFA) (Merck Life Science Ltd.) and incubating for 60 min at 70 °C. Derivatised extracts were analysed directly by GC-MS.

2.2. Sample Analysis

2.2.1. LC-MS Analysis Method

The samples were analysed using a UPLC-QTOF spectrometer equipped with a 1290 high-speed binary pump, 1290 multisampler, 1290 multi-column thermostat, 1260 diode array detector, and AdvanceBio 6545XT QTOF mass spectrometer with a Dual AJS ESI source in negative ion mode (Agilent Technologies Inc., Santa Clara, CA, USA). The chromatography separation was achieved using a Poroshell 120 EC-C18 150 × 3 mm, 2.7 µm column (Agilent Technologies Inc.) with column temperature set at 35 °C and flow rate of 0.4 mL/min. The mobile phase consisted of solvent A: 100% water (Merck Life Science Ltd., LC-MS Grade, LiChrosolv) + 0.1% formic acid (Optima LC-MS Grade, Fisher Chemical, Pittsburgh, PA, USA); solvent B: 100% acetonitrile (Merck Life Science Ltd., hypergrade for LC-MS LiChrosolv grade) + 0.1% formic acid. Starting conditions were 5% B, the gradient was held at this ratio for 2 min, increased to 20% B over 23 min, held at 20% for 2 min, increased to 100% B over 18 min, held at 100% for 1 min, and then brought to starting conditions over 3 min. The total run time was 50 min post time at initial conditions of 2 min. The sample injection volume was 5 µL. The MS source parameters were gas temperature 350 °C, drying glass flow 9 L/min, nebuliser pressure 35 psi, sheath gas temperature 320 °C, sheath gas flow 9 L/min, capillary voltage 3500 V, and nozzle voltage 2000 V. The MS TOF settings were fragmentor 65 V, skimmer 45 V and Oct RF Vpp 750 V. Auto MS/MS fragmentation was carried out to facilitate compound identification. An absolute threshold of 500 counts was used for precursor ions selection. The precursor ions of the reference standards were used as preferred ions of 100 ppm Delta m/z and a “medium (~4 m/z)” isolation window. Two reference ions with m/z of 179.0344 and 861.1873 were used as internal mass calibrants.

2.2.2. GC-MS Analysis Method

Analyses were performed on a gas chromatograph 7890 A coupled with a 5977 single quadrupole mass spectrometer (Agilent Technologies Inc.), which was fitted with a multipurpose sampler (Gerstel GmbH & Co. KG, Mülheim an der Ruhr, Germany). Gas chromatography separation was performed on a 50 m Ultra-2 column with 0.20 mm inner diameter and 0.33 µm film thickness (J&W Agilent Technologies Inc.). Then, 1 µL aliquot of each sample was injected. The inlet temperature was set at 280 °C, and a splitless injection was performed. The carrier gas used was helium set at a constant flow rate of 1.0 mL/min. The oven temperature was set at 40 °C, held for 2 min, ramped to 300 °C at 10 °C/min and held for 20 min. The interface was set to 250 °C, and the ion source adjusted to 250 °C. Mass spectra were recorded at 0.1 scan per sec with an m/z 50–600 scanning range. The chromatograms and mass spectra were evaluated using MassHunter software v10.0 and NIST 2014 mass spectra library.

2.2.3. DART-TOF-MS Analysis Method

Wood slivers were analysed on an AdvanceBio 6545XT Q-TOF mass spectrometer fitted with an Atmospheric Pressure Chemical Ionisation (APCI) source adapted for use with an ASAP Direct Analysis in Real Time (DART) probe (Agilent Technologies Inc.). MS data were acquired in negative ion mode. The MS source parameters were gas temperature 250 °C, drying glass flow 13 L/min, nebuliser pressure 35 psi, vaporiser 350 °C, VCap 3500 V, Corona negative 3 kV. The MS TOF settings were fragmentor 65 V and skimmer 65 V. The instrument was tuned and calibrated prior to each analysis following the manufacturer’s procedure. For the DART-TOF-MS analysis with solvents, dichloromethane, methanol and acetonitrile were individually added in 10 µL aliquots on the sample prior to analysis.

2.3. Data Analysis

2.3.1. LC-MS and GC-MS Data Processing

The chromatograms and associated mass spectra were processed using the Find by Molecular Feature (LC-MS) and Find by Chromatogram Deconvolution (GC-MS) workflows in MassHunter Workstation Qualitative Analysis v10.0 (Agilent Technologies). The processing included chromatogram alignment; data mining and misalignment were excluded if the feature was not present in at least 2/3 of each dataset. The processed data were run through the mass spectral database (METLIN for LC-MS and NIST 2014 for GC-MS). The library hits were manually screened for likely presence in the wood according to the literature and scientific knowledge. Compound annotations were reported at mainly two confidence levels: level 1 (Confident) by matching the retention time and mass MS/MS spectrum with reference standards, level 2 (Probable) by matching to the literature and databases, [26]. LC-MS annotation was performed using ID settings as follows: relative height threshold > 1% largest peak, score tgt > 75%, Diff tgt < 5 ppm; for GC-MS, score with library was >75%, peak area threshold > 50,000.

2.3.2. DART-TOF-MS Data Processing

The chromatograms and relative mass spectra were aligned using the batch recursive feature extraction in MassHunter Profinder v10.0 (Agilent Technologies Ltd.) to obtain a list of molecular feature extract (MFE) for every wood species in each set of DART-TOF-MS data analysis.

2.3.3. Statistical Analyses

The processed and aligned data obtained for LC-MS, GC-MS, and DART-TOF-MS with and without solvent were imported into Mass Profiler Professional (MPP) software v10.0 (Agilent Technologies Ltd.) for the chemometric analysis.
One-way ANOVA was applied to identify the most significant mass spectral entities responsible for wood species differentiation (based on asymptotic p-values with a significance cut-off of 0.01). Principal Component Analysis (PCA) was applied to the height of each MFE to obtain insights into separations between the experimental groups. Orthogonal Partial Least Squares Discriminant Analysis (OPLS-DA) was used to produce easily interpretable models [27]. It is a supervised classification model, which further reduces noise and predicts group membership. We applied it to the set of entities selected by one-way ANOVA. OPLS-DA models were built using 3-fold cross-validation with 10 repeats. The OPLS-DA models adopted provided a list of markers that are responsible for this distinction called “variable influence in projection” (VIP). Each VIP has a corresponding score which relates to the importance of the marker according to the OPLS-DA model; in this study, VIP scores higher than 1 and significantly different among the three sets (t-test p < 0.05) were considered.

3. Results

3.1. Wood Extractives by LC-MS and GC-MS Analysis

The solvent extractable fraction is a small portion of the wood composition, which is typically between 1%–10% of the total structure [28]. In Podocarpus totara, 85 compounds were detected in the polar extract. Of these, 8 compounds were positively identified (level 1), and 52 were tentatively identified (level 2) (Table S1 in Supplementary Materials). In Eucalyptus globoidea wood extracts, 39 were detected; of these, 6 were positively identified (level 1), and 33 were tentatively identified (level 2) (Table S2 in Supplementary Materials). In Pinus radiata wood extracts, 28 compounds were detected of which 1 was positively identified (level 1) and 27 (Table S3 in Supplementary Materials) were tentatively identified (level 2). The main classes of compounds identified were polyphenols, tannins and flavonoids.
In the Podocarpus totara, 57 compounds were detected in the apolar extracts, 3 were positively identified (level 1) and 17 compounds were tentatively identified (level 2) (Table S4 in Supplementary Materials). In Eucalyptus globoidea extracts, 46 compounds were detected, 2 were positively identified (level 1), and 10 could be tentatively identified (level 2) (Table S5 in Supplementary Materials). In Pinus radiata extracts, 43 compounds were detected; of these, 15 compounds were positively identified (level 1) and 9 were tentatively identified (level 2) (Table S6 in Supplementary Materials). The main classes of lipophilic compounds identified comprise aromatics, terpenes, resin acids, fatty acids and steroids. In the subsequent comparisons and investigations, however, both identified and unidentified compounds were included and considered.

3.2. DART-TOF-MS Analysis

DART-TOF-MS analyses were performed on slivers of dry wood with and without the addition of small volumes of solvents (i.e., methanol, acetonitrile, and dichloromethane) of Pinus radiata, Eucalyptus globoidea and Podocarpus totara to compare the results with those obtained using traditional wet chemistry techniques. Analyses were performed in negative ion mode only, as previous studies have confirmed that the main differences are clearly pronounced in negative-ion mass spectra [11,20]. Representative DART-TOF-MS spectra of the extractives fingerprint for heartwood and sapwood of all wood species analysed, with and without solvents, are reported (Figures S1–S4 in Supplementary Materials). They are all characterised by common ions: 283.2645 m/z, 369.3237 m/z, 319.2399 m/z, 301.2170 m/z, 299.2512 m/z, and 255.2330 m/z (in-source contaminant) whose concentration varies across samples. However, it was not possible to distinguish the species based on their major peaks as their contribution was not significant; hence, no annotation for these ions is reported. Considering the big datasets obtained, a chemometric approach was implemented and described in the sections below.

3.3. Chemometric Analysis

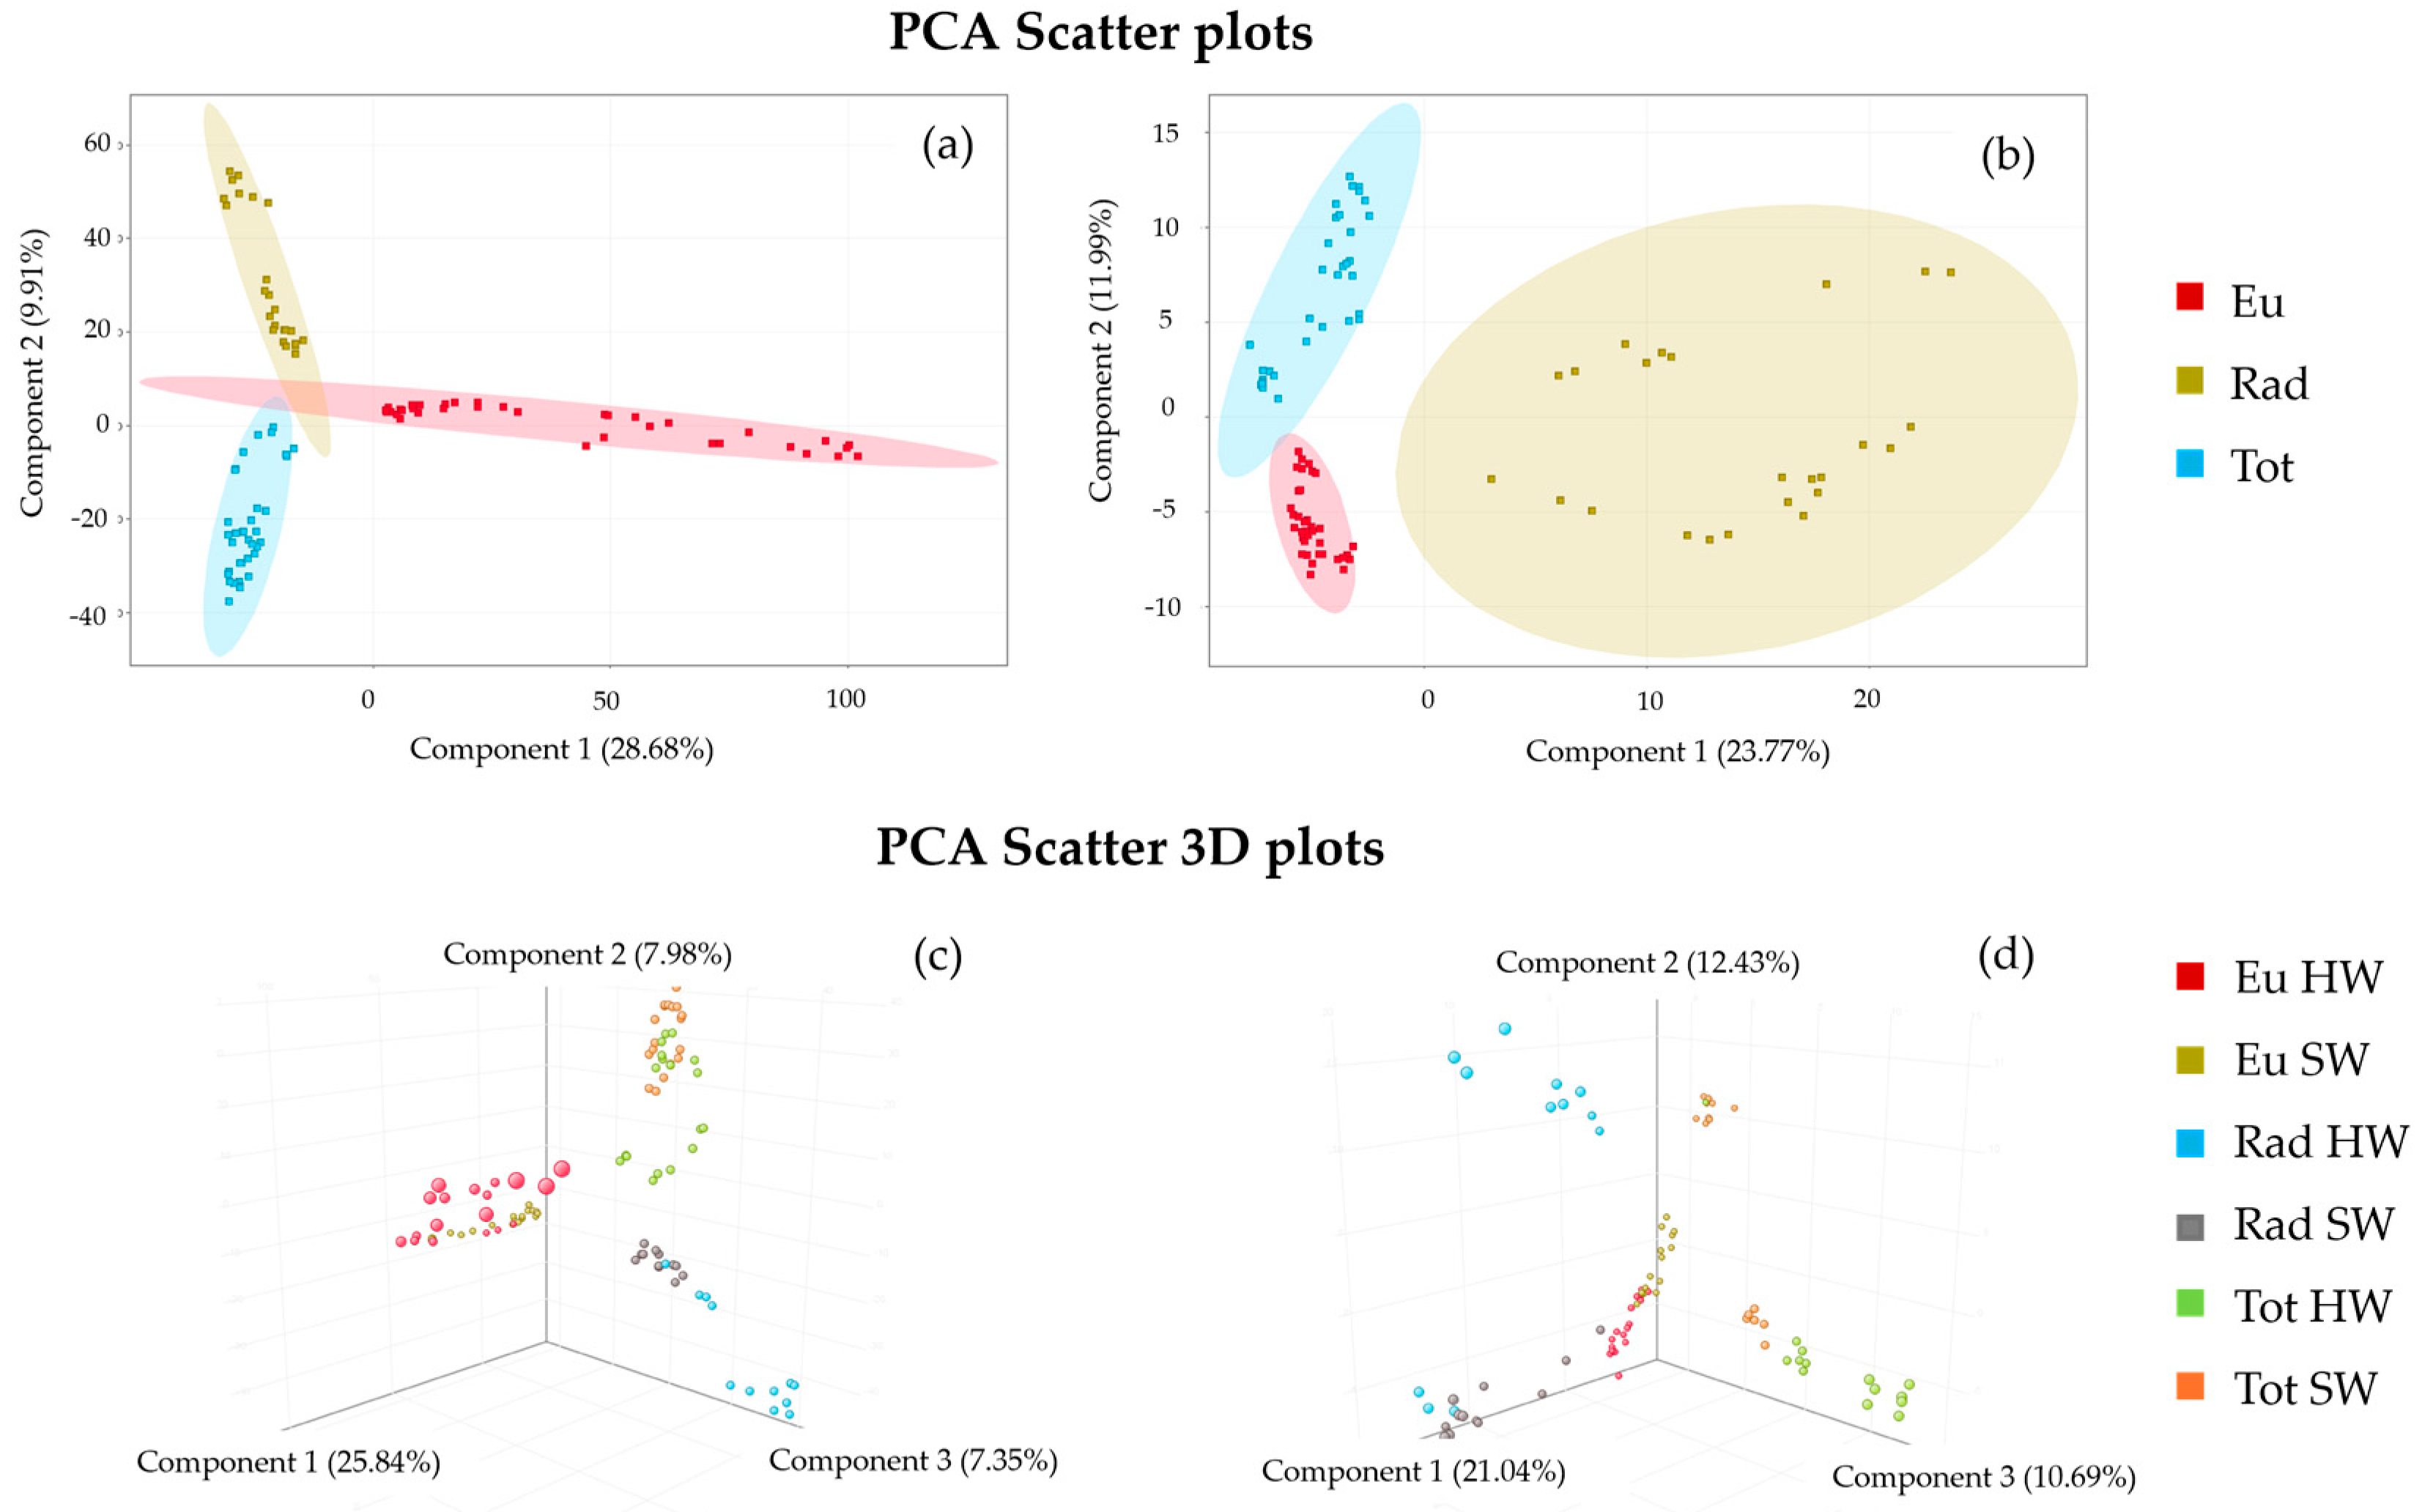
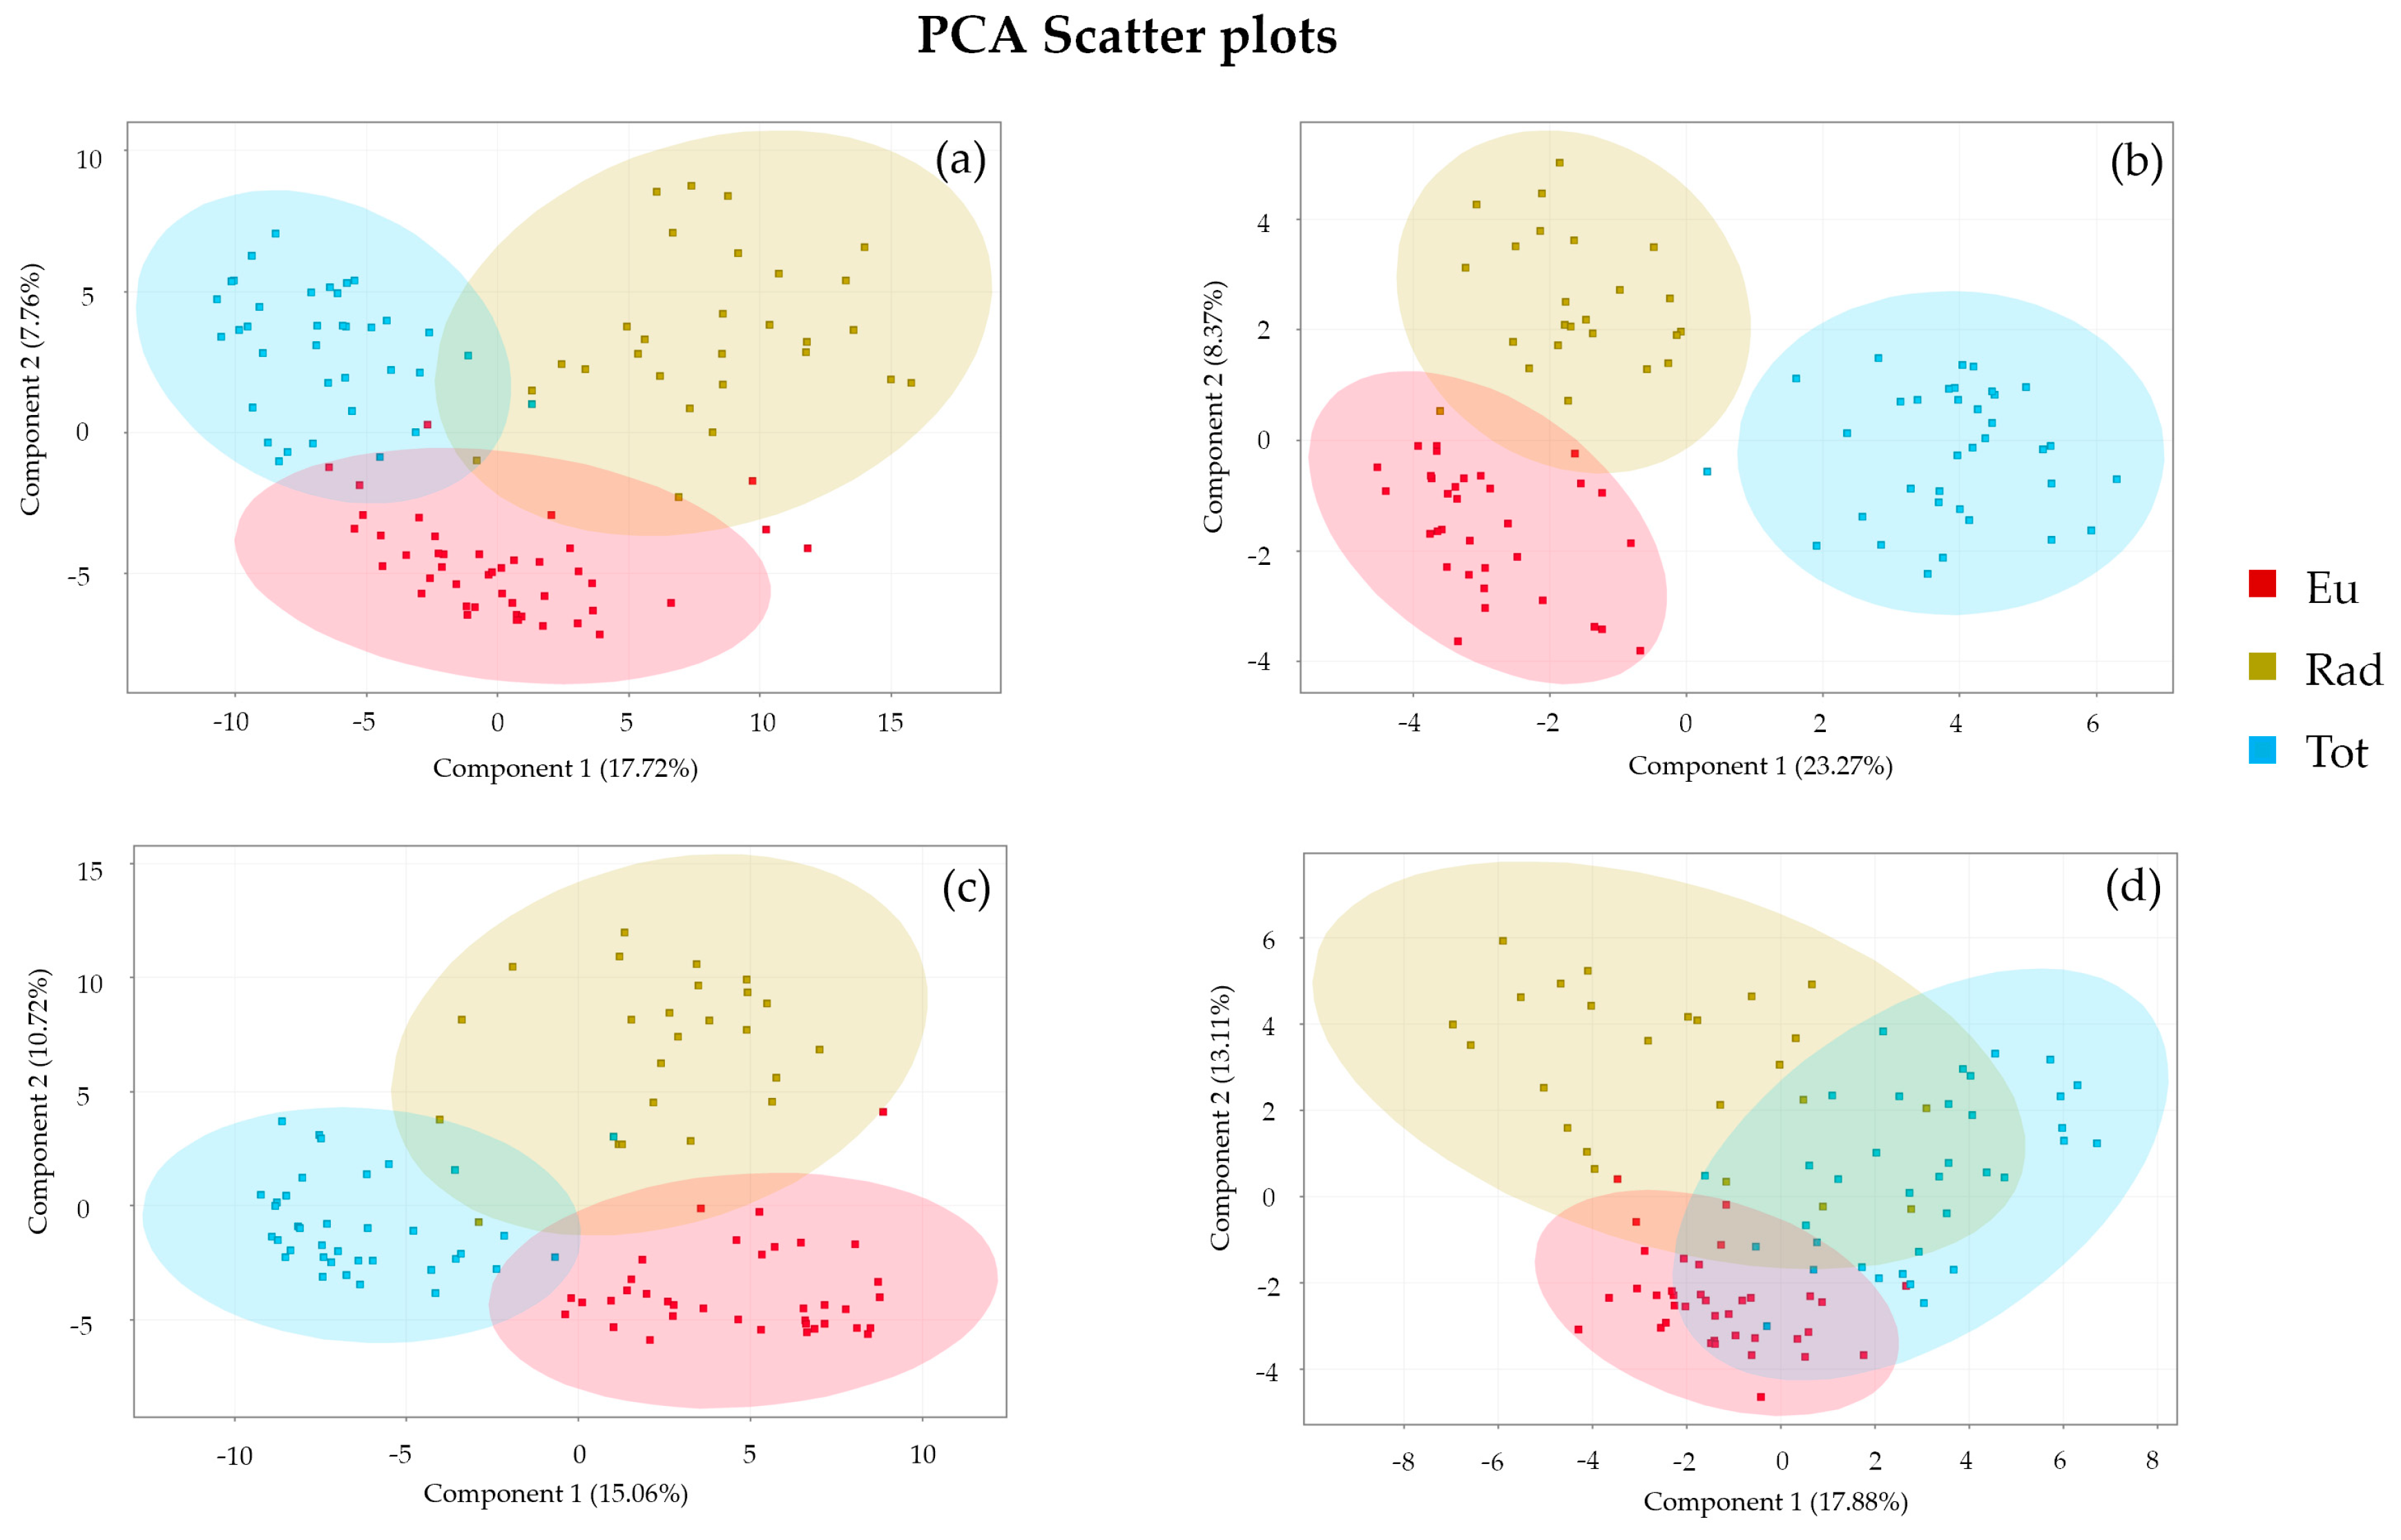
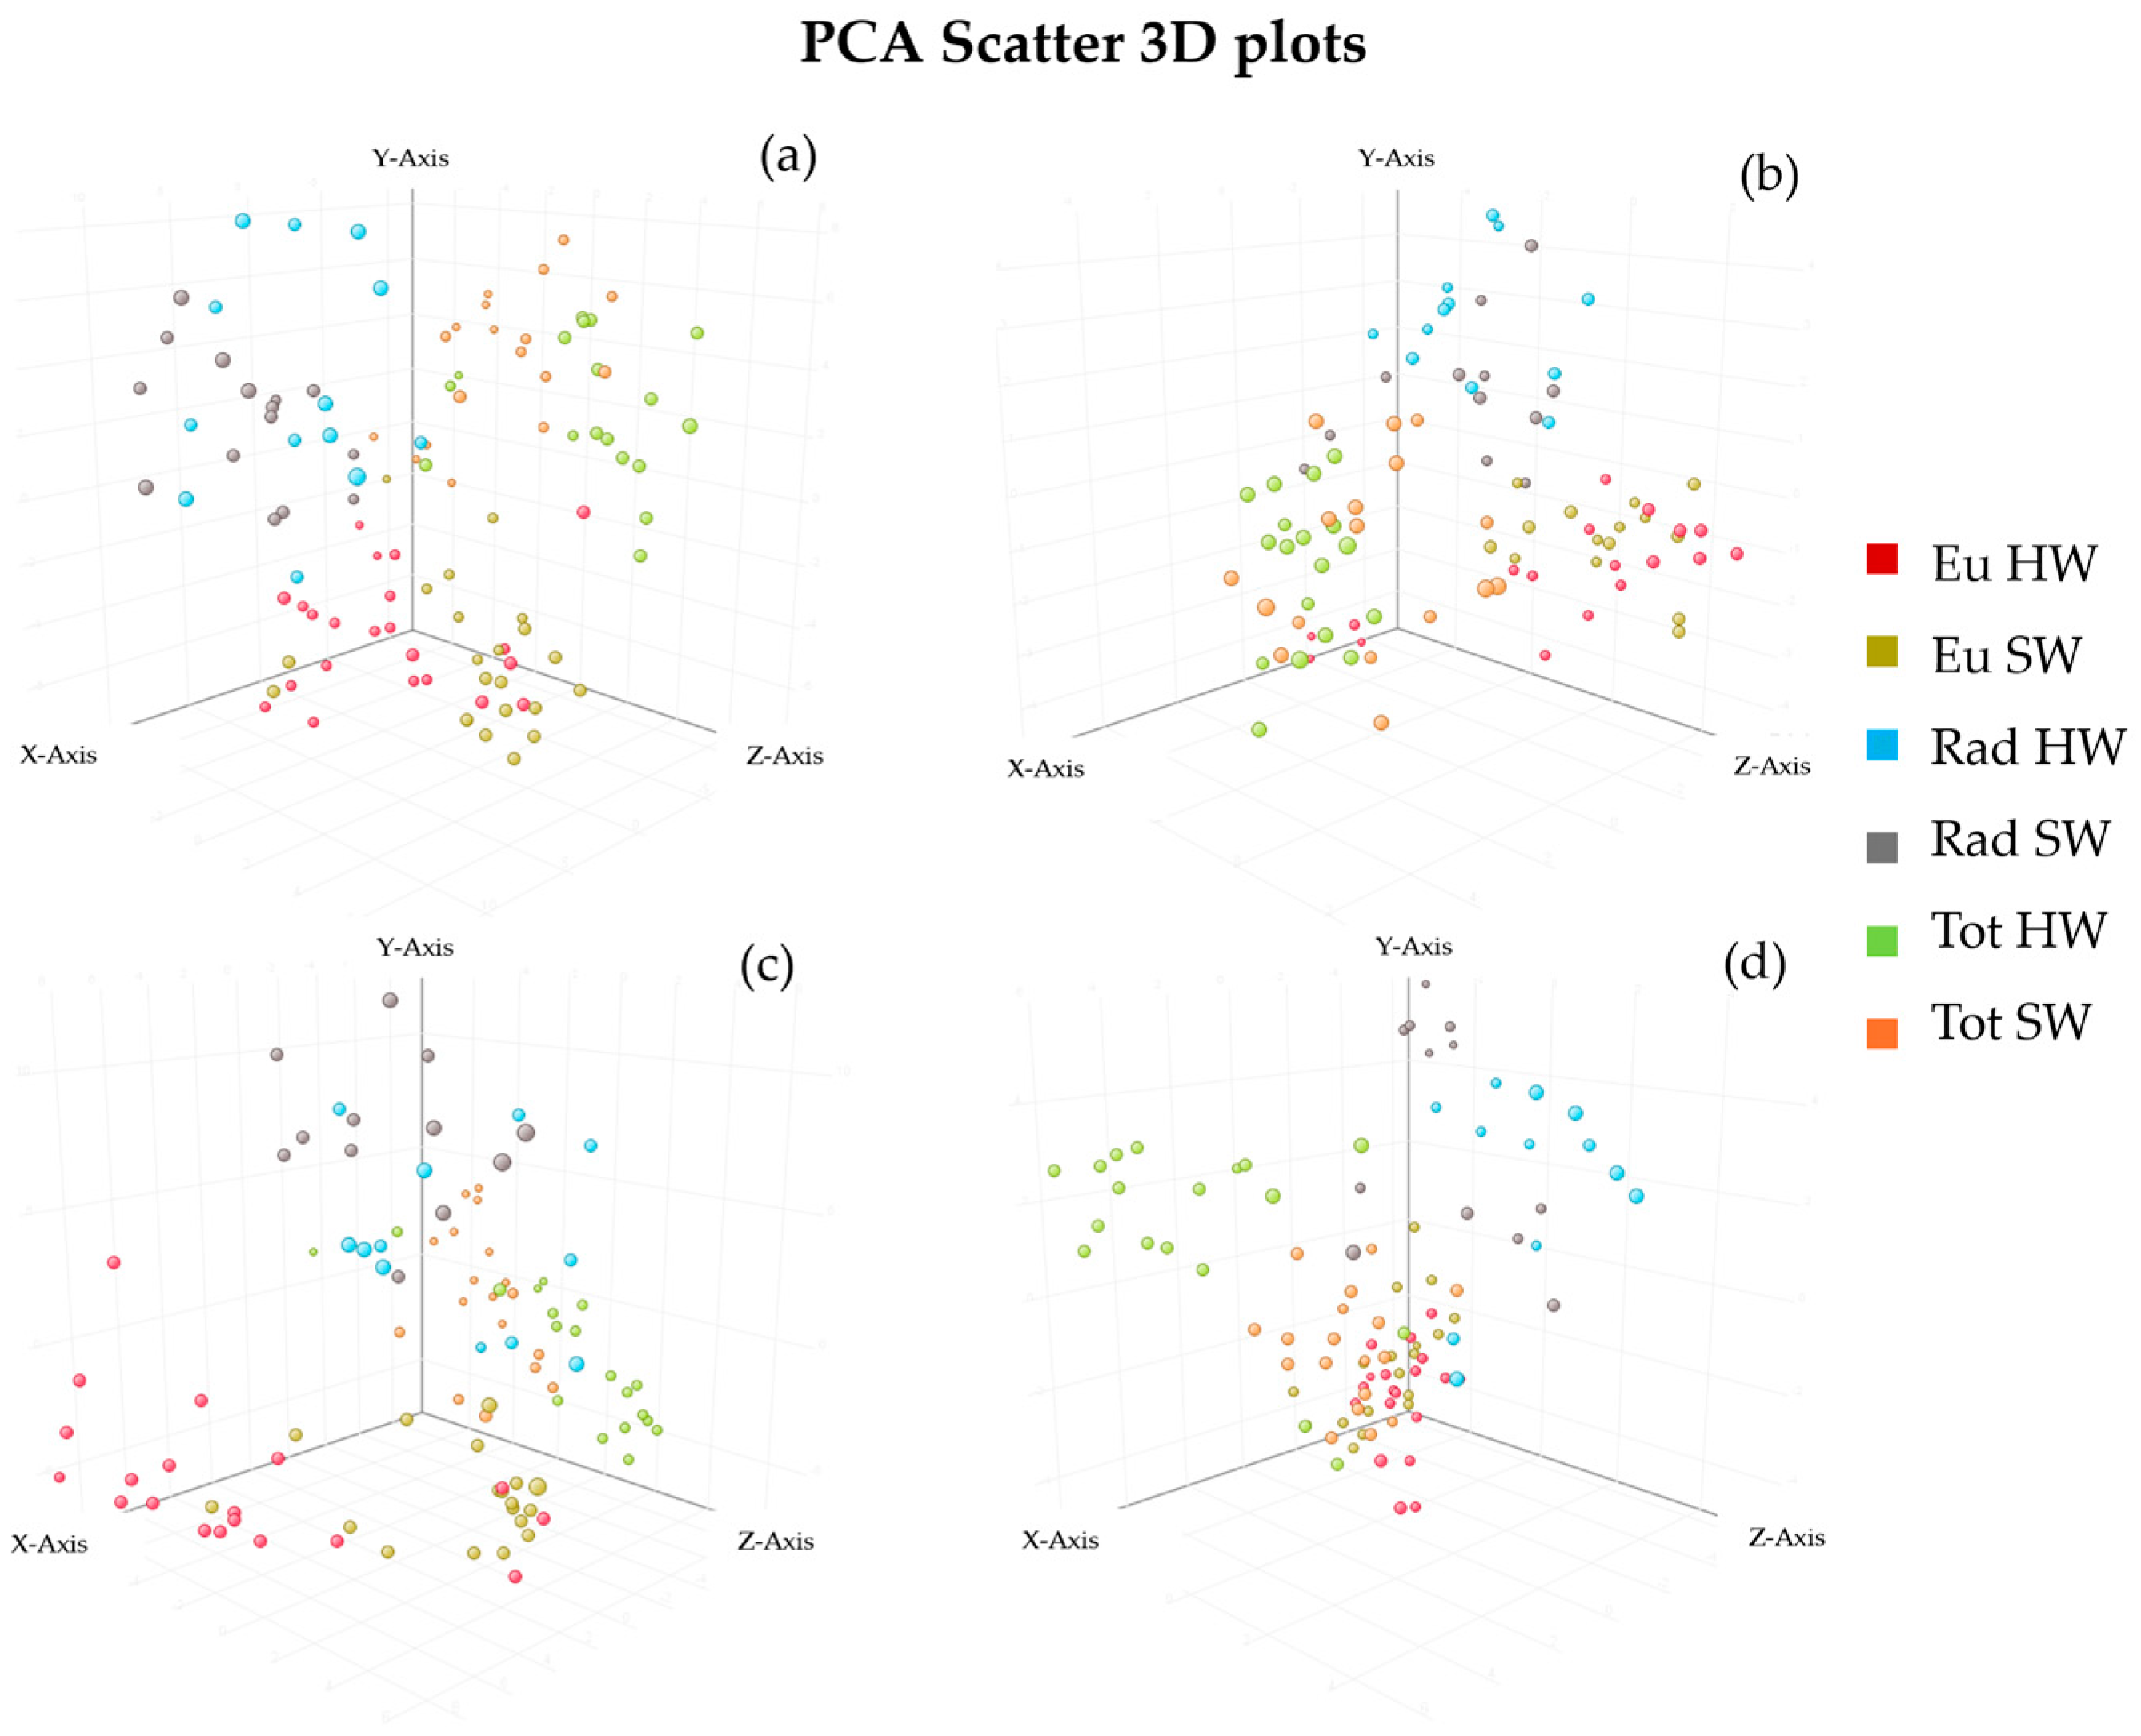
3.3.1. Principal Component Analysis

PCA was used to compare the ability of each analytical technique to discriminate the dataset of samples belonging to different wood species analysed by GC-MS, LC-MS and DART-TOF-MS with and without solvents. The correspondent PCA score plots are reported in the graphs below (Figure 1, Figure 2 and Figure 3).
PCA of the polar extracts, analysed by LC-MS, is reported in Figure 1a. The first two principal components accounted for 38.59% of the variance; nevertheless, the combined sapwood/heartwood samples of the three species are clearly differentiated. If the classification of heartwood and sapwood was included, a weak separation of the wood type is obtained (Figure 1c). The three wood species were clearly differentiated for the apolar extracts derivatised with BSTFA and analysed by GC-MS (Figure 1b). The total variance accounted for the first two components is 35.76%. Similarly to the LC-MS analysis, when the heartwood/sapwood classification is included, a weak separation of the wood types is obtained (Figure 1d).
In the DART-TOF-MS analysis of samples without solvent, the wood species were clustering by species by one-way ANOVA PCA with some minor overlap of a few samples (Figure 2a). The total variance accounted for the first two components is 25.48%. However, when the wood classification was included, the heartwood and sapwood were not clearly differentiated (Figure 3a).
In order to increase the differentiation of species and wood types, a small amount of solvent was added to the slivers of wood samples before direct analysis by DART-TOF-MS. In DART-TOF MS analyses with dichloromethane, the solvent helped to enhance the differentiation of the wood species (Figure 2b) with a total variance of first components of 31.60%, similarly to the GC-MS results. In DART-TOF-MS analyses with methanol, the differentiation of the wood species is comparable to the samples without solvent (Figure 2c) with a total variance of first components of 25.78%. Lastly, in DART-TOF-MS with acetonitrile, the differentiation was weaker due to the substantial overlapping of samples. Poor differentiation was observed between heartwood and sapwood for all experiments by DART-TOF-MS (Figure 3a–d). The best results obtained using dichloromethane confirm that the DART-TOF-MS technique may be suitable as a tool to distinguish wood species, resulting in similar differentiations obtained with the traditional wet chemistry analysis of the correspondent solvent extracts.

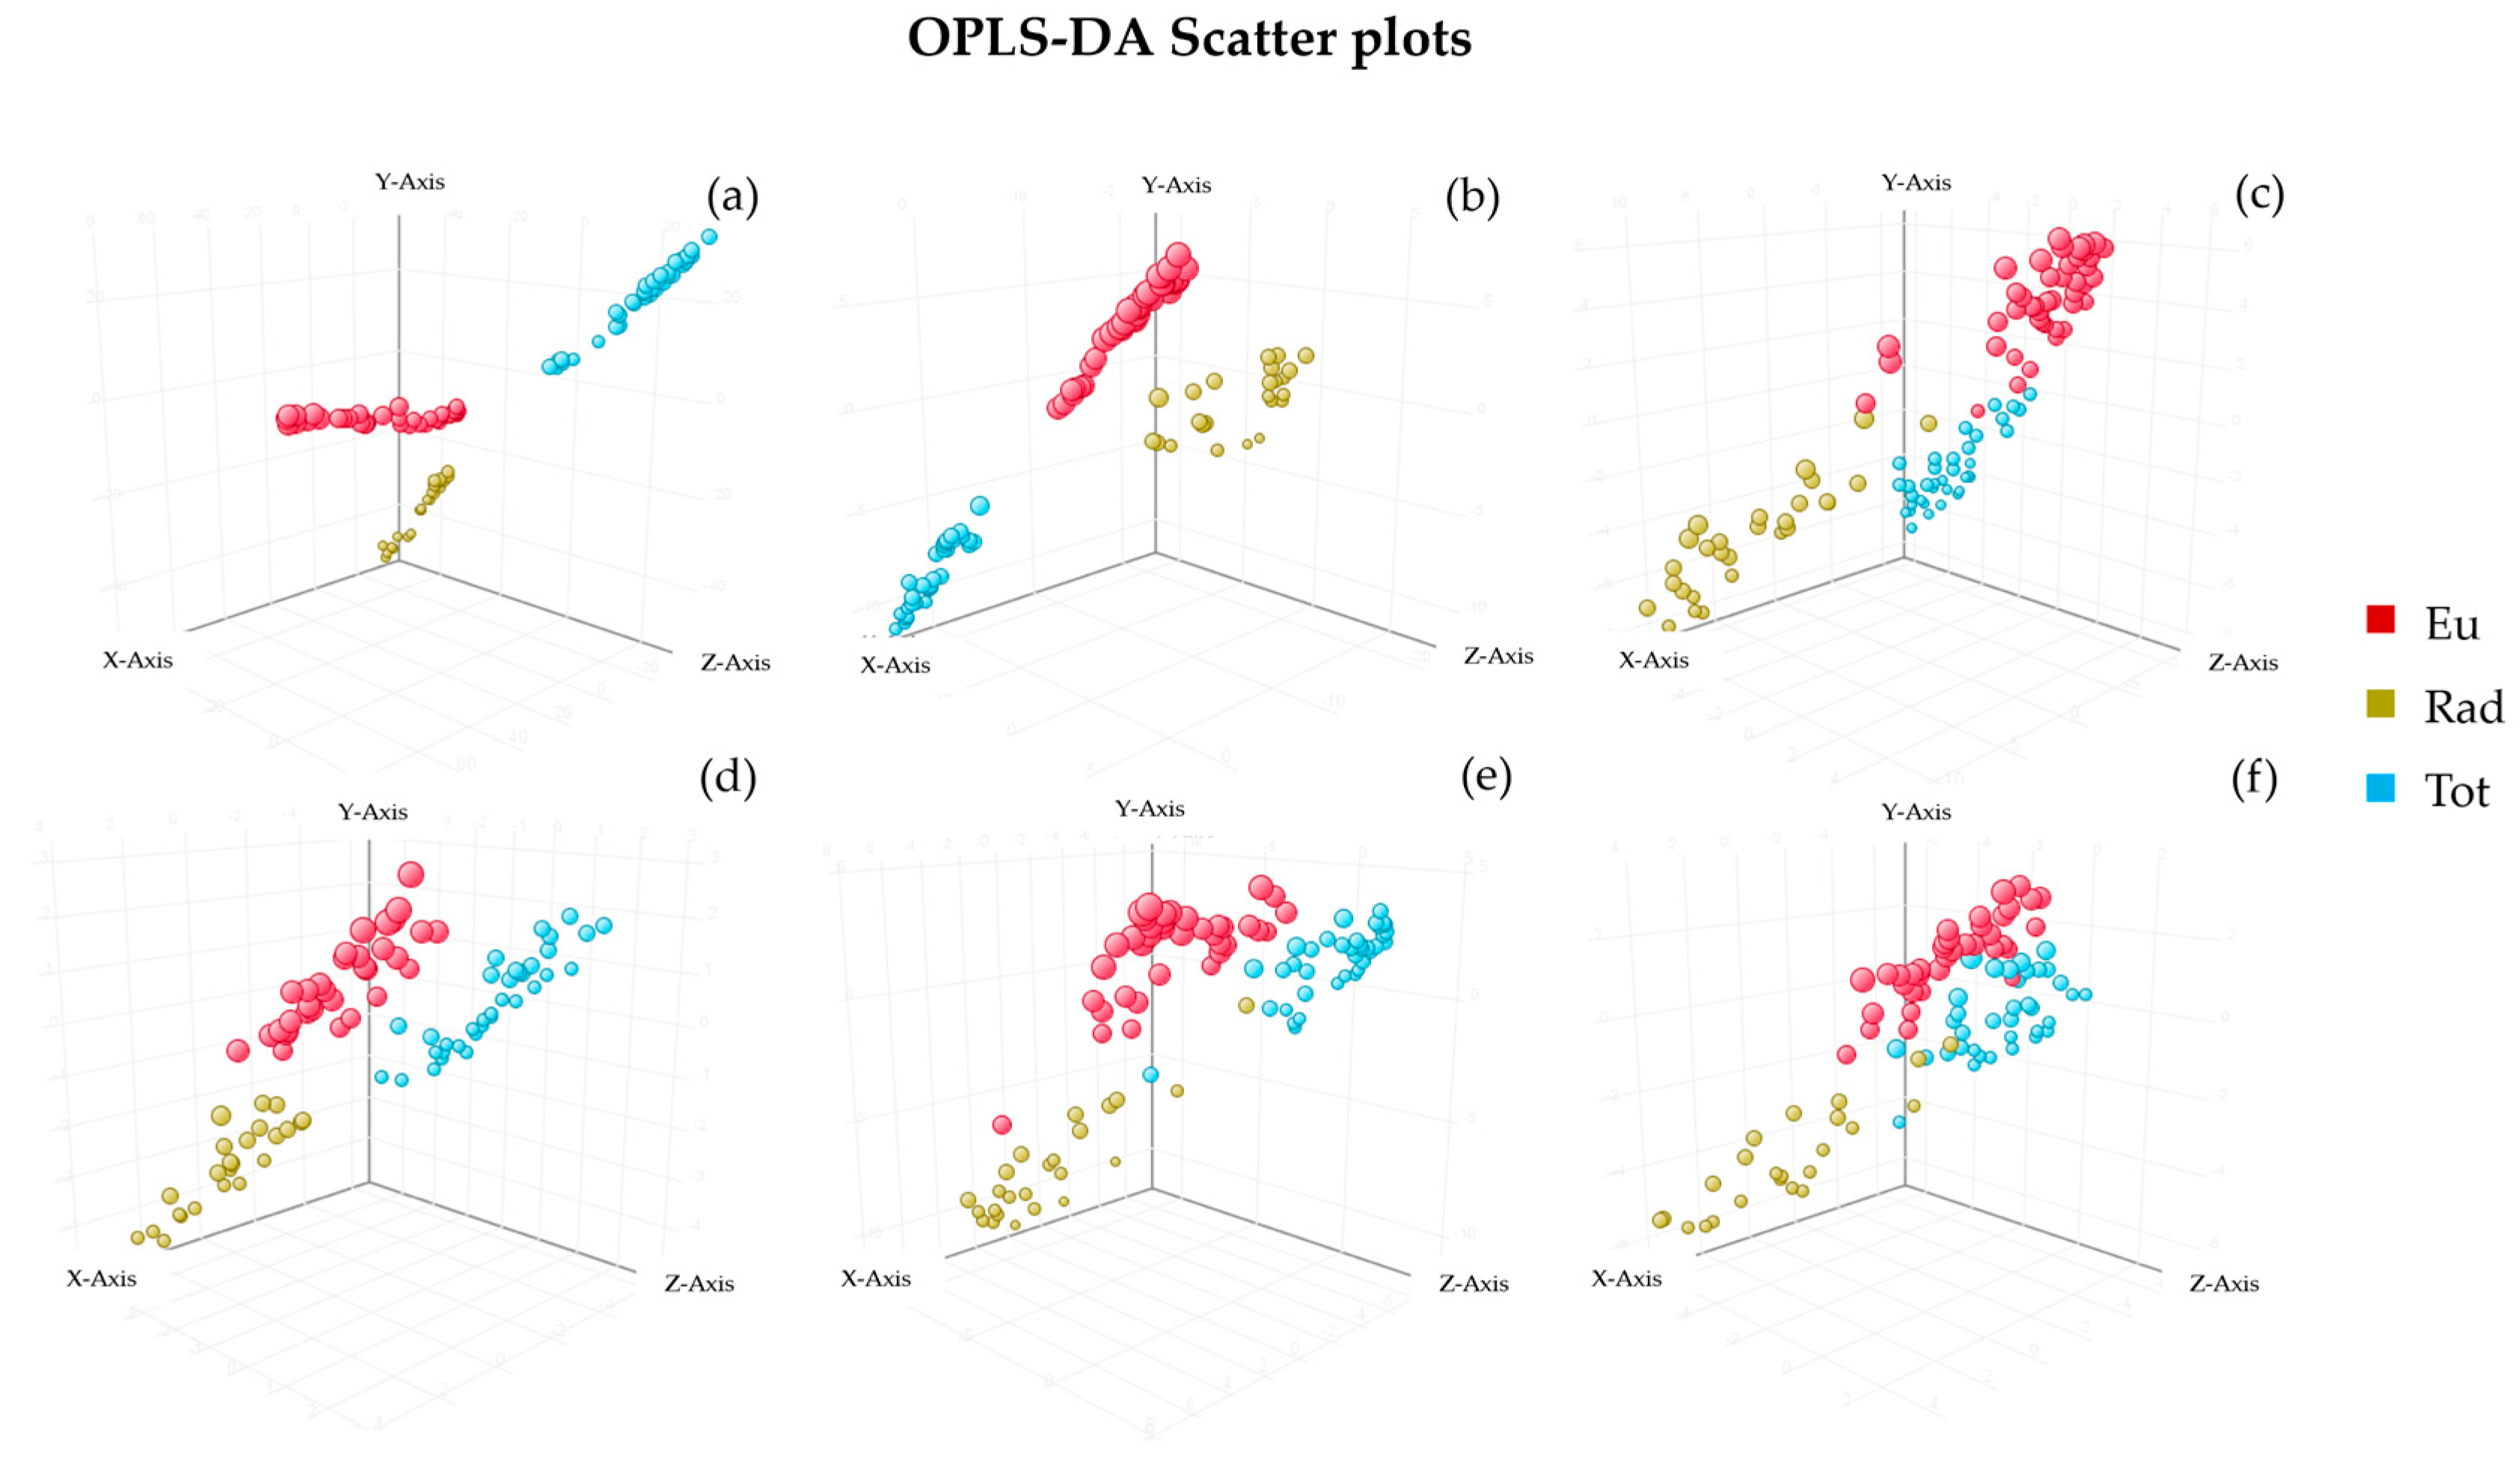
3.3.2. Orthogonal Partial Least Squared Discriminant Analysis

To develop a quality control tool for wood species differentiation, we created OPLS-DA models based on the samples from all techniques, and corresponding score plots are shown in Figure 4.
Table 1 summarises the variables of interest for the models. R2 is the explained variation calculated from sum of squares for the data used in model fitting. R2X is the proportion of variance in the predictor variables (entities) and indicates how well the model accounts for the variability in the input data. R2Y is the proportion of variance in the response variables (group membership) explained by the model. Q2 is the predictive ability estimated from the N-fold validation, which is similar to R2Y but more informative, as it predicts on data that was partially independent from the data used to fit the model. The traditional chromatographic techniques provided the best predictive models (R2X = 0.3796–0.3521, R2Y = 0.8513–0.8990, Q2 = 0.7187–0.8026, LC-MS and GC-MS, respectively). The DART-TOF-MS set, using dichloromethane (d), also yielded highly promising results (R2X = 0.3140, R2Y = 0.8372, Q2 = 0.6177) compared to the no solvent (c) and other solvents (e–f). The results obtained from the accuracy of the model, which is expressed as the percentage of correctly classified specimens, are also confirming the efficiency of these models. The OPLS-DA models validate the results obtained previously through PCA, confirming that the DART-TOF-MS technique can be used as a quick screening tool for the differentiation of wood species.

3.3.3. Markers for the Wood Species Differentiation

To investigate the predominant chemical markers used in the OPLS-DA model for wood species differentiation, the VIP scores from the wet chemistry methods were compared with the corresponding DART-TOF-MS results. This comparison aimed to confirm that common entities were responsible for the differentiation of the wood species. For polar extracts, LC-MS VIP scores were compared with no solvent, methanol and acetonitrile DART-TOF MS VIP scores; while for apolar extracts, GC-MS VIP scores were compared with dichloromethane and no solvent DART-TOF-MS VIP scores. Overall, 1938 entities provided VIP > greater than 1 from the LC-MS models, 116 entities for GC-MS models and 194 entities for DART-TOF-MS with and without solvent models. Among these, two common markers were identified for GC-MS and DART-TOF-MS with dichloromethane sets: ion 256.117 m/z (putatively annotated as palmitic acid) and 286.2296 m/z (putatively annotated as totarol/ferruginol); their corresponding VIP scores were 1.02–1.59 for palmitic acid and 1.61–1.01 for totarol/ferruginol in GC-MS and DART-TOF MS with dichloromethane analysis, respectively. In LC-MS and DART-TOF MS comparisons, ion 316.2582 m/z (unknown annotation) was also identified in both techniques and had a VIP score of 1.55–1.22, respectively.

4. Discussion

In this study, we report for the first time the extractives chemical profile characterisation of Podocarpus totara, Eucalyptus globoidea and Pinus radiata. The results obtained with the wet chemistry techniques confirmed the presence of different classes of metabolites reported previously in these wood species [29,30,31,32,33]. The chromatographic separation allowed to efficiently separate the extractive components with very similar physical and chemical properties. Furthermore, the sensitivity and precision are enhanced due to the efficiency in separation. The polar fractions comprised phenolic compounds, tannins, glucosides, phytohormones and flavonoids; while the apolar fractions included alkaloids, resin acids, fatty acids, steroids and terpenes. These chemical profiling data were used to validate a faster and less labour-intensive method for the wood differentiation using DART-TOF-MS and chemometric analysis. The presence of some characteristic compounds, such as totarol, in Podocarpus totara have been previously reported in sapwood [32], foliage [34,35] and bark [36]. Polyphenols have been reported in different species of Eucalyptus bark [37] and terpenes in essential oil extracted from leaves [38,39,40]. In Pinus radiata, the resin acids composition has been confirmed as previously reported [30].
Previous studies reported the use of DART-TOF-MS for the identification and geographic provenance of commercially traded wood. Lancaster et al. developed a tool capable of distinguishing the geographical origin of oak species, which could be applied by law enforcement to control the illegal trade of protected species [21]. Finch et al. described the geographical classification of Douglas-fir trees grown within a radius of 100 km [23]. Zhang et al. successfully differentiated two similar species of Pterocarpus but found that the drying treatment had a greater impact on the chemical fingerprinting differentiation; however, drying effects may make identifying wood species more complicated, as the drying history must be considered [18]. In previous studies, wood samples are usually dried before DART-TOF-MS analysis. In contrast, our study explored the effect of adding a small amount of solvent to the dried wood samples. We hypothesised that solvent addition would enhance the ionisation and vaporisation of specific compound classes by facilitating the diffusion of metabolites from the wood structure and improving the ionisation process in the DART source. As demonstrated by Edison et al. [13], modifying the DART source with a helium temperature gradient facilitated the separation of analytes from pesticide swab samples, proving beneficial for more complex matrices. Similarly, our study employed in situ solvent addition to achieve extractable profiles comparable to those obtained through corresponding wet chemistry chromatographic techniques. By utilising four solvents of varying polarities, we aimed to compare four different solvents for effectiveness. The use of dichloromethane with DART-TOF-MS improved the results compared to dry wood without solvent, whereby an enhanced segregation of the groups was seen (Figure 4a,b). However, the separation between sapwood and heartwood was not obtained for any of the species considered in this study, which is in agreement with previous studies reported by Price at al. [24]; this distinction in certain species is not possible due to the intrinsic composition (i.e., ubiquitous lignin precursor ions) of wood. For these reasons, the Forensic Spectra of Trees (ForeST©) library, a mass spectrum database of timber species analysed by DART-TOF-MS, does not include data obtained from sapwood.
An examination of OPLS-DA VIP scores was conducted to better understand which compounds were mainly affected by the solvent addition. Three ions (256.117, 286.2296 and 316.2582 m/z) responsible for wood classification were identified as common to both the wet chemistry and DART-TOF-MS datasets. This finding supports our hypothesis that the addition of solvent facilitated the ionisation of compounds that would otherwise have exhibited lower ionisation efficiency.
The advantage of DART-TOF-MS is the rapid analysis time and data processing timeframe compared to chromatographic techniques. We present herein an application of a sustainable mass spectrometry method that uses significantly less solvent compared to traditional wet chemistry techniques, offering a greener solution for wood species differentiation; however, the need for a laboratory equipped with a DART-TOF mass spectrometer still represents an essential requirement.
Future studies will encompass the analysis of additional indigenous and exotic species to New Zealand. The findings from these studies are expected to be shared widely through global databases, such as the CITES database, to support international conservation efforts and promote the sustainable management of biodiversity.

5. Conclusions

This scoping study presents a fingerprinting analysis of three New Zealand-grown species: the indigenous New Zealand wood species of Podocarpus totara, Eucalyptus saligna from Australia and Pinus radiata originally imported from California and cultivated in New Zealand. In this study, we evaluated the use of analytical techniques for wood species discrimination. We combined the chemical fingerprinting collected by traditional wet chemistry as well as DART-TOF-MS with chemometric techniques.
The traditional wet chemistry analysis of wood extracts provided the best characterisation of all the extractive components; however, the eco-friendlier, more sustainable and faster DART-TOF-MS technique was also able to clearly distinguish between wood species when heartwood and sapwood was combined. The heartwood and sapwood for each wood species was not clearly distinguishable with the wet chemistry techniques or the DART-TOF-MS analysis.
We can conclude that DART-TOF-MS analysis combined with chemometrics can be used as a quality control tool for the identification of wood species necessary in the commercial and timber trading markets as well as assessment for the illicit trade of counterfeit wood products.

Supplementary Materials

The following supporting information can be downloaded at https://www.mdpi.com/article/10.3390/f16020255/s1; Figure S1: DART TOF MS mass spectra without solvent of Podocarpus totara sapwood (a) and heartwood (b), Eucalyptus globoidea sapwood (c) and heartwood (d), Pinus radiata sapwood (e) and heartwood (f) samples; Figure S2: DART TOF MS mass spectra with dichloromethane of Podocarpus totara sapwood (a) and heartwood (b), Eucalyptus globoidea sapwood (c) and heartwood (d), Pinus radiata sapwood (e) and heartwood (f) samples; Figure S3: DART TOF MS mass spectra with methanol of Podocarpus totara sapwood (a) and heartwood (b), Eucalyptus globoidea sapwood (c) and heartwood (d), Pinus radiata sapwood (e) and heartwood (f) samples: Figure S4: DART TOF MS mass spectra with acetonitrile of Podocarpus totara sapwood (a) and heartwood (b), Eucalyptus globoidea sapwood (c) and heartwood (d), Pinus radiata sapwood (e) and heartwood (f) samples; Table S1: Compounds present in the Podocarpus totara samples analysed by LC-MS; Table S2: Compounds present in the Eucalyptus globoidea samples analysed by LC-MS; Table S3: Compounds present in the Pinus radiata samples analysed by LC-MS; Table S4: Compounds present in the Podocarpus totara samples analysed by GC-MS; Table S5: Compounds present in the Eucalyptus globoidea samples analysed by GC-MS; Table S6: Compounds present in the Pinus radiata samples analysed by GC-MS.

Author Contributions

Conceptualisation I.I. and T.S.; methodology I.I. and H.L.N.; software, I.I.; data curation I.I. and H.L.N.; writing—original draft preparation I.I.; writing—reviewing I.I., H.L.N. and T.S.; project administration and funding acquisition T.S. All authors have read and agreed to the published version of the manuscript.

Funding

This research was supported by funding from New Zealand Ministry of Business Innovation and Employment through the Strategic Science Investment Fund—Manufactured Products From Trees science platform contract number C04X1703.

Data Availability Statement

The original contributions presented in the study are included in the article and Supplementary Materials. Further inquiries can be directed to the corresponding author.

Acknowledgments

The authors would like to thank Miruna Petcu, Beatrix Theobald and Anna de Lena for providing precious support during the sample analysis; Joane Elleouet for statistical insights and suggestions; and Christel Brunschwig and Miruna Petcu for invaluable support and mentoring for processing data.

Conflicts of Interest

Authors I.I. and T.S. and are currently employed by the New Zealand Forest Research Institute trading as Scion. T.S. is also currently employed part-time by the National Centre for Timber Durability and Design Life at the University of the Sunshine Coast, Australia. The University of Sunshine Coast was not involved in this study, and there is no relevance between this research and the University of Sunshine Coast. T.S. declares no financial or other conflicts of interest. H.L.N. was employed by the New Zealand Forest Research Institute trading as Scion at the time of this work; H.L.N. is currently employed by ChemCentre, which was not involved in the study, and there is no relevance between this research and ChemCentre. The authors declare that the research was conducted in the absence of any financial or commercial relationships that could be construed as a potential conflict of interest.

References

  1. Scion. Diversifying Commercial Forestry. Available online: https://www.scionresearch.com/science/growing-the-value-of-forests/diversifying-commercial-forestry (accessed on 18 December 2024).
  2. Pilot, T.I. Tōtara Industry Pilot Project 2020. Available online: https://www.totaraindustry.co.nz/ (accessed on 18 December 2024).
  3. Dormontt, E.E.; Boner, M.; Braun, B.; Breulmann, G.; Degen, B.; Espinoza, E.; Gardner, S.; Guillery, P.; Hermanson, J.C.; Koch, G.; et al. Forensic timber identification: It’s time to integrate disciplines to combat illegal logging. Biol. Conserv. 2015, 191, 790–798. [Google Scholar] [CrossRef]
  4. Rosa da Silva, N.; Deklerck, V.; Baetens, J.M.; Van den Bulcke, J.; De Ridder, M.; Rousseau, M.; Bruno, O.M.; Beeckman, H.; Van Acker, J.; De Baets, B.; et al. Improved wood species identification based on multi-view imagery of the three anatomical planes. Plant Methods 2022, 18, 79. [Google Scholar] [CrossRef] [PubMed]
  5. Hassold, S.; Lowry, P.P., 2nd; Bauert, M.R.; Razafintsalama, A.; Ramamonjisoa, L.; Widmer, A. DNA Barcoding of Malagasy Rosewoods: Towards a Molecular Identification of CITES-Listed Dalbergia Species. PLoS ONE 2016, 11, e0157881. [Google Scholar] [CrossRef] [PubMed]
  6. Ratnasingham, S.; Hebert, P.D. bold: The Barcode of Life Data System (http://www.barcodinglife.org). Mol. Ecol. Notes 2007, 7, 355–364. [Google Scholar] [CrossRef]
  7. Pastore, T.C.M.; Braga, J.W.B.; Coradin, V.T.R.; Magalhães, W.L.E.; Okino, E.Y.A.; Camargos, J.A.A.; de Muñiz, G.I.B.; Bressan, O.A.; Davrieux, F. Near infrared spectroscopy (NIRS) as a potential tool for monitoring trade of similar woods: Discrimination of true mahogany, cedar, andiroba, and curupixá. Holzforschung 2011, 65, 73–80. [Google Scholar] [CrossRef]
  8. Seyfullah, L.J.; Sadowski, E.M.; Schmidt, A.R. Species-level determination of closely related araucarian resins using FTIR spectroscopy and its implications for the provenance of New Zealand amber. PeerJ 2015, 3, e1067. [Google Scholar] [CrossRef]
  9. Jesus, E.; Franca, T.; Calvani, C.; Lacerda, M.; Goncalves, D.; Oliveira, S.L.; Marangoni, B.; Cena, C. Making wood inspection easier: FTIR spectroscopy and machine learning for Brazilian native commercial wood species identification. RSC Adv. 2024, 14, 7283–7289. [Google Scholar] [CrossRef] [PubMed]
  10. Cody, R.B.; Laramée, J.A.; Durst, H.D. Versatile new ion source for the analysis of materials in open air under ambient conditions. Anal. Chem. 2005, 77, 2297–2302. [Google Scholar] [CrossRef]
  11. Shen, Y.; Wu, W.Y.; Guo, D.A. DART-MS: A new research tool for herbal medicine analysis. World J. Tradit. Chin. Med. 2016, 2, 2–9. [Google Scholar] [CrossRef]
  12. Deklerck, V.; Mortier, T.; Goeders, N.; Cody, R.B.; Waegeman, W.; Espinoza, E.; Van Acker, J.; Van den Bulcke, J.; Beeckman, H. A protocol for automated timber species identification using metabolome profiling. Wood Sci. Technol. 2019, 53, 953–965. [Google Scholar] [CrossRef]
  13. Edison, S.E.; Lin, L.A.; Gamble, B.M.; Wong, J.; Zhang, K. Surface swabbing technique for the rapid screening for pesticides using ambient pressure desorption ionization with high-resolution mass spectrometry. Rapid Commun. Mass Spectrom. 2011, 25, 127–139. [Google Scholar] [CrossRef] [PubMed]
  14. Deklerck, V.; Finch, K.; Gasson, P.; Van den Bulcke, J.; Van Acker, J.; Beeckman, H.; Espinoza, E. Comparison of species classification models of mass spectrometry data: Kernel Discriminant Analysis vs Random Forest; A case study of Afrormosia (Pericopsis elata (Harms) Meeuwen). Rapid Commun. Mass Spectrom. 2017, 31, 1582–1588. [Google Scholar] [CrossRef] [PubMed]
  15. Espinoza, E.O.; Lancaster, C.A.; Kreitals, N.M.; Hata, M.; Cody, R.B.; Blanchette, R.A. Distinguishing wild from cultivated agarwood (Aquilaria spp.) using direct analysis in real time and time of-flight mass spectrometry. Rapid Commun. Mass Spectrom. 2014, 28, 281–289. [Google Scholar] [CrossRef] [PubMed]
  16. Williamson, R.; Djidrovska, D.; Ledic, A.; Brzica, S.; Antikj, V.; Hofer, R.; Almirall, J. Characterization and identification of luminescent components in inks using various analytical techniques for the study of crossed-line intersections. Forensic Chem. 2017, 3, 28–35. [Google Scholar] [CrossRef]
  17. Liang, J.; Sun, J.; Chen, P.; Frazier, J.; Benefield, V.; Zhang, M. Chemical analysis and classification of black pepper (Piper nigrum L.) based on their country of origin using mass spectrometric methods and chemometrics. Food Res. Int. 2021, 140, 109877. [Google Scholar] [CrossRef] [PubMed]
  18. Zhang, M.; Zhao, G.; Guo, J.; Wiedenhoeft, A.C.; Liu, C.C.; Yin, Y. Timber species identification from chemical fingerprints using direct analysis in real time (DART) coupled to Fourier transform ion cyclotron resonance mass spectrometry (FTICR-MS): Comparison of wood samples subjected to different treatments. Holzforschung 2019, 73, 975–985. [Google Scholar] [CrossRef]
  19. Kim, H.J.; Seo, Y.T.; Park, S.-i.; Jeong, S.H.; Kim, M.K.; Jang, Y.P. DART–TOF–MS based metabolomics study for the discrimination analysis of geographical origin of Angelica gigas roots collected from Korea and China. Metabolomics 2014, 11, 64–70. [Google Scholar] [CrossRef]
  20. Cody, R.B.; Dane, A.J.; Dawson-Andoh, B.; Adedipe, E.O.; Nkansah, K. Rapid classification of White Oak (Quercus alba) and Northern Red Oak (Quercus rubra) by using pyrolysis direct analysis in real time (DART™) and time-of-flight mass spectrometry. J. Anal. Appl. Pyrolysis 2012, 95, 134–137. [Google Scholar] [CrossRef]
  21. Lancaster, C.; Espinoza, E. Analysis of select Dalbergia and trade timber using direct analysis in real time and time-of-flight mass spectrometry for CITES enforcement. Rapid Commun. Mass Spectrom. 2012, 26, 1147–1156. [Google Scholar] [CrossRef]
  22. Evans, P.D.; Mundo, I.A.; Wiemann, M.C.; Chavarria, G.D.; McClure, P.J.; Voin, D.; Espinoza, E.O. Identification of selected CITES-protected Araucariaceae using DART TOFMS. IAWA J. 2017, 38, 266–281. [Google Scholar] [CrossRef]
  23. Finch, K.; Espinoza, E.; Jones, F.A.; Cronn, R. Source identification of western Oregon Douglas-fir wood cores using mass spectrometry and random forest classification. Appl. Plant Sci. 2017, 5, 1600158. [Google Scholar] [CrossRef]
  24. Price, E.R.; McClure, P.J.; Huffman, A.N.; Voin, D.; Espinoza, E.O. Reliability of wood identification using DART-TOFMS and the ForeST© database: A validation study. Forensic Sci. Int. Anim. Environ. 2022, 2, 100045. [Google Scholar] [CrossRef]
  25. Rodríguez-Rodríguez, P.; Bautista-Ortín, A.B.; Gómez-Plaza, E. Increasing wine quality through the use of oak barrels: Factors that will influence aged wine color and aroma. In Wine: Types, Production and Health; Nova Science Publishers, Inc.: Hauppauge, NY, USA, 2012; pp. 301–317. [Google Scholar]
  26. Blazenovic, I.; Kind, T.; Ji, J.; Fiehn, O. Software Tools and Approaches for Compound Identification of LC-MS/MS Data in Metabolomics. Metabolites 2018, 8, 31. [Google Scholar] [CrossRef] [PubMed]
  27. Worley, B.; Powers, R. PCA as a practical indicator of OPLS-DA model reliability. Curr. Metabolomics 2016, 4, 97–103. [Google Scholar] [CrossRef] [PubMed]
  28. Lopes, E.D.; Gonçalves, J.F.; Marques, A.; Martins, N.d.S.; Pena, C.; Laia, M.L.d. Physical and chemical properties of wood from Eucalyptus and Corymbia clones in different planting densities. Ciênc. Florest. 2023, 33, e64965. [Google Scholar] [CrossRef]
  29. Vieira, T.A.S.; Arriel, T.G.; Zanuncio, A.J.V.; Carvalho, A.G.; Branco-Vieira, M.; Carabineiro, S.A.C.; Trugilho, P.F. Determination of the Chemical Composition of Eucalyptus spp. for Cellulosic Pulp Production. Forests 2021, 12, 1649. [Google Scholar] [CrossRef]
  30. Lloyd, J.A. Distribution of extractives in pinus radiata earlywood and latewood. N. Z. J. For. Sci. 1978, 8, 288–294. [Google Scholar]
  31. Hemingway, R.W.; Hillis, W.E. Changes in fats and resins of Pinus radiata associated with heartwood formation. Appita 1971, 4, 439–443. [Google Scholar]
  32. Gao, Y.; Xu, X.; Chang, S.; Wang, Y.; Xu, Y.; Ran, S.; Huang, Z.; Li, P.; Li, J.; Zhang, L.; et al. Totarol prevents neuronal injury in vitro and ameliorates brain ischemic stroke: Potential roles of Akt activation and HO-1 induction. Toxicol. Appl. Pharmacol. 2015, 289, 142–154. [Google Scholar] [CrossRef] [PubMed]
  33. Bendall, J.G.; Cambie, R.C. Totarol a Non-Conventional Diterpenoid. Aust. J. Chem. 1995, 48, 883–917. [Google Scholar] [CrossRef]
  34. Webby, R.F.; Markham, K.R.; Molloy, B.P.J. The characterisation of New Zealand Podocarpus hybrids using flavonoid markers. N. Z. J. Bot. 1987, 25, 355–366. [Google Scholar] [CrossRef]
  35. Clarke, D.B.; Hinkley, S.F.R.; Weavers, R.T. Waihoensene. A new laurenene-related diterpene from Podocarpus totara var waihoensis. Tetrahedron Lett. 1997, 38, 4297–4300. [Google Scholar] [CrossRef]
  36. Lee, S.-E.; Park, E.-K.; Kim, J.-G. A mosquito larvicidal diterpenoid isolated from Podocarpus totara D. Don ex Lambert. J. Entomol. Sci. 2000, 35, 474–477. [Google Scholar] [CrossRef]
  37. Lima, L.; Miranda, I.; Knapic, S.; Quilhó, T.; Pereira, H. Chemical and anatomical characterization, and antioxidant properties of barks from 11 Eucalyptus species. Eur. J. Wood Prod. 2017, 76, 783–792. [Google Scholar] [CrossRef]
  38. Müller Da Silva, P.H.; Brito, J.O.; Da Silva, F.G., Jr. Potential of eleven Eucalyptus species for the production of essential oils. Sci. Agric. 2006, 63, 85–89. [Google Scholar] [CrossRef]
  39. Soliman, F.M.; Fathy, M.M.; Salama, M.M.; Saber, F.R. Chemical composition and bioactivity of the volatile oil from leaves and stems of Eucalyptus cinerea. Pharm. Biol. 2014, 52, 1272–1277. [Google Scholar] [CrossRef]
  40. Marwa, K.; Ismail, A.; Souihi, M.; Yassine, M.; Dhaouadi, F.; Mohsen, H.; Lamia, H. Chemical composition and herbicidal potential of essential oil of Eucalyptus maculata Hook. Sci. Afr. 2023, 21, e01751. [Google Scholar] [CrossRef]
Figure 1. PCA scatter plot and 3D plot for Eucalyptus globoidea (Eu), Podocarpus totara (Tot) and Pinus radiata (Rad), heartwood (HW) and sapwood (SW) analysed by LC-MS (a,c) and GC-MS (b,d).
Forests 16 00255 g001
Figure 2. PCA scatter plot for Eucalyptus globoidea (Eu), Podocarpus totara (Tot) and Pinus radiata (Rad), analysed by DART-TOF-MS (a) without solvent, or with solvents (b) dichloromethane, (c) methanol and (d) acetonitrile.
Forests 16 00255 g002
Figure 3. PCA scatter plot for Eucalyptus globoidea (Eu), Podocarpus totara (Tot) and Pinus radiata (Rad), heartwood (HW) and sapwood (SW) analysed by DART-TOF-MS (a) without solvent, or with solvents (b) dichloromethane, (c) methanol and (d) acetonitrile.
Forests 16 00255 g003
Figure 4. OPLS-DA 3D plot for Eucalyptus globoidea (Eu), Podocarpus totara (Tot) and Pinus radiata (Rad), analysed by LC-MS (a), GC-MS (b), DART-TOF-MS no solvent (c), dichloromethane (d), methanol (e), and acetonitrile (f).
Forests 16 00255 g004
Table 1. Classification capacity of wood species with OPLS-DA models from all techniques.
ModelsR2XR2YQ2Accuracy %Components
LCMS0.37960.85130.71671002
GCMS0.35210.89900.80261002
DART Acetonitrile0.30460.69710.505791.752
DART Methanol0.25620.84520.638895.9182
DART Dichloromethane0.31400.83720.61771002
DART without Solvent0.25290.80230.642395.372
Disclaimer/Publisher’s Note: The statements, opinions and data contained in all publications are solely those of the individual author(s) and contributor(s) and not of MDPI and/or the editor(s). MDPI and/or the editor(s) disclaim responsibility for any injury to people or property resulting from any ideas, methods, instructions or products referred to in the content.

