Article

Potential Distribution and Response of Camphora longepaniculata Gamble (Lauraceae) to Climate Change in China

1
School of Medicine, Northwest University, Xi’an 710069, China
2
College of Life Sciences, Northwest University, Xi’an 710069, China
*
Authors to whom correspondence should be addressed.
These authors contributed equally to this work.
Forests 2025, 16(2), 338; https://doi.org/10.3390/f16020338
Submission received: 27 December 2024 / Revised: 24 January 2025 / Accepted: 12 February 2025 / Published: 14 February 2025
(This article belongs to the Topic Responses of Trees and Forests to Climate Change)

Abstract

:
Camphora longepaniculata is an endangered evergreen tree listed as National Class II Protected Tree Species in China, highly valued for its medicinal and economic importance. Currently, research on this species has primarily focused on its pharmaceutical properties, while its potential distribution and responses to climate change remain insufficiently explored. In this study, 36 valid occurrence records and 11 environmental variables were utilized to predict its potential distribution and assess its response to future climate scenarios. The MaxEnt model revealed that the current distribution of C. longepaniculata largely aligns with its predicted suitable habitats, with the primary range located in Sichuan Province. Furthermore, this model identified the highly suitable habitats to be predominantly concentrated in Sichuan and Shaanxi Provinces under climate change. Among the environmental variables, annual precipitation (bio12), minimum temperature of the coldest month (bio6), and elevation (dem) were the most influential, collectively contributing over 70% to the model’s predictive accuracy. Future climate projections compared to the current distribution suggest a northward expansion of suitable habitats for C. longepaniculata, although Sichuan Province is predicted to remain the core habitat under future scenarios. Kernel density analysis of occurrence points indicated that the largest concentration of distribution points is near the Sichuan Basin, reinforcing the importance of this region as a stronghold for the species. Based on the results of potential distribution and kernel density analysis, in situ conservation, artificial cultivation, and the establishment of wild protected areas and local germplasm banks are recommended for stable, suitable habitats, such as Sichuan Province and parts of Yunnan and Guizhou Provinces. This study not only sheds light on the potential geographical distribution of C. longepaniculata and its response to climate change but also provides a scientific basis for the development of targeted conservation strategies for this species.

1. Introduction

Endangered and rare species are defined as those whose populations are significantly reduced or whose distribution is severely restricted, placing them at a high risk of extinction in the near future. These species are often characterized by a narrow geographical range, limited to one or a few specialized habitats, and are vulnerable to over-exploitation, habitat loss, and the effects of climate change and human activities [1]. Despite their vulnerability, rare and endangered species, particularly plants, play crucial roles in ecosystems, contribute to health care and scientific research, and hold both economic and cultural value [2,3,4]. Therefore, understanding the distribution and dynamics of their suitable habitats is essential for their conservation and long-term survival. One such species is Camphora longepaniculata, an evergreen tree species belonging to the family Laurance, which is indigenous to China and exhibits a broad distribution across Sichuan Province. Owing to its substantial economic and pharmaceutical value [5], the wild population of C. longepaniculata has suffered a notable decline, prompting its inclusion as a second-class protected plant in China.
The suitable habitats of species are shaped by both biological and environmental factors [6]. Among these, climate change—particularly the alterations in temperature and precipitation—is the primary driver that influences plant distribution patterns [7,8]. The Sixth Assessment Report of the Intergovernmental Panel on Climate Change (IPCC AR6) reported that the global average surface temperature increased by approximately 1.09 °C from 2011 to 2020 compared to the period from 1850 to 1900 [9]. Numerous studies have reported that climate change not only restricts the growth of plants but also profoundly impacts their geographical distribution [10]. These impacts may lead to changes to suitable habitats, including habitat fragmentation and global biodiversity loss [11,12,13]. In response to these changes, plants adopt various adaptive strategies, such as migrating to higher altitudes or latitudes. For instance, Pterocarpus santalinus Blanco has been predicted to shift its distribution center northeastward [13], and Leonurus japonicus Houtt, a traditional Chinese medicinal plant, is expected to migrate to higher latitudes [14]. In addition to changes in geographic distribution, climate change is modifying sensitive ecological responses, encompassing flowering periods and the duration of growing seasons [15,16,17].
These complex and dynamic changes in species distribution caused by climate change highlight the urgent need for predictive tools to better understand and anticipate these shifts. Species distribution models (SDMs) have become an essential tool for studying the distribution patterns of species by integrating known occurrence records with environmental variables to stimulate their geographic distributions and assess their responses to climate change [12,18]. Various SDMs have been developed, including a bioclimatic analysis system (BIOCLIM), genetic algorithm for rule-set production (GRAP), and maximum entropy model (MaxEnt) [14], with MaxEnt consistently demonstrating superior performance in simulating species geographical distribution [19]. Notably, MaxEnt excels in accuracy even with limited sample sizes [20,21] and produces response curves that highlight relationships between the probability of presence of species and environmental variables [22]. These response curves enhance our understanding of how specific environmental conditions influence species’ survival, offering valuable insights into the ecological factors that determine habitat suitability. SDMs have been applied across multiple fields. For example, predicting the potential distribution of invasive species provides a scientific basis for their prevention, as demonstrated by studies on Solidago canadensis L. [23] and Lonicera japonica Thunb [24]. In the context of the protection of endangered species, research has been focused on understanding how these species would respond to climate change and mapping their migratory routes across various periods, which can inform the development of targeted conservation strategies. By predicting the future distribution of endangered species, SDMs can help identify potential suitable habitats and guide conservation planning. Notable examples include studies on endangered species such as Pyrus calleryana Decne [25] and Grus japonensis Müller [26].
Despite its ecological and economic importance, C. longepaniculata has been predominantly studied for its pharmacological properties, including essential oil extraction from its various organs, which exhibit antibacterial and anti-inflammatory effects [27,28,29]. Recent research has identified key genes involved in monoterpene biosynthesis and explored differential gene expression induced by endophytic fungi, advancing our understanding of its biochemical pathways [30,31]. However, little attention has been paid to the environmental variables that shape its distribution, the potential shifts in its suitable habitats under future climate scenarios, and its responses to climatic changes. Given the proven utility of SDMs in understanding and predicting species distributions, their application to C. longepaniculata could provide valuable insights into the environmental factors shaping its habitat and the potential impacts of climate change on its distribution.
This study utilizes species distribution models (SDMs) and kernel density analysis as key tools to explore the distribution patterns and habitat dynamics of C. longepaniculata. It aims to address three primary objectives: (1) identifying the critical environmental variables that determine habitat suitability, (2) assessing shifts in suitable habitats under future climate scenarios, and (3) proposing targeted conservation strategies based on predictive modeling and kernel analysis. By integrating ecological modeling with conservation planning, this study lays a robust foundation for the effective conservation of C. longepaniculata and provides insights for safeguarding similar species in the context of climate change.

2. Materials and Methods

2.1. Collection of Occurrence Data

Camphora longepaniculata is an evergreen tree species primarily distributed in Sichuan Province, China. To comprehensively capture its known distribution, occurrence data were sourced from the Global Biodiversity Information Facility (GBIF; https://www.gbif.org/, accessed on 15 September 2024), the Chinese Virtual Herbarium (CVH; http://www.cvh.ac.cn, accessed on 15 September 2024), the National Specimen Information Infrastructure (NSII; http://www.nsii.org.cn/2017/home-en.php, accessed on 15 September 2024). To minimize data redundancy and reduce sampling bias, distribution points were processed using ENMTools [32], which filters occurrence records by retaining only one point per grid cell (5 km × 5 km). This helps reduce the potential for sample redundancy, as occurrence points that fall within the same grid cell can lead to overrepresentation of certain areas. Ultimately, 36 valid occurrence records (Supplementary Table S1 and Figure 1) were selected for the subsequent analysis. R package spatstat was employed to conduct kernel density analysis [33].

2.2. Environmental Variables for Analysis

A total of 30 environmental variables (Supplementary Table S2), encompassing climate variables, topographic data (dem, slope, and aspect), and soil factors, respectively, were obtained from the WorldClim database (http://worldclim.org/, accessed on 16 September 2023) and the Harmonized World Soil Database (HWSD) (https://www.fao.org/faostat/en/#home, accessed on 2 December 2024) with a spatial resolution of 30 arcseconds (~1 km), among which slope and aspect variables were extracted in ArcGIS v10.8. Future climate data were derived from the BCC-CSM2-MR (Beijing Climate Center Climate System Model) model with a spatial resolution of 30 arcseconds (~1 km), which is considered to be suitable for assessing climate change impacts in China [34]. Two future shared socioeconomic pathways, SSP1-2.6 (low greenhouse gases emissions: CO2 emission cut to net zero around 2075) and SSP5-8.5 (very high greenhouse gases emissions: CO2 emissions triple by 2075), of three periods (2040–2060, 2060–2080, 2080–2100) were downloaded for future modeling. Contemporary variables represented the period from the 1970s to the 2020s. Moreover, the topographic factors and soil variables were utilized for future modeling in consideration that they were not expected to change in future decades [35]. First, the Shapiro–Wilk test was used to assess the normality of each variable (Supplementary Table S3). Pearson correlation was applied to normally distributed variables to avoid multicollinearity, while Spearman’s rank correlation was used for non-normally distributed variables. The variable contributions from MaxEnt (Supplementary Figure S1) were integrated with the correlation results obtained using IBM SPSS Statistics V26.0. When the correlation coefficient between any two variables exceeded |0.8|, we retained the variable with the higher contribution for the analysis. This helps improve the interpretability of the model and strengthens its predictive capacity while also reducing the risk of overfitting. Ultimately, 11 environmental variables were selected for further modeling. The correlation results of environmental factors were visualized by TBtools [36] (Supplementary Figure S2).

2.3. Model Establishment and Performance Evaluation

MaxEnt v3.4.1 was employed to model a potential suitable area for C. longepaniculata. In the modeling setup, 25% of the distribution data were designated as test data to evaluate the model’s performance; the model was configured to write data logs to facilitate further analysis of the factor response curves, which was executed with 10 repetitions, and the replicated run type was bootstrap, while all other settings were maintained at their default values. A Jackknife test [37] was conducted to assess the contribution and importance of each environmental variable. Response curves were created for corresponding suitable range analysis for variables and visualized by R package ggplot2 [38]. The area under the receiver operating characteristic curve (AUC) was employed to evaluate the accuracy of this model. This model was deemed excellent when the AUC value exceeded 0.8.

2.4. Analysis of Potential Suitable Area

The result files in ASCII format, generated by MaxEnt, were imported into ArcGIS version 10.8 for further processing. These files were reclassified into four distinct categories based on plant presence probability values: unsuitable regions (p < 0.3), lowly suitable regions (0.3 < p < 0.5), moderately suitable regions (0.5 < p < 0.7), and highly suitable regions (p > 0.7) by natural breaks method [39]. This classification allowed for a nuanced assessment of habitat suitability across different probability ranges. Subsequently, the spatial distribution of suitable habitats was visualized using ArcGIS version 10.8, providing a clear representation of habitat suitability. In addition, the areas corresponding to each suitability category were calculated for different time periods.

2.5. Analysis of Distribution Change in Suitable Area

To investigate the dynamics of suitable habitats, two complementary analytical approaches were employed. First, ASCII format files generated by MaxEnt were reclassified into binary files using a threshold of 0.3. In this process, habitat suitability probabilities were categorized into two classes: probabilities less than 0.3 (p < 0.3) were reclassified as 0, representing unsuitable habitats, while probabilities equal to or greater than 0.3 (p ≥ 0.3) were reclassified as 1, indicating suitable habitats, aligning the threshold for reclassification of suitable habitats: unsuitable habitats and lowly suitable habitats. These binary files of potential future habitats were subsequently compared with the current distribution data to identify regions of habitat expansion, contraction, and stability over time.
In addition, centroid shift analysis was performed to further assess the spatial shifts in suitable habitat distributions between different scenarios. This analysis was conducted using the SDMtoolbox [40] in ArcGIS 10.8, enabling a detailed examination of the directional movements and magnitudes of habitat shifts. Furthermore, potential migratory routes connecting current and future suitable habitats were mapped using ArcGIS 10.8. To quantify these shifts, we calculated the migratory distances under two climate scenarios (SSP1-2.6 and SSP5-8.5) across multiple timeframes. Specifically, we measured the distances between current distributions and future projections (current to 2050 SSP1-2.6, 2050 SSP1-2.6 to 2070 SSP1-2.6, and 2070 SSP1-2.6 to 2090 SSP1-2.6) and similarly for the SSP5-8.5 scenario (current to 2050 SSP5-8.5, 2050 SSP5-8.5 to 2070 SSP5-8.5, and 2070 SSP5-8.5 to 2090 SSP5-8.5).

3. Results

3.1. Accuracy Evaluation of the MaxEnt Model

A total of 36 validated distribution points and 11 environmental variables were utilized to simulate and predict the potential distribution of C. longepaniculata across various time periods and climate scenarios. The model’s performance was evaluated using the Receiver Operating Characteristic (ROC) curve, which demonstrated a high level of accuracy with an average Area Under the Curve (AUC) value of 0.966 and a standard deviation of 0.006. This value significantly exceeded the threshold of 0.8, indicating the reliability of the MaxEnt model (Figure 2). Overall, the MaxEnt model demonstrates robustness and reliability, making it well-suited for predicting the potential distribution of C. longepaniculata under varying climatic conditions.

3.2. Key Environmental Variables for Potential Distribution

Eleven environmental variables (Table 1) were selected for MaxEnt modeling by integrating their initial percent contributions with correlation analysis performed in SPSS Statistics V26.0. The jackknife test of regularized training gain was conducted to assess the relative importance of environmental variables in determining the potential distribution of C. longepaniculata. The results (Figure 3) demonstrate that climatic variables were the primary drivers of the species distribution. Among the 11 variables analyzed, bio7 (temperature annual range), bio6 (minimum temperature of the coldest month), and bio12 (annual precipitation) showed the highest individual contributions, as indicated by their longest blue bars in the “with only variable” scenario. Temperature and precipitation were undeniably the most dominant variables in shaping the distribution of C. longepaniculata. Their combined effects on water balance, seasonal patterns, and species adaptations were particularly influential. Specifically, variations in temperature annual range (bio7) and annual precipitation (bio12) interacted to determine the optimal habitats for C. longepaniculata, influencing factors such as growing seasons, dormancy periods, and physiological adaptations to moisture availability.
In contrast, variables such as aspect, ph_water, and silt had relatively shorter blue bars, suggesting limited predictive power when used independently. However, their contributions increased in the “without variable” scenario (cyan bars), indicating that they provided complementary information when combined with other variables. The red bar, representing the model’s overall gain when all variables were included, was significantly higher than any single-variable scenario, underscoring the importance of integrating multiple variables to achieve robust predictions.

3.3. Evaluation of Environmental Variables and Analysis of Response Curve

The relationships between the distribution probability of suitable C. longepaniculata habitats and environmental variables were analyzed by logistic regression in the MaxEnt model. The single-factor response curves for the three dominant variables—annual precipitation (bio12), minimum temperature of the coldest month (bio6), and elevation (dem)—were generated using the R package ggplot2 (Figure 4). The response curves for individual variables indicated that the probability of the presence of C. longepaniculata exceeded 0.3 when annual precipitation (bio12) ranged from 690 mm to 1487 mm; the minimum temperature of the coldest month was from −9.9 °C to 10.7 °C, and the elevation was from 273 m to 4116 m (Figure 4).

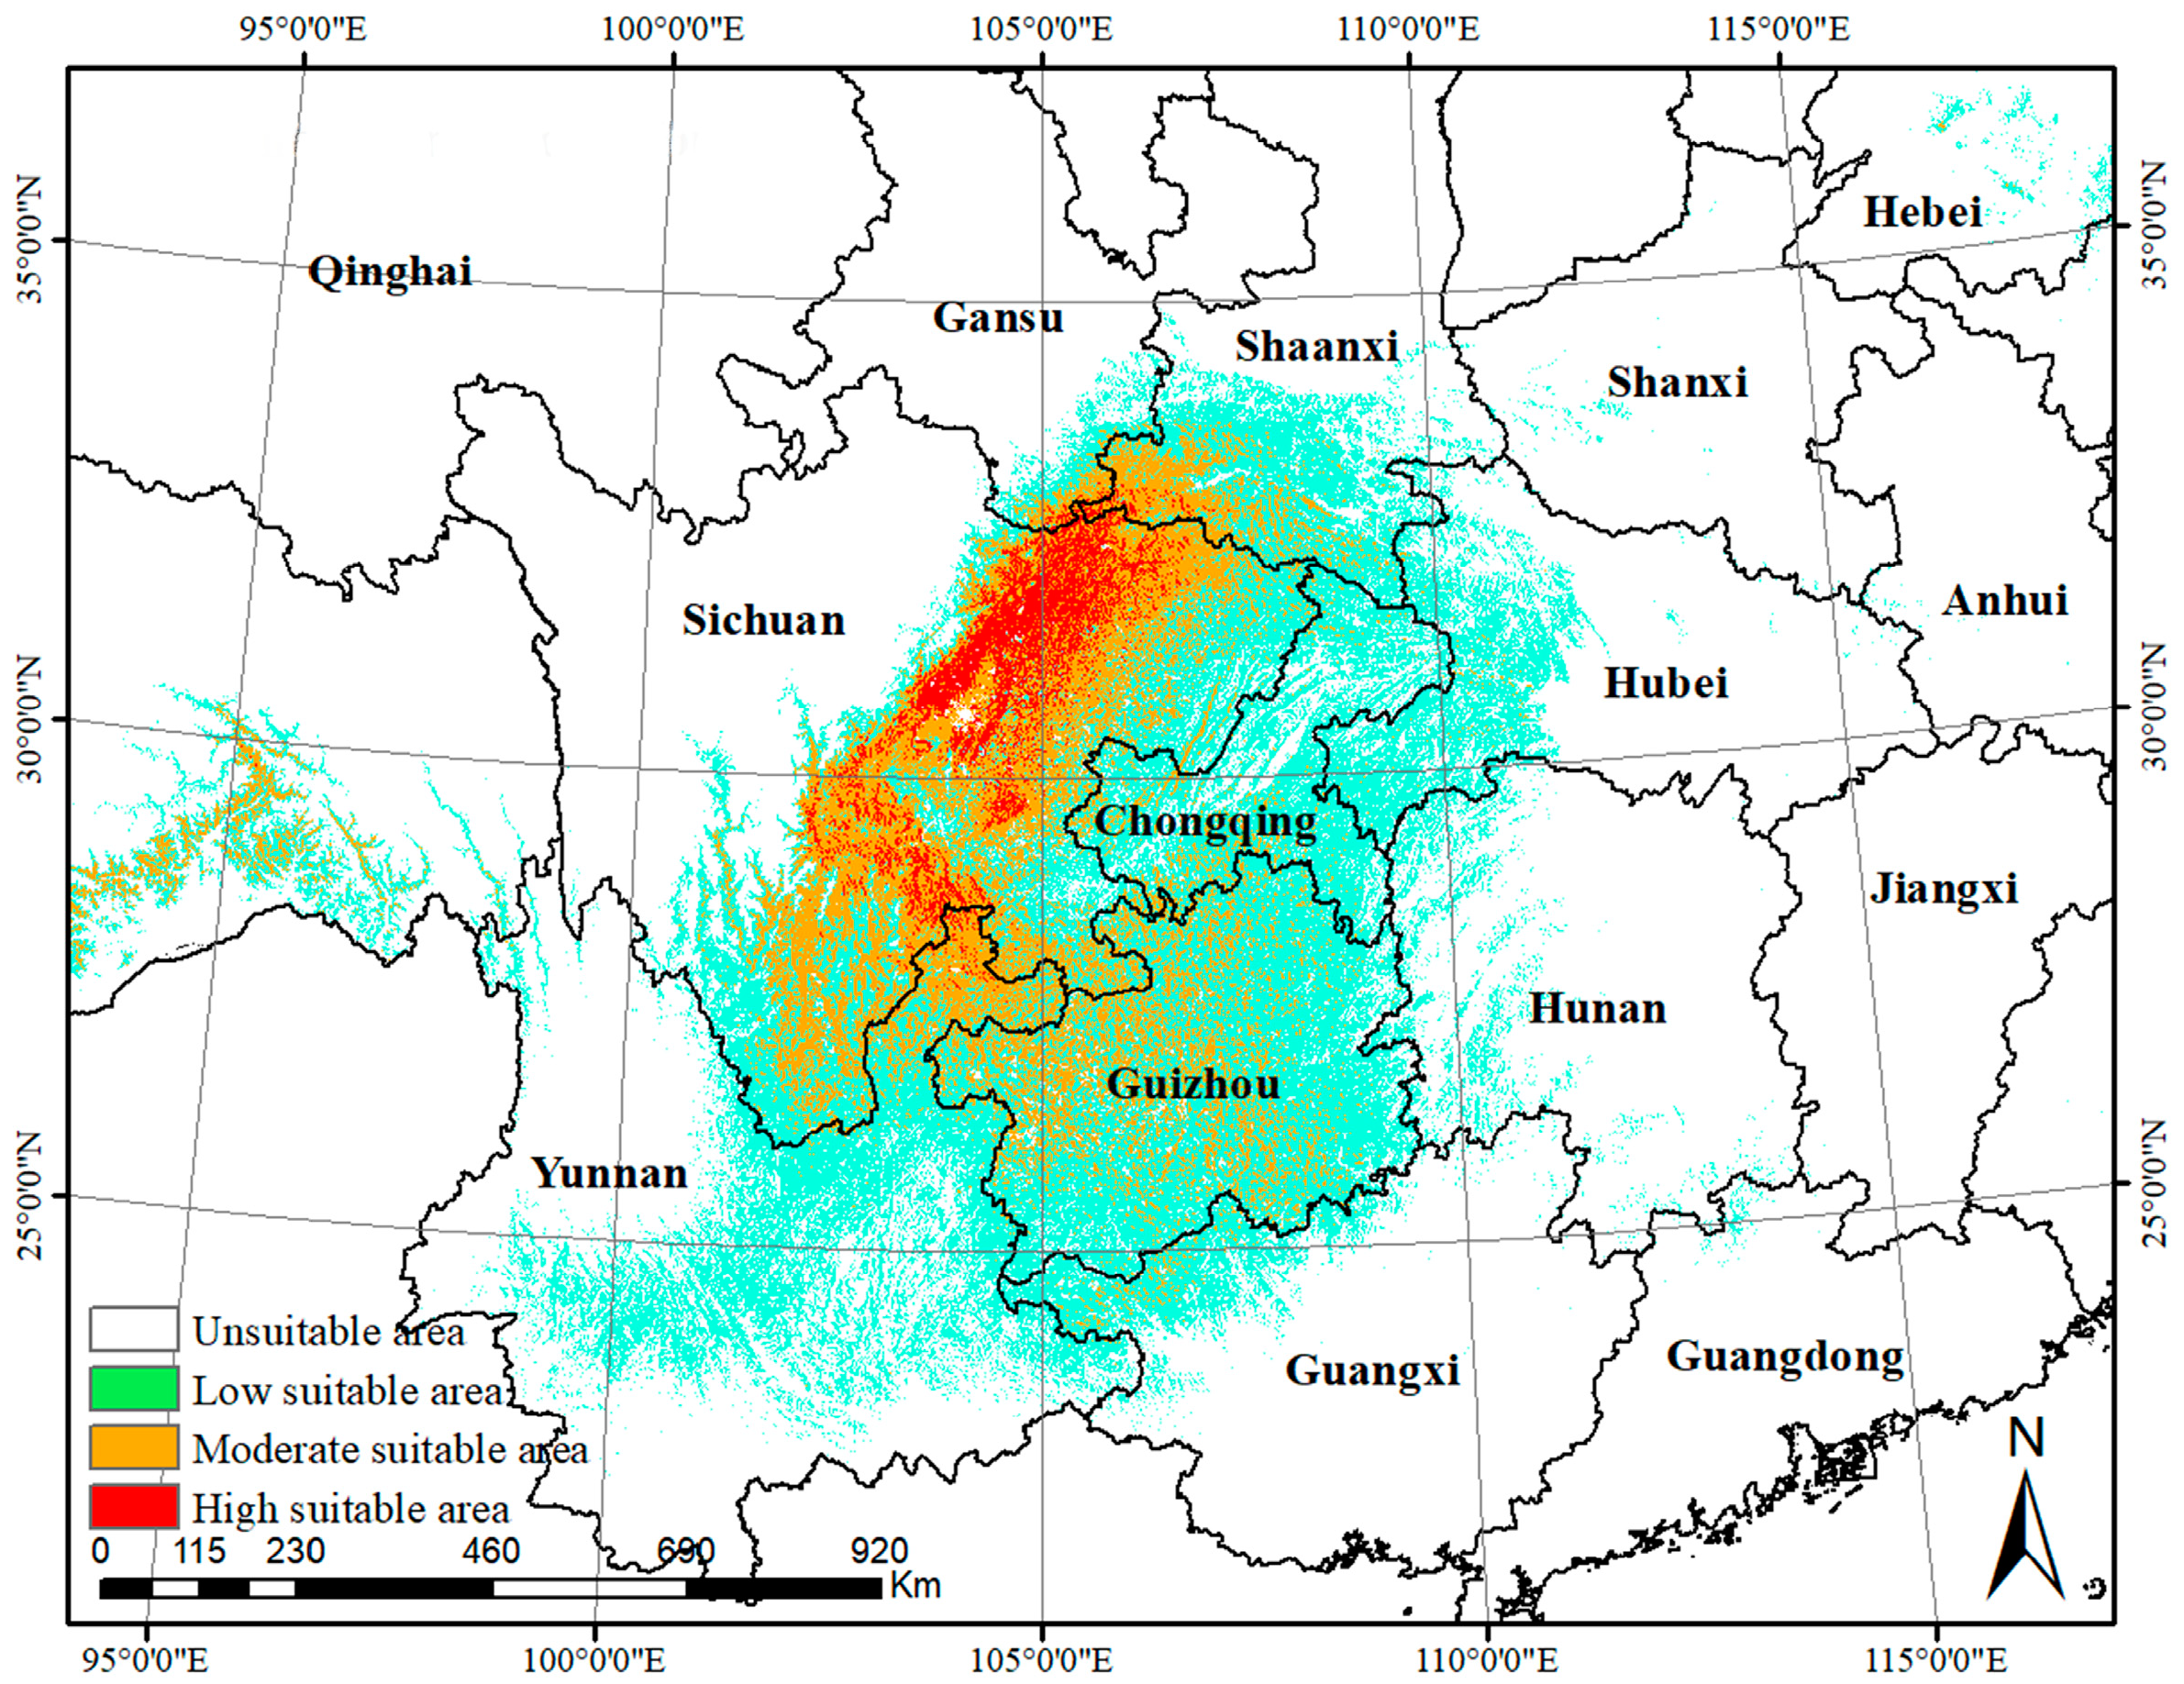
3.4. Current Potential Suitable Distribution

Based on the simulation results, the potential contemporary, suitable area for C. longepaniculata was predominantly distributed in Southwestern China, particularly in Sichuan and Guizhou Provinces (Figure 5). Notably, Sichuan Province harbored the majority of the highly suitable areas, aligning with the actual occurrence records that were primarily concentrated in this region. The highly suitable habitats spanned approximately 38,616 km2, representing 0.4% of China’s total land area. These areas were classified as “highly suitable” due to their optimal environmental conditions, closely matching the species’ habitat requirements, including favorable temperature, precipitation, and other ecological factors. Surrounding these highly suitable areas, the moderately suitable regions encompassed a total of 202,707 km2, mainly distributed in Sichuan, Guizhou, Shaanxi, Yunnan, and Hubei Provinces (Figure 5).

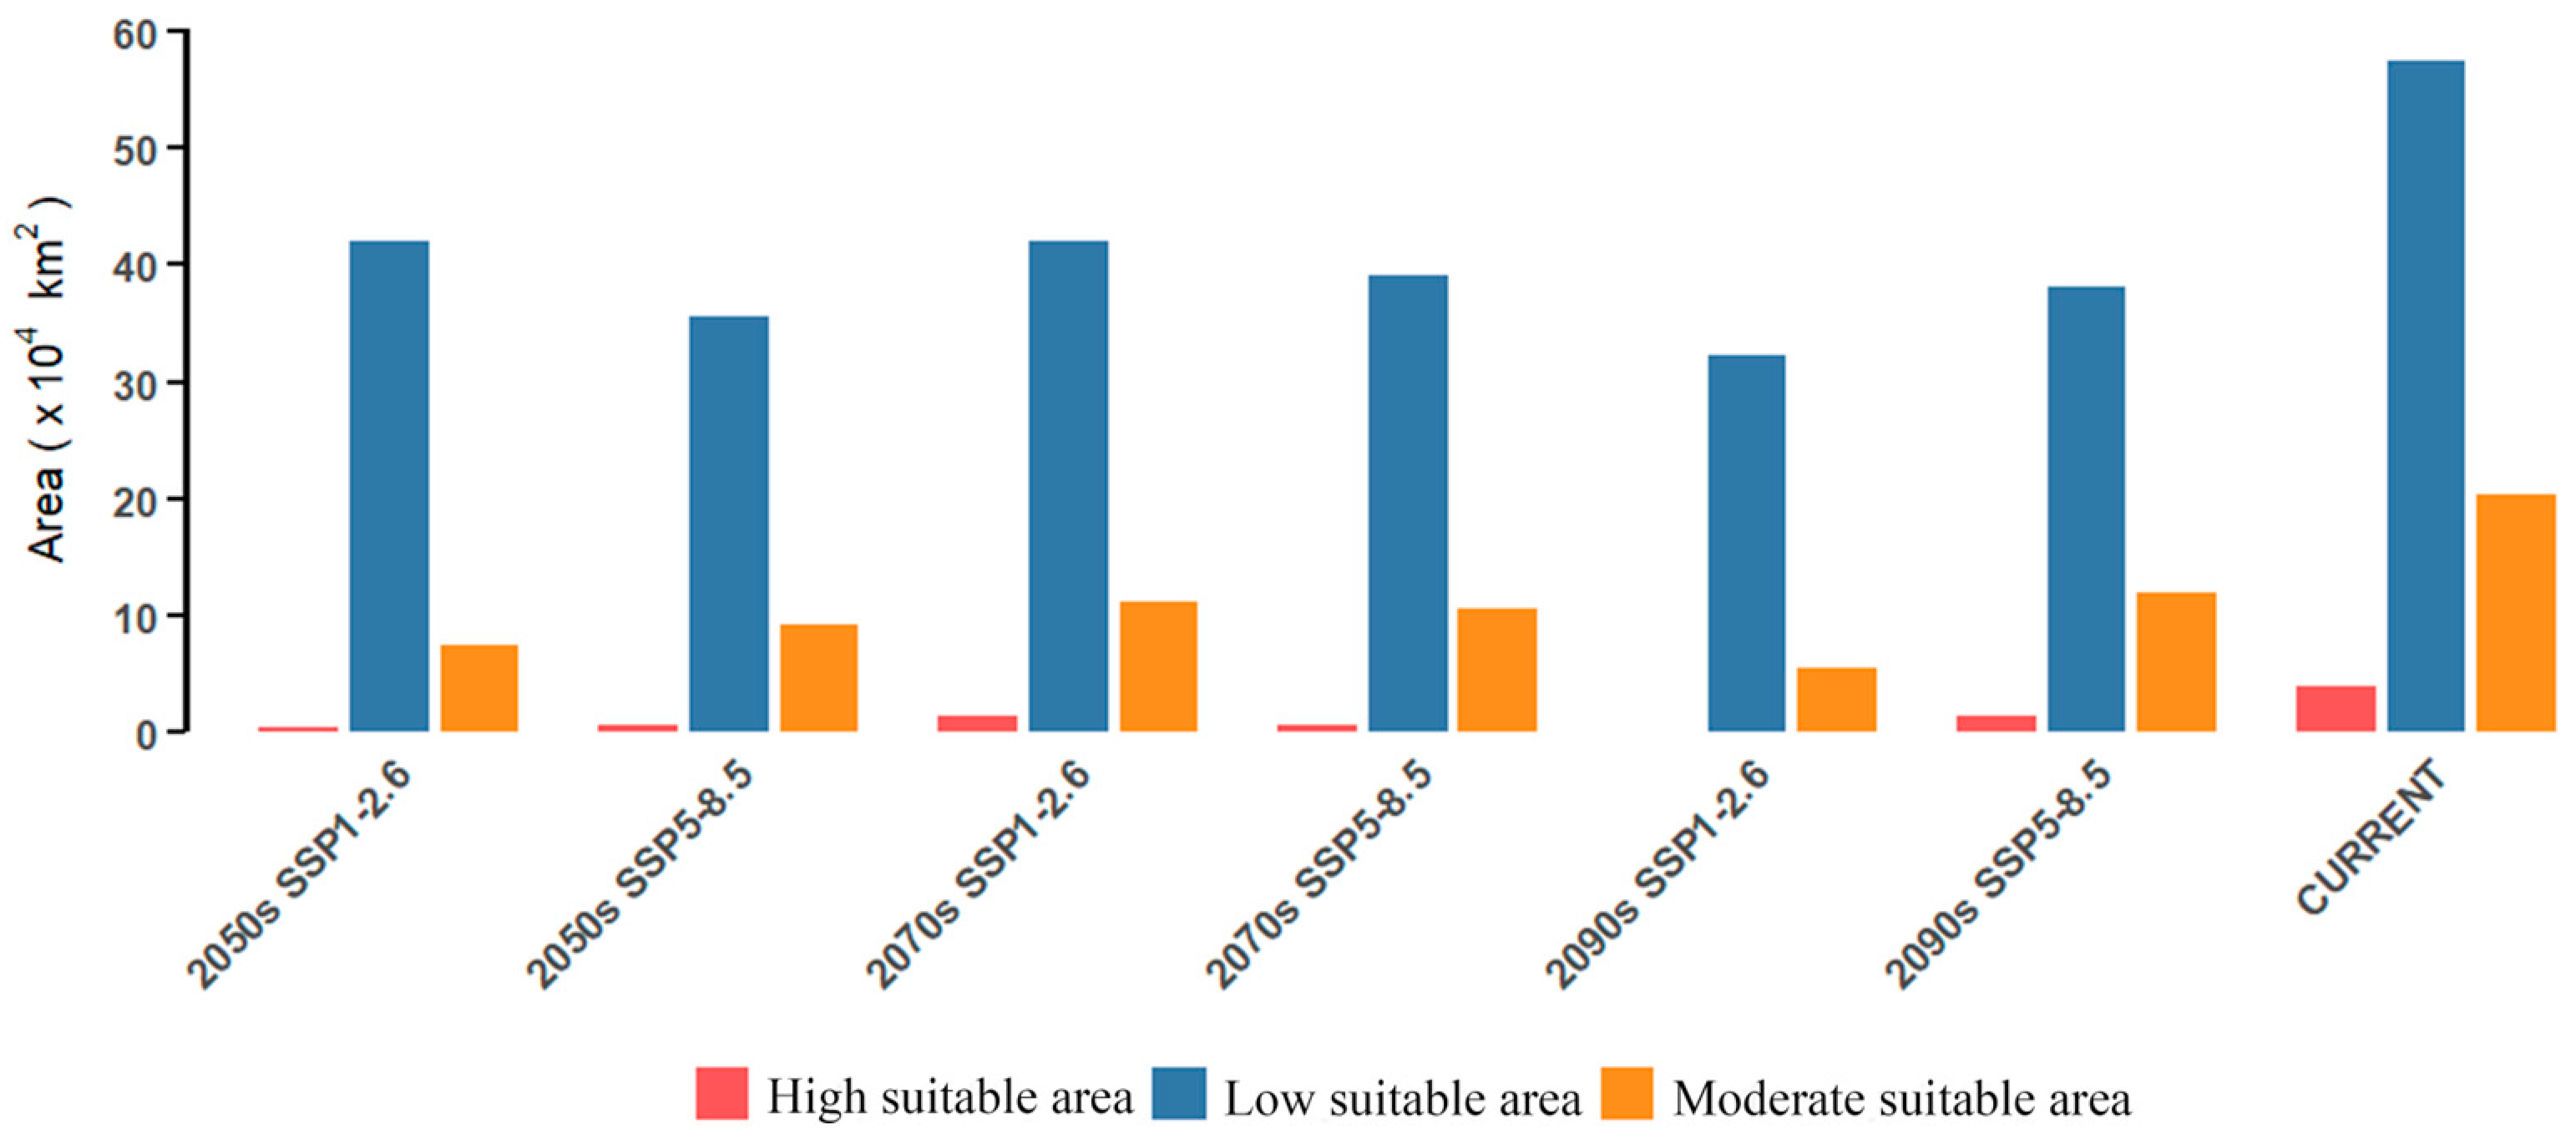
3.5. Potential Distribution Under Future Climate Conditions

The predicted future potentially suitable habitats for C. longepaniculata under the SSP1-2.6 and SSP5-8.5 climate scenarios for the 2050s, 2070s, and 2090s are shown in Figure 6. Across both scenarios, suitable habitats were primarily concentrated in Southwest China, particularly in Sichuan and Shaanxi Provinces, throughout all time periods, although the extent of highly suitable areas varied (Figure 6). Compared to the current distribution, the total suitable area is projected to decrease under both SSP1-2.6 and SSP5-8.5 scenarios (Figure 7).

3.6. Expansion and Shrinkage of the Potential Habitat in the Future

The future potential distribution of C. longepaniculata was compared with the current spatial pattern of suitable habitats. Under climate change scenarios, the total suitable area exhibited varying degrees of contraction (Figure 8). In the SSP1-2.6 scenario, the stable, suitable area remained above 320,000 km2, whereas under the SSP5-8.5 scenario, the stable area in the 2070s was reduced to 182,457 km2, with the largest contracted area reaching approximately 622,383 km2 (Figure 9). Notably, the overall suitable habitat distribution demonstrated a northward expansion, with potentially suitable areas extending into Hubei, Anhui, and Hebei Provinces under the SSP1-2.6 scenario (Figure 8). Meanwhile, the most significant habitat contractions were observed in southern regions, including Yunnan, Guizhou, Sichuan Provinces, and Chongqing Municipality (Figure 8).

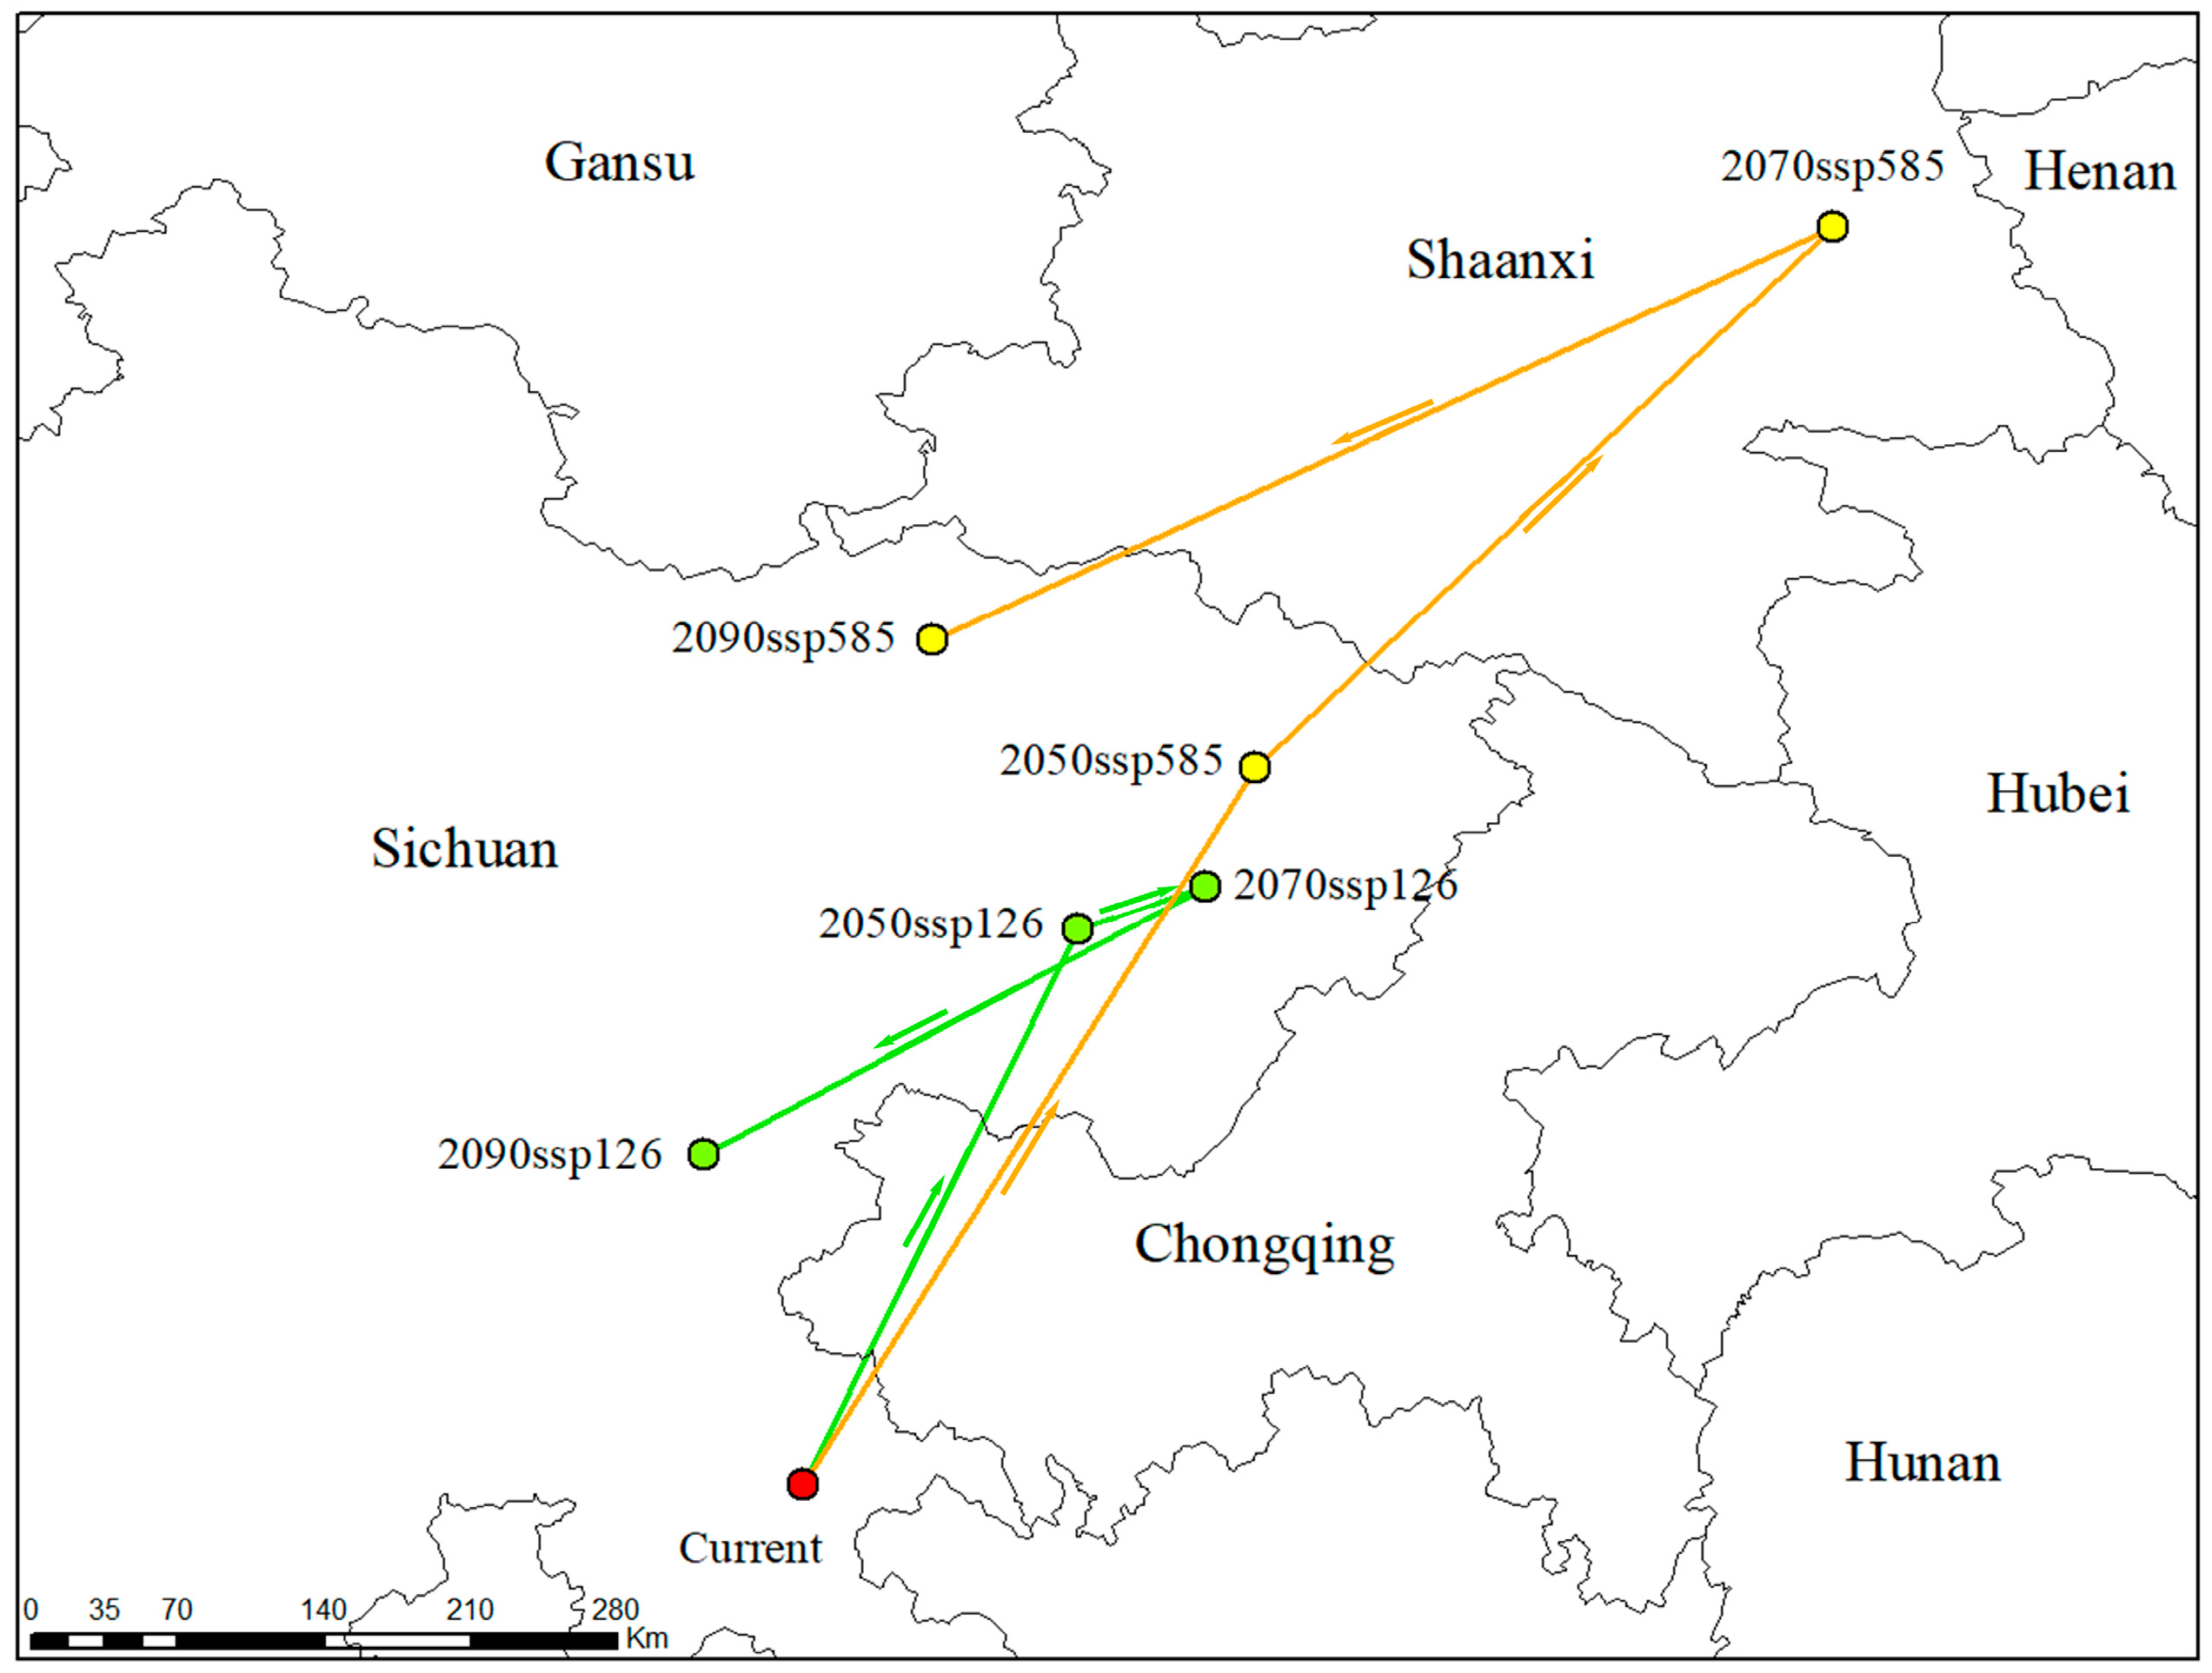
3.7. Centroid Shifts in the Predicted Potential Suitable Habitat of C. longepaniculata

Table 2 presents the longitudes and latitudes of the centroids in suitable areas across various scenarios, along with the relative distances of centroid shifts between consecutive periods. Among the migratory routes, the shortest shift distance (55 Km) occurred between the current period and the 2050s under the SSP1-2.6 scenario, while the longest shift distance (410 Km) was observed between the 2070s and the 2090s under the SSP5-8.5 scenario.
The migratory routes (Figure 10) demonstrate that the centroids of suitable habitats for C. longepaniculata are projected to shift toward Northeastern China under both SSP1-2.6 and SSP5-8.5 scenarios, with the majority of centroids remaining within Sichuan Province. Under the SSP1-2.6 scenario, from 2050 to 2090, the centroids are expected to shift northeastward initially (from the present to the 2050s), continue moving northeastward, and then exhibit a southwestward movement between the 2070s and 2090s (Figure 10). Similarly, under the SSP5-8.5 scenario, the centroids are projected to follow a comparable migratory route; however, the migratory distances (390 km, 346.055 km, and 409.959 km) are significantly longer compared to those observed under the SSP1-2.6 scenario (289 km, 56 km, and 243 km).

4. Discussion

4.1. Restricting Environmental Factors and Current Potentially Suitable Areas for C. longepaniculata

The distribution of C. longepaniculata was strongly influenced by climatic variables, particularly annual precipitation (bio12) and the minimum temperature of the coldest month (bio6). These factors, alongside elevation and precipitation seasonality (bio15), collectively contributed over 80% to the MaxEnt model. This result underscores the dominant role of temperature and precipitation rather than soil variables in determining the species’ habitat suitability, aligning with findings for other species like Zanthoxylum nitidum Roxb and Panax notoginseng Burkill, which were similarly constrained by these climatic variables [41,42]. The jackknife test further highlighted bio12 and bio6 as key predictors with significant independent contributions to the MaxEnt model. This finding aligns with Liu et al. [43], who reported that climate indices, particularly bio12, accounted for the majority of the contribution in predicting forest resource distributions in Inner Mongolia. Similarly, Yang et al. [44] identified annual precipitation and the minimum temperature of the coldest month as dominant factors influencing the distribution of Betula luminifera H. Winkler, a fast-growing broad-leaved tree species.
Single response curves further elucidated the species’ preferences. When plant presence probability exceeded 0.5, environmental conditions were deemed favorable for growth [45]. When the probability of plant presence exceeded 0.5, the corresponding environmental conditions were considered favorable for growth [46,47]. For C. longepaniculata, optimal annual precipitation (bio12) ranged from 690 mm to 1487 mm, peaking at 894 mm, which aligns with precipitation data for Sichuan Province (1000–1200 mm) [48], supporting the model’s accuracy. Precipitation is a critical factor for plant growth and seedling survival [49]. For instance, Homnerger et al. found that changes in soil moisture closely tracked precipitation patterns, with extreme deviations (either drought or excessive rainfall) significantly affecting plant growth [50]. While some species, like Leonurus japonicus Houtt and Pterocarpus santalinus L.f., require high rainfall for growth located in other places, the basin topography of Sichuan enhances water absorption, making excessive precipitation potentially damaging but also vital for C. longepaniculata [51]. Rosenzweig et al. modeled the impact of excess soil moisture on crops, predicting significant losses due to increased rainfall in the coming decades [52]. Zhao et al. studied C. camphora, revealing that drought and flooding had distinct effects on photosynthesis and plant physiology, with drought inducing stomatal limitations and abscisic acid accumulation, while flooding did not [53]. This highlights the complex relationship between precipitation and plant growth in C. longepaniculata.
Similarly, the minimum temperature of the coldest month (bio6) was most favorable between −9.9 °C and 10.67 °C, with an optimal value of 0.6 °C. A previous study showed that seeds of certain species exhibited improved germination at 2 °C, within the bio6 range, providing a biological rationale for the observed seed germination patterns [54]. However, exposure to lower temperatures can induce various cold stress symptoms, including poor germination, stunted seedlings, chlorosis, reduced leaf expansion, and tissue necrosis [55]. Understanding how C. longepaniculata responds to cold stress is crucial for improving its resilience to climate change and expanding its cultivation range. Bi et al. observed that short-term cold stress triggered the upregulation of genes involved in calcium and ethylene signaling, while prolonged cold exposure activated genes related to jasmonic acid signaling and suppressed cellular biosynthesis [56]. Further research into the molecular mechanisms underlying cold tolerance in C. longepaniculata could facilitate the development of cultivars with enhanced resilience to cold stress, improving both their adaptability and productivity in diverse climates.
The present predictions revealed that suitable habitats were primarily concentrated in Sichuan and Guizhou Provinces, with highly suitable habitats mainly found in Sichuan Province. This finding aligns with numerous studies, indicating that current prediction locations correspond to known sampling areas of occurrence records [57,58], reinforcing the model’s reliability that the model simulation is highly consistent with the actual distribution of C. longepaniculata. In recent years, the C. longepaniculatum industry, centered on eucalyptol production, has gained significant prominence in Yibin, Sichuan [59]. The areas of highly suitable habitats were estimated at 38,616 km2, making it the largest among various scenarios. Nevertheless, compared to other endangered species, the suitable areas for C. longepaniculata are significantly smaller than those of species such as Populus tomentosa Carrière, Populus cathayana Rehder, and Populus lasiocarpa Oliv. [60]. This underscores the urgent need for focused efforts in establishing effective conservation measures for this species.

4.2. Potential Distribution of C. longepaniculata in the Future and Response to Climate Change

Under the two Shared Socioeconomic Pathways (SSPs) scenarios, Sichuan Province consistently demonstrated the most stable suitable habitats for C. longepaniculata, suggesting that its climatic conditions were highly compatible with the species’ ecological requirements [61]. This stability can be largely attributed to the unique geography and climate of the Hengduan Mountains, which are located in Sichuan Province and its surrounding areas. Recognized as refugia for plants under harsh climatic conditions [62], the Hengduan Mountains provide a combination of diverse microclimates, high altitudinal gradients, and north–south-flowing rivers. These factors not only buffer extreme climatic changes but also create conditions that facilitate plant migration along altitudinal and latitudinal gradients, enabling C. longepaniculata to adapt and persist in these regions over time [58,63]. Under the SSP1-2.6 scenario, high-suitability habitats in Sichuan Province were projected to exhibit varying degrees of decline, particularly by the 2090s, when a significant reduction in high-suitability areas was observed compared to the current distribution. Conversely, under the SSP5-8.5 scenario for the 2090s, high-suitability areas were predicted to expand to Tibet (Northwestern China), although the total suitable habitats under this scenario were smaller than those under SSP1-2.6, likely due to the effects of rising temperatures. Climate warming is expected to significantly affect plant growth, physiology, and distribution [10]. For C. longepaniculata, rising temperatures and altered precipitation patterns are likely to reduce its southern habitat, leading to a contraction of suitable areas. This habitat loss could threaten the species’ survival by fragmenting populations, limiting gene flow, reducing genetic diversity, and exacerbating biodiversity loss [64,65]. Such fragmentation increases the risk of inbreeding and genetic drift, making the species more vulnerable to environmental changes [66]. In addition to population dynamics, habitat loss could also disrupt C. longepaniculata’s ecological role in processes like pollination and seed dispersal [67]. This disruption may weaken ecosystem functions, potentially destabilizing the broader ecosystem and affecting other species.
As shown in Figure 8, the general trend under future climate scenarios indicated that suitable habitats for C. longepaniculata would follow a consistent pattern: stability and expansion in the northeastern and northwestern regions, coupled with contraction in the southern regions. This pattern aligns with the findings of previous studies on other species, such as Litsea cubeba (Lour.) Pers [6], Chinese Ziziphus jujuba Mill. [15], and Magnolia wufengensis (currently revised as Yulania sprengeri) Pamp. [68], which are projected to shift northward to avoid extreme high temperatures. Similarly, Ma et al. [69] revealed that the potential suitable areas for Stipa purpurea Griseb. would shift northwestward in the future, and Prevéy et al. [70] reported that Vaccinium membranaceum Douglas ex Torr. would expand in high-latitude areas in response to future warming scenarios. These examples provide a broader context for understanding the predicted migration trends of C. longepaniculata.
The effects of climate change on species distribution can vary significantly, with some plants experiencing habitat expansion, while others may face substantial contraction, potentially leading to extinction [71]. Plants can only survive and create stable habitats under favorable environmental conditions. Certain specific events can influence plant dispersal, including the flight of a dandelion fruit, the consumption of seeds, and the extreme events of seed release after burning or explosive ejection, which subtly aids in the dispersal of seeds [72]. However, natural dispersal barriers, such as high mountains and rivers, significantly influence plant dispersal and migration [73,74]. This may help explain the observed northeastward shift of suitable habitats over various periods, with the centrally located Qinling Mountains in Shaanxi Province, situated within China, acting as a partial barrier. Interestingly, these mountains that create migration barriers often provide more suitable living conditions for C. longepaniculata (Hengduan Mountains and adjacent regions in Sichuan Province, Qinling Mountains in Shaanxi Province). To further explore the shifts in suitable habitats, we connected the centroids of suitable areas across different periods under the same climate scenarios to map migratory routes. While the migratory paths varied slightly, they exhibited a common trend of shifting northward toward higher elevations. It is noteworthy that most centroids were projected to remain within Sichuan Province, which highlights environmental adaptability in Sichuan Province.

4.3. Conservation Strategies for C. longepaniculata

The wild populations of C. longepaniculata have experienced significant declines due to human activities and climate change. Currently, the highly suitable habitats of this species cover only 38,616 km2, highlighting its vulnerability. Anthropogenic climate change has already triggered localized extinctions in numerous plant and animal species, posing severe threats to global biodiversity [75]. The conservation of plant species, particularly those with significant ecological, medicinal, and economic values, must be prioritized [76]. As a National Class II Protected Tree Species in China, valued for its medicinal and economic importance, the protection of C. longepaniculata is both urgent and necessary. Predicting its potential geographic habitats and assessing distributional shifts under climate change provide critical scientific insights for conservation planning [77,78]. Our predictions indicate that the Sichuan and Shaanxi Provinces will remain the most stable regions for moderate to highly suitable habitats in the future. These regions may serve as refuges for C. longepaniculata in response to climate change [61]. To ensure the long-term survival of C. longepaniculata in these areas, in situ conservation measures should be implemented, drawing on approaches used for endangered species on Qinghai Plateau [78]. Furthermore, we delineated the species’ natural distribution into core and edge areas using Kernel Density Estimation (Figure 11). The corresponding geographic map is presented in Figure 1. Core areas that harbor dense populations should be prioritized for on-site protection zones. Projections also suggest a northward shift in suitable habitats, with newly suitable areas emerging in provinces such as Shaanxi, Hebei, Henan, and Shandong. These regions should be considered for artificial cultivation and the establishment of wild protected areas to facilitate adaptive management and future species resilience [4]. Conversely, significant reductions in suitable habitats are anticipated in Guizhou, Yunnan, and Southern Sichuan Province. These areas warrant urgent efforts to establish local germplasm banks to safeguard the species’ genetic diversity and mitigate the risks posed by habitat loss [14]. Additionally, ex situ conservation should also be taken into consideration for these habitats vulnerable to climate change [79]. While our findings underscore the importance of targeted conservation strategies, it is equally critical to enhance research into the medicinal and economic potential of C. longepaniculata. Additionally, advancements in genetic breeding and biotechnology could offer innovative solutions for its conservation and sustainable use. Ultimately, a comprehensive and adaptive conservation framework is required to ensure the survival of this valuable species in the face of ongoing environmental changes.

5. Conclusions

In this study, we used the MaxEnt model, incorporating climate and environmental variables, to explore the potential distribution of C. longepaniculata. The results indicated that annual precipitation (bio12), minimum temperature of the coldest month (bio6), and dem were the most influential factors, collectively accounting for over 70% of the species’ distribution limitations. The highly suitable habitats were primarily located in Sichuan Province, which aligns well with the current occurrence records of C. longepaniculata. Looking to the future, suitable habitats for the species are projected to be concentrated in Southwest China, especially in Sichuan and Shaanxi Provinces, across all time periods. These findings suggest that as climate change progresses, C. longepaniculata is likely to shift its distribution to higher latitudes and elevations in response to increasing temperatures, with the overall suitable habitats showing a northern expansion and southern contraction.
Based on the predicted habitat suitability and kernel analysis, we propose targeted conservation strategies tailored to different areas. For regions with highly suitable habitats, such as the core areas in Sichuan and parts of Shaanxi, in situ conservation measures should be prioritized. For areas projected to become suitable in the future, such as higher latitudes and elevations, artificial cultivation and the establishment of protected areas could be considered. Additionally, for areas facing habitat contraction, the establishment of local germplasm banks would be essential to preserve the genetic diversity of the species and mitigate the risks associated with habitat loss. This study provides valuable insights into the potential impacts of climate change on the distribution of C. longepaniculata and proposes actionable conservation strategies. These findings not only contribute to understanding the species’ response mechanisms to climate change but also offer a theoretical basis for developing more effective conservation plans.
However, despite the valuable insights provided by this study, there remain several key areas for further investigation. First, integrating population genetics data could provide valuable insights into the genetic structure and differentiation of C. longepaniculata, offering a basis for niche differentiation analyses based on genetic clusters. Building upon this, the application of advanced landscape genomics approaches could further elucidate how environmental factors drive genetic diversity, local adaptation, and resilience to climate change, thereby providing a more holistic understanding of the species’ adaptive mechanisms and informing targeted conservation strategies. Such information would support the development of more precise and robust conservation strategies tailored to the evolutionary and ecological needs of this species. By bridging these knowledge gaps, future research can better inform efforts to ensure the long-term survival of C. longepaniculata in the face of ongoing environmental change.

Supplementary Materials

The following supporting information can be downloaded at: https://www.mdpi.com/article/10.3390/f16020338/s1, Table S1: Occurrence records; Table S2: Environmental variables used in this study; Table S3: Environmental variable values for each distribution point; Figure S1: Contribution test results for each variable from MaxEnt; Figure S2: Heatmap of environmental variables.

Author Contributions

Conceptualization, G.Z. and Y.Z. (Yingying Zhang); data curation, Y.Z. (Yingying Zhang) and H.Z.; methodology, Y.L. and M.Z.; software, Z.W., Y.Y., X.W. and Y.X.; visualization, S.G. and C.J.; writing, Y.Z. (Yanzhao Zhu) and H.Z.; writing—review and editing, Y.Z. (Yanzhao Zhu), H.Z., G.Z. and Y.Z. (Yingying Zhang). All authors have read and agreed to the published version of the manuscript.

Funding

This research was funded by the Key Research and Development Program of Shaanxi, grant number 2024SF-GJHX-42.

Data Availability Statement

The original contributions presented in this study are included in the article and Supplementary Materials. Further inquiries can be directed to corresponding authors.

Conflicts of Interest

The authors declare no conflicts of interest.

References

  1. Işik, K. Rare and endemic species: Why are they prone to extinction? Turk. J. Bot. 2011, 35, 11. [Google Scholar] [CrossRef]
  2. Klein, J.A.; Harte, J.; Zhao, X.Q. Decline in medicinal and forage species with warming is mediated by plant traits on the Tibetan plateau. Ecosystems 2008, 11, 775–789. [Google Scholar] [CrossRef]
  3. Okigbo, R.N.; Eme, U.E.; Ogbogu, S. Biodiversity and conservation of medicinal and aromatic 37 plants in Africa. Biotechnol. Mol. Biol. Rev. 2008, 3, 127–134. [Google Scholar]
  4. Gao, X.; Liu, J.; Huang, Z. The impact of climate change on the distribution of rare and endangered tree Firmiana kwangsiensis using the Maxent modeling. Ecol. Evol. 2022, 12, e9165. [Google Scholar] [CrossRef]
  5. Wu, D.J.; Zhu, P.T.; Wu, H.; Dai, H.F. Industry development status and prospect of Cinnamomum longepaniculatum. Open Access Libr. J. 2022, 9, e8616. [Google Scholar] [CrossRef]
  6. Urban, M.C.; Zarnetske, P.L.; Skelly, D.K. Moving forward: Dispersal and species interactions determine biotic responses to climate change. Ann. N. Y. Acad. Sci. 2013, 1297, 44–60. [Google Scholar] [CrossRef] [PubMed]
  7. Mantyka-pringle, C.S.; Martin, T.G.; Rhodes, J.R. Interactions between climate and habitat loss effects on biodiversity: A systematic review and meta-analysis. Glob. Change Biol. 2012, 18, 1239–1252. [Google Scholar] [CrossRef]
  8. Zhang, X.F.; Nizamani, M.M.; Jiang, C.; Fang, F.Z.; Zhao, K.K. Potential planting regions of Pterocarpus santalinus (Fabaceae) under current and future climate in China based on MaxEnt modeling. Ecol. Evol. 2024, 14, e11409. [Google Scholar] [CrossRef]
  9. Zandalinas, S.I.; Fritschi, F.B.; Mittler, R. Global warming, climate change, and environmental pollution: Recipe for a multifactorial stress combination disaster. Trends Plant Sci. 2021, 26, 588–599. [Google Scholar] [CrossRef] [PubMed]
  10. Ostad-Ali-Askari, K.; Ghorbanizadeh, K.H.; Shayannejad, M. Effect of climate change on precipitation patterns in an arid region using GCM models: Case study of Isfahan-Borkhar Plain. Nat. Hazards Rev. 2020, 21, 04020006. [Google Scholar] [CrossRef]
  11. Shi, X.; Wang, J.; Zhang, L.; Chen, S.; Zhao, A.; Ning, X.; Fan, G.; Wu, N.; Zhang, L.; Wang, Z. Prediction of the potentially suitable areas of Litsea cubeba in China based on future climate change using the optimized MaxEnt model. Ecol. Indic. 2023, 148, 110093. [Google Scholar] [CrossRef]
  12. Hao, R.Z.; Yu, T.; Zhao, H.; Zhang, S.K.; Jing, Y.; Li, J.Q. Prediction of suitable distribution area of the endangered plant Acer catalpifolium under the background of climate change in China. J. Beijing For. Univ. 2021, 43, 33–43. [Google Scholar]
  13. Ostad-Ali-Askar, K.; Su, R.; Liu, L. Water resources and climate change. J. Water Clim. Change 2018, 9, 239. [Google Scholar] [CrossRef]
  14. Wang, Y.; Xie, L.; Zhou, X.; Chen, R.; Zhao, G.; Zhang, F. Prediction of the potentially suitable areas of Leonurus japonicus in China based on future climate change using the optimized MaxEnt model. Ecol. Evol. 2023, 13, e10597. [Google Scholar] [CrossRef] [PubMed]
  15. Hampe, A.; Rodríguez-Sánchez, F.; Dobrowski, S.; Hu, F.S.; Gavin, D.G. Climate refugia: From the Last Glacial Maximum to the twenty-first century. New Phytol. 2013, 197, 16–18. [Google Scholar] [CrossRef]
  16. Wang, Q.; Abbott, R.J.; Yu, Q.S.; Lin, K.; Liu, J.Q. Pleistocene climate change and the origin of two desert plant species, Pugionium cornutum and Pugionium dolabratum (Brassicaceae), in northwest China. New Phytol. 2013, 199, 277–287. [Google Scholar] [CrossRef] [PubMed]
  17. Zhao, Q.; Mi, Z.Y.; Lu, C.; Zhang, X.F.; Chen, L.J.; Wang, S.Q.; Niu, J.F.; Wang, Z.Z. Predicting potential distribution of Ziziphus spinosa (Bunge) HH Hu ex FH Chen in China under climate change scenarios. Ecol. Evol. 2022, 12, e8629. [Google Scholar] [CrossRef] [PubMed]
  18. Sun, S.; Zhang, Y.; Huang, D.; Wang, H.; Cao, Q.; Fan, P.; Yang, N.; Zheng, P.; Wang, R. The effect of climate change on the richness distribution pattern of oaks (Quercus L.) in China. Sci. Total Environ. 2020, 744, 140786. [Google Scholar] [CrossRef] [PubMed]
  19. Phillips, S.J.; Anderson, R.P.; Schapire, R.E. Maximum entropy modeling of species geographic distributions. Ecol. Model. 2006, 190, 231–259. [Google Scholar] [CrossRef]
  20. Wang, R.H.; Ru, X.Y.; Jiang, T.C.; Wang, J.H. Based on the phenological model to study the possible changes of apple flowering dates under future climate scenarios in shaanxi province. J. Agrometeorol. 2021, 42, 729. [Google Scholar]
  21. Ye, X.Z.; Zhang, M.Z.; Lai, W.F.; Yang, M.; Fan, H.; Zhang, G.; Chen, S.; Liu, B. Prediction of potential suitable distribution of Phoebe bournei based on MaxEnt optimization model. Acta Ecol. Sin. 2021, 41, 8135–8144. [Google Scholar]
  22. Khanum, R.; Mumtaz, A.S.; Kumar, S. Predicting impacts of climate change on medicinal asclepiads of Pakistan using Maxent modeling. Acta Oecol. 2013, 49, 23–31. [Google Scholar] [CrossRef]
  23. Li, L.H.; Liu, H.Y.; Lin, Z.S.; Jia, J.H.; Liu, X. Identifying priority areas for monitoring the invasion of Solidago canadensis based on MAXENT and ZONATION. Acta Ecol. Sin. 2017, 37, 3124–3132. [Google Scholar]
  24. Lemke, D.; Hulme, P.E.; Brown, J.A.; Tadesse, W. Distribution modelling of Japanese honeysuckle (Lonicera japonica) invasion in the Cumberland Plateau and Mountain Region, USA. For. Ecol. Manag. 2011, 262, 139–149. [Google Scholar] [CrossRef]
  25. Liu, C.; Huo, H.L.; Tian, L.M.; Dong, X.G.; Qi, D.; Zhang, Y.; Xu, J.Y.; Cao, Y.F. Potential geographical distribution of pyrus calleryana under different climate change scena-rios based on the maxent model. J. Appl. Ecol. 2018, 29, 3696–3704. [Google Scholar]
  26. Gong, Z.N.; Su, S.; Du, B.; Guan, H.; Zhang, Q. Habitat selection and dispersal of red-crowned cranes during breeding period in Zhalong Wetland National Nature Reserve. J. Nat. Resour. Dev. 2021, 36, 1964–1975. [Google Scholar] [CrossRef]
  27. Yan, K.; Zhu, H.; Cao, G.; Meng, L.; Li, J.; Zhang, J.; Liu, S.; Wang, Y.; Feng, R.; Soaud, S.A.; et al. Chromosome genome assembly of the Camphora longepaniculata (Gamble) with PacBio and Hi-C sequencing data. Front. Plant Sci. 2024, 15, 1372127. [Google Scholar] [CrossRef] [PubMed]
  28. Boutanaev, A.M.; Moses, T.; Zi, J.; Nelson, D.R.; Mugford, S.T.; Peters, R.J.; Osbourn, A. Investigation of terpene diversification across multiple sequenced plant genomes. Proc. Natl. Acad. Sci. USA 2015, 112, E81–E88. [Google Scholar] [CrossRef]
  29. Wei, Q.; Tan, Y.Y.; Li, Q.; You, L.; Wang, C.; Wang, Y.; Liao, L. Effects of fungal endophytes on cell suspension culture of Cinnamomum longepaniculatum. GuangxiZhiwu/Guihaia 2016, 36, 923–929. [Google Scholar]
  30. Yan, K.; Wei, Q.; Feng, R.Z.; Zhou, W.H.; Chen, F. Transcriptome analysis of Cinnamomum longepaniculatum by high-throughput sequencing. Electron. J. Biotechnol. 2017, 28, 58–66. [Google Scholar] [CrossRef]
  31. Yan, K.; Wei, Q.; Feng, R.Z.; Zhou, W.H. Transcriptome analysis of the effects of endophytic fungi on the biosynthesis of essential oils in Cinnamomum longepaniculatum. Int. J. Agric. Biol. 2019, 6, 1301–1308. [Google Scholar]
  32. Warren, D.L.; Matzke, N.J.; Cardillo, M.; Baumgartner, J.B.; Beaumont, L.J.; Turelli, M.; Glor, R.E.; Huron, N.A.; Simões, M.; Iglesias, T.L.; et al. ENMTools 1.0: An R package for comparative ecological biogeography. Ecography 2021, 44, 504–511. [Google Scholar] [CrossRef]
  33. Baddeley, A.; Turner, R. Spatstat: An R package for analyzing spatial point patterns. J. Stat. Softw. 2005, 12, 1–42. [Google Scholar] [CrossRef]
  34. Wu, T.w.; Yu, R.C.; Lu, Y.X.; Jie, W.; Fang, Y.; Zhang, J.; Zhang, L.; Xin, X.; Li, L.; Wang, Z.; et al. BCC-CSM2-HR: A high-resolution version of the Beijing Climate Center Climate System Model. Geosci. Model Dev. 2020, 2020, 2977–3006. [Google Scholar] [CrossRef]
  35. Debella-Gilo, M.; Etzelmüller, B. Spatial prediction of soil classes using digital terrain analysis and multinomial logistic regression modeling integrated in GIS: Examples from Vestfold County, Norway. Catena 2009, 77, 8–18. [Google Scholar] [CrossRef]
  36. Chen, C.; Wu, Y.; Li, J.; Wang, X.; Zeng, Z.; Xu, J.; Liu, Y.; Feng, J.; Chen, H.; He, Y.; et al. TBtools-II: A “one for all, all for one” bioinformatics platform for biological big-data mining. Mol. Plant 2023, 16, 1733–1742. [Google Scholar] [CrossRef] [PubMed]
  37. McIntosh, A. The Jackknife estimation method. arXiv 2016, arXiv:1606.00497. [Google Scholar]
  38. Wickham, H. ggplot2. Wiley Interdiscip. Rev. Comput. Stat. 2011, 3, 180–185. [Google Scholar] [CrossRef]
  39. Zhang, L.; Jiang, B.; Meng, Y.; Jia, Y.; Xu, Q.; Pan, Y. The Influence of Climate Change on the Distribution of Hibiscus mutabilis in China: MaxEnt Model-Based Prediction. Plants 2024, 13, 1744. [Google Scholar] [CrossRef] [PubMed]
  40. Brown, J.L.; Bennett, J.R.; French, C.M. SDMtoolbox 2.0: The next generation Python-based GIS toolkit for landscape genetic, biogeographic and species distribution model analyses. PeerJ 2017, 5, e4095. [Google Scholar] [CrossRef] [PubMed]
  41. Yang, Y.; He, J.; Liu, Y.; Zeng, J.; Zeng, L.; He, R.; Guiang, M.M.; Li, Y.; Wu, H. Assessment of Chinese suitable habitats of Zanthoxylum nitidum in different climatic conditions by Maxent model, HPLC, and chemometric methods. Ind. Crops Prod. 2023, 196, 116515. [Google Scholar] [CrossRef]
  42. Zhan, P.; Wang, F.Y.; Xia, P.G.; Zhao, G.H.; Wei, M.T.; Wei, F.G.; Han, R.L. Assessment of suitable cultivation region for Panax notoginseng under different climatic conditions using MaxEnt model and high-performance liquid chromatography in China. Ind. Crops Prod. 2022, 176, 114416. [Google Scholar] [CrossRef]
  43. Liu, L.; Qin, F.; Liu, Y.; Hu, Y.; Wang, W.; Duan, H.; Li, M. Forecast of potential suitable areas for forest resources in Inner Mongolia under the Shared Socioeconomic Pathway 245 scenario. Ecol. Indic. 2024, 167, 112694. [Google Scholar] [CrossRef]
  44. Yang, Q.; Xiang, Y.; Li, S.; Zhao, L.; Liu, Y.; Luo, Y.; Long, Y.; Yang, S.; Luo, X. Modeling the Impacts of Climate Change on Potential Distribution of Betula luminifera H. Winkler in China Using MaxEnt. Forests 2024, 15, 1624. [Google Scholar] [CrossRef]
  45. Cauwer, V.D.; Muys, B.; Revermann, R.; Trabucco, A. Potential, realised, future distribution and environmental suitability for Pterocarpus angolensis DC in southern Africa. For. Ecol. Manag. 2014, 315, 211–226. [Google Scholar] [CrossRef]
  46. Zhang, Q.; Zhang, D.F.; Wu, M.L.; Guo, J.; Sun, C.Z.; Xie, C.X. Predicting the global areas for potential distribution of Gastrodia elata based on ecological niche models. Chin. J. Plant Ecol. 2017, 41, 770–778. [Google Scholar]
  47. Jia, X.; Wang, C.; Jin, H.; Zhao, Y.; Liu, L.-J.; Chen, Q.-H.; Li, B.-Y.; Xiao, Y.; Yin, H. Assessing the suitable distribution area of Pinus koraiensis based on an optimized MaxEnt model. Chin. J. Ecol. 2019, 38, 2570. [Google Scholar]
  48. Climate Resources. Available online: https://www.sc.gov.cn/10462/10464/10757/10868/2018/4/17/10449170.shtml (accessed on 5 October 2024).
  49. Liu, Y.; Shi, J. Predicting the potential global geographical distribution of two Icerya species under climate change. Forests 2020, 11, 684. [Google Scholar] [CrossRef]
  50. Homberger, J.M.; Lynch, A.; Riksen, M.; Limpens, J. Growth response of dune-building grasses to precipitation. Ecohydrology 2024, e2634. [Google Scholar] [CrossRef]
  51. Qi, D.M.; Li, Y.Q.; Zhou, C.Y.; Chen, D. Climatic change of summer rainstorms and the water vapor budget in the Sichuan Basin. J. Appl. Meteorol. Clim. 2022, 61, 537–557. [Google Scholar] [CrossRef]
  52. Rosenzweig, C.; Tubiello, F.N.; Goldberg, R.; Mills, E.; Bloomfield, J. Increased crop damage in the US from excess precipitation under climate change. Glob. Environ. Change 2002, 12, 197–202. [Google Scholar] [CrossRef]
  53. Zhao, Y.J.; Wang, D.F.; Duan, H.L. Effects of drought and flooding on growth and physiology of Cinnamomum camphora seedlings. Forests 2023, 14, 1343. [Google Scholar] [CrossRef]
  54. Zhao, X.; Wang, H.J.; He, X.Y.; Yan, Y.; Liu, M.J.; Liao, S.H.; Wei, Q. Effects of Different Temperatures on Physiology and Germination of Cinnamomum longepaniculatum Seed. Chin. Wild Pl. Resour. 2022, 41, 42–47. [Google Scholar]
  55. Yadav, S.K. Cold stress tolerance mechanisms in plants. A review. Agron. Sustain. Dev. 2010, 30, 515–527. [Google Scholar] [CrossRef]
  56. Bi, B.; Shao, L.M.; Xu, T.; Du, H.; Li, D.Q. Transcriptomic analysis reveals calcium and ethylene signaling pathway genes in response to cold stress in Cinnamomum camphora. Horticulturae 2024, 10, 995. [Google Scholar] [CrossRef]
  57. Ouyang, X.H.; Lin, H.P.; Bai, S.H.; Jie, C.; Chen, A.L. Simulation the potential distribution of Dendrolimus houi and its hosts, Pinus yunnanensis and Cryptomeria fortunei, under climate change in China. Front. Plant Sci. 2022, 13, 1054710. [Google Scholar] [CrossRef] [PubMed]
  58. Li, Y.G.; Zhaxi, D.Z.; Yuan, L.; Li, A.M.; Wang, J.H.; Liu, X.; Liu, Y.X. The Effects of Climate Change on the Distribution Pattern of Species Richness of Endemic Wetland Plants in the Qinghai-Tibet Plateau. Plants 2024, 13, 1886. [Google Scholar] [CrossRef]
  59. Xiao, Z.F.; Ai, Q.; Wang, Y.B.; Zhang, B.H.; Li, F.; Lv, X.W.; Jin, Z.N. Research Progress on Cinnamomum camphora. Jiangxi Sci. 2021, 39, 53–58. (In Chinese) [Google Scholar]
  60. Wang, P.; Luo, W.X.; Zhang, Q.Y.; Han, S.X.; Jin, Z.; Liu, J.C.; Li, Z.F.; Tao, J.P. Assessing the impact of climate change on three Populus species in China: Distribution patterns and implications. Glob. Ecol. Conserv. 2024, 50, e02853. [Google Scholar] [CrossRef]
  61. Liu, B.; Li, Y.; Zhao, J.; Weng, H.; Ye, X.; Liu, S.; Zhao, Z.; Ahmad, S.; Zhan, C. The Potential Habitat Response of Cyclobalanopsis gilva to Climate Change. Plants 2024, 13, 2336. [Google Scholar] [CrossRef] [PubMed]
  62. Liang, Q.L.; Xu, X.T.; Mao, K.S.; Wang, M.C.; Wang, K.; Xi, Z.X.; Liu, J.Q. Shifts in plant distributions in response to climate warming in a biodiversity hotspot, the Hengduan Mountains. J. Biogeogr. 2018, 45, 1334–1344. [Google Scholar] [CrossRef]
  63. Qiu, L.; Fu, Q.L.; Jacquemyn, H.; Burgess, K.S.; Cheng, J.J.; Mo, Z.Q.; Tang, X.D.; Yang, B.Y.; Tan, S.L. Contrasting range changes of Bergenia (Saxifragaceae) species under future climate change in the Himalaya and Hengduan Mountains Region. Theor. Appl. Climatol. 2023, 155, 1927–1939. [Google Scholar] [CrossRef]
  64. Waqar, Z.; Moraes, R.C.; Benchimol, M.; Morante-Filho, J.C.; Mariano-Neto, E.; Gaiotto, F.A. Gene flow and genetic structure reveal reduced diversity between generations of a tropical tree, Manilkara multifida Penn., in atlantic forest fragments. Genes 2021, 12, 2025. [Google Scholar] [CrossRef]
  65. Chase, J.M.; Blowes, S.A.; Knight, T.M.; Gerstner, K.; May, F. Ecosystem decay exacerbates biodiversity loss with habitat loss. Nature 2020, 584, 238–243. [Google Scholar] [CrossRef] [PubMed]
  66. Zhang, L.; Zhang, H.L.; Chen, Y.K.; Nizamani, M.M.; Wu, T.T.; Liu, T.T.; Zhou, Q. Assessing genetic diversity in critically endangered Chieniodendron hainanense populations within fragmented habitats in Hainan. Sci. Rep. 2024, 14, 6988. [Google Scholar] [CrossRef] [PubMed]
  67. Baude, M.; Kunin, W.E.; Boatman, N.D.; Conyers, S.; Davies, N.; Gillespie, M.A.K.; Morton, R.D.; Smart, S.M.; Memmott, J. Historical nectar assessment reveals the fall and rise of floral resources in Britain. Nature 2016, 530, 85–88. [Google Scholar] [CrossRef] [PubMed]
  68. Shi, X.D.; Yin, Q.; Sang, Z.T.; Zhu, Z.L.; Jia, Z.K.; Ma, L.Y. Prediction of potentially suitable areas for the introduction of Magnolia wufengensis under climate change. Ecol. Indic. 2021, 127, 107762. [Google Scholar] [CrossRef]
  69. Ma, Q.Q.; Li, X.Y.; Wu, S.X.; Zeng, F.J. Potential geographical distribution of Stipa purpurea across the Tibetan Plateau in China under climate change in the 21st century. Glob. Ecol. Conserv. 2022, 35, e02064. [Google Scholar] [CrossRef]
  70. Prevéy, J.S.; Parker, L.E.; Harrington, C.A.; Lamb, C.T.; Proctor, M.F. Climate change shifts in habitat suitability and phenology of huckleberry (Vaccinium membranaceum). Agric. Meteorol. 2020, 280, 107803. [Google Scholar] [CrossRef]
  71. Jinga, P.; Ashley, M.V. Climate change threatens some miombo tree species of sub-Saharan Africa. Flora 2019, 257, 151421. [Google Scholar] [CrossRef]
  72. Seale, M.; Nakayama, N. Seale. From passive to informed: Mechanical mechanisms of seed dispersal. New Phytol. 2019, 225, 653–658. [Google Scholar] [CrossRef] [PubMed]
  73. Schurr, F.M.; Bond, W.J.; Midgley, G.F.; Higgins, S.I. A mechanistic model for secondary seed dispersal by wind and its experimental validation. J. Ecol. 2005, 93, 1017–1028. [Google Scholar] [CrossRef]
  74. Holzmann, K.L.; Walls, R.L.; Wiens, J.J. Accelerating local extinction associated with very recent climate change. Ecol. Lett. 2023, 26, 1877–1886. [Google Scholar] [CrossRef] [PubMed]
  75. Corlett, R.T. Plant diversity in a changing world: Status, trends, and conservation needs. Plant Divers. 2016, 38, 10–16. [Google Scholar] [CrossRef] [PubMed]
  76. He, X.; Burgess, K.S.; Gao, L.M.; Li, D.Z. Distributional responses to climate change for alpine species of Cyananthus and Primula endemic to the Himalaya-Hengduan Mountains. Plant Divers. 2019, 41, 26–32. [Google Scholar] [CrossRef] [PubMed]
  77. Teng, J.; Li, H.; Lu, S.F.; Yin, X.J.; Li, G.; Chen, Z.; Wang, Y. Responses of cold-temperature coniferous forest to climate change in southwestern China. J. Northwest For. Univ. 2023, 38, 33–44. [Google Scholar]
  78. Li, R. Protecting rare and endangered species under climate change on the Qinghai Plateau, China. Ecol. Evol. 2019, 9, 427–436. [Google Scholar] [CrossRef] [PubMed]
  79. Wang, Z.; Li, Z.; Meng, S.; Jiang, Q.; Hu, G.; Zhang, L.; Yao, X. Potential distribution under climate change and ecological niche differences between Actinidia chinensis complex. Sci. Hortic. 2024, 337, 113533. [Google Scholar] [CrossRef]
Figure 1. Geographical distribution of C. longepaniculata. The geographical distribution of C. longepaniculata is shown with red dots.
Forests 16 00338 g001
Figure 2. AUC values for model evaluation.
Forests 16 00338 g002
Figure 3. Jackknife test of environmental variables.
Forests 16 00338 g003
Figure 4. Response curves of the most influential variables.
Forests 16 00338 g004
Figure 5. Prediction of current potential distribution area of C. longepaniculata.
Forests 16 00338 g005
Figure 6. Potential geographical distribution of C. longepaniculata under SSP1-2.6 and SSP5-8.5 in 2050s, 2070s, and 2090s.
Forests 16 00338 g006
Figure 7. Areas of varying potential suitable areas for C. longepaniculata.
Forests 16 00338 g007
Figure 8. Spatial changes in C. longepaniculata distribution under SSP1-2.6 and SSP5-8.5 across 2050s, 2070s, and 2090s, compared to the current distribution.
Forests 16 00338 g008
Figure 9. Comparison of suitable areas across future scenarios relative to the current period.
Forests 16 00338 g009
Figure 10. Migratory route of C. longepaniculata under various climate scenarios. The green lines represent the migratory routes under the SSP126 scenario, and the orange lines represent the migratory routes under the SSP585 scenario.
Forests 16 00338 g010
Figure 11. Kernel density analysis of distribution points. Red points represent the actual distribution records.
Forests 16 00338 g011
Table 1. Environmental variables used in the model and contributions to the model.
VariableDescriptionUnitContribution Rate%Permutation Importance
bio12Annual precipitationmm5015.2
bio6Min temperature of coldest month°C12.420
demElevationm11.710.5
bio15Precipitation seasonality/74.5
bio7Variation range of annual average temperature°C5.315.3
bio2Mean diurnal range°C3.69.3
slopeSlope°3.15.5
aspectAspectrad2.82.5
siltSilt content%21.2
bio16Precipitation of the Wettest Monthmm1.315.2
ph_waterHydrogen ion concentration (acidity/alkalinity)pH0.60.8
Table 2. Geometric center of the C. longepaniculata in various periods and migratory distances.
PeriodLongitudeLatitudeMigration DirectionDistance (Km)
Current105.3928.71Current-2050s SSP126289
2050s SSP126106.5831.102050s SSP126-2070s SSP12656
2070s SSP126107.1331.282070s SSP126-2090s SSP126243
2090s SSP126104.9630.13Current-2050s SSP585390
2050s SSP585107.3431.792050s SSP585-2070s SSP585346
2070s SSP585109.8234.112070s SSP585-2090s SSP585410
2090s SSP585105.9532.33
Disclaimer/Publisher’s Note: The statements, opinions and data contained in all publications are solely those of the individual author(s) and contributor(s) and not of MDPI and/or the editor(s). MDPI and/or the editor(s) disclaim responsibility for any injury to people or property resulting from any ideas, methods, instructions or products referred to in the content.

