Article

Temperature-Dependent Soil Organic Carbon Turnover in Taiwan’s Forests Revealed by Stable Carbon Isotope Analysis

1
School of Marine Science and Engineering, Hainan University, Haikou 570100, China
2
School of Ecology, Hainan University, Haikou 570100, China
3
School of Marine Biology and Fisheries, Hainan University, Haikou 570100, China
4
Department of Geography, National Taiwan Normal University, Taipei 106, Taiwan
5
State Key Laboratory of Marine Resource Utilization in South China Sea, Hainan University, Haikou 570100, China
*
Authors to whom correspondence should be addressed.
Forests 2025, 16(2), 342; https://doi.org/10.3390/f16020342
Submission received: 28 December 2024 / Revised: 5 February 2025 / Accepted: 10 February 2025 / Published: 14 February 2025
(This article belongs to the Special Issue Soil Carbon Storage in Forests: Dynamics and Management)

Abstract

:
High-standing islands, such as Taiwan, offer unique opportunities to study soil organic carbon (SOC) dynamics due to their steep terrains, rapid erosion, and strong climatic gradients. In this study, we investigated 54 forest soil profiles across northern, central, and southern Taiwan to assess SOC inventories and turnover using stable carbon isotope (δ13C) analyses. We applied Rayleigh fractionation modeling to vertical δ13C enrichment patterns and derived the parameter β, which serves as a proxy for SOC turnover rates. Our findings reveal that SOC stocks increase notably with elevation, aligning with lower temperatures and reduced decomposition rates at higher altitudes. Conversely, mean annual precipitation (MAP) did not show a straightforward relationship with SOC stocks or β, highlighting the moderating effects of soil drainage, topography, and local hydrological conditions. Intriguingly, higher soil nitrogen levels were associated with a negative correlation to ln(β), underscoring the complex interplay between nutrient availability and SOC decomposition. Overall, temperature emerges as the dominant factor governing SOC turnover, indicating that ongoing and future warming could accelerate SOC losses, especially in cooler, high-elevation zones currently acting as stable carbon reservoirs. These insights underscore the need for models and management practices that account for intricate temperature, moisture, and nutrient controls on SOC stability, as well as the value of stable isotopic tools for evaluating soil carbon dynamics in mountainous environments.

1. Introduction

Soil organic carbon (SOC) is the largest terrestrial carbon reservoir, containing approximately 1500–2400 petagrams of carbon (Pg C)—over three times the amount of carbon in the atmosphere [1,2]. Because of its direct interaction with the atmosphere, this vast carbon pool is highly sensitive to climate change [3,4]. Even minor alterations in SOC stocks can substantially affect atmospheric CO2 concentrations, potentially amplifying climate feedback mechanisms [5,6].
Understanding SOC dynamics, particularly turnover rates and their responses to environmental factors such as temperature and precipitation, is crucial for predicting future atmospheric CO2 levels [3,7]. While some studies indicate that warming accelerates SOC turnover and loss [3,7,8], others suggest that soil moisture and nutrient availability can moderate the temperature sensitivity of SOC turnover [9]. These complexities make it difficult to isolate individual climatic effects in field studies, underscoring the need for natural proxies to accurately assess SOC dynamics [10,11].
High-standing islands, such as Taiwan in the Western Pacific, are notable hotspots for carbon cycling due to rapid tectonic uplift, steep terrain, and high erosion rates [12,13]. Rivers in Taiwan export large quantities of particulate organic carbon (POC) to the oceans, influencing global carbon budgets [14,15,16]. The burial of non-fossil carbon in these regions serves as a carbon sink, effectively sequestering atmospheric CO2 over geological timescales [17,18,19]. Climate change projections indicate more intense rainfall and extreme weather events [20], potentially exacerbating erosion and altering SOC inventories and turnover rates. Consequently, advancing our understanding of SOC dynamics in high-standing islands is essential for refining carbon cycle models and improving climate predictions [17,21].
Investigating belowground SOC processes, however, is inherently challenging due to soil complexity and heterogeneity [22,23]. Stable carbon isotopes (δ13C) have become indispensable tools for studying SOC dynamics [24,25]. In well-drained soils, δ13C values typically become enriched with depth as SOC content decreases, largely reflecting the preferential decomposition of lighter isotopes in surface layers [10,11]. This vertical isotopic enrichment can be modeled by Rayleigh fractionation, wherein the logarithm of the residual SOC fraction correlates linearly with δ13C values [26,27]. The slope of this relationship, denoted as β, serves as a proxy for SOC turnover rates [10,11,26].
In this study, we examined SOC inventory dynamics in 54 natural forest soil profiles across Taiwan, including 32 well-drained profiles, using SOC and stable carbon isotopes. By analyzing carbon content and δ13C composition, we derived β values as proxies for SOC turnover times. We then integrated topographic and environmental parameters—including elevation, temperature, and precipitation—with these β values to elucidate the factors influencing SOC turnover in these high-standing island environments. This study hypothesizes that SOC turnover rates in Taiwan’s forest soils are significantly influenced by temperature and altitudinal gradients. Specifically, we predict that cooler, high-elevation soils will exhibit slower SOC turnover and act as more stable carbon sinks due to reduced microbial activity and lower temperatures. By evaluating SOC turnover across varying altitudes, we aim to refine our understanding of how temperature gradients modulate SOC stability, with broader implications for future carbon cycle predictions under climate change.

2. Materials and Methods

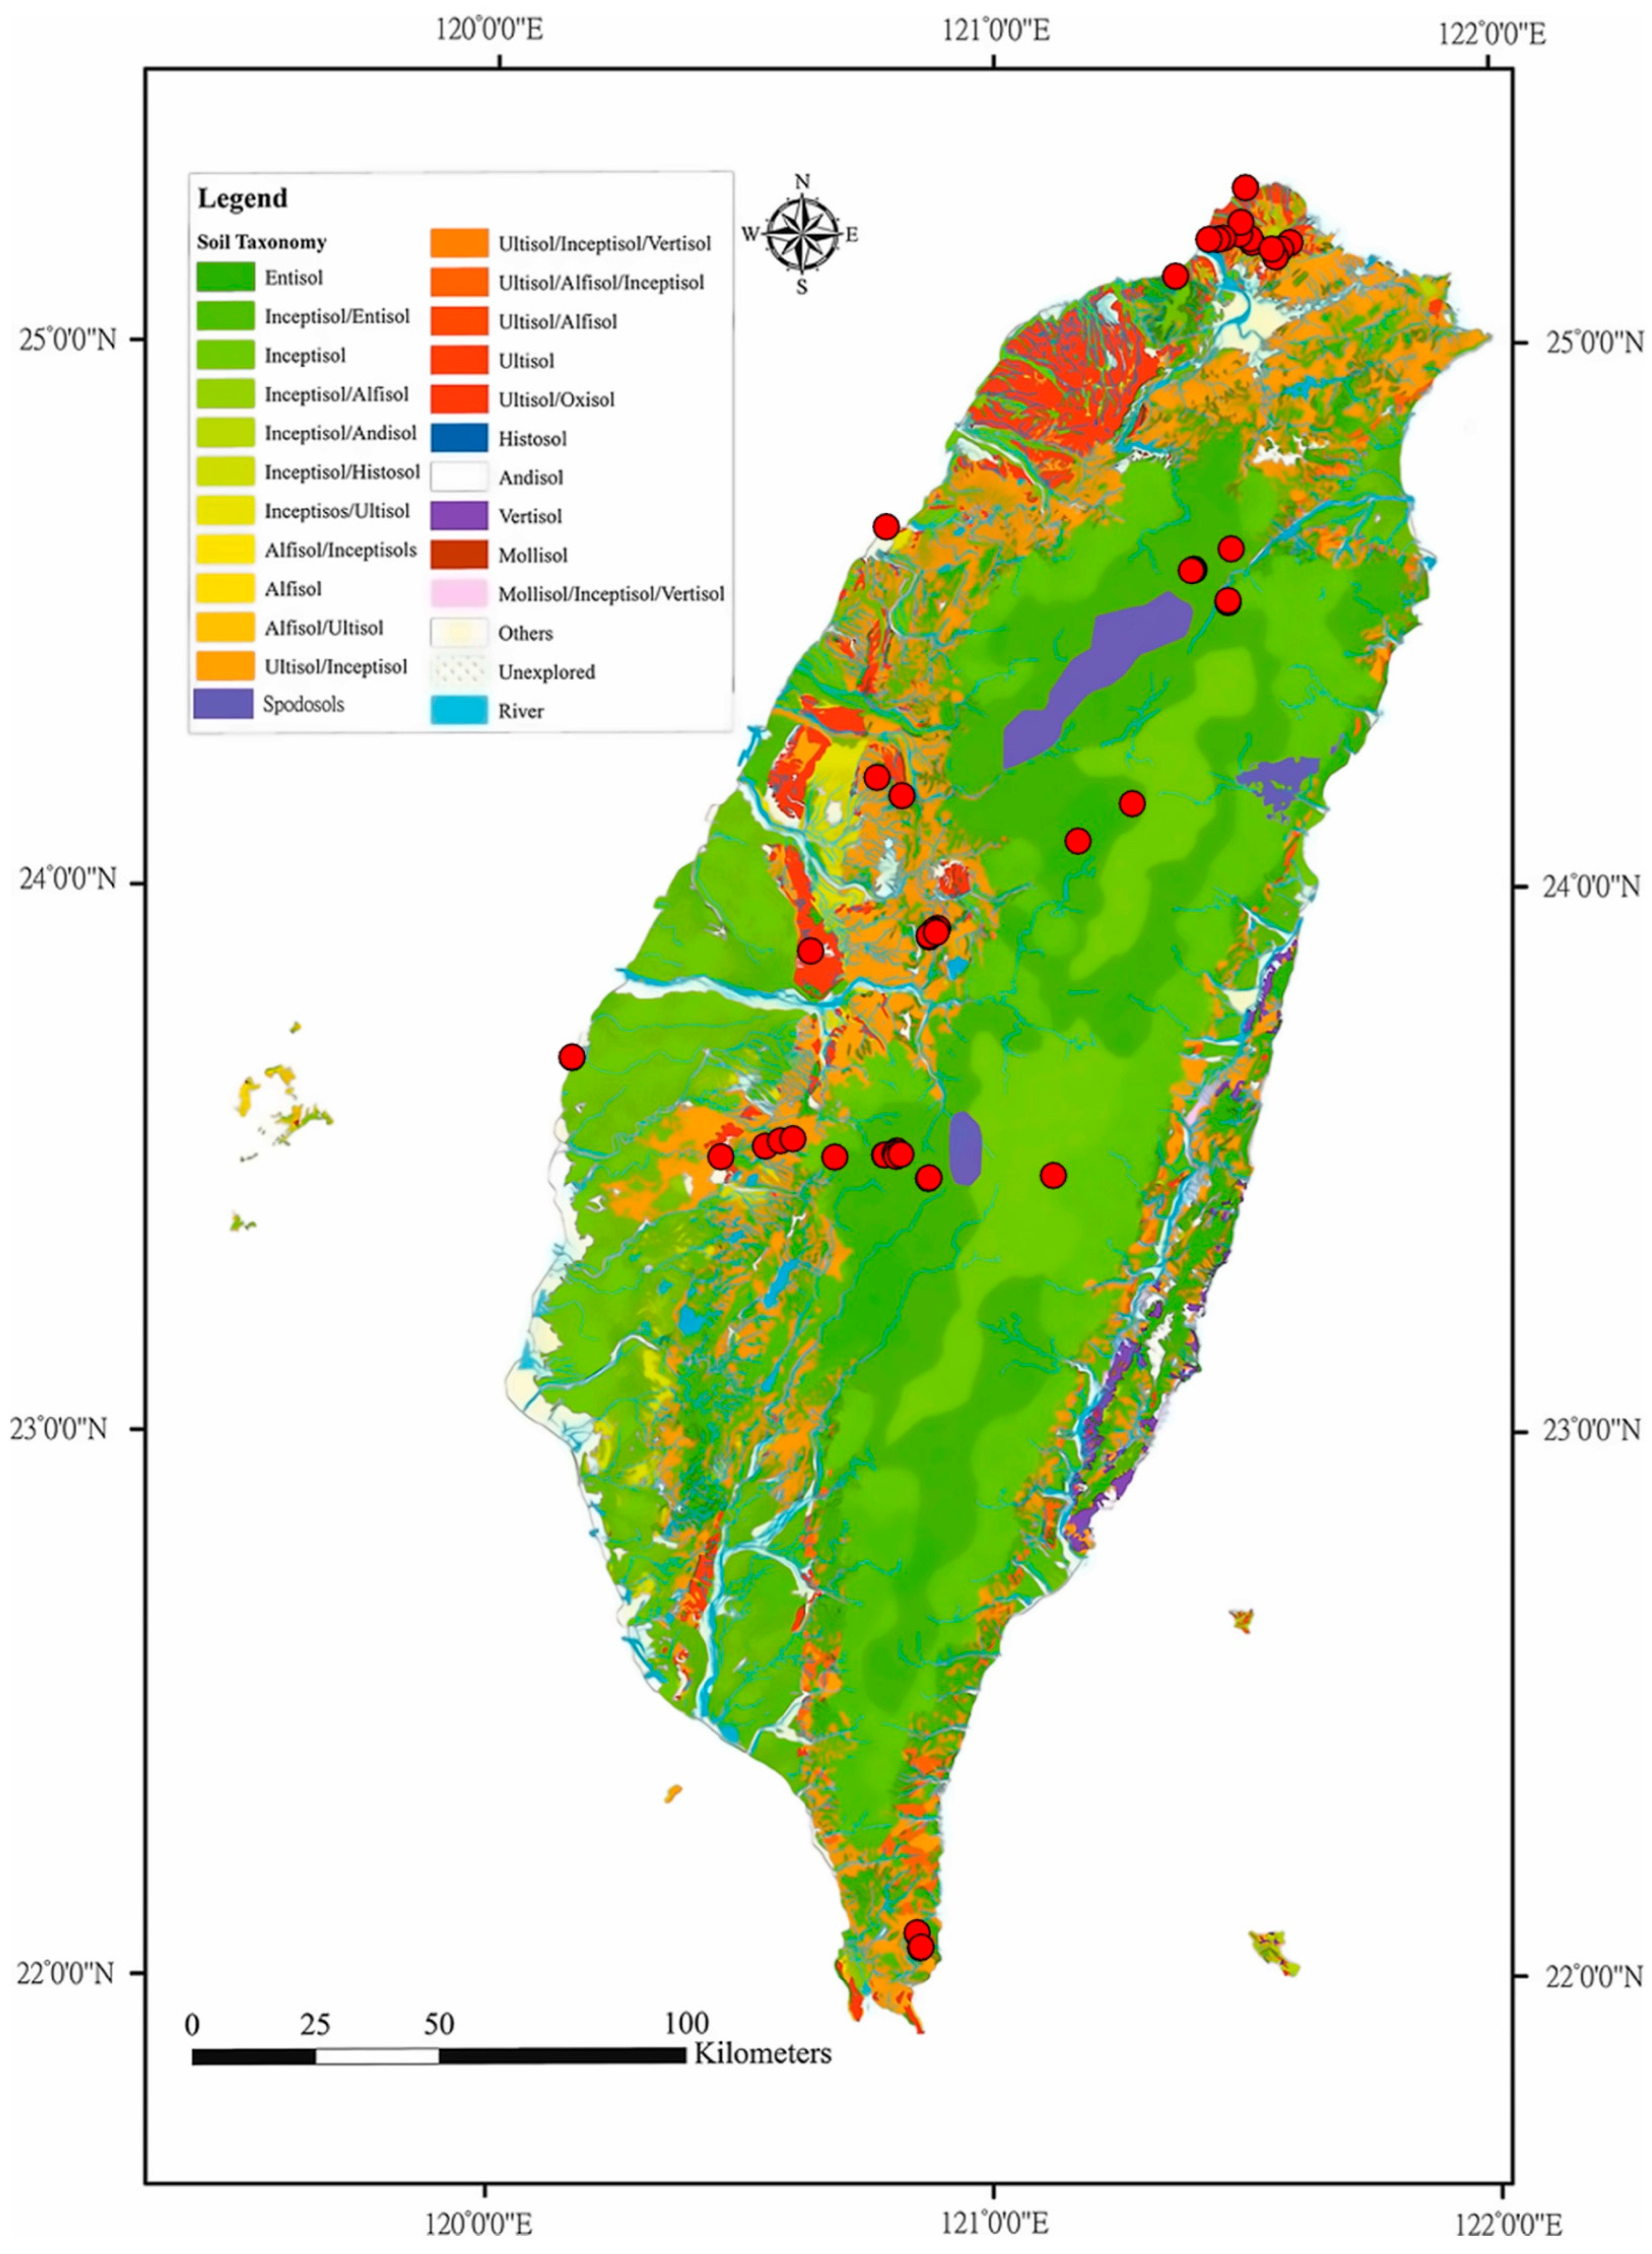
2.1. Study Site Description

Taiwan is an island located off the eastern coast of Asia, in the northwestern Pacific Ocean. The island covers an area of approximately 36,000 square kilometers, with about 25,000 square kilometers consisting of mountains and hills. The topography varies greatly, with elevations ranging from sea level up to 3952 m. Taiwan lies on the Tropic of Cancer, encompassing both tropical and subtropical regions. The area north of the Tropic of Cancer experiences a subtropical monsoon climate, while the south experiences a tropical monsoon climate. Due to its location at the junction of tectonic plates, the terrain and climate are diverse, resulting in a wide variety of soils in Taiwan. The underlying bedrock, consisting primarily of Miocene and Pliocene metasedimentary, low-grade metamorphic, and sedimentary rocks (Ho, 1988) [28], further contributes to this soil diversity, influencing both soil composition and formation processes.
According to soil taxonomy, the main soil orders in Taiwan include Inceptisols (51.0%), Alfisols (21.8%), Ultisols (9.6%), and Entisols (6.8%) [29]. In Taiwan’s forest soils, the major soil orders are Inceptisols (44.2%), Entisols (35.3%), Alfisols (10.8%), and Ultisols (7.5%), with other soil orders occupying less than 1% (Figure 1) [29]. Forest soils are primarily composed of undeveloped or weakly developed Inceptisols and Entisols, largely due to frequent typhoon invasions and active mountain uplift in Taiwan. These factors result in high physical erosion rates and thin soil layers.
Soil samples were collected from 54 profiles across mountain forests in northern, central, and southern Taiwan, including Datunshan, Shendaishan, Lulinshan, Nanrenshan, and Alishan (Figure 1). These soils span several orders—Inceptisols, Entisols, Alfisols, Ultisols, and Andisols—representing varied depths and textures. The sampling sites feature diverse vegetation types, such as bamboo needle forests, broadleaf mixed forests, coniferous forests, and grasslands, contributing to the variability in organic matter inputs and microbial communities, which may influence SOC dynamics. Soil and vegetation details are provided in the Supplementary Materials. For model fitting, 32 well-drained profiles were selected, while others that did not meet the criteria are included in the Supplementary Materials for transparency.
Soil sampling and analysis were performed following the Soil Survey Laboratory Methods Manual (Soil Survey Staff, 2006) [30]. Representative bulk soil samples were collected from the pedogenic horizons of each pedon, ranging from 0 to 150 cm in depth, with sampling intervals between 5 and 30 cm. The sampling depths were selected to capture the vertical distribution of SOC% and carbon isotopes (δ13C), considering the relevant pedogenic horizons within each profile. These horizons were distinct, and significant differences in organic matter accumulation and transformation occurred between horizons at the same depth. Therefore, while we present the data by depth, the primary focus was on illustrating the general trends of SOC% and δ13C values across depths, rather than making direct comparisons between soil horizons at the same depth. Detailed information on the specific sampling depths and the associated horizons is available in the Supplementary Materials. After collection, the soil samples were air-dried, gently ground, and passed through a 2 mm sieve. The sieved samples were homogenized to ensure uniformity and then used for SOC and isotopic analyses.
ESRI ArcGIS 10.2 was used as the spatial data processing platform. To ensure data consistency, all environmental factor data were uniformly converted into a grid format. Temperature and rainfall data were obtained from 306 meteorological stations operated by the Central Weather Bureau (CWB) of Taiwan, covering the period from 2000 to 2010. To calculate the mean annual precipitation (MAP) and mean annual temperature (MAT) for each sampling site, we used the Kriging interpolation method to interpolate daily rainfall data into a grid with a resolution of 1 km. From these interpolated data, we then calculated the MAP and MAT for each grid cell. The elevations of the sampling sites range from sea level up to 3000 m, the mean annual temperatures range from 6 °C to 24 °C, and the average annual rainfall varies from 1200 mm to 3700 mm. This sampling strategy facilitates a comprehensive analysis of the effects of rainfall and temperature on carbon turnover.

2.2. Total Organic Carbon, Total Nitrogen, and Stable Isotope Composition

Approximately 0.5 g of frozen and air-dried soil sample was thoroughly ground for SOC and stable carbon isotope composition analysis. The ground sample was acidified with 1 N HCl to remove calcium carbonate. After a 2 h reaction period, the sample was centrifuged, the supernatant discarded, and the sample dried. A portion of the dried sample (40–60 mg) was then encapsulated in a tin cup and analyzed using a Carlo-Erba EA 2100 Elemental Analyzer coupled to a Thermo Finnigan Deltaplus Advantage Isotope Ratio Mass Spectrometer (EA-IRMS) system (Thermo Fisher Scientific, Bremen, Germany). The combustion temperature was set to 960 °C, and helium (100 mL He/min) was used as the carrier gas. The oxidation catalyst used was chromium (PbCrO4). The relative accuracy of the carbon content measurements was better than 3%. Bulk nitrogen content (N%) was determined by directly analyzing the ground soil sample without acid treatment using the EA-IRMS. We used the USGS 40 standard and a laboratory working standard (Acetanilide, Merck, Darmstadt, Germany) with δ13C values of −26.24‰ and −29.76‰, respectively, to monitor instrument performance and potential isotope shifts during measurement. The reproducibility of carbon isotope measurements was better than 0.2‰ and only a single measurement was performed for each sample. The carbon isotopic compositions are expressed in standard δ notation relative to the Pee Dee Belemnite (PDB) standard.

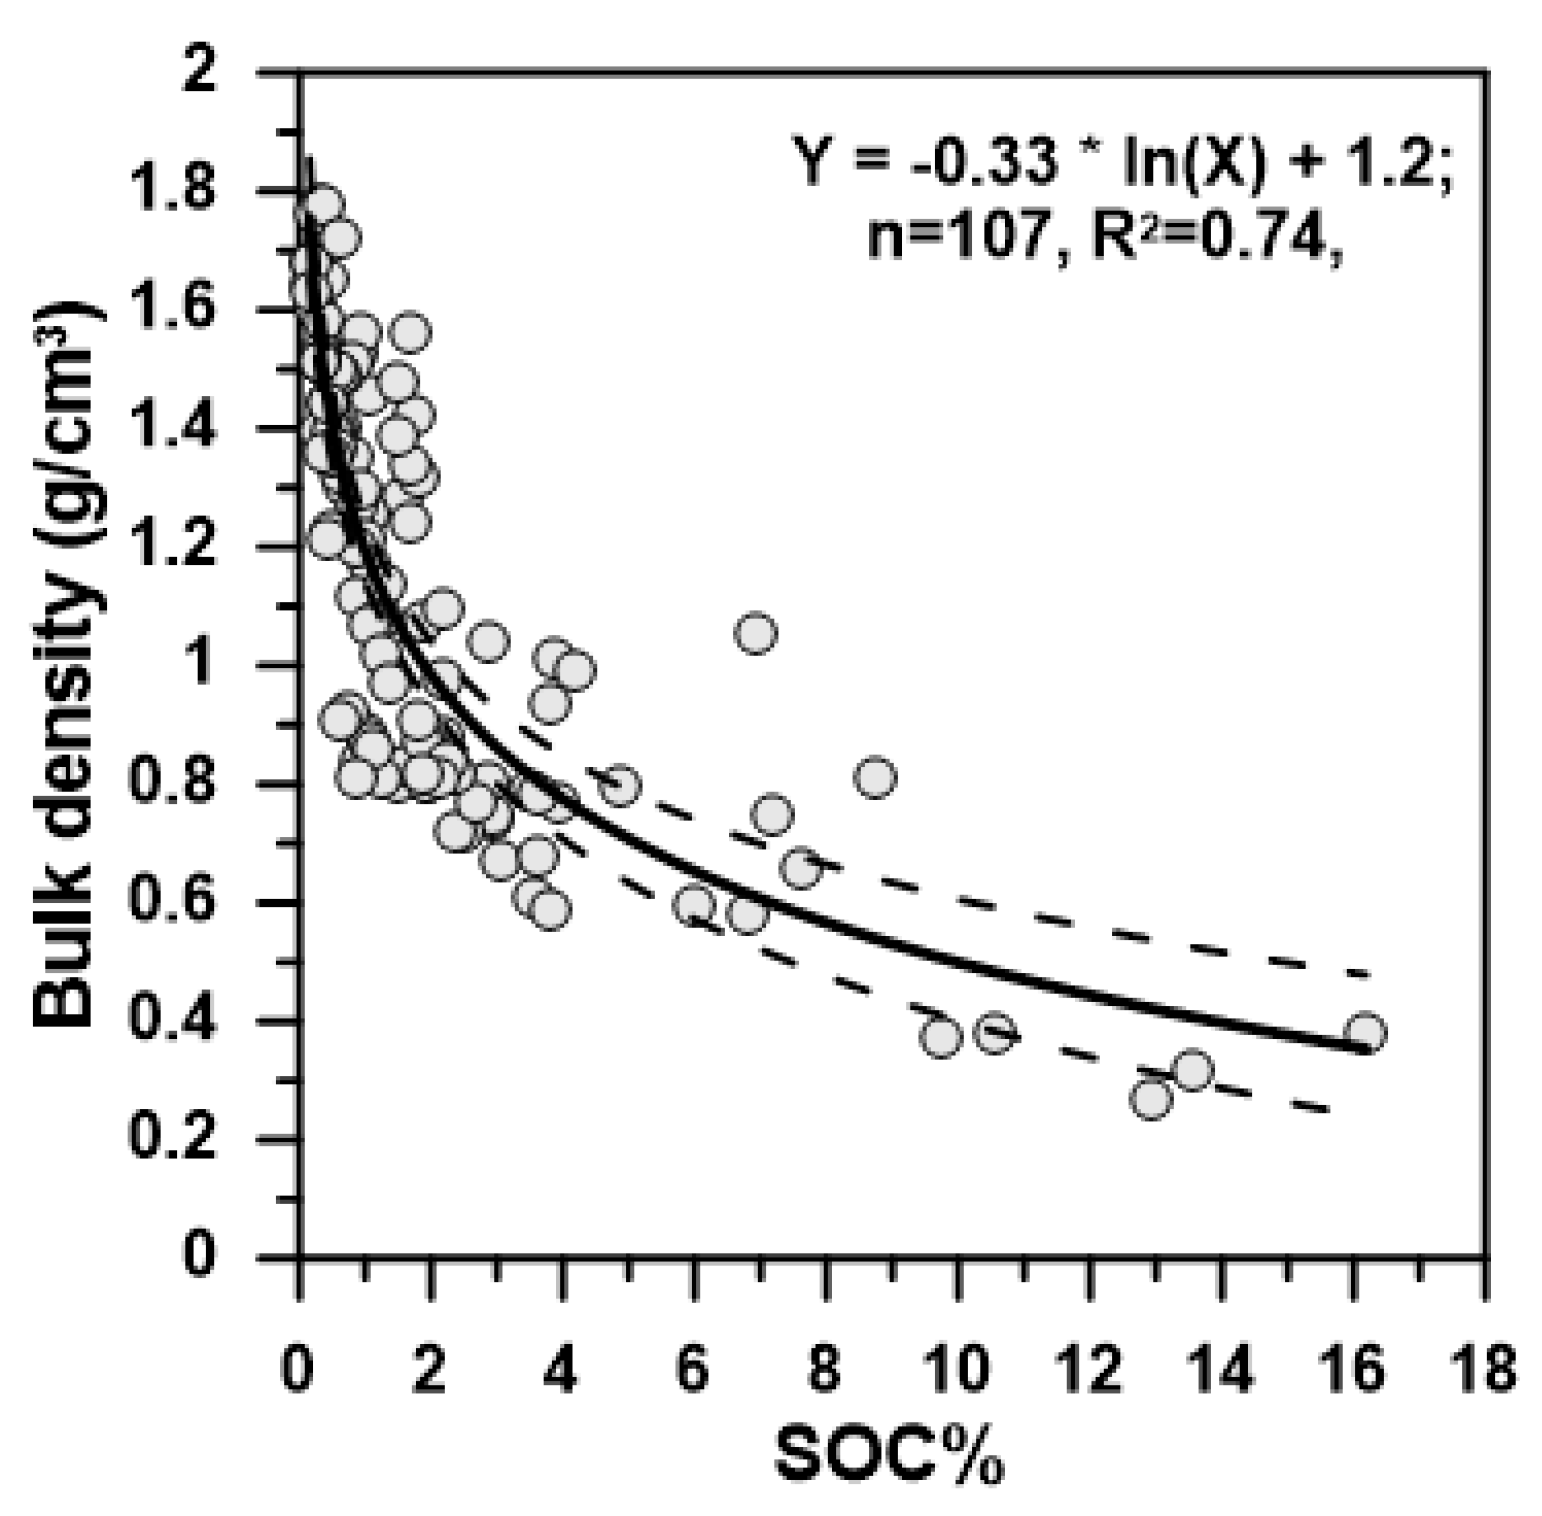
2.3. Bulk Density and SOC Inventory

Bulk density (BD) was measured following the method described by Blake and Hartage (1986) [31]. Specifically, a metal cylinder with a volume of 100 mL was weighed, then driven into the soil, and subsequently removed along with the soil sample. In the laboratory, the soil was dried at 105 °C for 24 h, and its dry weight was measured. Bulk density was calculated as: Bulk density (BD, g/cm3) = dry soil mass (g)/metal tube volume (cm3).
We measured BD in 107 soil samples, obtaining values ranging from 0.2 to 1.8 g/cm3. However, because approximately half of the 54 soil profiles lacked complete BD data—a common limitation in large-scale soil carbon assessments [32]—we incorporated an established pedotransfer function approach. Following previous studies [33,34], we used SOC% as a predictor for BD. Our regression analysis revealed a strong relationship (R2 = 0.74, p < 0.0001, Figure 2), indicating that SOC% can reliably estimate BD across diverse soil textures ranging from 2% to 98% clay content. This robust correlation enhances our capacity to fill data gaps and reduces uncertainty in subsequent SOC stock calculations.
The SOC stock was then calculated using the following equation:
SOC stock = Σ (BDd × SOCd% × thickness),
where BDd is the bulk density (g/cm3), SOCd% is the SOC content by weight, and thickness is the depth interval (cm) for each sampled soil layer. By integrating both measured and SOC-derived BD values, this approach provides a more comprehensive and accurate estimate of SOC stocks, particularly in challenging, data-limited contexts.

3. Results and Discussion

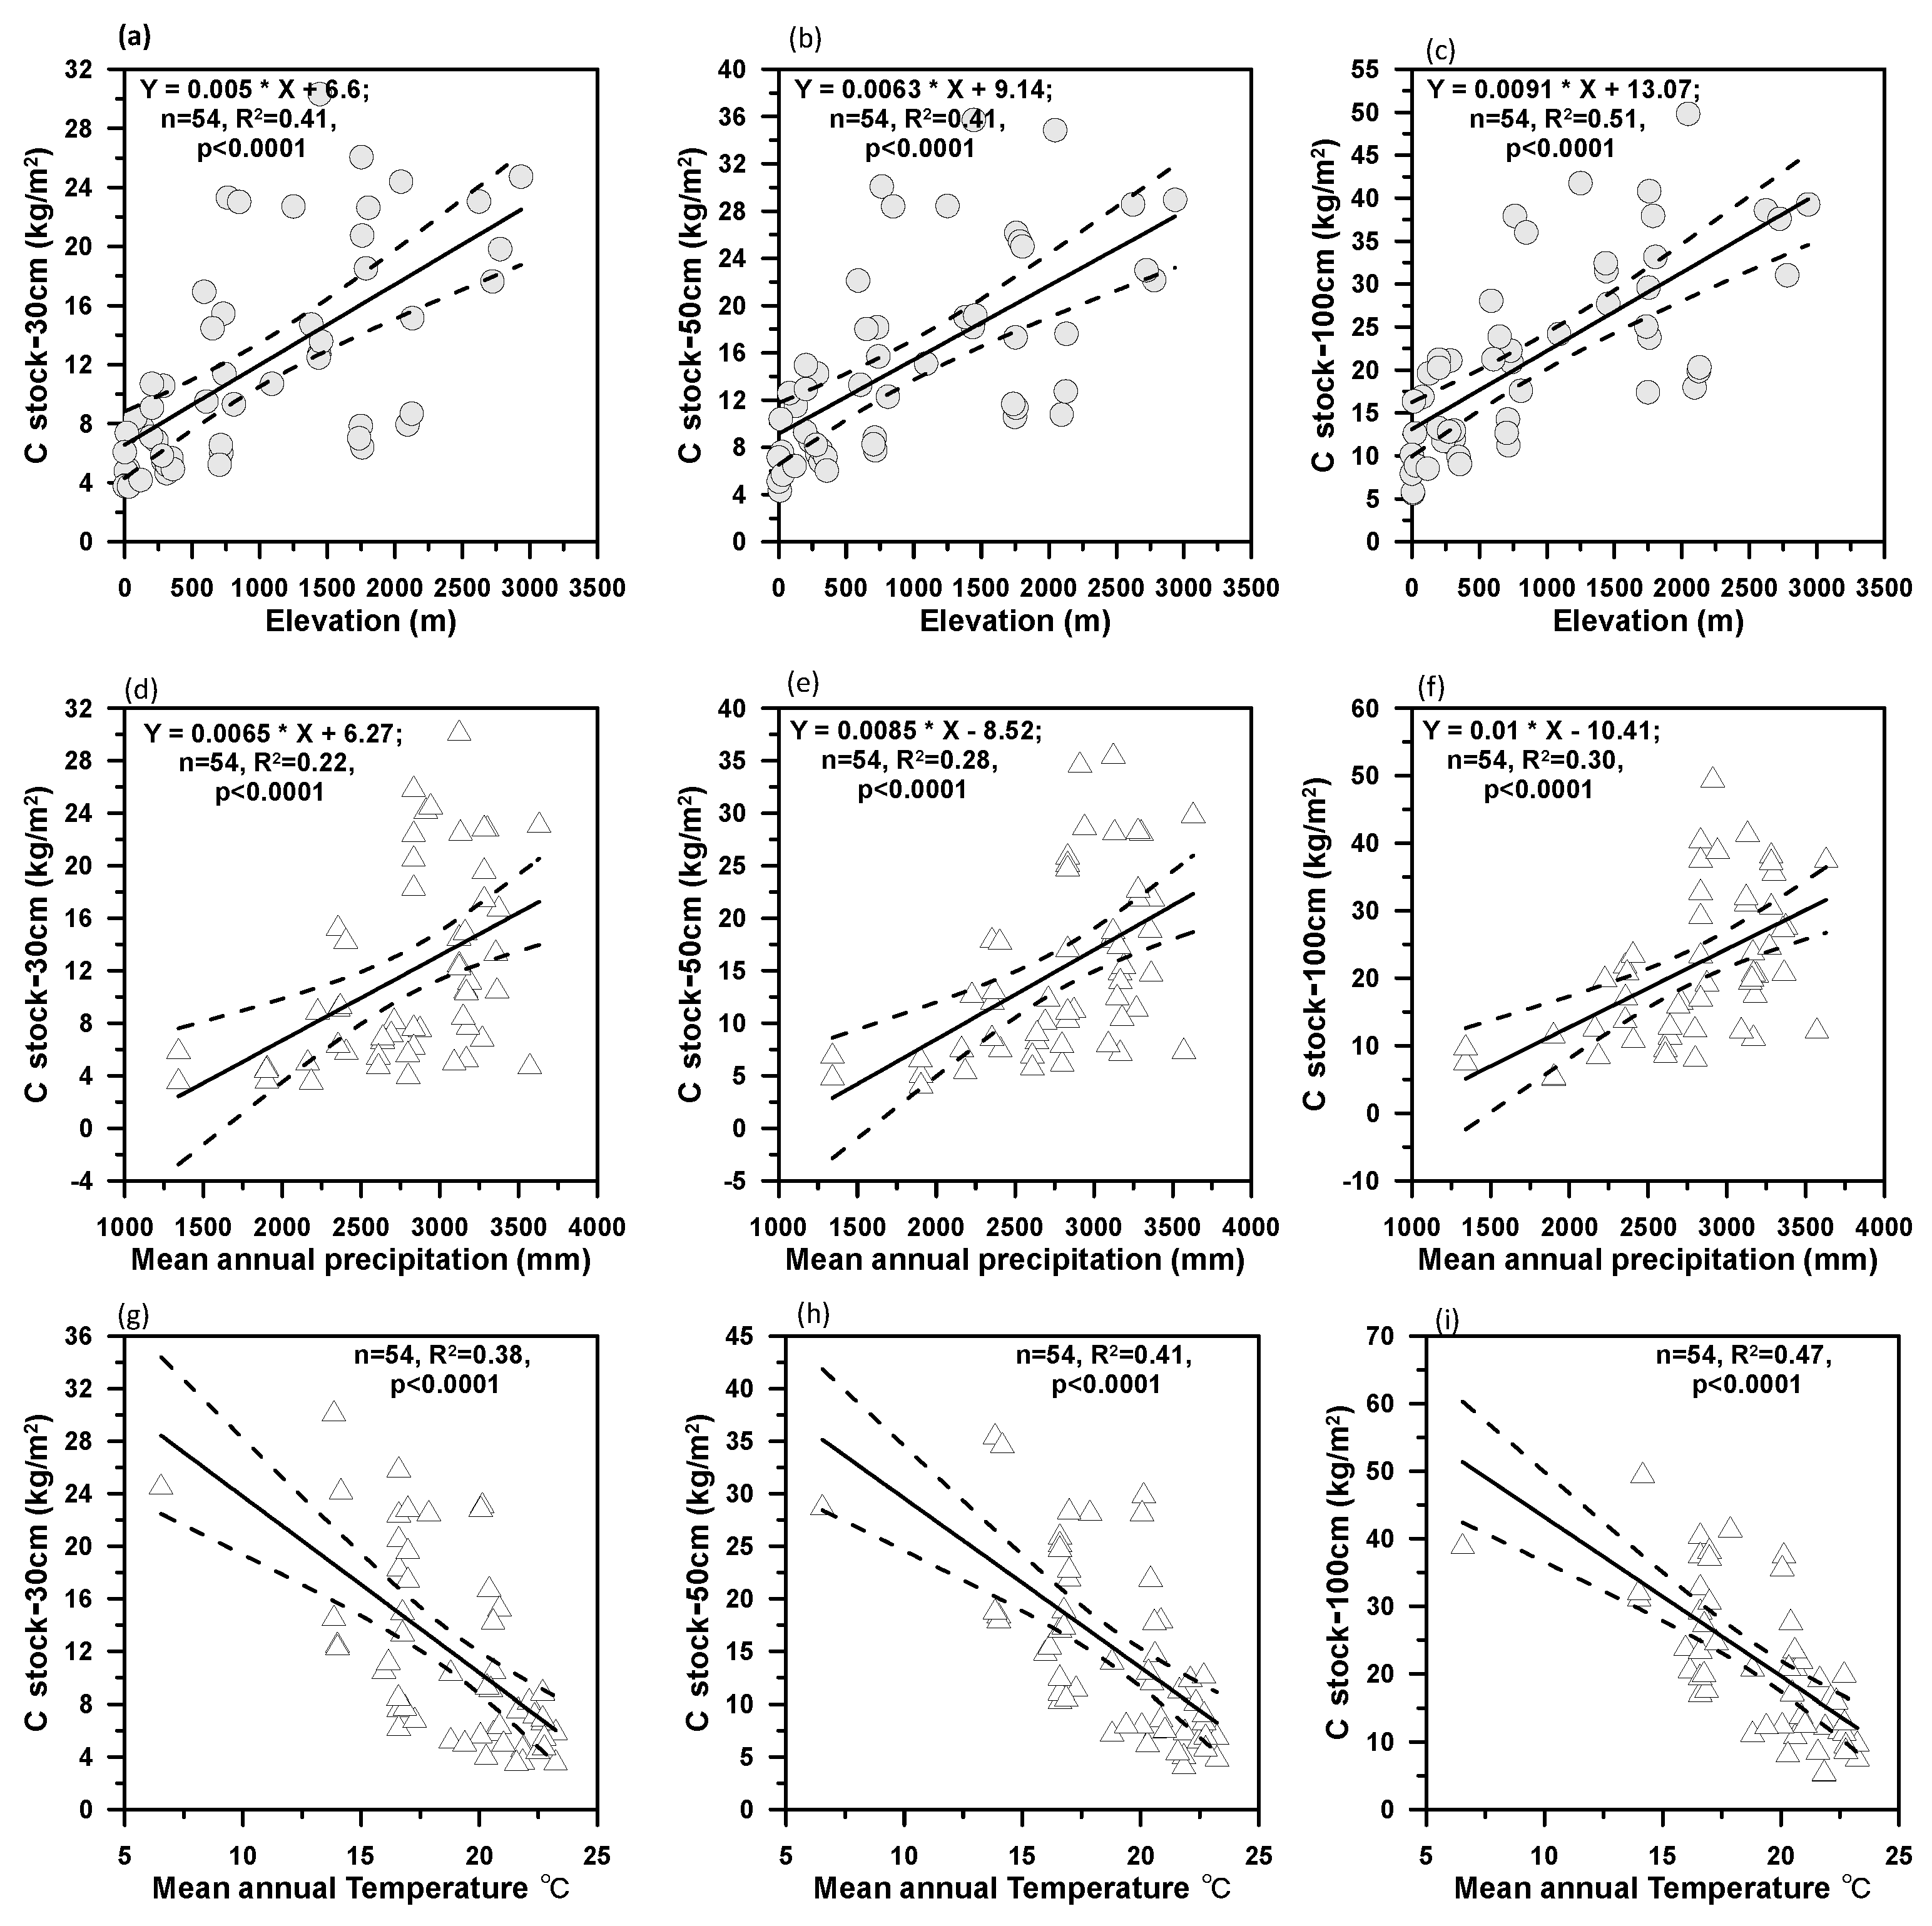
3.1. Elevational Gradient of Soil Organic Carbon Stocks

The SOC stocks across the study area in Taiwan exhibited a significant positive correlation with elevation (Figure 3a–c, p < 0.0001), although notable variation was observed, with R2 values ranging from 0.41 to 0.51. Specifically, SOC stocks ranged from 4 to 28 kg/m2 in the 0–30 cm layer, 4 to 36 kg/m2 in the 0–50 cm layer, and 5 to 50 kg/m2 in the 0–100 cm layer along an elevation gradient from sea level to approximately 3000 m. This pattern aligns with global observations in mountainous regions, where a combination of lower temperatures, higher soil moisture, and often reduced oxygen availability slow organic matter decomposition and enhance SOC accumulation [35,36]. At higher elevations, the reduced microbial and enzymatic activity decreases the turnover of organic matter, allowing SOC to persist for longer periods [37].
Interestingly, this trend persisted despite a decline in litterfall inputs at higher elevations [38], indicating that decomposition rates, rather than primary production, are the primary controls on SOC storage at these sites. The inverse relationship between SOC stocks and MAT further supports temperature’s dominant role in governing SOC stability (Figure 3g–i, p < 0.0001). While the linear regression models show R2 values less than 0.5, indicating that the model does not explain all of the variability in the data, we still find value in the observed trends. The lower R2 values likely reflect the inherent variability in SOC stocks and their interaction with temperature, which is influenced by various factors, including soil type, moisture, and microclimatic conditions. Despite these challenges, the general trend of increasing SOC depletion with higher temperatures is still evident, which we believe is meaningful in understanding the broader ecological dynamics of SOC turnover in Taiwan’s diverse forest ecosystems.
Meanwhile, MAP exhibited a more complex relationship, likely due to its indirect influences on soil water balance, redox conditions, and nutrient availability [11]. Thus, while MAP can modulate SOC through moisture-dependent microbial activity, soil texture, and drainage conditions, it does not exhibit a straightforward, linear correlation with SOC stocks.
Overall, these findings underscore that elevation—acting as a proxy for climatic and edaphic gradients—is a key determinant of SOC distribution. This sets the stage for examining how SOC quality and turnover dynamics, inferred from stable isotopic proxies, vary along similar gradients [10,11].

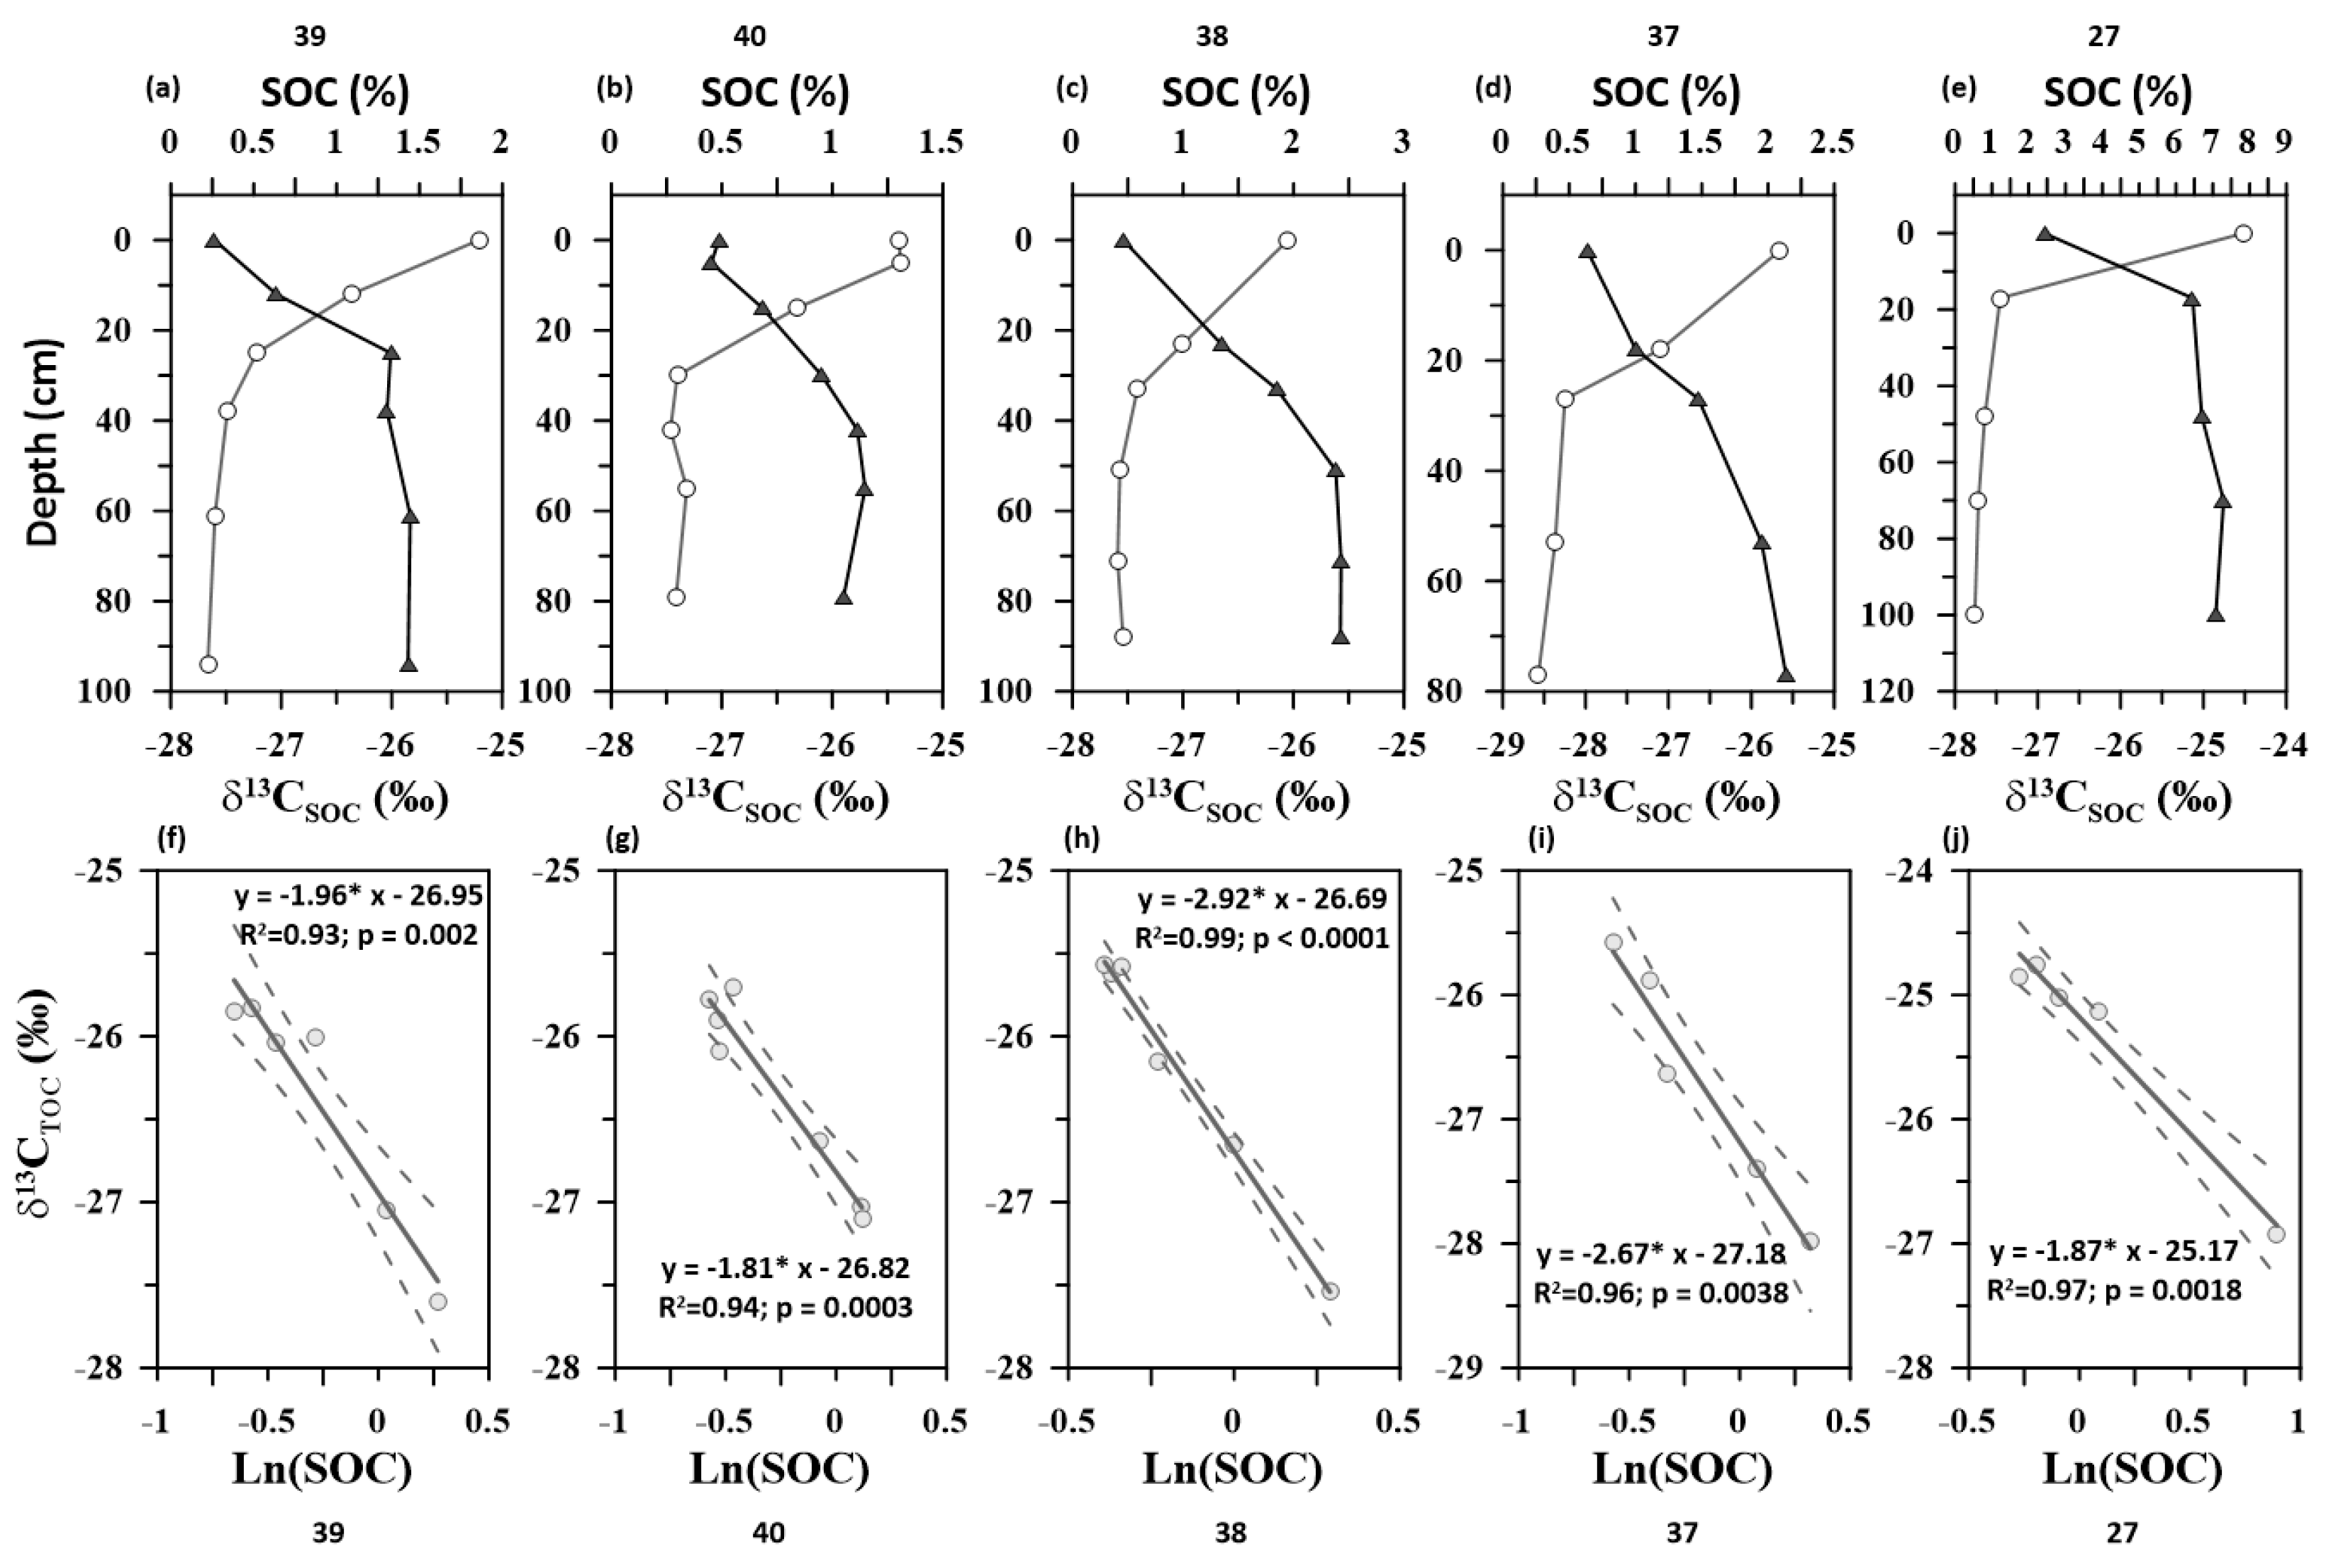
3.2. Soil Organic Carbon Turnover Rates Using β Proxy

Stable carbon isotopes provide valuable insights into SOC turnover dynamics, offering more detailed information than bulk SOC measurements alone. In well-drained forest soil profiles, a consistent vertical pattern emerged: SOC concentrations declined with depth, while δ13C values became increasingly enriched (Figure 4a–e). This pattern reflects the preferential decomposition of lighter isotopes during microbial processing, leaving behind relatively 13C-enriched carbon pools at depth [26,27]. While historical shifts in atmospheric δ13C-CO2 can influence surface soil δ13C [39], the pronounced vertical enrichment observed (2–7‰) points to ongoing microbial fractionation and the progressive enrichment of residual SOC pools. Multiple mechanisms, including inputs from root-derived carbon (often δ13C-enriched relative to leaf litter), bioturbation, and the downward transport of dissolved organic carbon, help shape these isotopic gradients [40]. Nevertheless, the vertical isotopic enrichment reflects the soil carbon turnover [10].
The Rayleigh fractionation model, which relates ln (SOC) to δ13C (Figure 4f–j, Table 1), provided robust β values that serve as proxies for SOC turnover rates [10,11]. Table 1 presents the β values, along with key environmental parameters such as elevation, MAP, and MAT. These β values, vary across the study sites and are shown in relation to other environmental gradients. The R2 values in Table 1 indicate the goodness of fit for the Rayleigh fractionation model, with high R2 values suggesting strong linear relationships between SOC content and δ13C enrichment in the soil profile. The p-values highlight the statistical significance of these relationships, with most profiles showing p-values below 0.05, indicating significant SOC turnover dynamics.
For example, profiles such as KP4 and KP5 (elevation ~200 m, MAP ~3300 mm, MAT ~20 °C) have relatively high β values (1.8 and 2.3, respectively) and exhibit strong linear correlations (R2 > 0.95), reflecting faster turnover rates and more consistent isotopic fractionation. In contrast, profiles at higher elevations, such as sites 22 and 38 (elevation ~2000 m, MAP ~1341 mm, MAT ~23 °C), show lower β values (ranging from 0.7 to 2.7) and moderate R2 values, suggesting that environmental conditions, including precipitation and temperature, strongly influence SOC turnover. These patterns are shown in more detail in Figure 5, where the relationship between environmental gradients and β values is visualized.
Interestingly, sites 4, 5, 6, and 8 exhibit similar environmental conditions (including MAP, MAT, and elevation), yet their β values differ slightly (0.1, 0.1, 0.9, 0.9). This discrepancy may be due to local factors such as soil texture, nutrient availability, and microbial community composition, which can influence SOC turnover rates and are not fully explained by MAT or MAP alone. Small differences in β values can occur even under similar climatic conditions due to inherent variability in soil processes. Additionally, microclimatic variations or soil heterogeneity at a finer scale may contribute to the observed differences in β values.
High linear correlations (R2 > 0.90) across profiles, as shown in Table 1, validate the use of β as a reliable proxy for SOC turnover. A previous study emphasized that β values reflect a combination of isotopic fractionation and physical mixing processes [10]. These processes integrate the impacts of microbial decomposition, which preferentially use lighter carbon isotopes, and physical transport mechanisms that mix decomposed, 13C-enriched residues deeper into the profile. The findings of the study highlight that β is influenced by environmental conditions such as temperature, precipitation, and soil texture, underscoring its potential as a mechanistic indicator of SOC turnover.
Further supporting the use of β as a turnover proxy, recent global studies have shown that β values derived from carbon isotope fractionation correlate significantly with actual soil carbon decomposition rates. Wang et al. (2018), for instance, found that ln(β) values were positively related to site-based estimates of the soil carbon decomposition constant (ln(k)) with an R2 of 0.34, reinforcing β’s role as a reliable turnover indicator. Their global dataset revealed ln(β) values ranging from −0.50 to 2.20, with the highest mean values in tropical forests, followed by deserts, temperate forests, and temperate grasslands [11].
By linking β with environmental gradients, we gain a mechanistic understanding of how temperature, moisture, and nutrient availability orchestrate SOC turnover in these dynamic landscapes. Incorporating the isotopic mass-balance modeling insights from Acton et al. [10], which account for multiple SOC pools and their decomposition dynamics, reinforces the interpretation of δ13C data as a robust tool for understanding vertical SOC cycling. This approach further highlights the critical role of decomposition and mixing processes in shaping isotopic gradients, ultimately enriching our understanding of soil carbon dynamics in forest ecosystems.

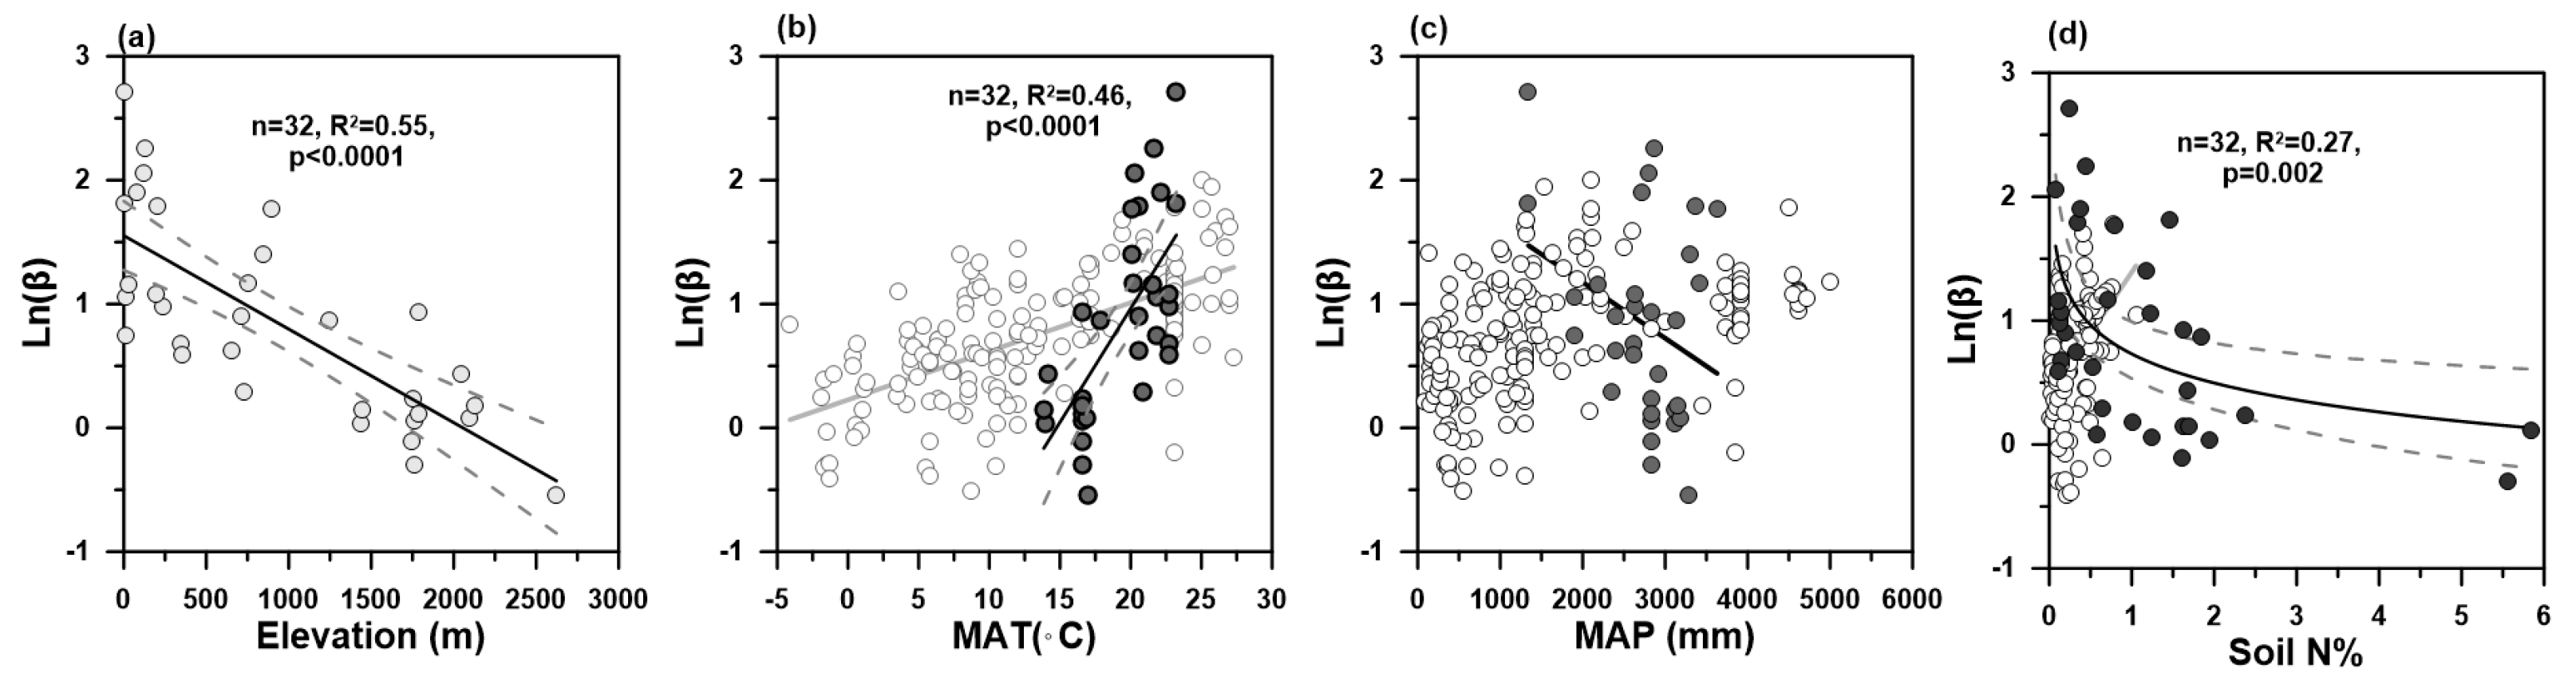
3.3. Climate and Nutrient Dependences of β

Our results indicate that cooler, high-elevation soils exhibit longer SOC turnover times, acting as more stable carbon sinks. This negative correlation between ln(β) and elevation (Figure 5a) aligns with established global patterns, where rising temperatures generally accelerate SOC decomposition and loss [8,10,11]. Cooler conditions slow microbial metabolism, thereby prolonging the residence time of carbon in the soil. In a global context, Wang et al. [11] reported that mean annual temperature (MAT) alone explains approximately 43% of the variation in ln(β), corroborating earlier findings by Acton et al. [10]. Our study in Taiwanese forest soils not only confirms this temperature-driven control but also reveals a steeper slope for the ln(β)–MAT relationship (Figure 5b) compared to the global dataset [11]. This enhanced sensitivity suggests that even modest temperature increases could substantially accelerate SOC turnover in our study region, potentially amplifying soil carbon losses under future warming scenarios. It also highlights the significance of local factors—such as topography, soil properties, and vegetation types—in modulating SOC responses to climate change.
Precipitation dynamics, however, exhibit a more complex relationship with SOC turnover. Wang et al. [11] identified a significant but nonlinear relationship between β and MAP, with an inflection point around MAP ~3000 mm. Beyond this threshold, SOC turnover rates begin to decrease due to the negative effects of excess moisture on SOC decomposition under very wet conditions [41,42]. A cross-system compilation of litter decay rates similarly showed reduced decomposition rates where MAP exceeds 3000 mm [41]. Additionally, Schuur [42] demonstrated in Hawaiian forests (2020 mm < MAP < 5050 mm) that leaf and root decomposition rates—and, consequently, nutrient mineralization and net primary production—decline at the wettest sites. Collectively, these findings indicate that high precipitation can create predominantly anaerobic soil conditions, thereby slowing SOC decomposition processes.
In contrast, our study found no significant relationship between MAP and ln(β) (Figure 5c), despite covering sites with a MAP generally exceeding 2000 mm. This discrepancy may arise because local precipitation levels have already surpassed the threshold necessary to sustain microbial activity; thus, further increases in precipitation do not substantially affect SOC turnover. Additionally, the topography and drainage characteristics of Taiwanese forest soils may mitigate the influence of rainfall on soil moisture and redox dynamics, thereby dampening the broader global pattern. For sites where 2000 mm < MAP < 3000 mm, precipitation levels are likely sufficient to support microbial processes, resulting in minimal observable changes in turnover rates. These locally constrained hydrological conditions highlight that while precipitation influences SOC cycling on a global scale—particularly under very high rainfall—it can have a more nuanced local expression. This reflects the complex interactions among precipitation, drainage, soil properties, and topographic context.
Nutrient availability, particularly nitrogen (N), plays a crucial role in shaping SOC dynamics. Previous global studies [11,43,44] have indicated that higher soil N concentrations generally accelerate SOC decomposition. For instance, Wang et al. [11] demonstrated that SOC turnover rates increase with soil N concentrations across various ecosystem sites. Additionally, positive correlations between litter decomposition rates and litter N contents during the early stages of decay have been reported [43]. High N availability has also been shown to enhance soil-degrading enzyme activities, further promoting SOC decomposition [44].
However, our findings introduce complexity to this narrative. While global studies suggest that higher soil N concentrations generally accelerate SOC decomposition, our analysis revealed a statistically significant (p = 0.002) negative correlation between ln(β) and soil N% (Figure 5d). Although the coefficient of determination (R2) is moderate (0.27) and declines further (to 0.18) after excluding two outlier points (N% of 5–6), the correlation remains significant. This paradox may be explained by the dual role of N addition: although it accelerates SOC decomposition, it simultaneously stimulates SOC production, leading to net SOC accumulation. Specifically, Li et al. [45] demonstrated that nitrogen fertilization decreases the decomposition of SOC and plant residues in planted soils. Their pot experiment with wheat (Triticum aestivum L.) showed that urea fertilization reduced the decomposition rates of SOC and maize residues, resulting in higher remaining N and C in the light fraction compared to soils without urea. This indicates that while N addition can enhance SOC decomposition through increased microbial activity under certain conditions, it can also promote SOC accumulation by decreasing SOC decomposition and increasing the efficiency of carbon sequestration.
Further elucidating the mechanisms behind N’s dual effects, Zang et al. [46] investigated the impact of nitrogen fertilization on rhizodeposit incorporation into microbial biomass and SOC losses. Their study found that N fertilization decreased CO2 efflux by 27–42%, primarily due to the retardation of SOC (C3) mineralization. Additionally, N fertilization increased the relative contribution of rhizodeposited carbon (rhizo-C) to microbial biomass by two to five times and to CO2 emissions by about two times. This enhanced incorporation of rhizo-C reflects accelerated microbial biomass turnover under N addition. Despite the accelerated turnover of rhizo-C, increased N fertilization facilitates carbon sequestration by decreasing SOC decomposition. These findings align with our observation of a negative correlation between ln(β) and soil N%, suggesting that N fertilization can simultaneously promote SOC accumulation and modify microbial processing of carbon inputs.
In soils with adequate N availability, the stimulating effect on SOC production may surpass the accelerating effect on SOC decomposition, leading to an overall increase in SOC stocks. This is consistent with both Li et al. [45] and Zang et al. [46], who found that N fertilization enhances carbon sequestration in the soil by decreasing SOM decomposition and increasing the incorporation of recent carbon inputs. These results underscore the importance of local-scale factors, such as plant presence, specific soil conditions, and the nature of carbon inputs, in determining whether nutrients facilitate or inhibit SOC turnover. Consequently, the assumption of a universally positive relationship between N availability and SOC decomposition is challenged, highlighting the need for context-specific assessments in understanding SOC dynamics.
Overall, our results—when combined with the global assessments of Wang et al. [11]—reinforce the dominant role of temperature in controlling SOC turnover rates, while also revealing that precipitation and nutrient availability introduce substantial complexity and context-dependence. Recognizing these multifactorial influences is essential for improving SOC modeling and predictions within Earth system models. The β parameter, as an isotopic proxy for SOC turnover, provides a valuable tool to “ground-truth” model simulations and refines our understanding of how SOC responds to environmental gradients [10,11]. By incorporating temperature, precipitation, nutrient status, and site-specific factors into predictive frameworks, future studies will be better positioned to anticipate SOC-climate feedback and inform land management strategies under a changing climate.

3.4. Implications for Climate Change

The sensitivity of SOC turnover to temperature has substantial implications for predicting soil-climate feedbacks under future climate scenarios. As global temperatures rise, areas currently serving as stable carbon reservoirs—particularly at higher elevations—may begin to lose SOC more rapidly, thus releasing CO2 back into the atmosphere and reinforcing climate warming [3]. Changes in precipitation patterns, including more frequent heavy rainfall events, could further alter soil moisture regimes, influence erosion rates, and disrupt existing SOC pools [15,20].
Our investigation contributes to the understanding of SOC stability under changing climatic conditions by demonstrating that temperature plays a dominant role in controlling SOC turnover across Taiwan’s diverse forest ecosystems. The findings indicate that high-elevation forests are more likely to store carbon over longer periods, providing valuable insights into how regional temperature changes could affect carbon storage in the future. Additionally, the use of the β proxy allows us to link SOC turnover to environmental gradients such as temperature, precipitation, and soil properties, offering a more nuanced understanding of SOC dynamics that can enhance predictions of future carbon cycle feedbacks under climate change.
Incorporating these nuanced dynamics into earth system and climate models will improve the accuracy of SOC turnover predictions. The β parameter provides a valuable tool for translating isotopic data into turnover times that reflect the underlying processes controlling SOC stability. By integrating β with spatially explicit data on topography, climate, and nutrient availability, future modeling efforts can refine our understanding of SOC feedbacks to climate change [3,47]. Moreover, recognition of the role of nutrient dynamics in SOC stabilization suggests that land management strategies—such as afforestation or selective fertilization—could modify soil nutrient regimes and thus influence SOC persistence or loss in a warming world.

4. Conclusions

In conclusion, our study elucidates the critical role of temperature in governing SOC turnover within Taiwan’s forest soils, with cooler, high-elevation regions demonstrating slower decomposition rates and enhanced carbon sequestration. These findings contribute to the broader understanding of SOC dynamics, emphasizing the interplay between temperature, precipitation, and soil properties in shaping carbon cycling processes.
The application of stable carbon isotopes (δ13C) and the β proxy has proven effective in linking spatial patterns of SOC stocks to underlying turnover mechanisms, offering a robust framework for assessing carbon storage potential across diverse environments. As climate change continues to alter temperature and precipitation regimes, it is imperative to refine carbon cycle models by incorporating these nuanced relationships to improve predictions of SOC responses and associated feedbacks.
By using β values to assess SOC turnover along temperature gradients, we contribute to refining carbon cycle models that can better predict SOC responses to future climate scenarios. Our results emphasize that as temperatures rise, SOC loss may accelerate in regions currently serving as carbon sinks, potentially reinforcing climate warming through positive feedback mechanisms. Furthermore, understanding the interplay between temperature, precipitation, and local soil factors in modulating SOC turnover is critical for anticipating regional variations in carbon sequestration and informing land management strategies to mitigate climate change.
Future research should aim to expand the spatial and temporal scope of isotope-based SOC studies, incorporating additional environmental variables such as soil texture, land use changes, and microbial community composition. Such comprehensive approaches will enhance our capacity to predict and mitigate the impacts of climate change on terrestrial carbon reservoirs, ultimately informing strategies for sustainable ecosystem management and climate resilience.

Supplementary Materials

The following supporting information can be downloaded at: https://www.mdpi.com/article/10.3390/f16020342/s1.

Author Contributions

Conceptualization, L.-W.Z. and S.-J.K.; methodology, M.W.; software, M.W.; validation, L.-W.Z., Q.L. and Z.Z.; formal analysis, Z.H.; investigation, L.-W.Z. and S.-J.K.; resources, L.-W.Z. and S.-J.K.; data curation, L.-W.Z. and S.-J.K.; writing—original draft preparation, L.-W.Z. and M.W.; writing—review and editing, L.-W.Z. and S.-J.K.; visualization, L.-W.Z. and T.-Y.L.; supervision, L.-W.Z. and S.-J.K.; project administration, L.-W.Z.; funding acquisition, L.-W.Z. and S.-J.K. All authors have read and agreed to the published version of the manuscript.

Funding

This research was supported by the National Natural Science Foundation of China (NSFC 42266002, 41806062), the Hainan Province Science and Technology Special Fund (ZDYF2022SHFZ112), the National Postdoctoral Program for Innovative Talents of China (BX201700139), and the China Postdoctoral Science Foundation (2018M642567) all awarded to Li-Wei Zheng.

Data Availability Statement

All the original data are available at the Figshare data publisher (https://doi.org/10.6084/m9.figshare.28103441.v2, accessed on 25 January 2025).

Conflicts of Interest

The authors declare no conflicts of interest.

Abbreviations

The following abbreviations are used in this manuscript:
SOCSoil Organic Carbon
MATMean Annual Temperature
MAPMean Annual Precipitation

References

  1. Batjes, N.H. Total carbon and nitrogen in the soils of the world. Eur. J. Soil Sci. 2014, 65, 10–21. [Google Scholar] [CrossRef]
  2. Scharlemann, J.P.; Tanner, E.V.; Hiederer, R.; Kapos, V. Global soil carbon: Understanding and managing the largest terrestrial carbon pool. Carbon Manag. 2014, 5, 81–91. [Google Scholar] [CrossRef]
  3. Crowther, T.W.; Todd-Brown, K.E.; Rowe, C.W.; Wieder, W.R.; Carey, J.C.; Machmuller, M.B.; Snoek, B.; Fang, S.; Zhou, G.; Allison, S.D. Quantifying global soil carbon losses in response to warming. Nature 2016, 540, 104–108. [Google Scholar] [CrossRef]
  4. Jackson, R.B.; Lajtha, K.; Crow, S.E.; Hugelius, G.; Kramer, M.G.; Piñeiro, G. The ecology of soil carbon: Pools, vulnerabilities, and biotic and abiotic controls. Annu. Rev. Ecol. Evol. Syst. 2017, 48, 419–445. [Google Scholar] [CrossRef]
  5. Bond-Lamberty, B.; Bailey, V.L.; Chen, M.; Gough, C.M.; Vargas, R. Globally rising soil heterotrophic respiration over recent decades. Nature 2018, 560, 80–83. [Google Scholar] [CrossRef] [PubMed]
  6. Sulman, B.N.; Phillips, R.P.; Oishi, A.C.; Shevliakova, E.; Pacala, S.W. Microbe-driven turnover offsets mineral-mediated storage of soil carbon under elevated CO2. Nat. Clim. Change 2014, 4, 1099–1102. [Google Scholar] [CrossRef]
  7. Davidson, E.A.; Janssens, I.A. Temperature sensitivity of soil carbon decomposition and feedbacks to climate change. Nature 2006, 440, 165–173. [Google Scholar] [CrossRef] [PubMed]
  8. Carvalhais, N.; Forkel, M.; Khomik, M.; Bellarby, J.; Jung, M.; Migliavacca, M.; Saatchi, S.; Santoro, M.; Thurner, M.; Weber, U. Global covariation of carbon turnover times with climate in terrestrial ecosystems. Nature 2014, 514, 213–217. [Google Scholar] [CrossRef] [PubMed]
  9. Giardina, C.P.; Ryan, M.G. Evidence that decomposition rates of organic carbon in mineral soil do not vary with temperature. Nature 2000, 404, 858–861. [Google Scholar] [CrossRef] [PubMed]
  10. Acton, P.; Fox, J.; Campbell, E.; Rowe, H.; Wilkinson, M. Carbon isotopes for estimating soil decomposition and physical mixing in well-drained forest soils. J. Geophys. Res. Biogeosci. 2013, 118, 1532–1545. [Google Scholar] [CrossRef]
  11. Wang, C.; Houlton, B.Z.; Liu, D.; Hou, J.; Cheng, W.; Bai, E. Stable isotopic constraints on global soil organic carbon turnover. Biogeosciences 2018, 15, 987–995. [Google Scholar] [CrossRef]
  12. Hilton, R.G.; Galy, A.; Hovius, N.; Chen, M.-C.; Horng, M.-J.; Chen, H. Tropical-cyclone-driven erosion of the terrestrial biosphere from mountains. Nat. Geosci. 2008, 1, 759–762. [Google Scholar] [CrossRef]
  13. Kao, S.J.; Hilton, R.G.; Selvaraj, K.; Dai, M.; Zehetner, F.; Huang, J.C.; Hsu, S.C.; Sparkes, R.; Liu, J.T.; Lee, T.Y.; et al. Preservation of terrestrial organic carbon in marine sediments offshore Taiwan: Mountain building and atmospheric carbon dioxide sequestration. Earth Surf. Dyn. 2014, 2, 127–139. [Google Scholar] [CrossRef]
  14. Dadson, S.J.; Hovius, N.; Chen, H.; Dade, W.B.; Hsieh, M.-L.; Willett, S.D.; Hu, J.-C.; Horng, M.-J.; Chen, M.-C.; Stark, C.P. Links between erosion, runoff variability and seismicity in the Taiwan orogen. Nature 2003, 426, 648–651. [Google Scholar] [CrossRef] [PubMed]
  15. Hilton, R.G.; Galy, A.; Hovius, N.; Horng, M.-J.; Chen, H. The isotopic composition of particulate organic carbon in mountain rivers of Taiwan. Geochim. Cosmochim. Acta 2010, 74, 3164–3181. [Google Scholar] [CrossRef]
  16. Zheng, L.-W.; Ding, X.; Liu, J.T.; Li, D.; Lee, T.-Y.; Zheng, X.; Zheng, Z.; Xu, M.N.; Dai, M.; Kao, S.-J. Isotopic evidence for the influence of typhoons and submarine canyons on the sourcing and transport behavior of biospheric organic carbon to the deep sea. Earth Planet. Sci. Lett. 2017, 465, 103–111. [Google Scholar] [CrossRef]
  17. Galy, V.; Peucker-Ehrenbrink, B.; Eglinton, T. Global carbon export from the terrestrial biosphere controlled by erosion. Nature 2015, 521, 204–207. [Google Scholar] [CrossRef]
  18. Zheng, L.-W.; Hilton, R.G.; Chang, Y.-P.; Yang, R.J.; Ding, X.; Zheng, X.; Lee, T.-Y.; Lu, H.-J.; Lu, J.-T.; Lin, Y.-S.; et al. Climate-regulation of organic carbon export in erosive mountain settings: A case study from Taiwan since the last glacial maximum. Quat. Sci. Rev. 2024, 334, 108687. [Google Scholar] [CrossRef]
  19. Horan, K.; Hilton, R.G.; Selby, D.; Ottley, C.J.; Gröcke, D.R.; Hicks, M.; Burton, K.W. Mountain glaciation drives rapid oxidation of rock-bound organic carbon. Sci. Adv. 2017, 3, e1701107. [Google Scholar] [CrossRef] [PubMed]
  20. O’Gorman, P.A.; Allan, R.P.; Byrne, M.P.; Previdi, M. Energetic constraints on precipitation under climate change. Surv. Geophys. 2012, 33, 585–608. [Google Scholar] [CrossRef]
  21. Heinze, C.; Blenckner, T.; Martins, H.; Rusiecka, D.; Döscher, R.; Gehlen, M.; Gruber, N.; Holland, E.; Hov, Ø.; Joos, F. The quiet crossing of ocean tipping points. Proc. Natl. Acad. Sci. USA 2021, 118, e2008478118. [Google Scholar] [CrossRef] [PubMed]
  22. Schmidt, M.W.; Torn, M.S.; Abiven, S.; Dittmar, T.; Guggenberger, G.; Janssens, I.A.; Kleber, M.; Kögel-Knabner, I.; Lehmann, J.; Manning, D.A. Persistence of soil organic matter as an ecosystem property. Nature 2011, 478, 49–56. [Google Scholar] [CrossRef]
  23. Lehmann, J.; Kleber, M. The contentious nature of soil organic matter. Nature 2015, 528, 60–68. [Google Scholar] [CrossRef] [PubMed]
  24. Bird, M.I.; Chivas, A.R.; Head, J. A latitudinal gradient in carbon turnover times in forest soils. Nature 1996, 381, 143–146. [Google Scholar] [CrossRef]
  25. Powers, J.S.; Schlesinger, W.H. Geographic and vertical patterns of stable carbon isotopes in tropical rain forest soils of Costa Rica. Geoderma 2002, 109, 141–160. [Google Scholar] [CrossRef]
  26. Brunn, M.; Spielvogel, S.; Sauer, T.; Oelmann, Y. Temperature and precipitation effects on δ 13 C depth profiles in SOM under temperate beech forests. Geoderma 2014, 235, 146–153. [Google Scholar] [CrossRef]
  27. Campbell, J.E.; Fox, J.F.; Davis, C.M.; Rowe, H.D.; Thompson, N. Carbon and nitrogen isotopic measurements from southern Appalachian soils: Assessing soil carbon sequestration under climate and land-use variation. J. Environ. Eng. 2009, 135, 439–448. [Google Scholar] [CrossRef]
  28. Ho, C.-S. An Introduction to the Geology of Taiwan, Explanatory Text of the Geologic Map of Taiwan; Central Geological Survey: New Taipei City, Taiwan, 1988; pp. 151–152. [Google Scholar]
  29. Chen, Z.-S.; Hseu, Z.-Y.; Tsai, C.-C. The Soils of Taiwan; Springer: Dordrecht, The Netherlands, 2015. [Google Scholar]
  30. Soil Survey Staff. Keys to Soil Taxonomy, 10th ed.; USDA-Natural Resources Conservation Service: Washington, DC, USA, 2006. [Google Scholar]
  31. Blake, G.R.; Hartage, K.H. Particle density. In Methods of Soil Analysis; Part 1: Physical Properties; Klute, A., Ed.; American Society of Agronomy: Madison, WI, USA, 1986; pp. 377–381. [Google Scholar]
  32. Tsai, C.-C.; Chen, Z.-S.; Hseu, Z.-Y.; Duh, C.-T.; Guo, H.-Y. Organic carbon storage and management strategies of the forest soils based on the forest soil survey database in Taiwan. In Proceedings of the International Workshop on Evaluation and Sustainable Management of Soil Carbon Sequestration in Asian Countries, IPB International Conference Center, Bogor, Indonesia, 28–29 September 2010. [Google Scholar]
  33. Jeffrey, D. A note on the use of ignition loss as a means for the approximate estimation of soil bulk density. J. Ecol. 1970, 58, 297–299. [Google Scholar] [CrossRef]
  34. Harrison, A.; Bocock, K. Estimation of soil bulk-density from loss-on-ignition values. J. Appl. Ecol. 1981, 18, 919–927. [Google Scholar] [CrossRef]
  35. Kramer, M.; Chadwick, O. Climate-driven thresholds in reactive mineral retention of soil carbon at the global scale. Nat. Clim. Change 2018, 8, 1104–1108. [Google Scholar] [CrossRef]
  36. Tsui, C.-C.; Tsai, C.-C.; Chen, Z.-S. Soil organic carbon stocks in relation to elevation gradients in volcanic ash soils of Taiwan. Geoderma 2013, 209, 119–127. [Google Scholar] [CrossRef]
  37. Garten, C.T., Jr.; Hanson, P.J. Measured forest soil C stocks and estimated turnover times along an elevation gradient. Geoderma 2006, 136, 342–352. [Google Scholar] [CrossRef]
  38. Wang, H.C.; Lin, K.C.; Huang, C.Y. Temporal and spatial patterns of remotely sensed litterfall in tropical and subtropical forests of Taiwan. J. Geophys. Res. Biogeosci. 2016, 12, 509–522. [Google Scholar] [CrossRef]
  39. Friedli, H.; Siegenthaler, U.; Rauber, D.; Oeschger, H. Measurements of concentration, 13C/12C and 18O/16O ratios of tropospheric carbon dioxide over Switzerland. Tellus B 1987, 39, 80–88. [Google Scholar] [CrossRef]
  40. Kaiser, K.; Guggenberger, G.; Zech, W. Isotopic fractionation of dissolved organic carbon in shallow forest soils as affected by sorption. Eur. J. Soil Sci. 2001, 52, 585–597. [Google Scholar] [CrossRef]
  41. Zhang, D.; Hui, D.; Luo, Y.; Zhou, G. Rates of litter decomposition in terrestrial ecosystems: Global patterns and controlling factors. J. Plant Ecol. 2008, 1, 85–93. [Google Scholar] [CrossRef]
  42. Schuur, E.A. The effect of water on decomposition dynamics in mesic to wet Hawaiian montane forests. Ecosystems 2001, 4, 259–273. [Google Scholar] [CrossRef]
  43. Berg, B. Litter decomposition and organic matter turnover in northern forest soils. For. Ecol. Manag. 2000, 133, 13–22. [Google Scholar] [CrossRef]
  44. Fioretto, A.; Papa, S.; Pellegrino, A.; Fuggi, A. Decomposition dynamics of Myrtus communis and Quercus ilex leaf litter: Mass loss, microbial activity and quality change. Appl. Soil Ecol. 2007, 36, 32–40. [Google Scholar] [CrossRef]
  45. Li, X.G.; Jia, B.; Lv, J.; Ma, Q.; Kuzyakov, Y.; Li, F.-m. Nitrogen fertilization decreases the decomposition of soil organic matter and plant residues in planted soils. Soil Biol. Biochem. 2017, 112, 47–55. [Google Scholar] [CrossRef]
  46. Zang, H.; Blagodatskaya, E.; Wang, J.; Xu, X.; Kuzyakov, Y. Nitrogen fertilization increases rhizodeposit incorporation into microbial biomass and reduces soil organic matter losses. Biol. Fertil. Soils 2017, 53, 419–429. [Google Scholar] [CrossRef]
  47. Luo, Y.; Ahlström, A.; Allison, S.D.; Batjes, N.H.; Brovkin, V.; Carvalhais, N.; Chappell, A.; Ciais, P.; Davidson, E.A.; Finzi, A. Toward more realistic projections of soil carbon dynamics by Earth system models. Glob. Biogeochem. Cycles 2016, 30, 40–56. [Google Scholar] [CrossRef]
Figure 1. Location map of soil profiles (red circles) in the Taiwan region. The soil order map is adapted from [29].
Forests 16 00342 g001
Figure 2. The correlation between SOC% and bulk density. The solid line indicates the regression line of the data points (circles), and the dashed curves indicate a 95% confidence interval.
Forests 16 00342 g002
Figure 3. Environmental control on organic carbon stock in Taiwanese soil. (ac) Elevational distribution of organic carbon stock in 0–30 cm (a), 0–50 cm (b), and 0–100 cm (c), respectively; (df) correlation between MAP and carbon stock in 0–30 cm (d), 0–50 cm (e), and 0–100 cm (f), respectively; (gi) correlation between MAT and organic carbon stock in 0–30cm (g), 0–50 cm (h), and 0–100 cm (i), respectively. The solid lines indicate linear regression, while the dashed lines represent a 95% confidence interval.
Forests 16 00342 g003
Figure 4. Representative vertical distribution of SOC and δ13CSOC in Taiwanese soils. (ae) Vertical distribution of SOC (circles) and δ13CSOC (triangles); (fj) the correlation between ln (SOC) and δ13CSOC; The solid lines indicate linear regression, while the dashed lines represent a 95% confidence interval. Numbers (e.g., 27, 37–40) correspond to representative sites from the 32 well-drained soil profiles sampled in the study. Note: δ13C measurements were performed with a reproducibility of better than 0.2‰. Error bars were not included due to the minimal uncertainty associated with the measurements.
Forests 16 00342 g004
Figure 5. Correlation between ln(β) and environmental factors. (a) ln(β) versus elevation, (b) ln(β) versus MAT, (c) ln(β) versus MAP, (d) ln(β) versus soil N%. Black circles in (bd) indicate data from this study, while the white dots in (bd) represent data from Wang et al. (2018) [11]. The solid lines (gray and black) represent regression curves, while the dashed lines indicate the 95% confidence interval.
Forests 16 00342 g005
Table 1. β values for the 32 well-drained soil profiles and associated climate variables.
Soil ProfilesElevation
(m)
MAP
(mm)
MAT
(°C)
ln(β)R2p-Value
KP4201336320.61.80.950.004
KP5127287321.62.30.960.014
KP678271022.11.90.690.02
11748283416.6−0.10.870.021
21753283416.60.20.890.004
31759283416.6−0.30.920.01
41758283416.60.10.800.002
51786283416.60.10.860.008
61786283416.60.910.005
81249313117.90.90.99<0.0001
914403122140.30.970.018
111444312313.80.20.960.004
14899363020.11.80.97<0.0001
15757341720.21.20.800.007
17847330020.11.40.820.095
208190221.81.10.880.002
218190221.80.70.930.008
220134123.22.70.880.002
230134123.21.80.560.087
24730235420.90.30.97<0.0001
25715240620.60.90.960.001
28650240420.60.60.970.002
302046291114.20.40.970.002
3526233281170.10.820.005
37234263822.710.960.004
38196263822.71.10.99<0.0001
39346260922.70.70.930.002
40356260922.70.60.94<0.0001
P130218321.61.20.690.083
P2117279920.32.10.980.012
P62094317916.90.10.630.019
P82125314816.60.20.640.057
Disclaimer/Publisher’s Note: The statements, opinions and data contained in all publications are solely those of the individual author(s) and contributor(s) and not of MDPI and/or the editor(s). MDPI and/or the editor(s) disclaim responsibility for any injury to people or property resulting from any ideas, methods, instructions or products referred to in the content.

