Article

Warming Does Not Change Vertical Variations in Microbial Resource Limitation in Subtropical Forests at China

1
Key Laboratory for Humid Subtropical Eco-Geographical Processes of the Ministry of Education, School of Geographical Sciences, Fujian Normal University, Fuzhou 350007, China
2
Fujian Sanming Forest Ecosystem National Observation and Research Station, Sanming 365002, China
*
Author to whom correspondence should be addressed.
Forests 2025, 16(3), 402; https://doi.org/10.3390/f16030402
Submission received: 25 December 2024 / Revised: 2 February 2025 / Accepted: 18 February 2025 / Published: 24 February 2025
(This article belongs to the Section Forest Soil)

Abstract

:
Global warming can differentially alter ecosystem carbon, nitrogen, and phosphorus dynamics, regulating the balance between soil substrate supply and microbial metabolic demand. However, empirical research on how warming influences microbial resource limitation along the soil profile remains limited, particularly in tropical–subtropical regions. Here, we investigated vertical variations (0–60 cm soil layers) in microbial resource limitation and their corresponding responses to warming in subtropical forests in southern China, using a soil warming experiment with heating cables (+4 °C) and enzymatic stoichiometry. Alleviated carbon limitation but aggravated nutrient (nitrogen and phosphorus) limitation for microbial metabolism was observed along soil profiles, regardless of warming treatment. Among different soil depths, warming mitigated microbial carbon limitation conditions and exacerbated microbial nutrient limitation conditions in a 0–10 cm surface layer, but had no significant effect below the 20 cm soil depth. Moreover, vertical variations in microbial nitrogen limitation were primarily regulated by soil moisture and the fungal–bacterial ratio regardless of warming treatment. In contrast, vertical changes in microbial carbon and phosphorus limitation were driven by soil moisture and the fungal–bacterial ratio under ambient conditions, but by the soil carbon–phosphorus ratio and the fungal–bacterial ratio after warming. For surface soil, warming effects on microbial carbon, nitrogen, and phosphorus limitation were mainly explained by microbial biomass stoichiometry and the fungal–bacterial ratio. Overall, warming had diverse effects on microbial resource limitation along the entire soil profile. These findings provide important insights for accurately predicting biogeochemical cycles under global warming scenarios.

1. Introduction

The global air temperature has increased significantly over the last few decades, rising by more than 1 °C since the 20th century and being projected to increase by an additional 2.7 °C by 2100 [1]. Climate warming is likely to alter vegetation composition and biomass production, influencing soil organic matter input via plant residues [2,3]. The rise in temperature may also affect soil microbial biomass and metabolic activity, altering the energy and nutrient requirements of microbes [4]. On the one hand, variations in the equilibrium between soil resource availability and microbial metabolic demand may modify soil carbon (C) loss, as soil microbes are main decomposers of soil organic matter and plant materials [5]. On the other hand, changes in this balance may also regulate soil nitrogen (N) and phosphorus (P) availability and subsequent vegetation productivity owing to the key role of microbes in soil nutrient cycles [6]. Therefore, a comprehensive understanding of how warming influences the imbalance between resource supply and demand is crucial for precisely forecasting terrestrial C and nutrient dynamics under global warming scenarios.
Extracellular enzymes are essential for the soil organic matter decomposition and nutrient cycling [7]. Following resource allocation theory, microorganisms may invest in enzyme production to acquire relatively limited elements [8,9]. Enzymatic stoichiometry theory can thus reflect the relationship between microbial biomass stoichiometry and soil nutrient availability, i.e., microbial resource limitation [9]. This enzymatic stoichiometry is expected to change in diverse ways under continuous climate warming [10]. Prior research has reported that warming decreases the enzymatic C:P ratio and vector length, suggesting alleviated microbial C limitation [11,12]. Other studies have also observed that temperature rise reduces enzymatic C:N and C:P ratios, indicating intensified microbial nutrient limitation [13]. Despite the considerable attention given to microbial resource limitation under global warming, our knowledge is still narrow in several aspects. First, current studies primarily focus on microbial metabolism in topsoil, neglecting its vertical variations along the soil profile. Topsoil is typically characterized by continuous plant residue inputs, whereas subsoil receives few organic materials derived from rhizodeposition [14,15]. Additionally, subsoil exhibits relatively lower resource availability owing to the stronger physical protection or chemical adsorption of soil organic matter [16,17]. Meanwhile, microbial biomass and activity generally decrease as soil depth increases [18]. However, microbial biomass stoichiometry shows diverse vertical patterns, for example, a decreased microbial biomass C:N ratio and an increased microbial biomass C:P ratio across depths [19]. These vertical differences in soil resource supply and microbial properties may influence microbial resource limitation with depth. More importantly, warming can simultaneously influence soil substrates and microbial characteristics [4,20], leading to more complicated variations in microbial resource limitation across soil depths [10]. However, empirical evidence of warming-induced changes in microbial resource limitation throughout the soil profile is still lacking.
Second, it remains unknown whether warming alters the main drivers of the vertical pattern of microbial resource limitation. Microbial resource limitation is usually regulated by soil environmental, substrate, and microbial properties. Vertically, enhanced soil moisture can increase the enzymatic C:P ratio across depths [21]. Additionally, the decrease in the soil C:P ratio from topsoil to subsoil can reduce vector length, which is a measure indicating microbial C limitation [22]. Meanwhile, the regulatory effect of microbial biomass C:N:P stoichiometry on microbial nutrient limitation is stronger in surface soil than in deep soil [23]. As soil physiochemical and microbial properties change with increasing temperature, vertical variations in microbial metabolism may be regulated by various factors after warming. Specifically, soil temperature rise reduces soil moisture in topsoil but has minor effects in subsoil [24]. Warming may also increase C inputs into deep soil profiles from belowground litter [25]. Moreover, the effects of increased temperature on microbial community structures may be profound in surface soil but weakened in deep soil layers [4]. Furthermore, it has been reported that microbial metabolic capacity remains stable regardless of warming [26]. These diverse responses of soil physiochemical and microbial properties to warming may result in changes in the drivers of the vertical pattern of microbial resource limitation. However, this question is still in doubt owing to the limited observational evidence.
Third, previous studies have primarily focused on high-altitude and high-latitude regions, with little understanding of low-latitude regions. Tropical and subtropical forests, which account for only about 15% of the Earth’s land surface area, support a fraction exceeding one-third of terrestrial net primary productivity [27,28]. Compared to temperate forests, tropical and subtropical forests are marked by heavily weathered soils with weak adsorption capacity [29]. In these ecosystems, soil microbes preferentially utilize photosynthates to satisfy their energy requirements due to the low soil organic C content [30,31]. Moreover, microbial metabolism in these regions is usually limited by P rather than N because of highly weathered soils [32,33]. These unique conditions suggest that microbial resource limitation in tropical and subtropical forests may differ significantly from that observed in other forests. More importantly, microbial metabolism in tropical and subtropical forests may be more vulnerable to climate warming than in other forests, given the relatively limited temperature fluctuation in tropic and subtropic regions [34]. However, few studies have examined the relationship between experimental warming and microbial resource limitation in tropical and subtropical forests.
To resolve the knowledge gaps described above, we conducted a field soil warming experiment in subtropical forests to explore the effects of warming on vertical variations in microbial resource limitation. We also examined the soil abiotic and biotic factors along the soil profiles to investigate how warming influences the main regulators of microbial resource limitation. Based on these determinations, this study aimed to (1) reveal the effects of warming on vertical variations in microbial resource limitation across different soil depths and (2) ascertain how warming alters the dominant factors regulating microbial resource limitation from topsoil to subsoil.

2. Materials and Methods

2.1. Study Area and Experimental Design

This study was conducted in Fujian Sanming Forest Ecosystem National Observation and Research Station in Fujian Province, southeast China (26°11′ N, 117°228′ E, 386 m a.s.l.). This region features a subtropical monsoon climate, with a mean annual temperature of 19.3 °C and a mean annual precipitation of 1638 mm, of which 78% occurs from March to August. The soil is classified as red soil according to the Chinese soil classification system, equivalent to Oxisols in the USDA Soil Taxonomy. The experiment site is located in a 200-year-old evergreen broadleaf natural forest. The dominant canopy tree species included Castanopsis kawakamii, Pinus massoniana, Cunninghamia lanceolata, and Schima superb [35]. The stand density was approximately 250 stems ha−1, with a mean tree height of 35.1 m and a mean diameter at breast height of 57.7 cm in 2013 [36].
We conducted an experiment on whole-soil-profile warming. Ten 6 m × 6 m plots were arranged in a randomized block design with five blocks. A 6 m wide buffer zone was situated between adjacent plots to minimize edge effects. Resistance heating cables (Nexans, Halden, Norway) were deployed in all plots at a soil depth of 10 cm with a horizontal interval of 20 cm. Temperature sensors (Campbell Scientific Inc., Logan, UT, USA) were positioned at soil depths of 10, 20, 40, and 60 cm to monitor soil temperature. The soil warming system, controlled by the Campbell CR3000 data logger (Campbell Scientific Inc., Logan, UT, USA), was run in October 2015. The system maintains the soil temperature in the heating plots at 4 °C above that in the ambient control plots at each depth [24].

2.2. Soil Sampling and Physicochemical Analyses

Soil samples were collected in July 2022 by a 5 cm diameter stainless steel hand corner from four depths (0–10 cm, 10–20 cm, 20–40 cm, and 40–60 cm) in each plot. Afterward, the soil samples were fully homogenized after sieving through 2 mm mesh, and divided into two parts. One portion was air-dried for analyzing soil physiochemical properties, such as soil pH. The other was kept at 4 °C for determining soil dissolved substrate content and microbial properties.
Soil physicochemical properties were investigated following the methods description [37]. Soil moisture was quantified by oven-drying fresh soil at 105 °C until a constant weight was obtained. Soil clay content was determined by a particle size analyzer (Bettersize3000, Dandong, China). Soil pH was analyzed with a soil-to-deionized water ratio of 1:2.5 by a pH electrode (Ohaus, Parsippany, NJ, USA). Soil dissolved organic C (DOC) content was quantified with a total organic C analyzer (Shimadzu, Tokyo, Japan). Soil total dissolved N (TDN) and available P (LP) contents were analyzed by a flow injection analyzer (Skalar, Breda, The Netherlands). Soil C:N and C:P ratios were calculated as the ratios of DOC to TDN and DOC to LP, respectively.

2.3. Soil Extracellular Enzymes and Enzymatic Stoichiometry Analyses

The potential activities of five soil extracellular enzymes were measured using the methods described in [38,39]. These enzymes are involved in C-acquisition (β-1,4-glucosidase—BG; β-D-cellobiosidase—CBH), N-acquisition (β-1,4-N-acetylglucosaminidase—NAG; leucine aminopeptidase—LAP), and P-acquisition (acid phosphatase—AP). Specifically, fresh soil (approximately 2 g) was thoroughly mixed with sodium acetate buffer, whose pH was adjusted to match that of the soil sample. Then, soil suspension (200 μL) and specific substrate (50 μL) were added to 96-well plates. Corresponding standard curves were created by mixing 200 μL of soil suspension with 50 μL of standard material at varied concentrations (0, 0.5, 1, 5, 10, 15 μM) in new 96-well plates. All plates were incubated in the dark at 25 °C for 3 h. The fluorescence was measured at 365 nm excitation and 450 nm emission. Soil enzyme activity was expressed in two units, i.e., nmol g−1 soil h−1 (normalized by soil) and μmol g−1 TC h−1 (normalized by soil total C content).
Subsequently, enzymatic stoichiometry was assessed using multiple methods to estimate microbial resource limitation. First, enzymatic ratios of C-, N-, and P-acquisition were calculated using the following equations [9]:
EEAC:N = ln(BG + CBH)/ln(NAG + LAP)
EEAC:P = ln(BG + CBH)/ln(AP)
where BG and CBH represent C-acquisition enzymes, NAG and LAP represent N-acquisition enzymes, and AP represents the P-acquisition enzyme. Higher EEAC:N and EEAC:P values indicate relatively lower N- and P-requirements for microorganisms, i.e., lower microbial N and P limitation, respectively. Second, a vector analysis of enzymatic stoichiometry was used to measure microbial resource limitation with the following equations [7]:
Vector length = √[(EEAC:P)2 + (EEAC:N)2]
Vector angle = Degrees [ATAN2(EEAC:P, EEAC:N)]
where a longer vector length (unitless) indicates a higher C-requirement for microorganisms, i.e., greater C limitation. The vector angles < 45° and >45° denote relatively higher N- and P-requirements for microorganisms, i.e., N and P limitation, respectively [40]. Third, the imbalance between the threshold elemental ratio model (TER) and available resource stoichiometry was quantified. TER (TERC:N and TERC:P) is the threshold elemental ratio at which microbial metabolic control switches from C limitation to nutrient (N or P) limitation [41], and was calculated using the following equations [9]:
TERC:N = [(BG + CBH)/(NAG + LAP)] × BC:N/n
TERC:P = [(BG + CBH)/AP] × BC:P/p
where BC:N and BC:P are microbial biomass C:N and C:P ratios; n and p are dimensionless normalization constants and can be calculated as ea and eb, respectively. The a is the intercept of a type II standard major axis (SMA) regression for ln(BG + CBH) versus ln(NAG + LAP). The b is the intercept of SMA regression for ln(BG + CBH) versus ln(AP). If the ratio of the soil C:N ratio to TERC:N (RC:N/TERC:N) is greater than 1, microbial metabolism is limited by N supply, i.e., microbial N limitation. Similarly, if the ratio of the soil C:P ratio to TERC:P (RC:P/TERC:P) is greater than 1, microbial P limitation is observed [42].

2.4. Soil Microbial Analyses

To explore microbial controls on microbial resource limitation, we analyzed soil microbial biomass C, N, and P contents, as well as soil phospholipid fatty acid (PLFA) abundance. Soil microbial biomass C, N, and P contents were determined using the chloroform fumigation–extraction method, with the corresponding conversion coefficients being 0.45, 0.54, and 0.40, respectively [43,44,45]. PLFAs were extracted following the method described in [46]. Then, PLFAs were qualitatively and quantitatively analyzed using Gas chromatography–mass spectrometry (Agilent, Santa Clara, CA, USA) and a MIDI microbial identification system (Newark, Newark, NJ, USA). PLFAs were classified as bacterial PLFAs (i14:0, i15:0, a15:0, i16:0, 16:1ω7c, i17:0, a17:0, cy17:0, 18:1ω7c, and cy19:0) and fungal PLFAs (18:2ω6,9c) [37]. The fungal–bacterial ratio was used as an indicator of microbial community composition.

2.5. Statistical Analysis

The data were evaluated for normality and analyzed as follows: Linear mixed-effects models were used to explore the fixed effects of warming, depth, and their interaction on soil enzyme activities, enzymatic stoichiometry, and soil physiochemical and microbial properties [26,47]. The block was treated as a random factor in the models. Then, to examine the differences in the above variables along the soil profile, linear mixed-effects models were used with the block as a random factor [26,47]. The least significant difference test (LSD) was then conducted to examine differences among soil depths. Afterward, differences in the above variables between control and warming treatments at each soil depth were measured using linear mixed-effects models with the block as a random factor. Meanwhile, SMA regression was used to test the difference between microbial enzymatic stoichiometry and the 1:1 line [23,48]. Moreover, Pearson’s correlation analyses were conducted to examine the relationships between enzymatic stoichiometry and soil environmental (i.e., soil moisture, pH, and clay content), substrate (i.e., soil C:N ratio and C:P ratio), and microbial properties. After unrelated variables were excluded, the optimal prediction model was chosen using the Akaike’s information criterion for a small sample size [49]. All variables were standardized using the Z-score before analyses. The variance inflation factors of predictor variables were kept below 10 to avoid high collinearity [50]. Then, the relative importance of each explanatory variable in the optimal model was estimated through variation partitioning analyses [51,52]. All analyses were conducted using R software v3.4.1 [53] with R packages including lme4 [47], smatr [48], and MuMIn [54].

3. Results

3.1. Soil Physiochemical and Microbial Properties

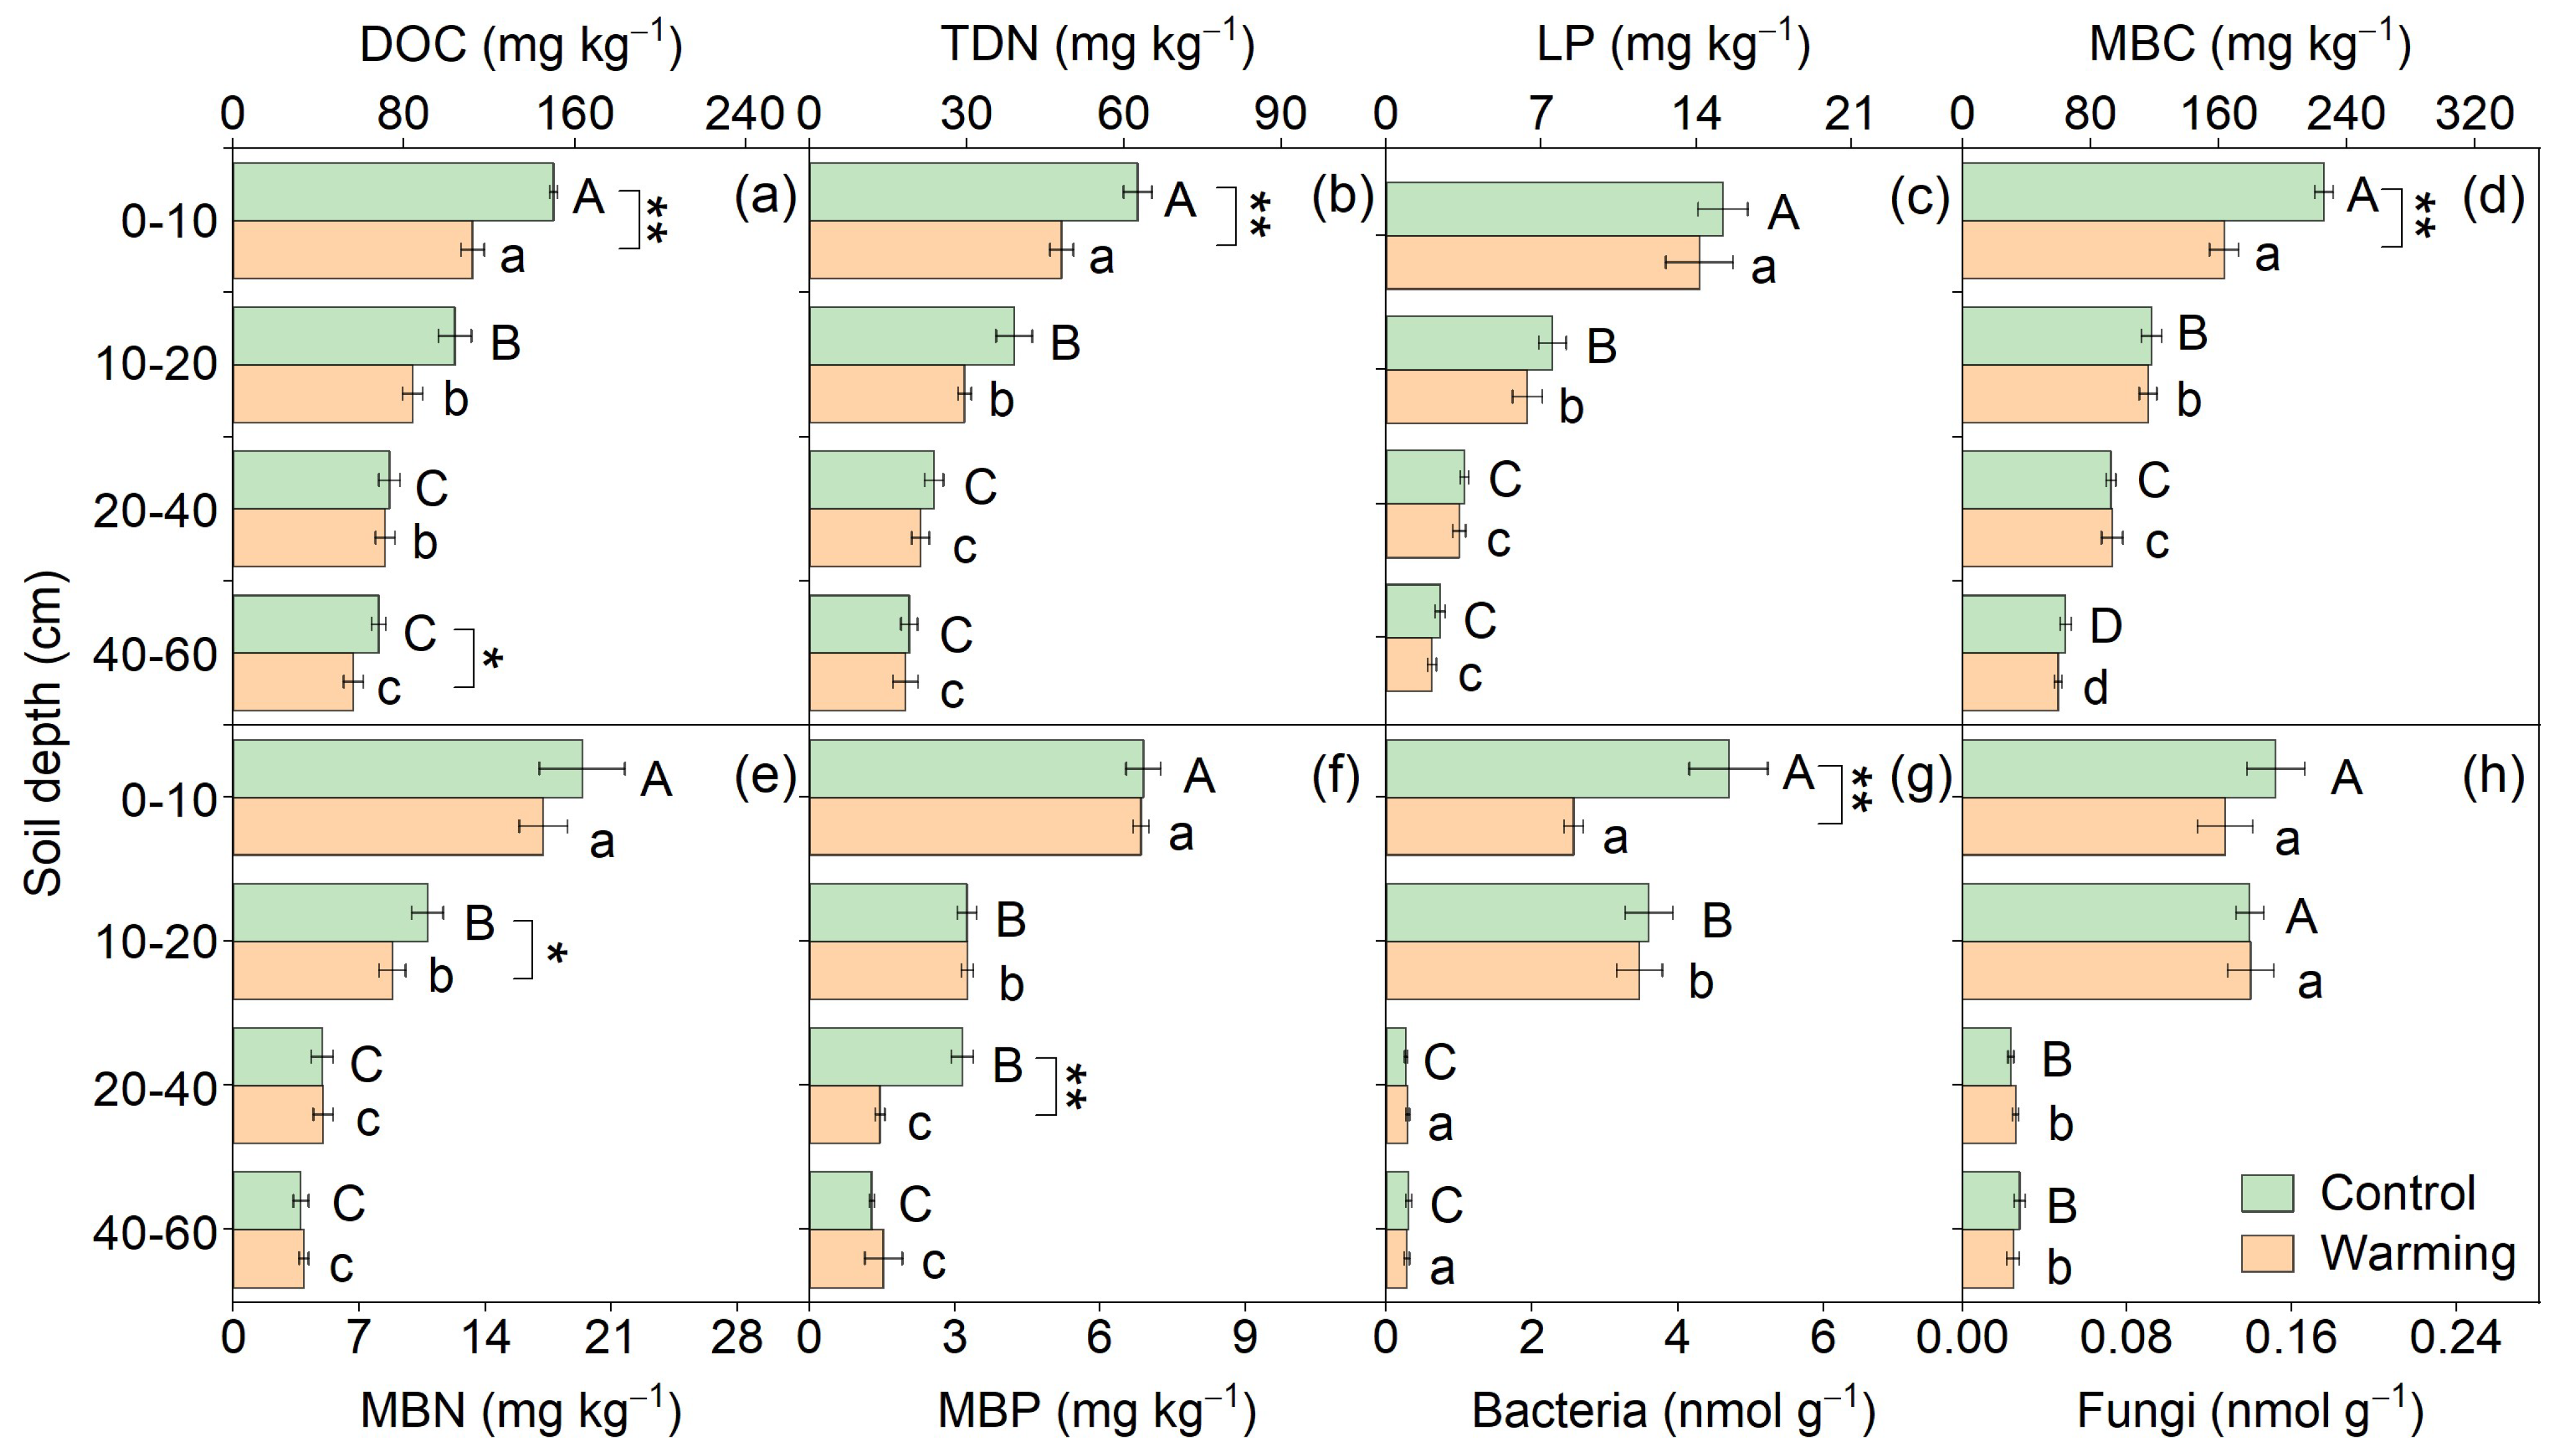
There was no significant interaction between soil depth and warming for soil physicochemical and microbial properties (Table 1). Within soil profiles, the soil moisture, clay content, C:N ratio, and C:P ratio increased with soil depth, while soil pH remained constant in both control and warming plots (Figure 1a–d). The soil microbial biomass C:N and C:P ratios and fungal–bacterial ratio also increased from surface to deep soils in both treatments (Figure 1e,f). Moreover, the responses of these variables to warming varied with soil depth (Figure 1). Warming significantly decreased soil moisture and the microbial biomass C:P ratio but increased the fungal–bacterial ratio at the 0–10 cm soil depth. In contrast, most soil physicochemical and microbial properties showed no significant response to warming at other soil depths.
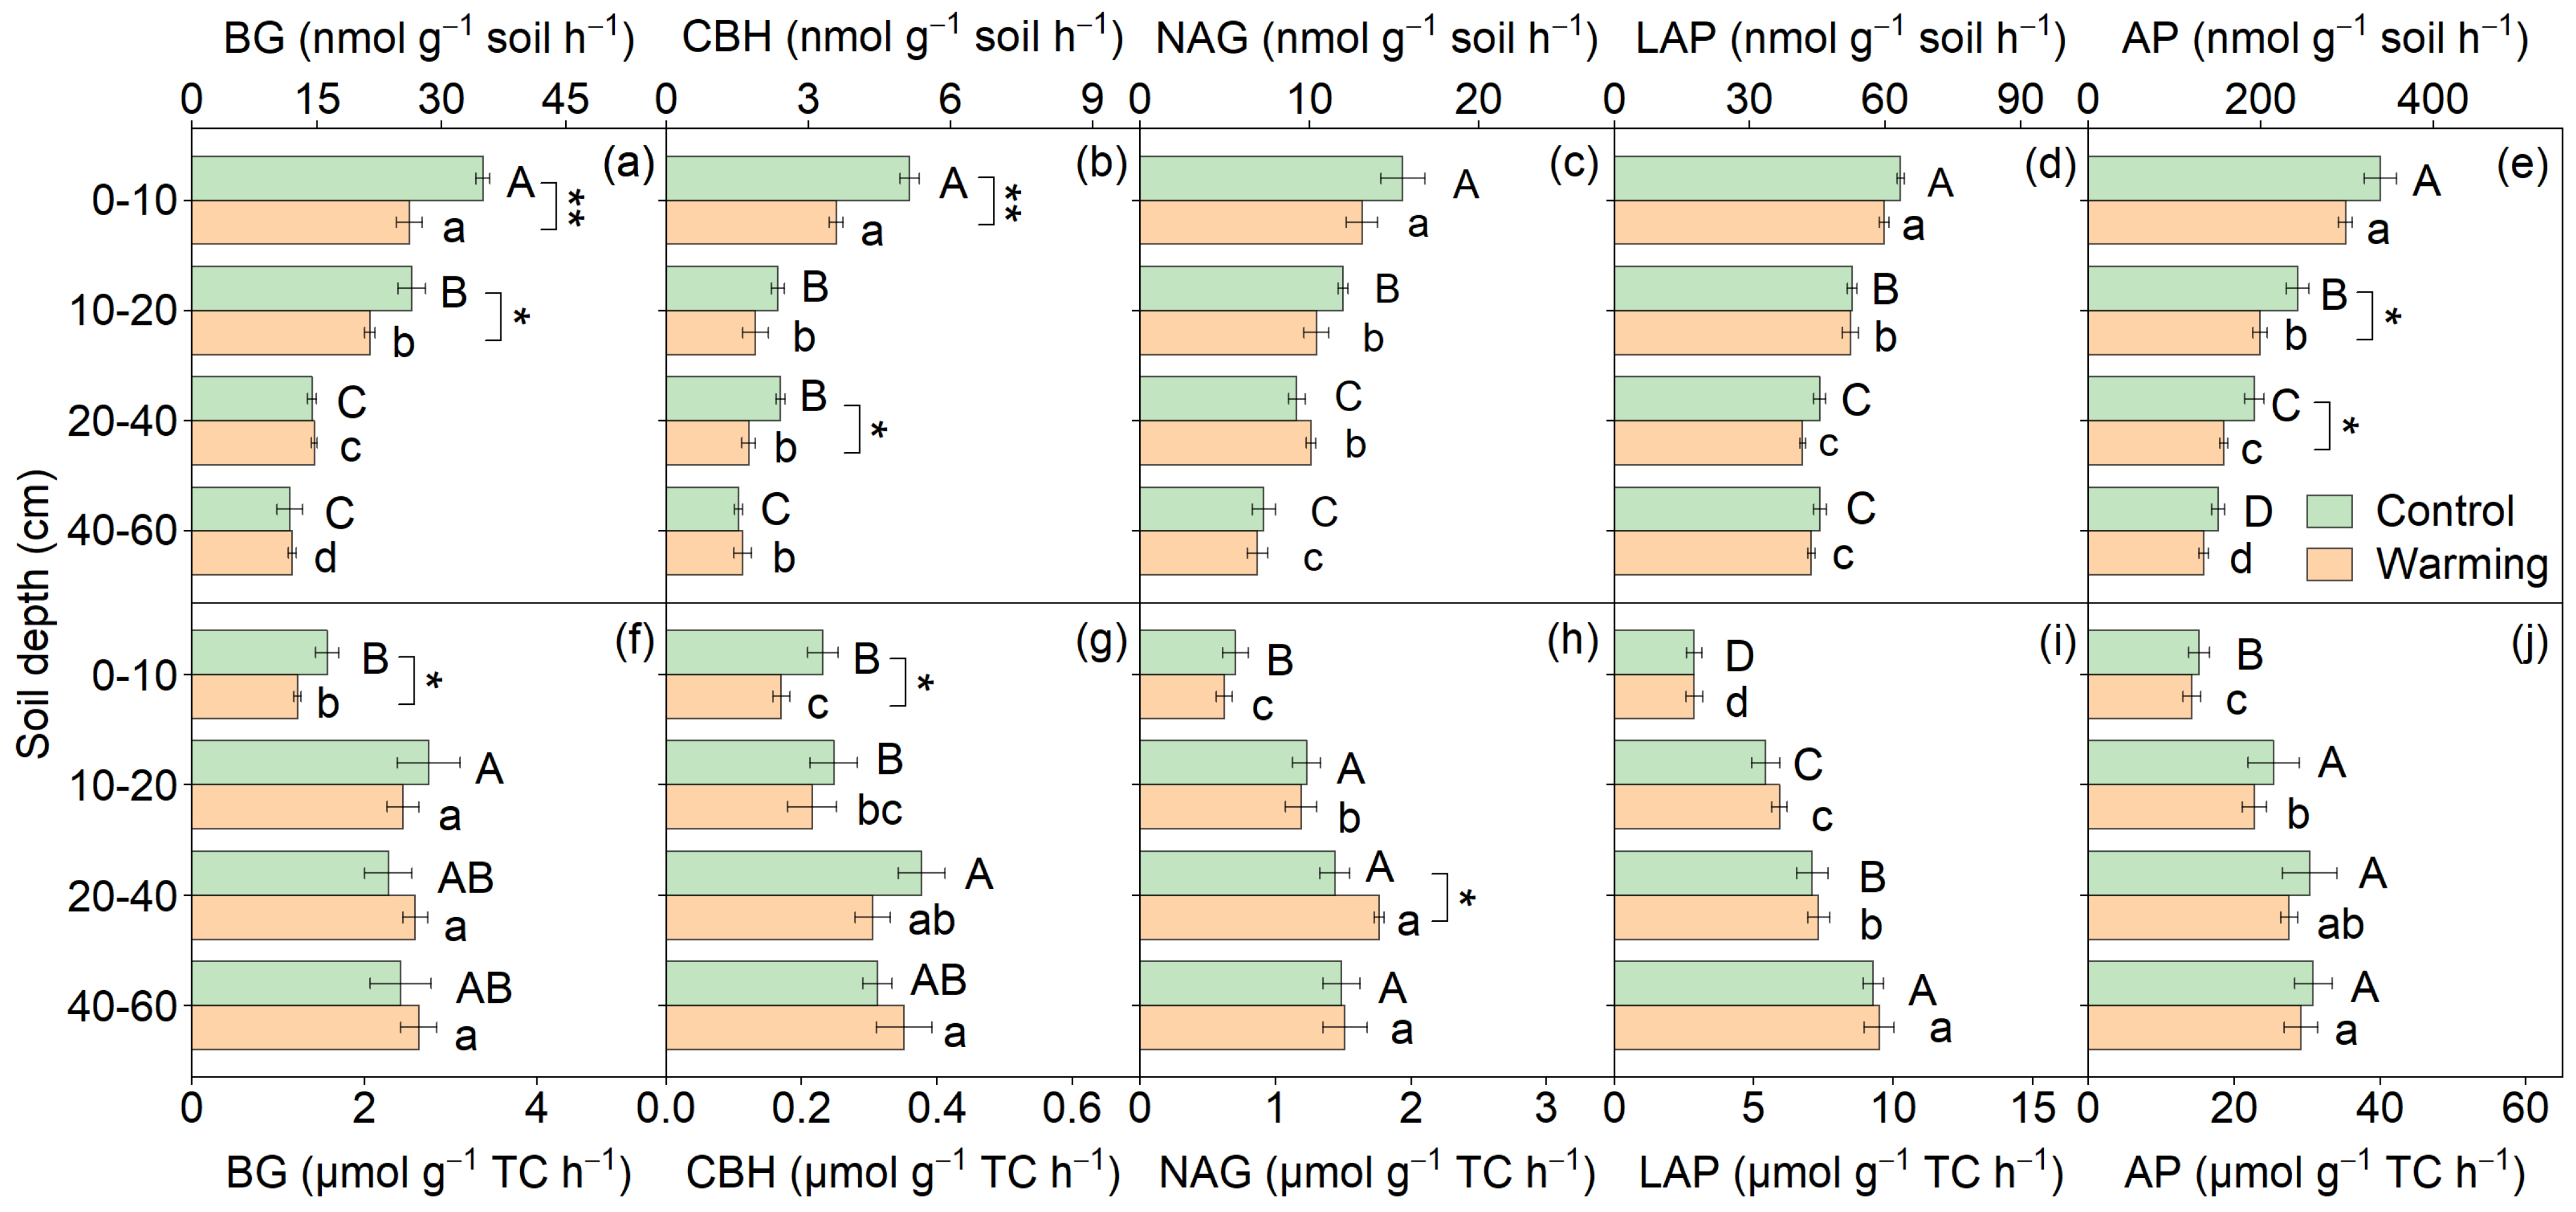
Soil enzyme activities responded significantly to both warming and soil depth (Table A1). Specifically, the potential enzyme activities of C-, N-, and P-acquisition (normalized by soil) decreased with soil depth for both control and warming treatments (Figure A1a–d). Meanwhile, the effects of warming on potential enzyme activities varied among soil depths. Warming decreased the potential enzyme activities of BG and CBH at the 0–10 cm soil depth, BG and AP at the 10–20 cm soil depth, and CBH and AP at the 20–40 cm soil depth (Figure A1a–d). Specific enzyme activities (normalized by soil total C content) also varied significantly with soil depth, showing an increasing trend from topsoil to subsoil (Figure A1e,f). In addition, warming significantly decreased the specific enzyme activities of BG and CBH at the 0–10 cm soil depth, and increased the specific enzyme activities of NAG at the 20–40 cm soil depth (Figure A1e,f).

3.2. Soil Enzymatic Stoichiometry

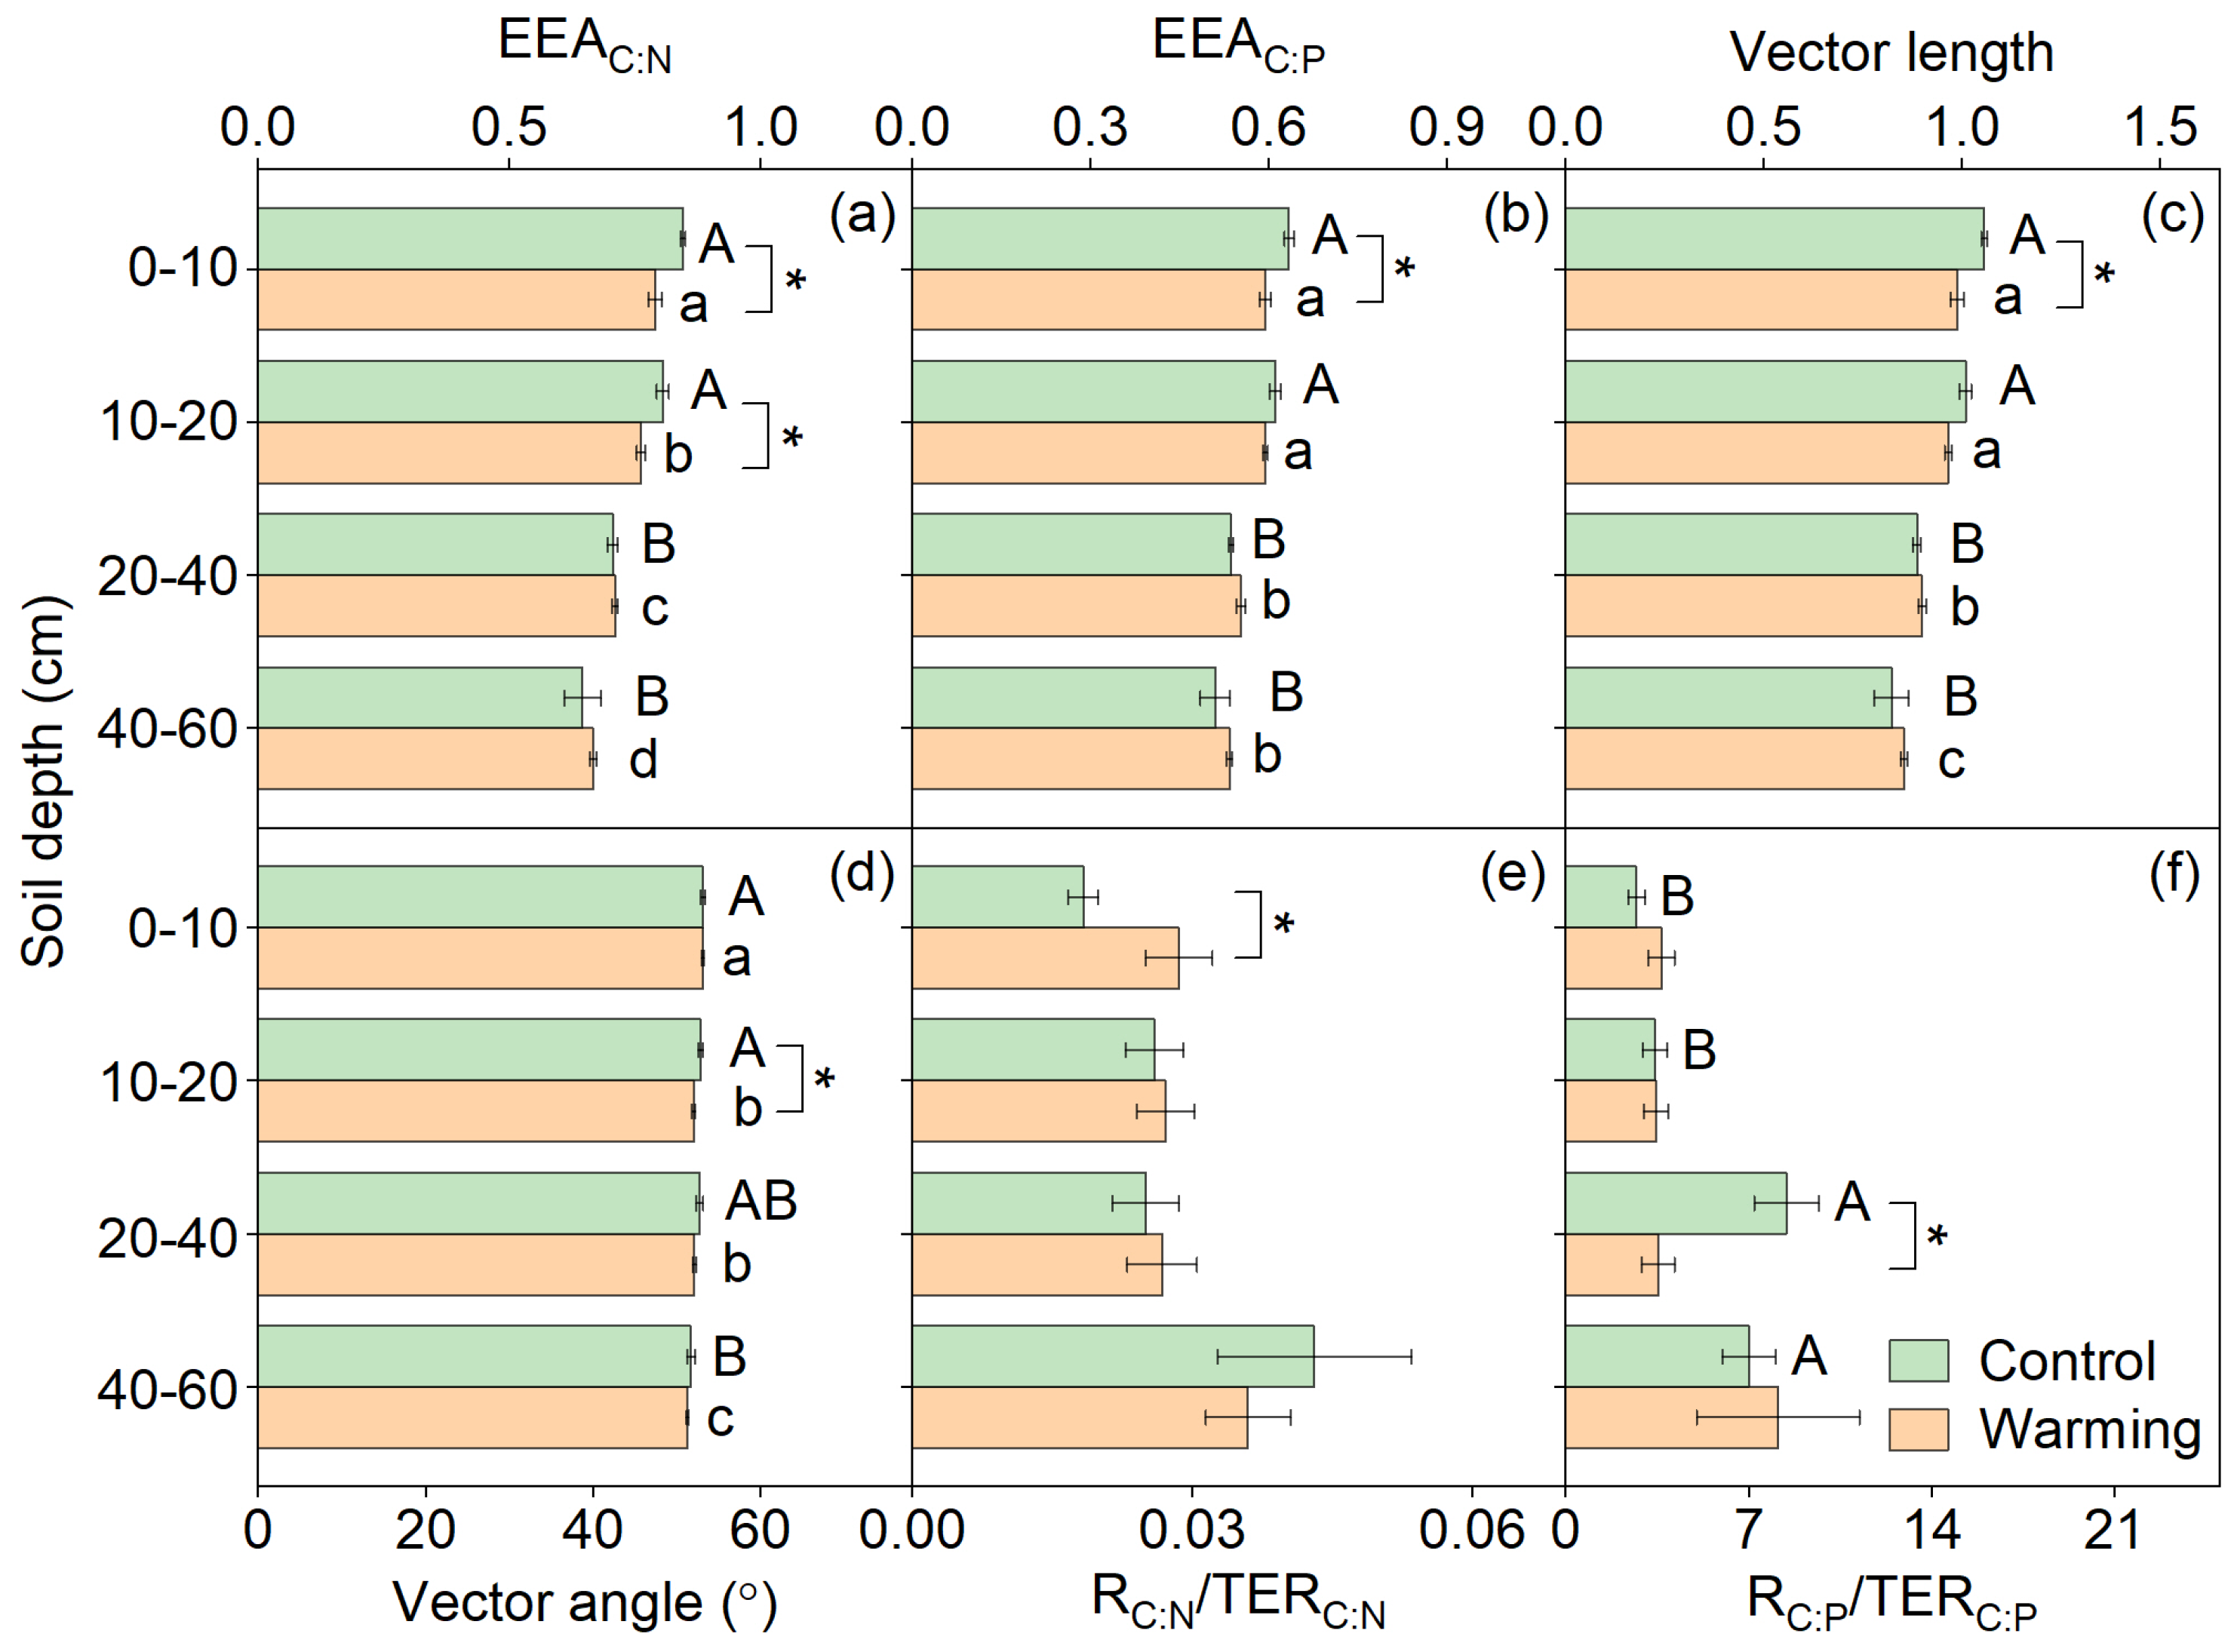
There was no significant interaction between warming and depth in soil enzymatic stoichiometry (Table 1). Along soil depths, enzymatic C:N and C:P ratios were lower than 1 and declined significantly from topsoil to subsoil in both control and warming plots (Figure 2a,b). Meanwhile, warming significantly decreased enzymatic C:N and C:P ratios at the 0–10 cm soil depth, but did not significantly affect these ratios below the 20 cm soil depth (Figure 2a,b). Moreover, most enzymatic C:N and C:P ratios deviated from 1:1 in both treatments (Figure 3). Regarding vector indicators, vector length decreased significantly from topsoil to subsoil in both control and warming plots (Figure 2c). The vector angle was larger than 45° and exhibited a similar vertical pattern to the vector length (Figure 2d). Moreover, at each depth, warming significantly decreased vector length at the 0–10 cm soil depth and vector angle at the 10–20 cm soil depth (Figure 2c,d). In addition, RC:N/TERC:N was lower than 1 in all plots, but did not significantly vary with soil depth for either control or warming treatments (Figure 2e). RC:P/TERC:P was greater than 1 and increased with soil depth only in control plots (Figure 2f). At each depth, warming increased RC:N/TERC:N at the 0–10 cm soil depth and decreased RC:P/TERC:P at the 20–40 cm soil depth (Figure 2e,f).

3.3. Drivers of Soil Enzymatic Stoichiometry

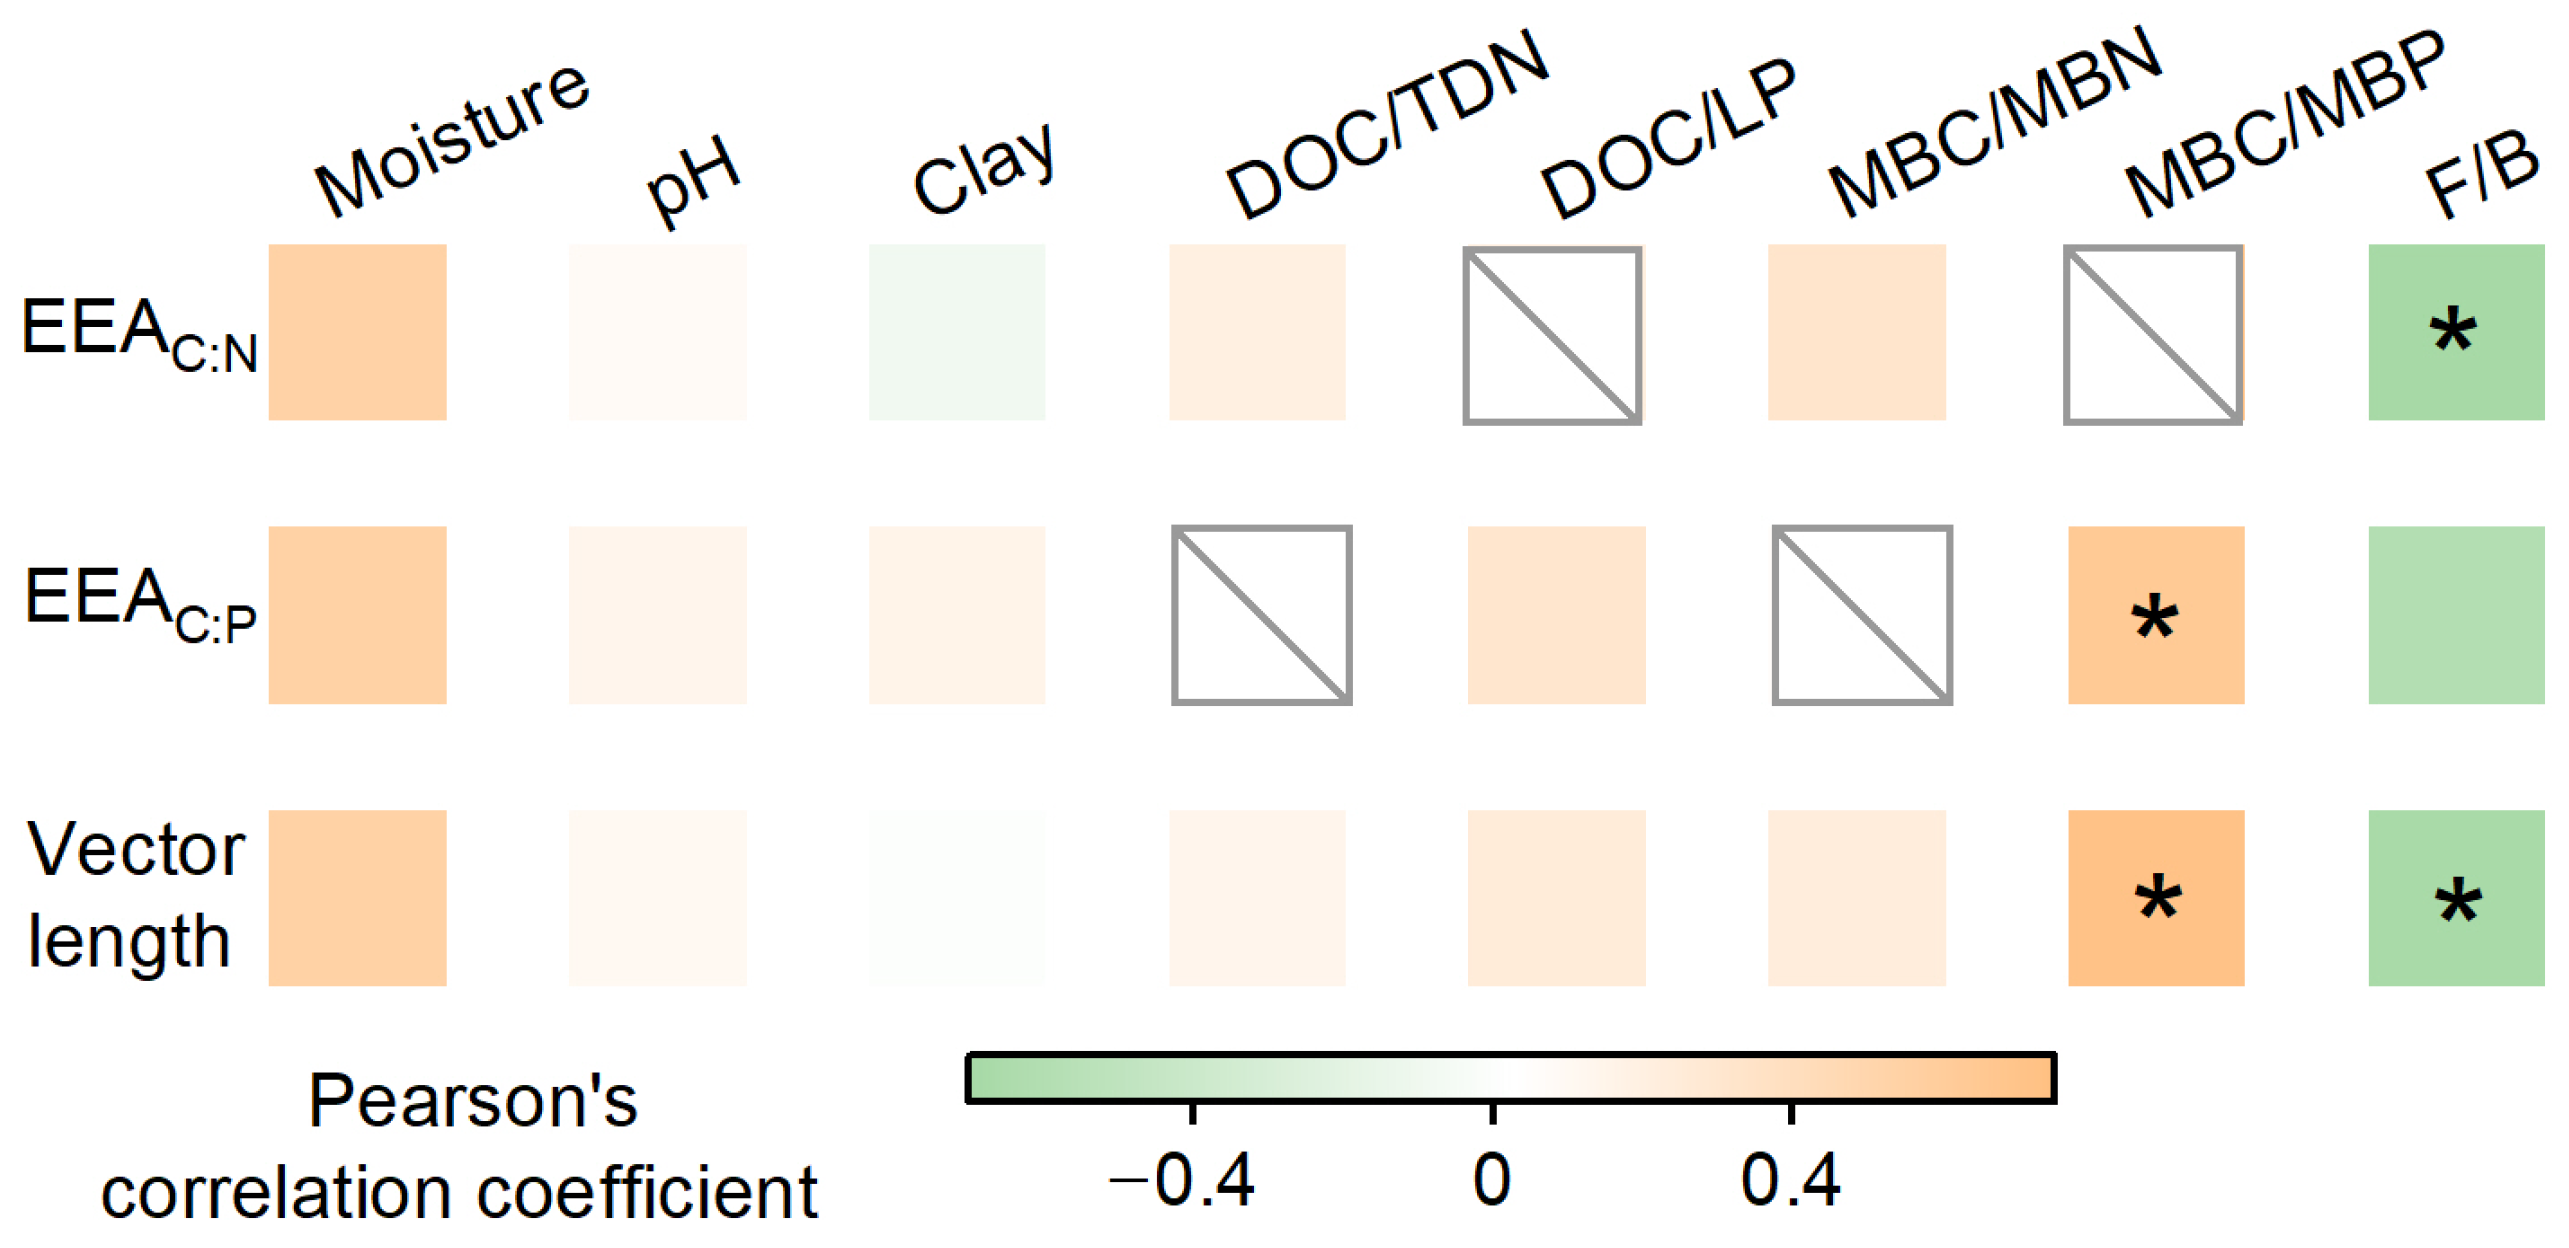
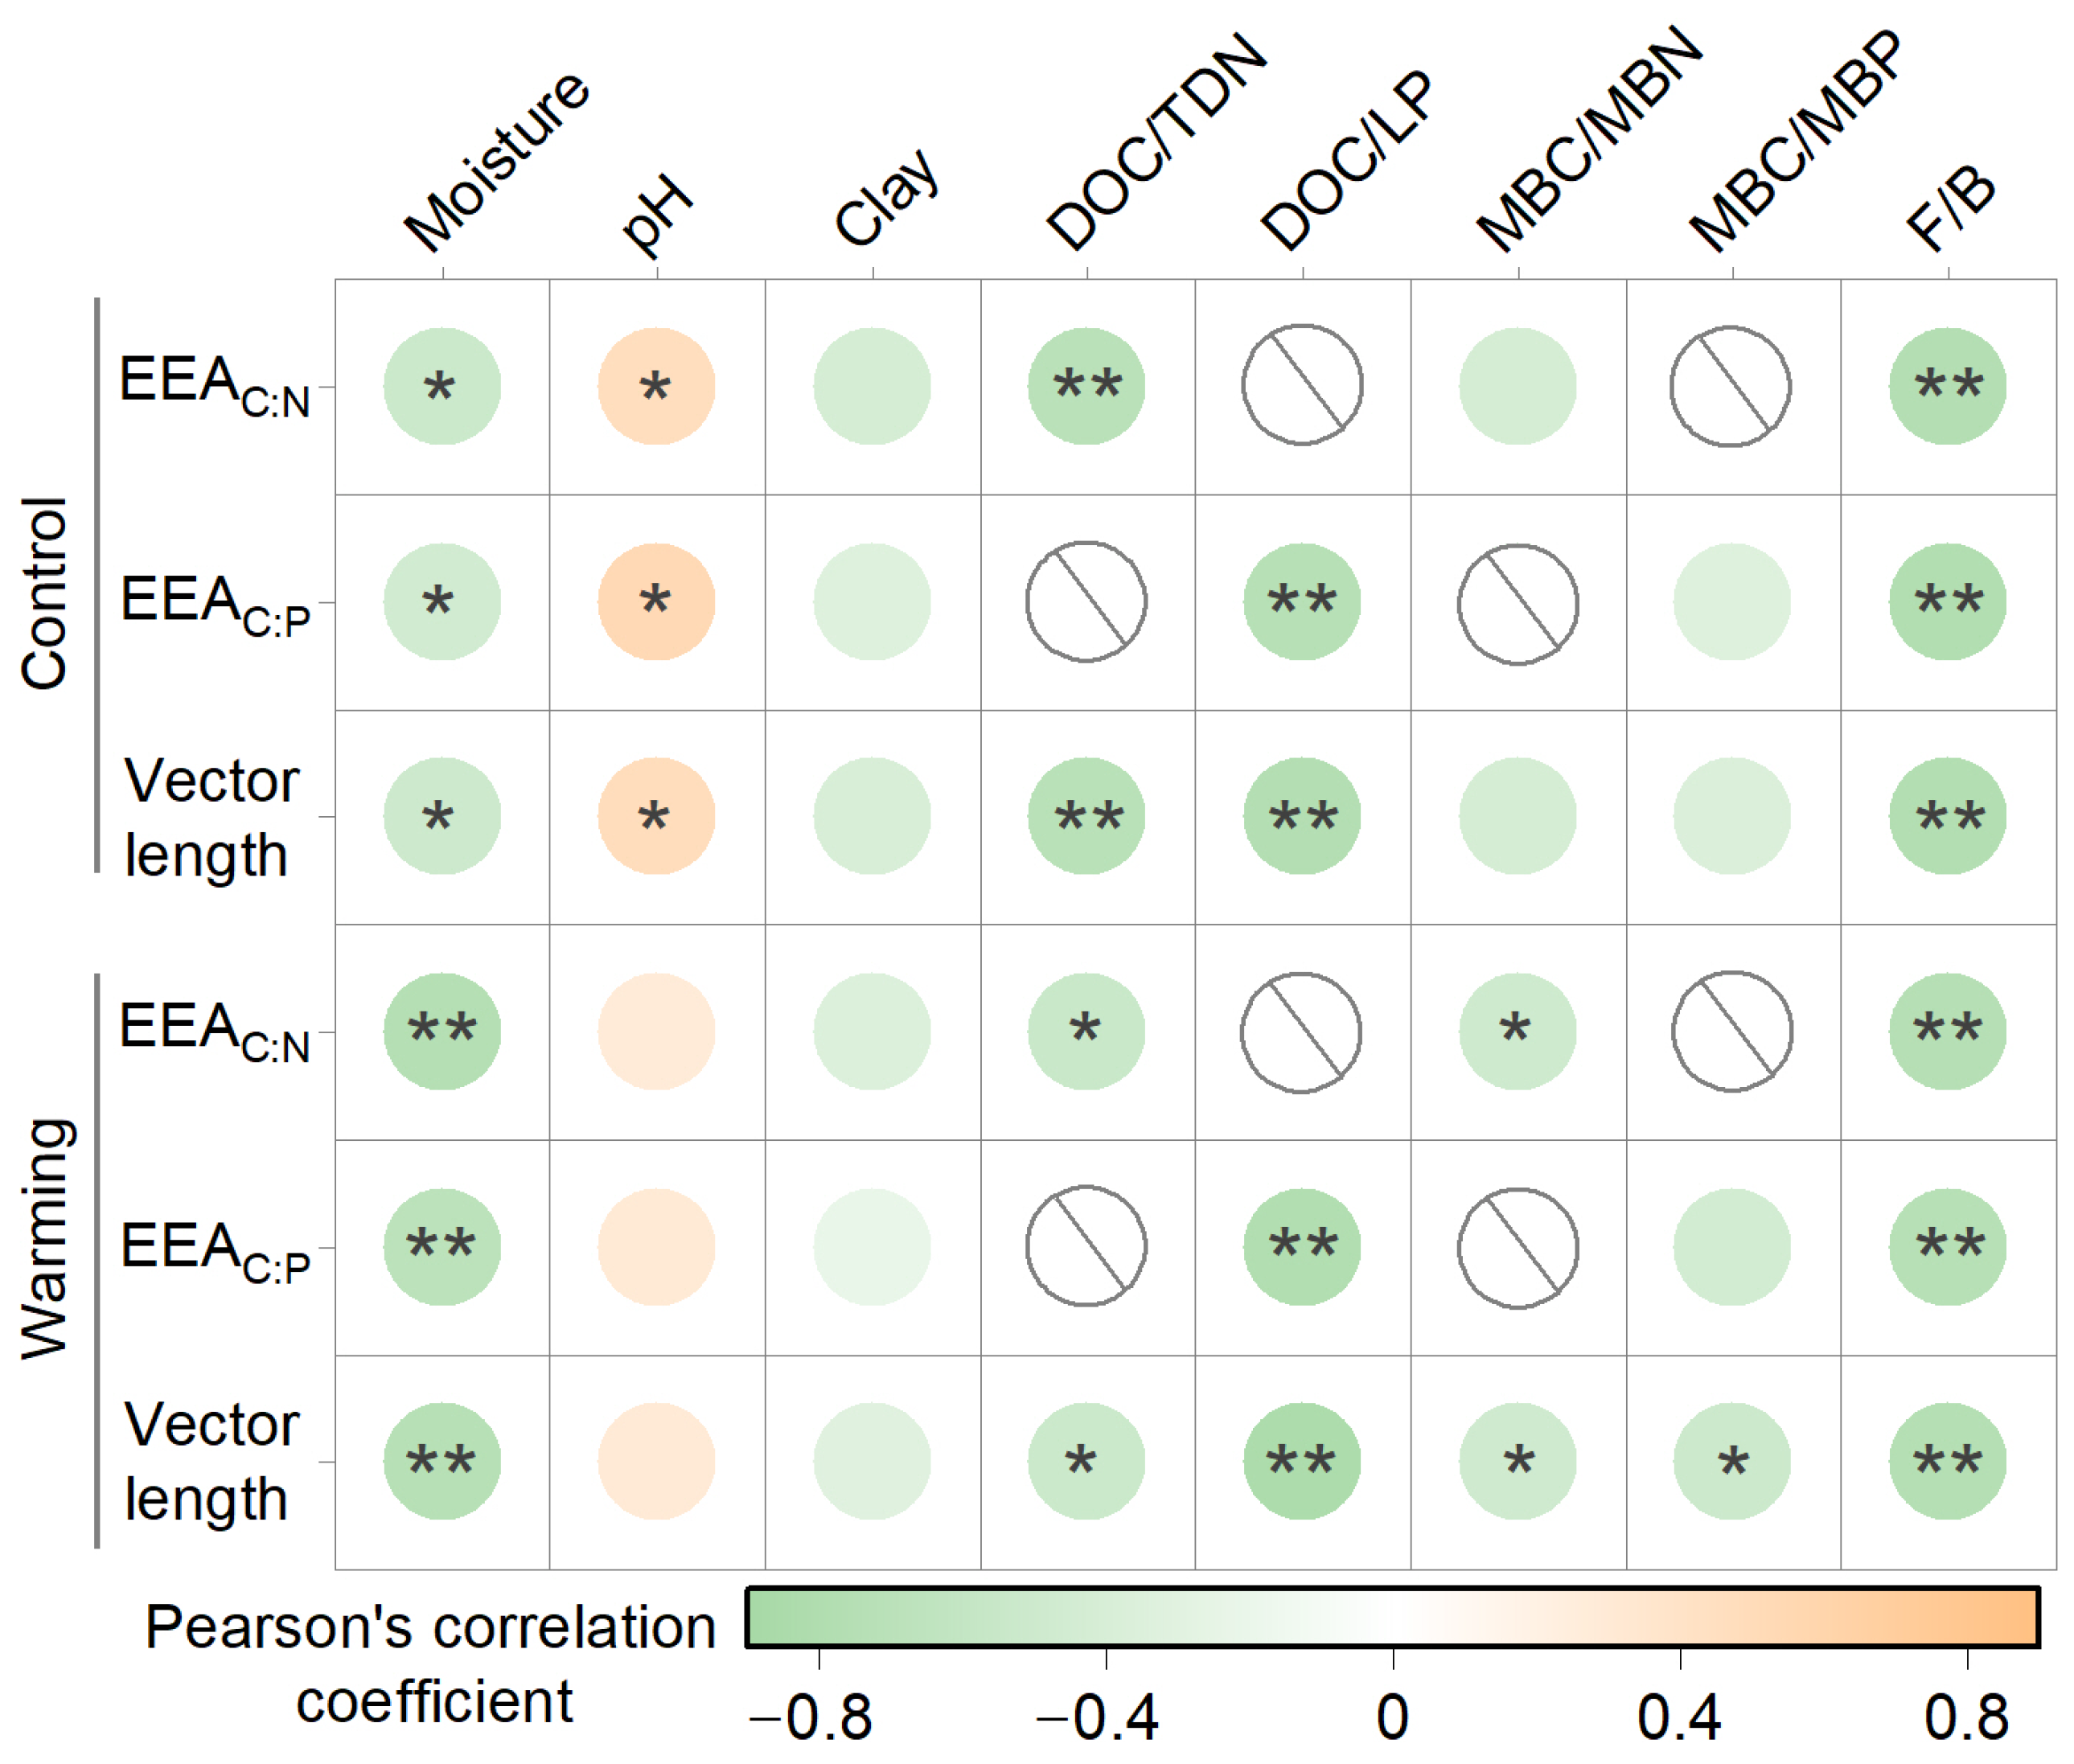
For the control treatment, enzymatic C:N and C:P ratios and vector length were positively correlated with soil pH, while they were negatively associated with the soil moisture, C:N ratio, C:P ratio, and fungal–bacterial ratio within soil profiles (Figure 4). For the warming treatment, the enzymatic C:N ratio was negatively correlated with the soil moisture, C:N ratio, microbial biomass C:N ratio, and fungal–bacterial ratio. The enzymatic C:P ratio had negative relationships with soil moisture, the soil C:P ratio, and the fungal–bacterial ratio. The vector length was negatively correlated with soil moisture, C:N and C:P ratios, microbial biomass C:N and C:P ratios, and the fungal–bacterial ratio across depths (Figure 4). Further analyses showed that soil environmental, substrate, and microbial properties collectively explained 72%–80% of the total variation in soil enzymatic stoichiometry (Figure 5; Table A2). For the control treatment, the soil moisture and fungal–bacterial ratio were the primary drivers of enzymatic C:N and C:P ratios and vector length throughout the soil profile, accounting for 32%–37% and 63%–68% of the total explained variance, respectively (Figure 5). For the warming treatment, the soil moisture (50% of total explained variance) and fungal–bacterial ratio (50% of total explained variance) explained the total variance in the enzymatic C:N ratio. In contrast, the soil C:P ratio (57% and 61% of total explained variance) and fungal–bacterial ratio (43% and 39% of total explained variance) were the main drivers of the enzymatic C:P ratio and vector length, respectively (Figure 5). Notably, at the 0–10 cm soil depth, the negative effects of warming on the enzymatic C:N ratio were correlated with the fungal–bacterial ratio, while those on the enzymatic C:P ratio were associated with the microbial biomass C:P ratio. The negative effects of warming on vector length were related to both the microbial biomass C:P ratio and fungal–bacterial ratio (Figure A2).

4. Discussion

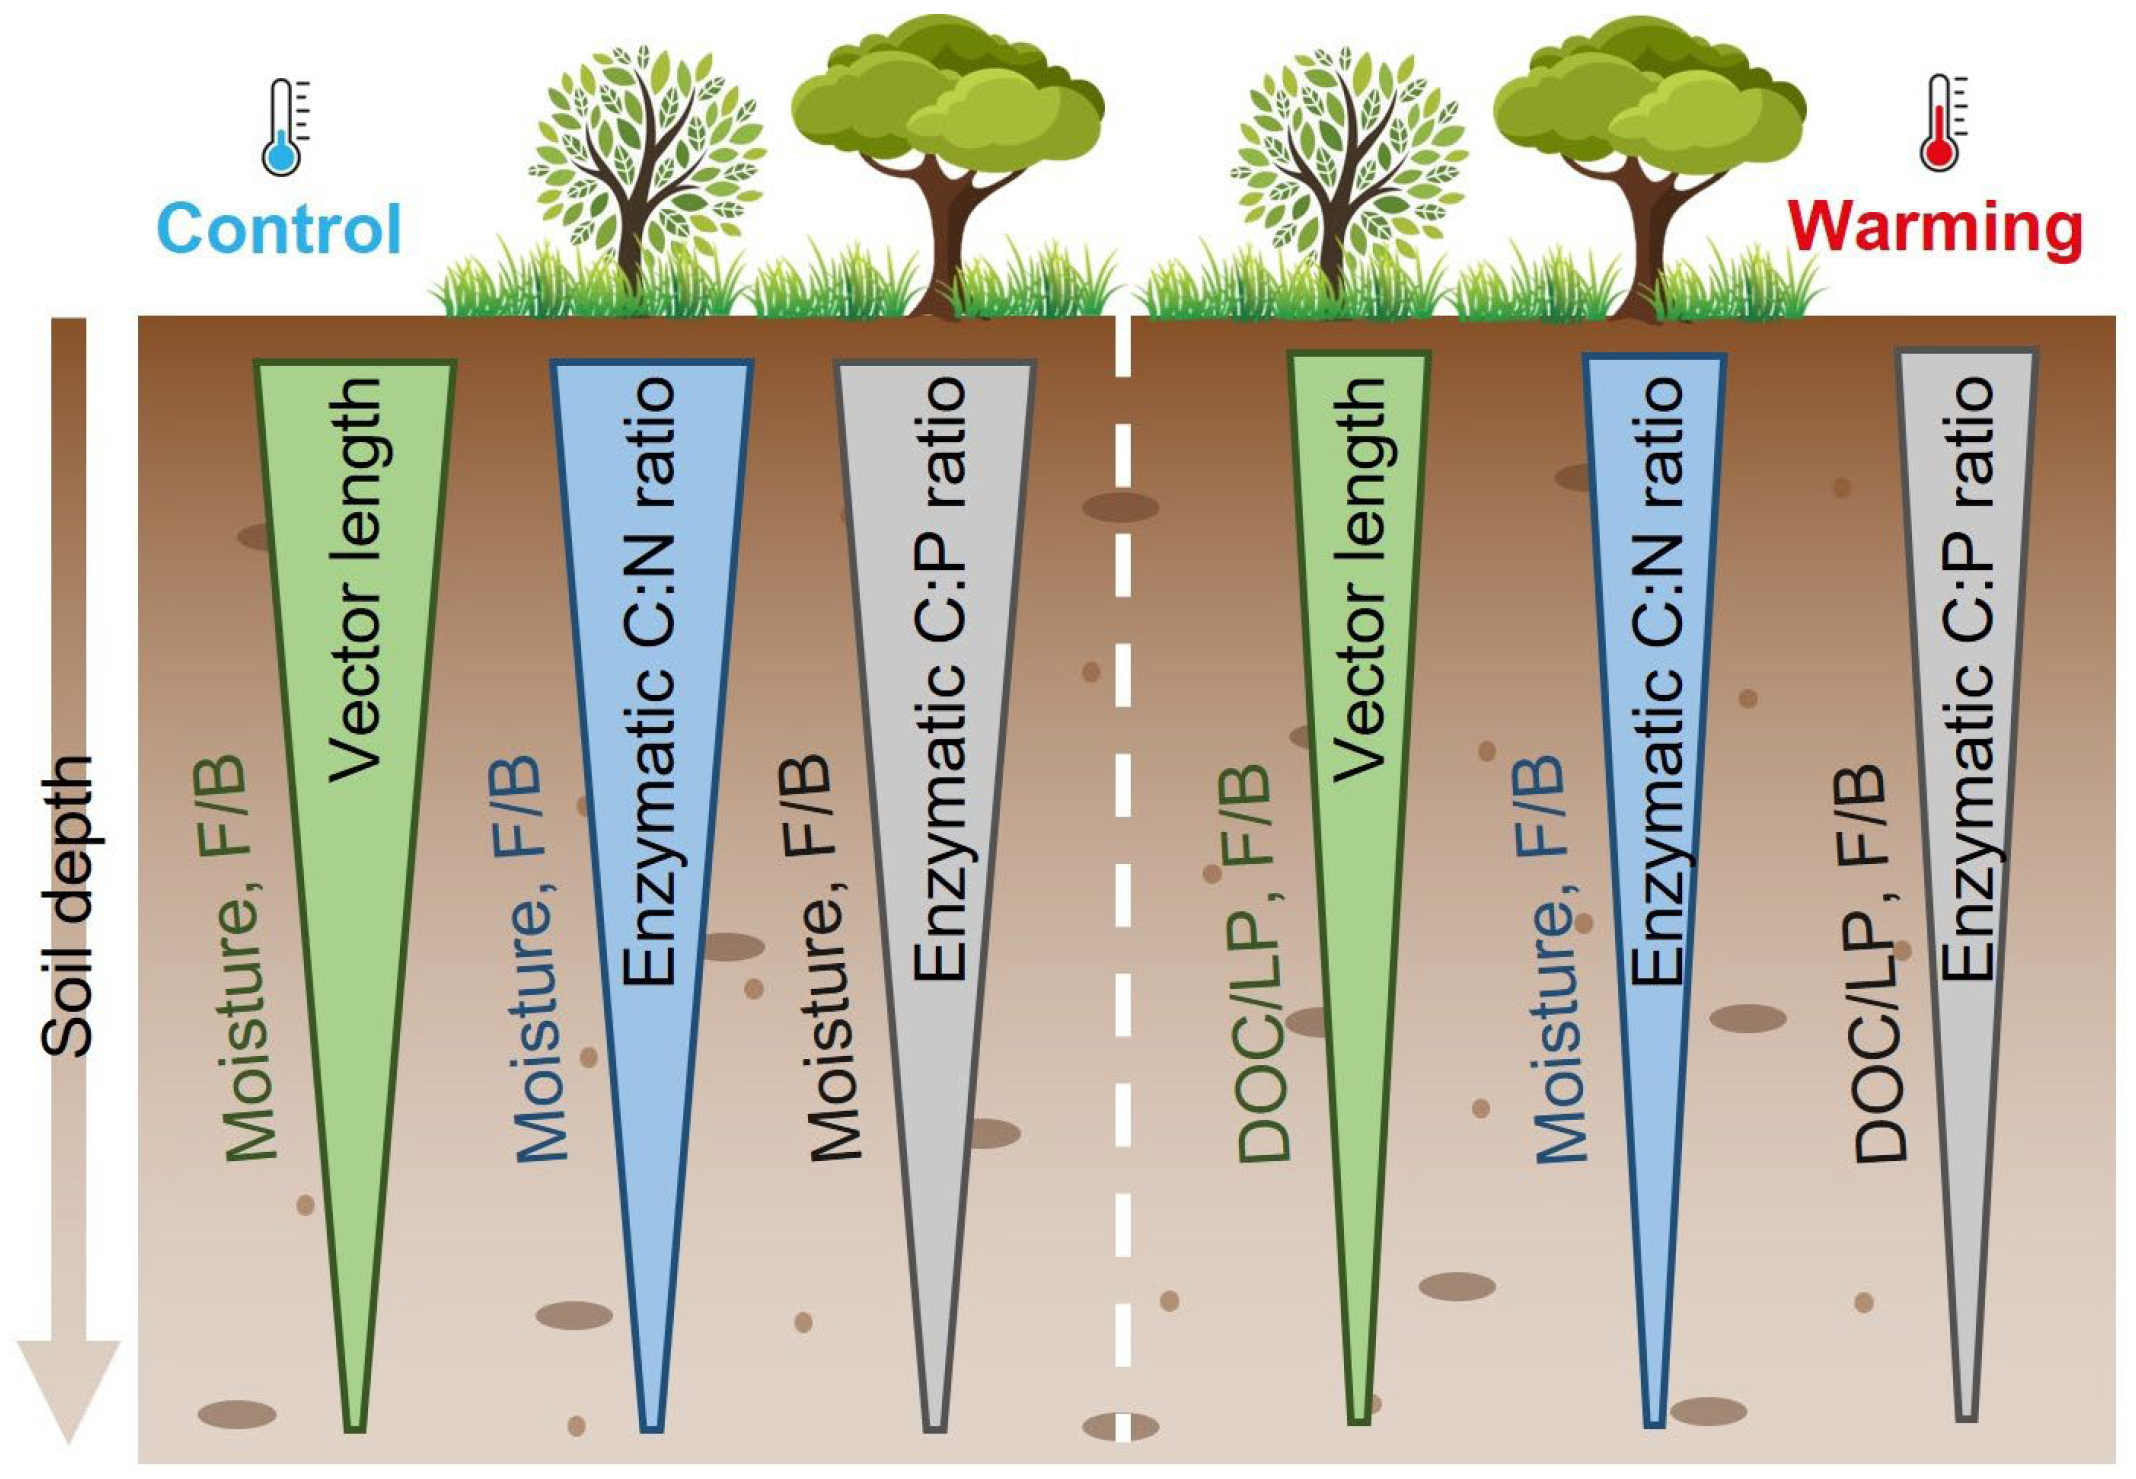
In this study, we furnished experimental evidence for the response of soil microbial resource limitation, characterized by enzymatic stoichiometry, to whole-soil-profile warming and the associated mechanisms in subtropical forests (Figure 6). We observed that vector length, as well as enzymatic C:N and C:P ratios, decreased consistently along the soil profile regardless of warming treatment, indicating alleviated carbon limitation but aggravated nutrient (nitrogen and phosphorus) limitation for microbial metabolism. The vertical variation in the enzymatic C:N ratio was primarily regulated by soil moisture and the fungal–bacterial ratio for both control and warming treatments. In contrast, warming altered the dominant regulators of vertical changes in the vector length and enzymatic C:P ratio, shifting them from the soil moisture and fungal–bacterial ratio to the soil C:P ratio and fungal–bacterial ratio. We further observed that warming decreased vector length as well as enzymatic C:N and C:P ratios in the surface soil layer (0–10 cm), but exhibited no significant effects in deep soil layers, suggesting alleviated microbial carbon limitation and aggravated microbial nutrient limitation in topsoil. The changes in enzymatic stoichiometry in topsoil after warming were related to microbial biomass stoichiometry and the fungal–bacterial ratio.

4.1. Increased Microbial Nutrient Limitation but Decreased C Limitation Across Soil Depths

Our results showed that the arithmetic average enzymatic C:N:P ratio was 1:1.33:1.74 along the soil profile. The enzymatic C:N and C:P ratios across soil depths deviated from 1:1 (Figure 2), indicating relative microbial N and P limitation in this study area [55]. These findings supported the previous view of N and P deficiencies in microbial metabolism in highly weathered forest soils [56]. Meanwhile, the vector angle at all depths was greater than 45° (Figure 2), suggesting that microbes invested more P-acquiring enzymes than N-acquiring enzymes [23]. The dynamics of RC:N/TERC:N and RC:P/TERC:P also confirmed the relatively higher microbial P limitation than N limitation in subtropical forest soils [32]. The intense microbial P limitation observed in this study, characterized by a decreased enzymatic C:P ratio, might primarily be attributed to restricted soil P supply in subtropical forests. On the one hand, highly weathered soils in subtropical forests are typically characterized by P depletion, as most soil P supply originates from rock weathering [33,57]. On the other hand, the acid soil environment may enhance the adsorption of inorganic P on clay minerals, reducing the bioavailability of soil inorganic P [58]. The reduced soil P availability could lead to a P limitation of microbial metabolism. Moreover, the observation of microbial N limitation, characterized by the enzymatic C:N ratio in our study, conflicts with the traditional view of N richness in subtropical forests [32]. This discrepancy might be mainly due to several factors. First, the rate of nitrogen deposition over China significantly declined from 2010 to 2020, especially in subtropical regions, reducing exogenous reactive nitrogen inputs into soils [59]. Second, global climate change, such as the increasing atmospheric carbon dioxide concentration, may reduce the soil available N supply to microbes and plants in terrestrial ecosystems [60,61]. Third, subtropical forests with high net primary productivity usually have a great demand for N [62]. The variation in soil N supply relative to demand might result in N being a limiting resource for microbial metabolism in subtropical forests.
Our results also revealed that enzymatic C:N and C:P ratios significantly decreased with soil depth (Figure 2), suggesting that microorganisms invested more in N- and P-acquiring enzymes rather than C-acquiring enzymes in subsoil, thus intensifying microbial N and P limitation in deep soil layers. In contrast, the vector length significantly decreased with soil depth (Figure 2), highlighting the alleviated microbial C limitation in deep soil layers, a finding consistent with large-scale reports from forests [8,22]. These findings were further supported by the greater increase in specific N- and P-acquiring enzyme activities compared to C-acquiring enzyme activities throughout the soil profile in our study (Figure A1). Additionally, vertical variations in microbial resource limitation along the soil profile were mainly regulated by soil moisture and the fungal–bacterial ratio (Figure 5). The relatively abundant soil water reserves in deep soil layers might be due to the vertical migration of precipitation along the soil profiles [63]. Such water movement could transport dissolved organic matter from topsoil to subsoil [64,65]. The depth of precipitation infiltration might also enhance the quantity of rhizodeposits in deep soil layers by regulating plant rooting depth [63,66]. Meanwhile, the relatively higher fungal–bacterial ratio in deep soil layers might be linked to recalcitrant substrates, supported by the higher ratio of mineral-associated organic C to particulate organic C in subsoil in subtropical forests [67]. The increased relative abundance of fungi with soil depth might accelerate the decomposition of recalcitrant compounds [68], further confirmed by the higher oxidase enzyme activities in deep soil than in surface soil layers in subtropical forests [23]. Based on this, the relatively increased soil available substrate content due to variations in the soil moisture and fungal–bacterial ratio could reduce microbial C limitation along the soil profile. Similarly, relative soil nutrient supply might also increase in deep soil layers due to the increasing soil moisture and fungal–bacterial ratio across depths [65,66]. However, considerable N and P co-deficiencies in forest growth in tropic–subtropic regions might intensify nutrient uptake competition between plants and soil microbes [69], causing an increased nutrient limitation for microbial metabolism along the soil profile. This deduction is supported by a large-scale study of forests, which declared that the effects of the vegetation index on microbial P limitation increased from topsoil to subsoil [8]. Notably, microbial properties exhibited stronger effects on vertical changes in microbial resource limitation than soil physiochemical properties (Figure 5). This phenomenon might be because microbes directly regulate microbial metabolism by influencing enzyme production [23].

4.2. Limited Warming Effects on Microbial Resource Limitation

Our results showed that the enzymatic C:N and C:P ratios and vector angle under warming treatment exhibited a similar vertical pattern to those under the control treatment (Figure 2), highlighting persistent microbial nutrient limitation even under global warming [55]. Meanwhile, enzymatic C:N and C:P ratios and vector length decreased with soil depth under warming treatment (Figure 2), emphasizing that depth had a stronger effect on microbial resource limitation than climate change [19]. The vertical pattern of microbial resource limitation observed in our study was contrary to recent reports in the subtropics [24]. Compared with the young plantations in previous research, the evergreen broadleaf natural forests in our study could support greater biomass accumulation and plant diversity [24,70]. Natural forests might thus have greater photosynthate accumulation in soils and plant nutrient demand than young plantations, resulting in different patterns of microbial resource limitation in these two subtropical studies. Moreover, vertical changes in microbial N limitation, characterized by the enzymatic C:N ratio under warming treatment, were mainly explained by soil moisture and the fungal–bacterial ratio (Figure 5). Warming usually has greater stimulative effects on water evapotranspiration in topsoil than in subsoil [25]. The remarkable reduction in soil moisture in the surface soil layer may increase fungal dominance, as fungi show greater resistance and resilience to environmental change than bacteria [71]. This view was confirmed by the decreased soil moisture and increased fungal–bacterial ratio in topsoil in our study (Figure 1), leading to the increasing pattern of the soil moisture and fungal–bacterial ratio along soil profiles. As described above, an increased soil moisture and fungal–bacterial ratio with soil depth might improve soil available N content in deep soil profiles. Nevertheless, warming could also enhance plant N demand [72]. It has been reported that plant N uptake could increase by 32.7%–118.6% after warming in the tropics and subtropics [6]. The plant N demand might be insufficiently fulfilled by belowground N supply due to the mismatch between N supply and demand in terms of quantity and time [6,73]. This phenomenon could then aggravate the plant–microbe competition for N, leading to the relatively higher microbial N limitation in the deep soil layers. Unlike microbial N limitation, vertical variations in microbial C and P limitation in warming plots were mainly regulated by the soil C:P ratio and fungal–bacterial ratio (Figure 5). This result supports the prevalent view that soil resource supply determines microbial resource limitation [23]. The vertical transport of dissolved organic matter and deep roots, as described above, may lead to a relatively higher soil C:P ratio in deep soil layers [63]. A high soil C:P ratio indicates P deficiency but C adequacy in the available substrate provision [74]. The increased soil C:P ratio along the soil profile might alleviate microbial C limitation and intensify P limitation in deep soil layers. Moreover, the negative effects of the fungal–bacterial ratio on microbial C limitation, characterized by vector length, might be attributed to increased fungal abundance facilitating the decomposition of recalcitrant soil organic matter [68]. The positive relationship between the fungal–bacterial ratio and microbial P limitation, characterized by the enzymatic C:P ratio, might be explained by the P deficiencies in vegetation growth and great plant P demand in subtropic regions [32]. Notably, after warming, the regulatory effect of microbial properties on enzymatic stoichiometry weakened, while the effect of soil physiochemical properties on enzymatic stoichiometry strengthened (Figure 5). Such a phenomenon might be caused by the decreased inputs of available substrate. Specifically, the reduced water content in surface soil under warming treatment might inhibit litter decomposition [75]. Long-term warming might also lead to the acclimation of soil organic matter decomposition to temperature changes [76]. The restricted decomposition of plant residues and soil organic matter could reduce available substrate supply, confirmed by the negative effects of warming on dissolved substrate content in our study (Figure A3, Table A1). The decreased substrate availability might influence microbial metabolism and then weaken the effects of microbial properties on microbial resource limitation characterized by enzymatic stoichiometry.
Our results also indicated that warming significantly decreased enzymatic C:N and C:P ratios and vector length at the 0–10 cm soil depth (Figure 2). Such a change in enzymatic stoichiometry metrics illustrated that warming intensified microbial nutrient limitation and alleviated microbial C limitation in the surface soil [77,78]. This finding was contrary to observations in other studies from subtropical regions [24]. This difference might be caused by a lower demand for C due to the declined microbial biomass and higher demand for nutrients because of great plant productivity in natural forests in our study [24] (Figure A3). Moreover, the warming effects on microbial resource limitation were mainly related to the fungal–bacterial ratio and microbial biomass C:P ratio (Figure A2). The increased fungal dominance (i.e., increased fungal–bacterial ratio) after warming might accelerate the decomposition of recalcitrant substrates and then alleviate microbial C limitation [79]. Despite nutrient release from recalcitrant compounds, the increased plant N demand due to warming might exacerbate microbial N limitation [6,73]. Furthermore, the decreased microbial biomass C:P ratio under warming treatment in this study was caused by reduced microbial biomass C and constant microbial biomass P (Figure A3). This finding highlights the viewpoint that microbial stoichiometry plays a vital role in regulating microbial resource limitation [23]. The decrease in the microbial biomass C:P ratio meant that microbes required less C compared with P during physiological and metabolic processes [19], leading to stronger microbial P limitation and weaker microbial C limitation. Unlike in the surface soil, enzymatic stoichiometry indicators below the 20 cm soil depth exhibited no significant response to warming, indicating the vanished regulatory effect of warming on microbial resource limitation in deep soil layers. These results conflict with a previous study which found that warming decreased microbial C limitation and increased microbial N limitation in deep soil layers [24]. Such a contradiction might be ascribed to the nonsignificant response of soil physiochemical and microbial properties to warming in deep soil profiles. Warming usually decreases soil water content and stimulates the decomposition of soil organic matter, which may trigger negative or positive effects on microbial metabolism [80,81]. However, no significant effects of warming on soil moisture and substrate supply, such as dissolved organic C, total dissolved N, and available P, were observed in deep soil in our study (Figure A3). Such a phenomenon might be caused by the limited water evapotranspiration and microbial activity in deep soil layers [82]. Furthermore, a similar pattern of microbial biomass and community structure (indicated by the fungal–bacterial ratio) was also observed in subsoil (Figure A3). Such a phenomenon might be linked to microbial thermal acclimation, which had been observed in other whole-soil-profile warming studies [26]. The constant soil moisture, substrate supply, and microbial community might cause no significant response of microbial nutrient limitation to warming.

5. Conclusions

In summary, based on a manipulative field experiment with whole-soil-profile warming (0–60 cm), this study investigated the response of microbial resource limitation, indicated by enzymatic stoichiometry, to soil warming in subtropical forests. Our findings have three important implications. First, warming did not significantly alter the vertical pattern of microbial resource limitation, suggesting that soil depth played a stronger regulatory role than climate change in microbial metabolism [26]. The importance of soil depth in analyzing microbial resource limitation should be integrated into biogeochemical models to better understand global biogeochemical cycles. Second, the dominant drivers of vertical variations in microbial resource limitation shifted from soil moisture and microbial properties to substrate and microbial properties after warming. This shift emphasizes the significance of substrate availability in microbial metabolism under climate warming scenarios. Third, warming exacerbated microbial nutrient (N and P) limitation and alleviated C limitation in surface soils. This observation conflicts with the previous view that warming might alleviate microbial N limitation due to the accelerated decomposition of soil organic matter under warming [83]. The difference in the microbial response to warming highlights that the long-term standing pattern may not be simply extended to the subtropics with low C availability.

Author Contributions

Conceptualization, C.M., Z.Y. and Y.Y.; methodology, D.X., C.X. and S.C.; investigation, Y.W.; writing—original draft preparation, C.M.; writing—review and editing, C.M.; funding acquisition, C.M. All authors have read and agreed to the published version of the manuscript.

Funding

This research was funded by National Key Research and Development Program of China (2023YFE0124000), National Natural Science Foundation of China (32201354).

Data Availability Statement

The original contributions presented in this study are included in the article. Further inquiries can be directed to the corresponding authors.

Conflicts of Interest

The authors declare no conflicts of interest.

Abbreviations

The following abbreviations are used in this manuscript:
EEAC:Nenzymatic C:N ratio
EEAC:Penzymatic C:P ratio
RC:N/TERC:Nratio of soil C:N ratio to threshold elemental ratio model
RC:P/TERC:Pratio of soil C:P ratio to threshold elemental ratio model
BGβ-1,4-glucosidase
CBHβ-D-cellobiosidase
NAGβ-1,4-N-acetylglucosaminidase
LAPleucine aminopeptidase
APacid phosphatase
DOC/TDNsoil C:N ratio
DOC/LPsoil C:P ratio
MBC/MBNmicrobial biomass C:N ratio
MBC/MBPmicrobial biomass C:P ratio
F/Bfungal–bacterial ratio

Appendix A

Figure A1. Effects of warming and soil depth on soil enzyme activity of (a) BG, (b) CBH, (c) NAG, (d) LAP and (e) AP normalized by soil, as well as (f) BG, (g) CBH, (h) NAG, (i) LAP and (j) AP normalized by soil total C content. BG—β-1,4-glucosidase; CBH—β-D-cellobiosidase; NAG—β-1,4-N-acetylglucosaminidase; LAP—leucine aminopeptidase; AP—acid phosphatase. Data in bar graphs are presented as the mean ± SE. Different uppercase and lowercase letters in the bar graphs indicate significant differences across depths for the control and warming treatments, respectively. Asterisks in the bar graphs represent significant differences between control and warming treatments at each soil depth. * p < 0.05; ** p < 0.01.
Forests 16 00402 g0a1
Figure A2. The correlations of soil enzyme stoichiometry with explanatory variables at the 0–10 cm soil depth. EEAC:N—enzymatic C:N ratio; EEAC:P—enzymatic C:P ratio; DOC/TDN—soil C:N ratio; DOC/LP—soil C:P ratio; MBC/MBN—microbial biomass C:N ratio; MBC/MBP—microbial biomass C:P ratio; F/B—fungal–bacterial ratio. * p < 0.05.
Forests 16 00402 g0a2
Figure A3. Effects of warming and soil depth on (a) DOC, (b) TDN, (c) LP, (d) MBC, (e) MBN, (f) MBP, (g) bacteria and fungi (h). DOC—dissolved organic C; TDN—total dissolved N; LP—available P; MBC—microbial biomass C; MBN—microbial biomass N; MBP—microbial biomass P. Data in bar graphs are presented as the mean ± SE. Different uppercase and lowercase letters in the bar graphs indicate significant differences across depths for the control and warming treatments, respectively. Asterisks in the bar graphs represent significant differences between control and warming treatments at each soil depth. * p < 0.05; ** p < 0.01.
Forests 16 00402 g0a3
Table A1. The main effects of warming, depth, and their interaction on soil enzyme activity based on linear mixed-effects models.
VariablesWarmingDepthWarming × Depth
FpFpFp
BG (nmol g−1 soil h−1)41.36<0.0161.25<0.017.75<0.01
CBH (nmol g−1 soil h−1)11.71<0.0143.68<0.011.950.13
NAG (nmol g−1 soil h−1)17.51<0.0152.39<0.011.270.29
LAP (nmol g−1 soil h−1)3.140.0819.76<0.010.011.00
AP (nmol g−1 soil h−1)13.62<0.0147.54<0.011.740.16
BG (μmol g−1 soil h−1)1.25 0.27 28.14 <0.010.25 0.86
CBH (μmol g−1 soil h−1)1.130.2910.29<0.012.870.04
NAG (μmol g−1 soil h−1)0.04 0.84 40.40 <0.010.11 0.95
LAP (μmol g−1 soil h−1)0.90 0.34 34.66 <0.010.30 0.83
AP (μmol g−1 soil h−1)0.20 0.65 17.32 <0.010.42 0.74
Table A2. Optimal explanatory variables for soil enzyme stoichiometry based on multi-model selection.
Response VariablesExplanatory VariablesAICcR2
EEAC:N under controlMoisture + Fungal–bacterial ratio−56.40.74
EEAC:N under warmingMoisture + Fungal–bacterial ratio−78.20.73
EEAC:P under controlMoisture + Fungal–bacterial ratio−71.60.72
EEAC:P under warmingSoil C:P ratio + Fungal–bacterial ratio−98.90.72
Vector length under controlMoisture + Fungal–bacterial ratio−49.70.74
Vector length under warmingSoil C:P ratio + Fungal–bacterial ratio−79.20.80

References

  1. IPCC. Climate Change 2021: The Physical Science Basis; Contribution of Working Group I to the Sixth Assessment Report of the Intergovernmental Panel on Climate Change; IPCC: Geneva, Switzerland, 2021. [Google Scholar]
  2. Quan, Q.; Zhang, F.; Jiang, L.; Chen, H.Y.H.; Wang, J.; Ma, F.; Song, B.; Niu, S. High-level rather than low-level warming destabilizes plant community biomass production. J. Ecol. 2021, 109, 1607–1617. [Google Scholar] [CrossRef]
  3. Yu, J.; Bing, H.; Chang, R.; Cui, Y.; Shen, G.; Wang, X.; Zhang, S.; Fang, L. Microbial metabolic limitation response to experimental warming along an altitudinal gradient in alpine grasslands, eastern Tibetan Plateau. CATENA 2022, 214, 106243. [Google Scholar] [CrossRef]
  4. Dove, N.C.; Torn, M.S.; Hart, S.C.; Taş, N. Metabolic capabilities mute positive response to direct and indirect impacts of warming throughout the soil profile. Nat. Commun. 2021, 12, 2089. [Google Scholar] [CrossRef] [PubMed]
  5. Marañón-Jiménez, S.; Peñuelas, J.; Richter, A.; Sigurdsson, B.D.; Fuchslueger, L.; Leblans, N.I.W.; Janssens, I.A. Coupled carbon and nitrogen losses in response to seven years of chronic warming in subarctic soils. Soil Biol. Biochem. 2019, 134, 152–161. [Google Scholar] [CrossRef]
  6. Lie, Z.; Huang, W.; Liu, X.; Zhou, G.; Yan, J.; Li, Y.; Huang, C.; Wu, T.; Fang, X.; Zhao, M.; et al. Warming leads to more closed nitrogen cycling in nitrogen-rich tropical forests. Glob. Change Biol. 2020, 27, 664–674. [Google Scholar] [CrossRef] [PubMed]
  7. Moorhead, D.L.; Rinkes, Z.L.; Sinsabaugh, R.L.; Weintraub, M.N. Dynamic relationships between microbial biomass, respiration, inorganic nutrients and enzyme activities: Informing enzyme-based decomposition models. Front. Microbiol. 2013, 4, 223. [Google Scholar] [CrossRef] [PubMed]
  8. Cui, Y.; Bing, H.; Moorhead, D.L.; Delgado-Baquerizo, M.; Ye, L.; Yu, J.; Zhang, S.; Wang, X.; Peng, S.; Guo, X.; et al. Ecoenzymatic stoichiometry reveals widespread soil phosphorus limitation to microbial metabolism across Chinese forests. Commun. Earth Environ. 2022, 3, 184. [Google Scholar] [CrossRef]
  9. Sinsabaugh, R.L.; Hill, B.H.; Follstad Shah, J.J. Ecoenzymatic stoichiometry of microbial organic nutrient acquisition in soil and sediment. Nature 2009, 462, 795–798. [Google Scholar] [CrossRef] [PubMed]
  10. Xu, H.; Wang, M.; You, C.; Tan, B.; Xu, L.; Li, H.; Zhang, L.; Wang, L.; Liu, S.; Hou, G.; et al. Warming effects on C:N:P stoichiometry and nutrient limitation in terrestrial ecosystems. Soil Till. Res. 2024, 235, 105896. [Google Scholar] [CrossRef]
  11. Cai, M.; Zhang, Y.; Zhao, G.; Zhao, B.; Cong, N.; Zhu, J.; Zheng, Z.; Wu, W.; Duan, X. Excessive climate warming exacerbates nitrogen limitation on microbial metabolism in an alpine meadow of the Tibetan Plateau: Evidence from soil ecoenzymatic stoichiometry. Sci. Total Environ. 2024, 930, 172731. [Google Scholar] [CrossRef] [PubMed]
  12. Zheng, H.; Liu, Y.; Chen, Y.; Zhang, J.; Li, H.; Wang, L.; Chen, Q. Short-term warming shifts microbial nutrient limitation without changing the bacterial community structure in an alpine timberline of the eastern Tibetan Plateau. Geoderma 2020, 360, 113985. [Google Scholar] [CrossRef]
  13. Li, H.; Tian, H.; Wang, Z.; Liu, C.; Nurzhan, A.; Megharaj, M.; He, W. Potential effect of warming on soil microbial nutrient limitations as determined by enzymatic stoichiometry in the farmland from different climate zones. Sci. Total Environ. 2022, 802, 149657. [Google Scholar] [CrossRef]
  14. Button, E.S.; Pett-Ridge, J.; Murphy, D.V.; Kuzyakov, Y.; Chadwick, D.R.; Jones, D.L. Deep-C storage: Biological, chemical and physical strategies to enhance carbon stocks in agricultural subsoils. Soil Biol. Biochem. 2022, 170, 108697. [Google Scholar] [CrossRef]
  15. Hicks Pries, C.E.; Sulman, B.N.; West, C.; O’Neill, C.; Poppleton, E.; Porras, R.C.; Castanha, C.; Zhu, B.; Wiedemeier, D.B.; Torn, M.S. Root litter decomposition slows with soil depth. Soil Biol. Biochem. 2018, 125, 103–114. [Google Scholar] [CrossRef]
  16. Li, J.; Ding, J.; Yang, S.; Zhao, L.; Li, J.; Huo, H.; Wang, M.; Tan, J.; Cao, Y.; Ren, S.; et al. Depth-dependent driver of global soil carbon turnover times. Soil Biol. Biochem. 2023, 185, 109149. [Google Scholar] [CrossRef]
  17. Qin, S.; Chen, L.; Fang, K.; Zhang, Q.; Wang, J.; Liu, F.; Yu, J.; Yang, Y. Temperature sensitivity of SOM decomposition governed by aggregate protection and microbial communities. Sci. Adv. 2019, 5, 03. [Google Scholar] [CrossRef] [PubMed]
  18. He, L.; Sun, X.; Li, S.; Zhou, W.; Chen, Z.; Bai, X. The vertical distribution and control factor of microbial biomass and bacterial community at macroecological scales. Sci. Total Environ. 2023, 869, 161754. [Google Scholar] [CrossRef] [PubMed]
  19. Chen, X.; Feng, J.; Ding, Z.; Tang, M.; Zhu, B. Changes in soil total, microbial and enzymatic C-N-P contents and stoichiometry with depth and latitude in forest ecosystems. Sci. Total Environ. 2022, 816, 151583. [Google Scholar] [CrossRef] [PubMed]
  20. Chen, Y.; Feng, J.; Yuan, X.; Zhu, B. Effects of warming on carbon and nitrogen cycling in alpine grassland ecosystems on the Tibetan Plateau: A meta-analysis. Geoderma 2020, 370, 114363. [Google Scholar] [CrossRef]
  21. Zuo, Y.; Li, J.; Zeng, H.; Wang, W. Vertical pattern and its driving factors in soil extracellular enzyme activity and stoichiometry along mountain grassland belts. Biogeochemistry 2018, 141, 23–39. [Google Scholar] [CrossRef]
  22. He, H.; Xu, M.; Li, W.; Chen, L.; Chen, Y.; Moorhead, D.L.; Brangarí, A.C.; Liu, J.; Cui, Y.; Zeng, Y.; et al. Linking soil depth to aridity effects on soil microbial community composition, diversity and resource limitation. CATENA 2023, 232, 107393. [Google Scholar] [CrossRef]
  23. Wu, L.; Zou, B.; Wang, S.; Zhou, L.; Zheng, Y.; Huang, Z.; He, J.-Z. Effects of multispecies restoration on soil extracellular enzyme activity stoichiometry in Pinus massoniana plantations of subtropical China. Soil Biol. Biochem. 2023, 178, 108967. [Google Scholar] [CrossRef]
  24. Zheng, W.; Lin, W.; Fan, Y.; Li, Y.; Zhou, J.; Zheng, Y.; Chen, S.; Liu, X.; Xiong, D.; Xu, C.; et al. Divergent effects of short-term warming on microbial resource limitation between topsoil and subsoil in a young subtropical Chinese fir forest. Biogeochemistry 2023, 163, 185–199. [Google Scholar] [CrossRef]
  25. Jia, L.; Jiang, Q.; Sun, J.; Robinson, D.; Yang, Z.; Yao, X.; Wang, X.; Dai, X.; Chen, T.; Wu, D.; et al. Contrasting depth-related fine root plastic responses to soil warming in a subtropical Chinese fir plantation. J. Ecol. 2024, 112, 1058–1073. [Google Scholar] [CrossRef]
  26. Zhang, Q.; Qin, W.; Feng, J.; Li, X.; Zhang, Z.; He, J.-S.; Schimel, J.P.; Zhu, B. Whole-soil-profile warming does not change microbial carbon use efficiency in surface and deep soils. Proc. Natl. Acad. Sci. USA 2023, 120, e2302190120. [Google Scholar] [CrossRef] [PubMed]
  27. Malhi, Y. The carbon balance of tropical forest regions, 1990–2005. Curr. Opin. Environ. Sustain. 2010, 2, 237–244. [Google Scholar] [CrossRef]
  28. Melillo, J.M.; McGuire, A.D.; Kicklighter, D.W.; Moore, B.; Vorosmarty, C.J.; Schloss, A.L. Global climate change and terrestrial net primary production. Nature 1993, 363, 234–240. [Google Scholar] [CrossRef]
  29. Six, J.; Paustian, K. Aggregate-associated soil organic matter as an ecosystem property and a measurement tool. Soil Biol. Biochem. 2014, 68, A4–A9. [Google Scholar] [CrossRef]
  30. Giardina, C.P.; Litton, C.M.; Crow, S.E.; Asner, G.P. Warming-related increases in soil CO2 efflux are explained by increased below-ground carbon flux. Nat. Clim. Change 2014, 4, 822–827. [Google Scholar] [CrossRef]
  31. Yang, Z.; Lin, T.-C.; Wang, L.; Chen, S.; Liu, X.; Xiong, D.; Xu, C.; Arthur, M.; McCulley, R.; Shi, S.; et al. Recent photosynthates are the primary carbon source for soil microbial respiration in subtropical forests. Geophys. Res. Lett. 2022, 49, e2022GL101147. [Google Scholar] [CrossRef]
  32. Du, E.; Terrer, C.; Pellegrini, A.F.A.; Ahlström, A.; van Lissa, C.J.; Zhao, X.; Xia, N.; Wu, X.; Jackson, R.B. Global patterns of terrestrial nitrogen and phosphorus limitation. Nat. Geosci. 2020, 13, 221–226. [Google Scholar] [CrossRef]
  33. Vitousek, P.M.; Porder, S.; Houlton, B.Z.; Chadwick, O.A. Terrestrial phosphorus limitation: Mechanisms, implications, and nitrogen-phosphorus interactions. Ecol. Appl. 2010, 20, 5–15. [Google Scholar] [CrossRef]
  34. Nottingham, A.T.; Gloor, E.; Bååth, E.; Meir, P. Soil carbon and microbes in the warming tropics. Funct. Ecol. 2022, 36, 1338–1354. [Google Scholar] [CrossRef]
  35. Huang, J.; Lin, T.-C.; Xiong, D.; Yang, Z.; Liu, X.; Chen, G.; Xie, J.; Li, Y.; Yang, Y. Organic carbon mineralization in soils of a natural forest and a forest plantation of southeastern China. Geoderma 2019, 344, 119–126. [Google Scholar] [CrossRef]
  36. Liu, X.; Chen, S.; Li, X.; Yang, Z.; Xiong, D.; Xu, C.; Wanek, W.; Yang, Y. Soil warming delays leaf litter decomposition but exerts no effect on litter nutrient release in a subtropical natural forest over 450 days. Geoderma 2022, 427, 116139. [Google Scholar] [CrossRef]
  37. Mao, C.; Kou, D.; Chen, L.; Qin, S.; Zhang, D.; Peng, Y.; Yang, Y. Permafrost nitrogen status and its determinants on the Tibetan Plateau. Glob. Change Biol. 2020, 26, 5290–5302. [Google Scholar] [CrossRef] [PubMed]
  38. Saiya-Cork, K.R.; Sinsabaugh, R.L.; Zak, D.R. The effects of long term nitrogen deposition on extracellular enzyme activity in an Acer saccharum forest soil. Soil Biol. Biochem. 2002, 34, 1309–1315. [Google Scholar] [CrossRef]
  39. German, D.P.; Weintraub, M.N.; Grandy, A.S.; Lauber, C.L.; Rinkes, Z.L.; Allison, S.D. Optimization of hydrolytic and oxidative enzyme methods for ecosystem studies. Soil Biol. Biochem. 2011, 43, 1387–1397. [Google Scholar] [CrossRef]
  40. Moorhead, D.L.; Sinsabaugh, R.L.; Hill, B.H.; Weintraub, M.N. Vector analysis of ecoenzyme activities reveal constraints on coupled C, N and P dynamics. Soil Biol. Biochem. 2016, 93, 1–7. [Google Scholar] [CrossRef]
  41. Mooshammer, M.; Wanek, W.; Hämmerle, I.; Fuchslueger, L.; Hofhansl, F.; Knoltsch, A.; Schnecker, J.; Takriti, M.; Watzka, M.; Wild, B.; et al. Adjustment of microbial nitrogen use efficiency to carbon:nitrogen imbalances regulates soil nitrogen cycling. Nat. Commun. 2014, 5, 3694. [Google Scholar] [CrossRef] [PubMed]
  42. Cui, Y.; Moorhead, D.L.; Guo, X.; Peng, S.; Wang, Y.; Zhang, X.; Fang, L. Stoichiometric models of microbial metabolic limitation in soil systems. Glob. Ecol. Biogeogr. 2021, 30, 2297–2311. [Google Scholar] [CrossRef]
  43. Brookes, P.C.; Landman, A.; Pruden, G.; Jenkinson, D.S. Chloroform fumigation and the release of soil nitrogen: A rapid direct extraction method to measure microbial biomass nitrogen in soil. Soil Biol. Biochem. 1985, 17, 837–842. [Google Scholar] [CrossRef]
  44. Brookes, P.C.; Powlson, D.S.; Jenkinson, D.S. Measurement of microbial biomass phosphorus in soil. Soil Biol. Biochem. 1982, 14, 319–329. [Google Scholar] [CrossRef]
  45. Vance, E.D.; Brookes, P.C.; Jenkinson, D.S. An extraction method for measuring soil microbial biomass C. Soil Biol. Biochem. 1987, 19, 703–707. [Google Scholar] [CrossRef]
  46. Bossio, D.A.; Scow, K.M. Impacts of carbon and flooding on soil microbial communities: Phospholipid fatty acid profiles and substrate utilization patterns. Microb. Ecol. 1998, 35, 265–278. [Google Scholar] [CrossRef]
  47. Bates, D.; Mäechler, M.; Bolker, B.; Walker, S. Fitting linear mixed-effects models using lme4. J. Stat. Softw. 2015, 67, 1–48. [Google Scholar] [CrossRef]
  48. Warton, D.I.; Duursma, R.A.; Falster, D.S.; Taskinen, S. smatr 3- an R package for estimation and inference about allometric lines. Methods Ecol. Evol. 2012, 3, 257–259. [Google Scholar] [CrossRef]
  49. Burnham, K.P.; Anderson, D.R. Model Selection and Multimodel Inference; Springer: New York, NY, USA, 2002. [Google Scholar]
  50. Mao, C.; Song, Y.; Peng, Y.; Kang, L.; Li, Z.; Zhou, W.; Liu, X.; Liu, F.; Zhu, G.; Yang, Y. Patterns and drivers of anaerobic nitrogen transformations in sediments of thermokarst lakes. Glob. Change Biol. 2023, 29, 2697–2713. [Google Scholar] [CrossRef] [PubMed]
  51. Gross, N.; Bagousse-Pinguet, Y.L.; Liancourt, P.; Berdugo, M.; Gotelli, N.J.; Maestre, F.T. Functional trait diversity maximizes ecosystem multifunctionality. Nat. Ecol. Evol. 2017, 1, 0132. [Google Scholar] [CrossRef]
  52. Le Provost, G.; Badenhausser, I.; Le Bagousse-Pinguet, Y.; Clough, Y.; Henckel, L.; Violle, C.; Bretagnolle, V.; Roncoroni, M.; Manning, P.; Gross, N. Land-use history impacts functional diversity across multiple trophic groups. Proc. Natl. Acad. Sci. USA 2020, 117, 1573–1579. [Google Scholar] [CrossRef] [PubMed]
  53. R Core Team. R: A Language and Environment for Statistical Computing; R Foundation for Statistical Computing: Vienna, Austria, 2021. [Google Scholar]
  54. Bartoń, K. MuMIn: Multi-Model Inference, R package version 1.47.1; R Foundation for Statistical Computing: Vienna, Austria, 2022. [Google Scholar]
  55. Sinsabaugh, R.L.; Lauber, C.L.; Weintraub, M.N.; Ahmed, B.; Allison, S.D.; Crenshaw, C.; Contosta, A.R.; Cusack, D.; Frey, S.; Gallo, M.E.; et al. Stoichiometry of soil enzyme activity at global scale. Ecol. Lett. 2008, 11, 1252–1264. [Google Scholar] [CrossRef]
  56. Camenzind, T.; Hättenschwiler, S.; Treseder, K.; Lehmann, A.; Rillig, M.C. Nutrient limitation of soil microbial processes in tropical forests. Ecol. Monogr. 2018, 88, 4–21. [Google Scholar] [CrossRef]
  57. Vitousek, P.M.; Farrington, H. Nutrient limitation and soil development: Experimental test of a biogeochemical theory. Biogeochemistry 1997, 37, 63–75. [Google Scholar] [CrossRef]
  58. Hou, E.; Wen, D.; Kuang, Y.; Cong, J.; Chen, C.; He, X.; Heenan, M.; Lu, H.; Zhang, Y. Soil pH predominantly controls the forms of organic phosphorus in topsoils under natural broadleaved forests along a 2500 km latitudinal gradient. Geoderma 2018, 315, 65–74. [Google Scholar] [CrossRef]
  59. Liu, L.; Wen, Z.; Liu, S.; Zhang, X.; Liu, X. Decline in atmospheric nitrogen deposition in China between 2010 and 2020. Nat. Geosci. 2024, 17, 733–736. [Google Scholar] [CrossRef]
  60. Mason, R.E.; Craine, J.M.; Lany, N.K.; Jonard, M.; Ollinger, S.V.; Groffman, P.M.; Fulweiler, R.W.; Angerer, J.; Read, Q.D.; Reich, P.B.; et al. Evidence, causes, and consequences of declining nitrogen availability in terrestrial ecosystems. Science 2022, 376, eabh3767. [Google Scholar] [CrossRef] [PubMed]
  61. Vitousek, P.M.; Cen, X.; Groffman, P.M. Has nitrogen availability decreased over much of the land surface in the past century? A model-based analysis. Biogeochemistry 2024, 167, 793–806. [Google Scholar] [CrossRef]
  62. Bonan, G.B. Forests and climate change: Forcings, feedbacks, and the climate benefits of forests. Science 2008, 320, 1444–1449. [Google Scholar] [CrossRef]
  63. Fan, Y.; Miguez-Macho, G.; Jobbágy, E.G.; Jackson, R.B.; Otero-Casal, C. Hydrologic regulation of plant rooting depth. Proc. Natl. Acad. Sci. USA 2017, 114, 10572–10577. [Google Scholar] [CrossRef]
  64. Hensgens, G.; Laudon, H.; Peichl, M.; Gil, I.A.; Zhou, Q.; Berggren, M. The role of the understory in litter DOC and nutrient leaching in boreal forests. Biogeochemistry 2020, 149, 87–103. [Google Scholar] [CrossRef]
  65. Scott, E.E.; Rothstein, D.E. Patterns of DON and DOC leaching losses across a natural N availability gradient in temperate hardwood forests. Ecosystems 2017, 20, 1250–1265. [Google Scholar] [CrossRef]
  66. Pausch, J.; Kuzyakov, Y. Carbon input by roots into the soil: Quantification of rhizodeposition from root to ecosystem scale. Glob. Change Biol. 2018, 24, 1–12. [Google Scholar] [CrossRef] [PubMed]
  67. Sun, S.; Liu, X.; Lu, S.; Cao, P.; Hui, D.; Chen, J.; Guo, J.; Yang, Y. Depth-dependent response of particulate and mineral-associated organic carbon to long-term throughfall reduction in a subtropical natural forest. CATENA 2023, 223, 106904. [Google Scholar] [CrossRef]
  68. Boer, W.d.; Folman, L.B.; Summerbell, R.C.; Boddy, L. Living in a fungal world: Impact of fungi on soil bacterial niche development. FEMS Microbiol. Rev. 2005, 29, 795–811. [Google Scholar] [CrossRef] [PubMed]
  69. Wright, S.J. Plant responses to nutrient addition experiments conducted in tropical forests. Ecol. Monogr. 2019, 89, e01382. [Google Scholar] [CrossRef]
  70. Yang, Y.; Wang, L.; Yang, Z.; Xu, C.; Xie, J.; Chen, G.; Lin, C.; Guo, J.; Liu, X.; Xiong, D.; et al. Large ecosystem service benefits of assisted natural regeneration. J. Geophys. Res.-Biogeosci. 2018, 123, 676–687. [Google Scholar] [CrossRef]
  71. Strickland, M.S.; Rousk, J. Considering fungal:bacterial dominance in soils—Methods, controls, and ecosystem implications. Soil Biol. Biochem. 2010, 42, 1385–1395. [Google Scholar] [CrossRef]
  72. Jayawardena, D.M.; Heckathorn, S.A.; Boldt, J.K. A meta-analysis of the combined effects of elevated carbon dioxide and chronic warming on plant %N, protein content and N-uptake rate. AoB PLANTS 2021, 13, plab031. [Google Scholar] [CrossRef]
  73. Noyce, G.L.; Kirwan, M.L.; Rich, R.L.; Megonigal, P. Asynchronous nitrogen supply and demand produce nonlinear plant allocation responses to warming and elevated CO2. Proc. Natl. Acad. Sci. USA 2019, 116, 21623–21628. [Google Scholar] [CrossRef] [PubMed]
  74. Zechmeister-Boltenstern, S.; Keiblinger, K.M.; Mooshammer, M.; Peñuelas, J.; Richter, A.; Sardans, J.; Wanek, W. The application of ecological stoichiometry to plant-microbial-soil organic matter transformations. Ecol. Monogr. 2015, 85, 133–155. [Google Scholar] [CrossRef]
  75. Chuckran, P.F.; Reibold, R.; Throop, H.L.; Reed, S.C. Multiple mechanisms determine the effect of warming on plant litter decomposition in a dryland. Soil Biol. Biochem. 2020, 145, 107799. [Google Scholar] [CrossRef]
  76. Wei, H.; Guenet, B.; Vicca, S.; Nunan, N.; AbdElgawad, H.; Pouteau, V.; Shen, W.; Janssens, I.A. Thermal acclimation of organic matter decomposition in an artificial forest soil is related to shifts in microbial community structure. Soil Biol. Biochem. 2014, 71, 1–12. [Google Scholar] [CrossRef]
  77. Guan, P.; Yang, J.; Yang, Y.; Wang, W.; Zhang, P.; Wu, D. Land conversion from cropland to grassland alleviates climate warming effects on nutrient limitation: Evidence from soil enzymatic activity and stoichiometry. Glob. Ecol. Conserv. 2020, 24, e01328. [Google Scholar] [CrossRef]
  78. Maslov, M.N.; Maslova, O.A. Nitrogen limitation of microbial activity in alpine tundra soils along an environmental gradient: Intra-seasonal variations and effect of rising temperature. Soil Biol. Biochem. 2021, 156, 108234. [Google Scholar] [CrossRef]
  79. Fang, X.; Zhou, G.; Qu, C.; Huang, W.; Zhang, D.; Li, Y.; Yi, Z.; Liu, J. Translocating subtropical forest soils to a warmer region alters microbial communities and increases the decomposition of mineral-associated organic carbon. Soil Biol. Biochem. 2020, 142, 107707. [Google Scholar] [CrossRef]
  80. Butler, S.M.; Melillo, J.M.; Johnson, J.E.; Mohan, J.; Steudler, P.A.; Lux, H.; Burrows, E.; Smith, R.M.; Vario, C.L.; Scott, L.; et al. Soil warming alters nitrogen cycling in a New England forest: Implications for ecosystem function and structure. Oecologia 2012, 168, 819–828. [Google Scholar] [CrossRef]
  81. Deng, L.; Peng, C.; Kim, D.-G.; Li, J.; Liu, Y.; Hai, X.; Liu, Q.; Huang, C.; Shangguan, Z.; Kuzyakov, Y. Drought effects on soil carbon and nitrogen dynamics in global natural ecosystems. Earth-Sci. Rev. 2021, 214, 103501. [Google Scholar] [CrossRef]
  82. Craine, J.M.; Fierer, N.; McLauchlan, K.K.; Elmore, A.J. Reduction of the temperature sensitivity of soil organic matter decomposition with sustained temperature increase. Biogeochemistry 2012, 113, 359–368. [Google Scholar] [CrossRef]
  83. Dai, Z.; Yu, M.; Chen, H.; Zhao, H.; Huang, Y.; Su, W.; Xia, F.; Chang, S.X.; Brookes, P.C.; Dahlgren, R.A.; et al. Elevated temperature shifts soil N cycling from microbial immobilization to enhanced mineralization, nitrification and denitrification across global terrestrial ecosystems. Glob. Change Biol. 2020, 26, 5267–5276. [Google Scholar] [CrossRef]
Figure 1. Effects of warming and soil depth on soil (a) moisture, (b) pH, (c) clay content, (d) DOC/TDN, (e) DOC/LP, (f) MBC/MBN, (g) MBC/MBP and (h) F/B.DOC/TDN—soil C:N ratio; DOC/LP—soil C:P ratio; MBC/MBN—microbial biomass C:N ratio; MBC/MBP—microbial biomass C:P ratio; F/B—fungal–bacterial ratio. Data in bar graphs are presented as the mean ± SE. Different uppercase and lowercase letters in the bar graphs indicate significant differences across depths for the control and warming treatments, respectively. Asterisks in the bar graphs represent significant differences between control and warming treatments at each soil depth. * p < 0.05; ** p < 0.01.
Forests 16 00402 g001
Figure 2. Effects of warming and soil depth on (a) EEAC:N, (b) EEAC:P, (c) vector length, (d) vector angle, (e) RC:N/TERC:N and (f) RC:P/TERC:P. EEAC:N—enzymatic C:N ratio; EEAC:P—enzymatic C:P ratio; RC:N/TERC:N—ratio of soil C:N ratio to threshold elemental ratio model; RC:P/TERC:P—ratio of soil C:P ratio to threshold elemental ratio model. Data in bar graphs are presented as the mean ± SE. Different uppercase and lowercase letters in the bar graphs indicate significant differences across depths for the control and warming treatments, respectively. Asterisks in the bar graphs represent significant differences between control and warming treatments at each soil depth. * p < 0.05.
Forests 16 00402 g002
Figure 3. Standard major axis regressions (a) between C- and N-acquisition enzyme activities, (b) between C- and P-acquisition enzyme activities. s BG—β-1,4-glucosidase; CBH—β-D-cellobiosidase; NAG—β-1,4-N-acetylglucosaminidase; LAP—leucine aminopeptidase; AP—acid phosphatase. ** p < 0.01.
Forests 16 00402 g003
Figure 4. The correlations of soil enzymatic stoichiometry with explanatory variables along the soil profile for both control and warming treatments. EEAC:N—enzymatic C:N ratio; EEAC:P—enzymatic C:P ratio; DOC/TDN—soil C:N ratio; DOC/LP—soil C:P ratio; MBC/MBN—microbial biomass C:N ratio; MBC/MBP—microbial biomass C:P ratio; F/B—fungal–bacterial ratio. * p < 0.05; ** p < 0.01.
Forests 16 00402 g004
Figure 5. The relative importance of optimal variables in explaining variations in (a) EEAC:N, (b) EEAC:P and (c) vector length along the soil profile for both control and warming treatments. EEAC:N—enzymatic C:N ratio; EEAC:P—enzymatic C:P ratio; DOC/LP—soil C:P ratio; F/B—fungal–bacterial ratio.
Forests 16 00402 g005
Figure 6. Conceptual diagram showing the effects of warming and soil depth on enzymatic stoichiometry in subtropical forests along the soil profile. Vertically, enzymatic stoichiometry (i.e., vector length and enzymatic C:N and C:P ratios) decrease along the soil profile regardless of warming. Horizontally, warming decreases enzymatic stoichiometry in topsoil but has nonsignificant effects in subsoil. The biotic and abiotic factors adjacent to trapezoids are the predominant drivers of vertical changes in enzymatic stoichiometry. F/B—fungal–bacterial ratio; DOC/LP—soil C:P ratio.
Forests 16 00402 g006
Table 1. The main effects of warming, depth, and their interaction on soil properties and enzymatic stoichiometry based on linear mixed-effects models.
VariablesWarmingDepthWarming × Depth
FpFpFp
Soil moisture (%)14.32<0.0116.64<0.012.430.07
pH0.04 0.84 1.81 0.15 0.50 0.68
Clay (%)0.90 0.34 11.57 <0.010.11 0.96
DOC/TDN3.16 0.08 17.16 <0.011.24 0.30
DOC/LP2.37 0.13 11.12 <0.010.62 0.60
MBC/MBN2.22 0.14 3.38 0.020.28 0.84
MBC/MBP0.80 0.37 8.60 <0.011.38 0.25
F/B0.01 0.94 12.50 <0.010.55 0.65
EEAC:N6.99<0.019.31<0.011.560.20
EEAC:P1.740.191.480.230.480.70
Vector length4.480.044.96<0.011.030.38
Vector angle (°)1.750.197.17<0.010.580.63
RC:N/TERC:N2.820.100.210.890.120.95
RC:P/TERC:P0.400.531.160.331.000.40
DOC/TDN—soil C:N ratio; DOC/LP—soil C:P ratio; MBC/MBN—microbial biomass C:N ratio; MBC/MBP—microbial biomass C:P ratio; F/B—fungal–bacterial ratio; EEAC:N—enzymatic C:N ratio; EEAC:P—enzymatic C:P ratio; RC:N/TERC:N—ratio of soil C:N ratio to threshold elemental ratio model; RC:P/TERC:P—ratio of soil C:P ratio to threshold elemental ratio model.
Disclaimer/Publisher’s Note: The statements, opinions and data contained in all publications are solely those of the individual author(s) and contributor(s) and not of MDPI and/or the editor(s). MDPI and/or the editor(s) disclaim responsibility for any injury to people or property resulting from any ideas, methods, instructions or products referred to in the content.