

Optimization and Construction of Forestland Ecological Security Pattern: A Case Study of the Huai River Source–Dabie Mountains in China


Abstract
:1. Introduction
2. Materials and Methods
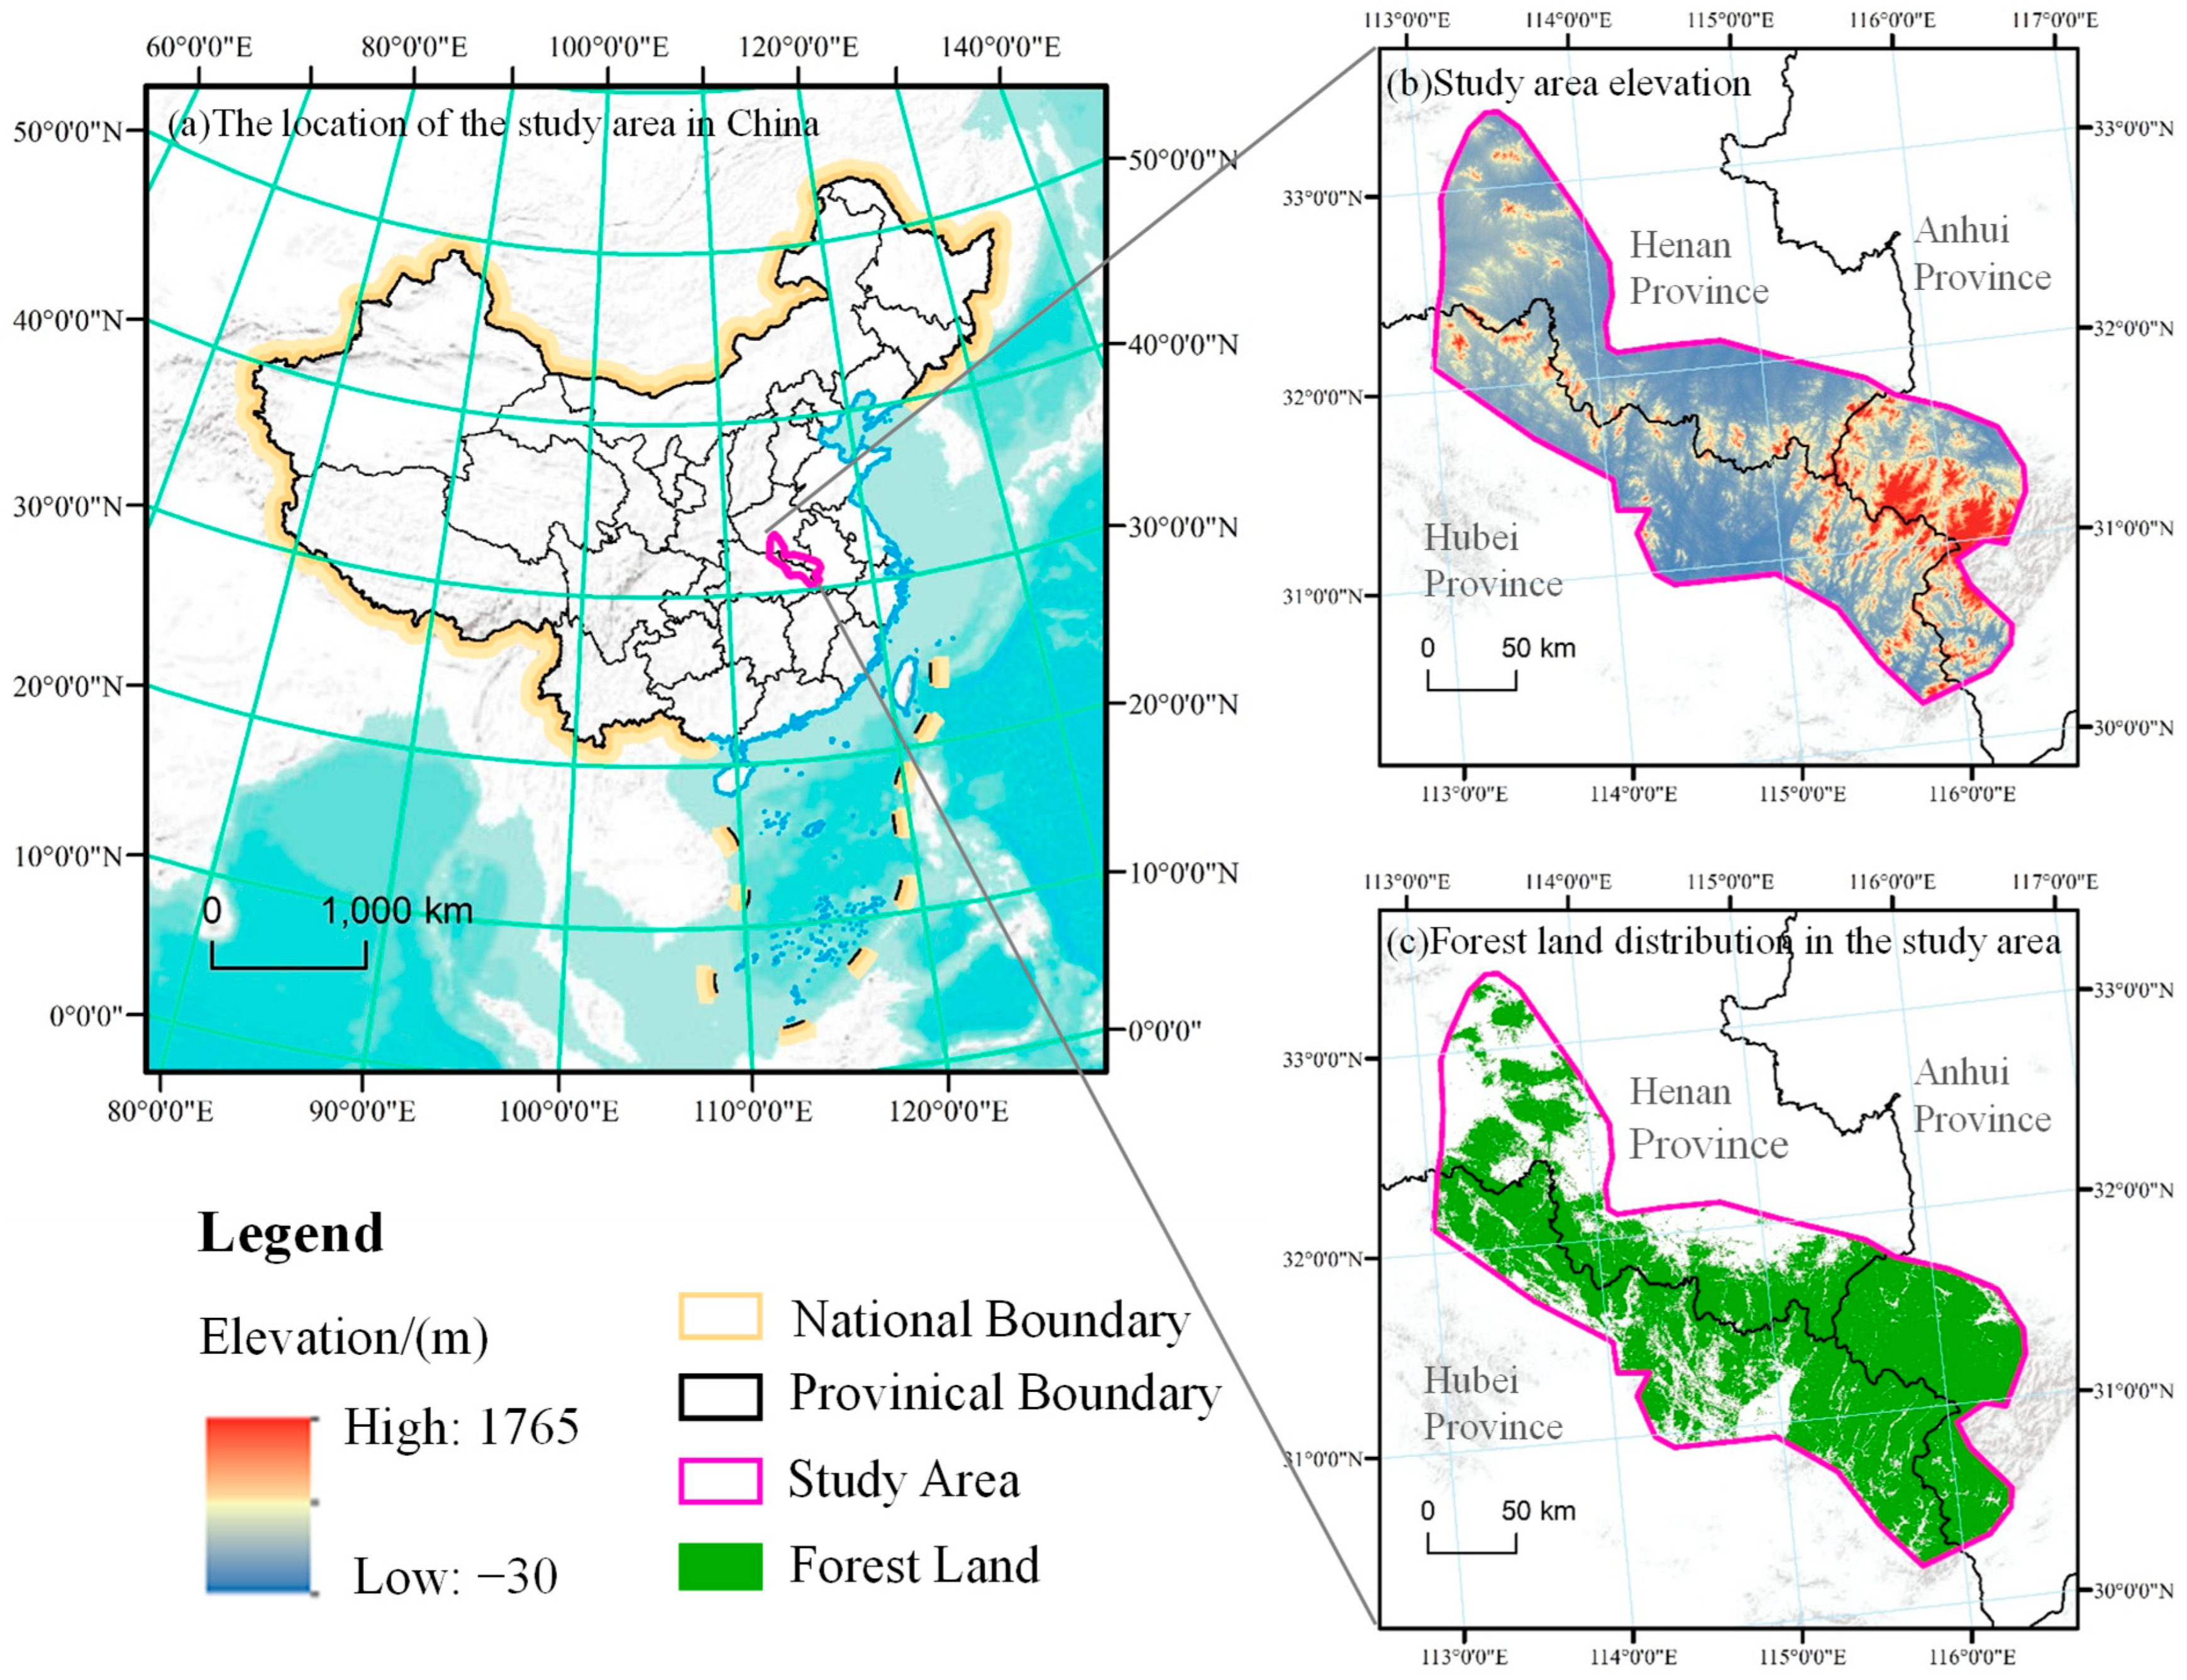
2.1. Overview of the Study Area
2.2. Data Sources and Parameters
2.3. Methods
2.3.1. Forestland Ecosystem Services
- Soil conservation.
- Water conservation.
- Carbon sequestration.
- Windbreak and sand fixation.
- Biodiversity conservation.
- Forest recreation.
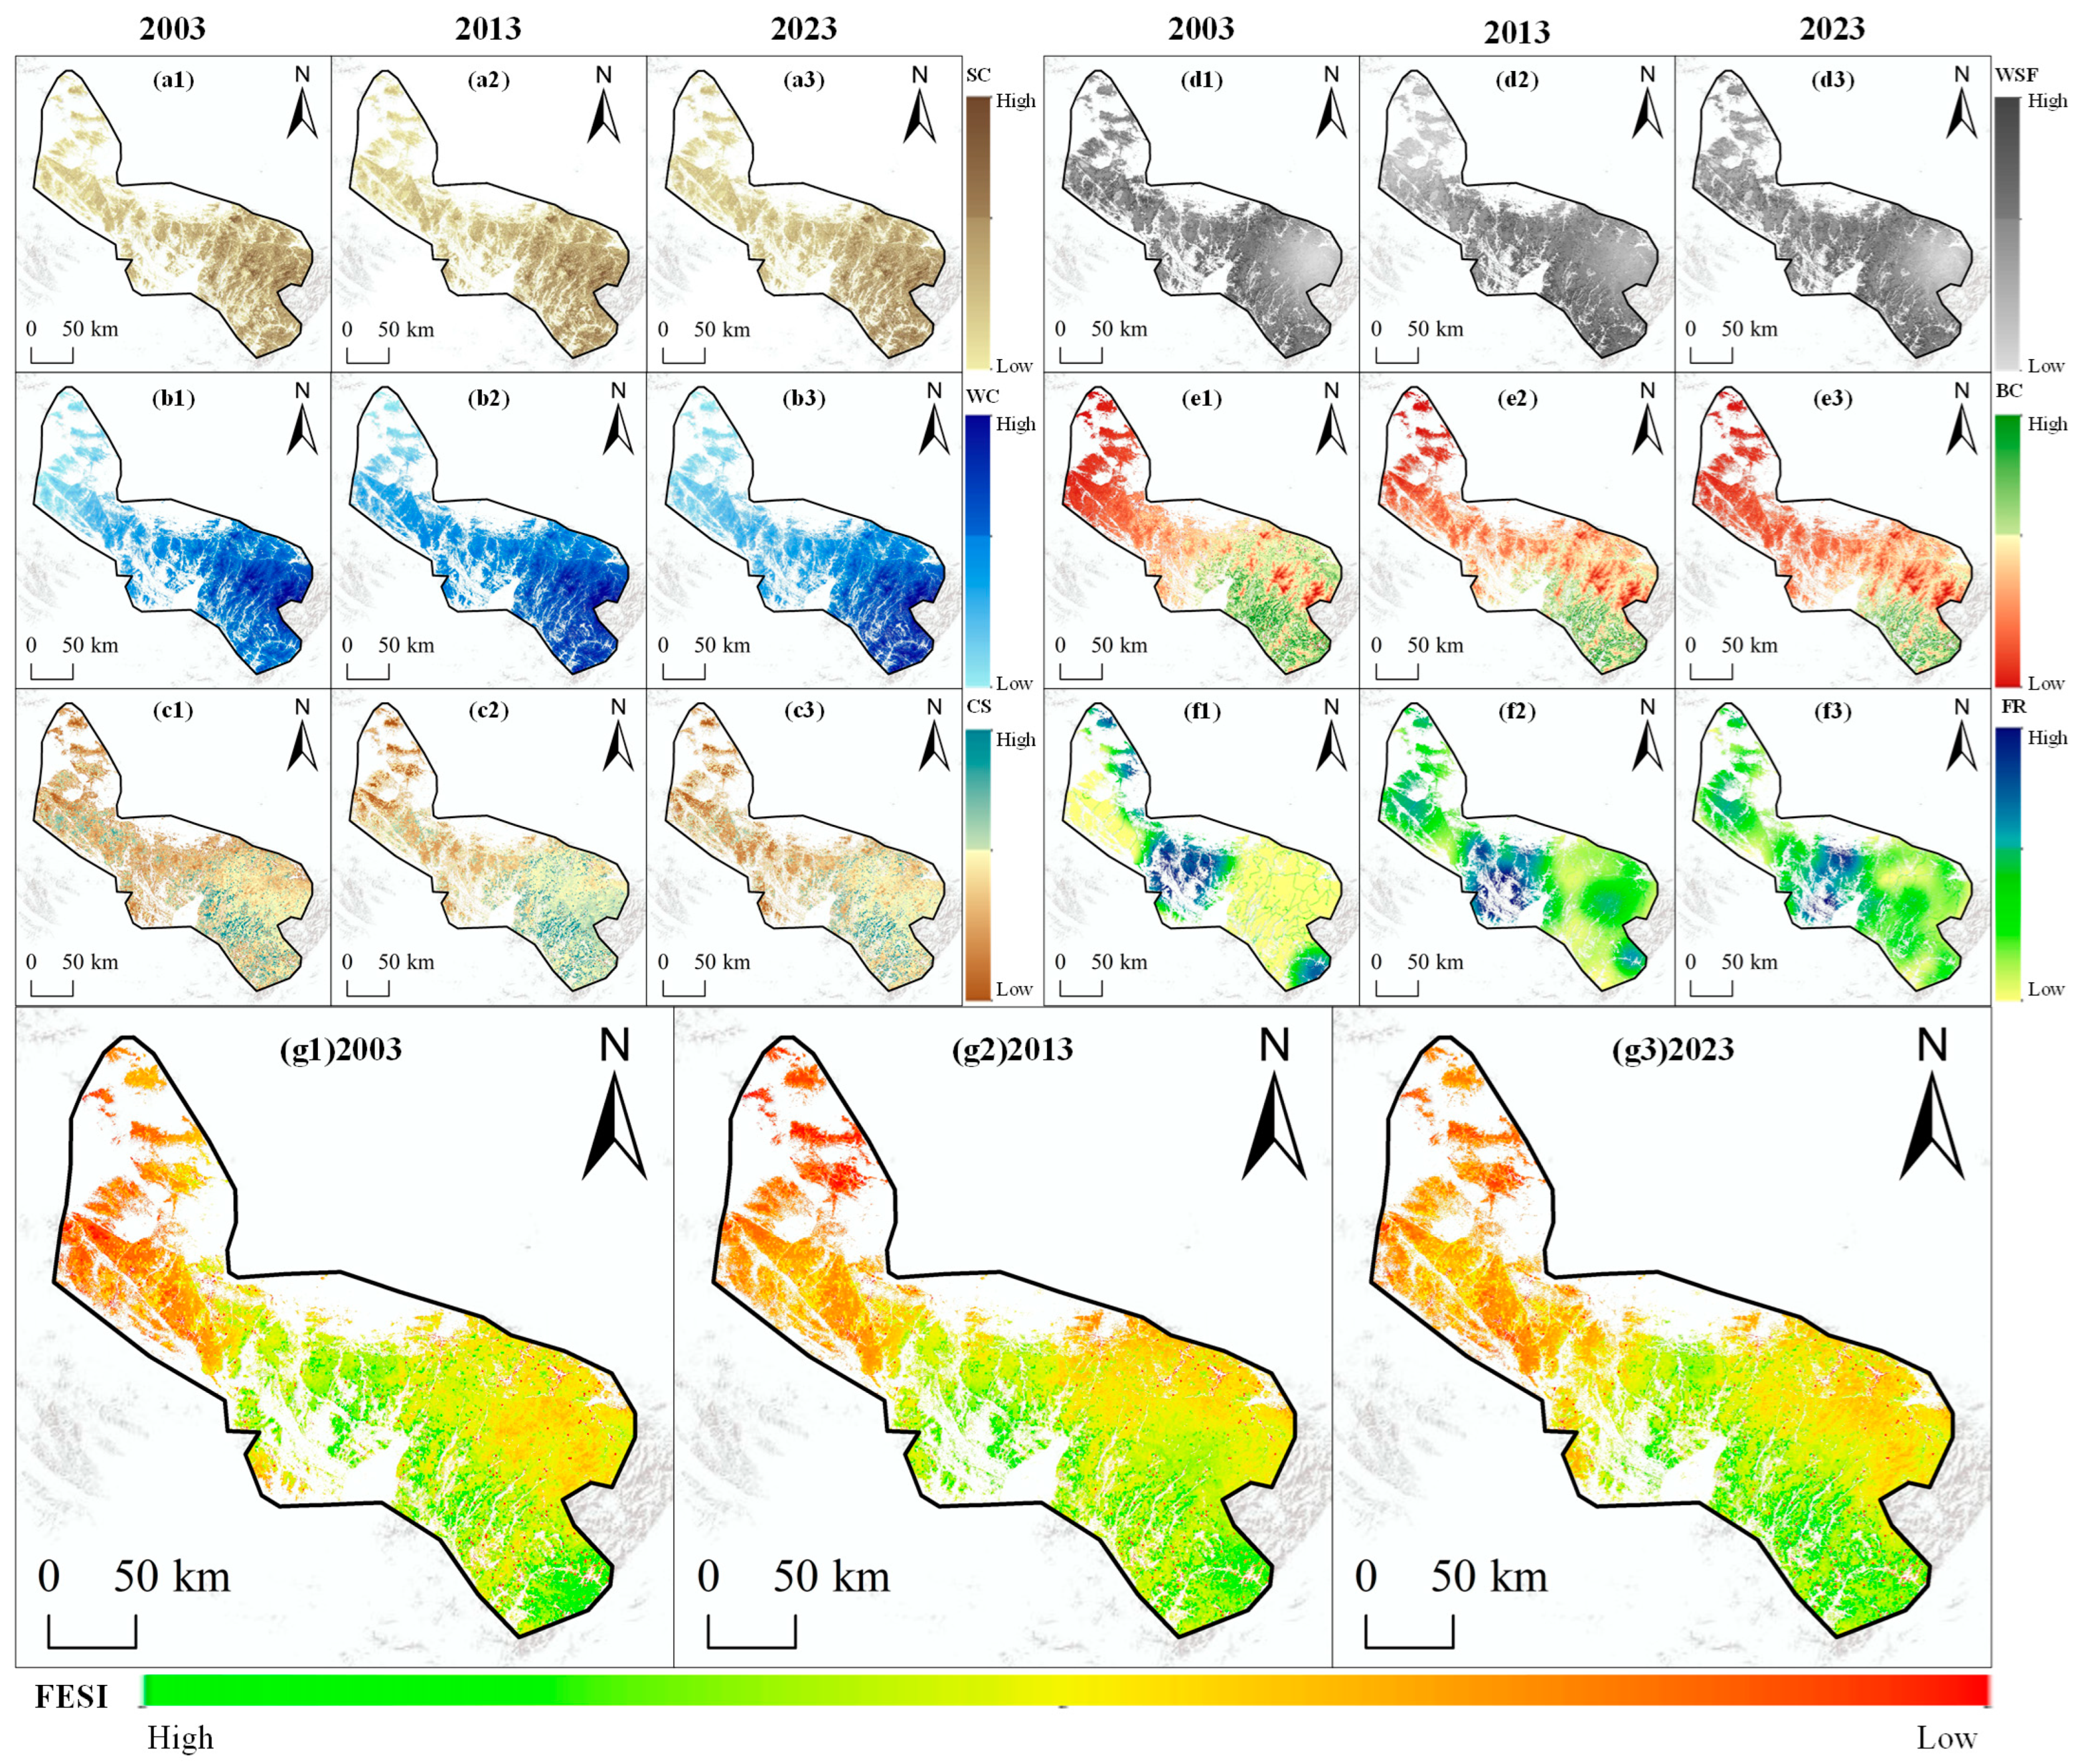
- Forest ecosystem service index.
2.3.2. Optimization of Ecological Source Identification
- Identifying ecological source sites by integrating MSPA analysis.
- Classifying source sites based on landscape connectivity.
2.3.3. Integrated Resistance Surface Construction Method
2.3.4. Constructing Forestland ESP Using Circuit Theory
3. Results
3.1. Assessment Results of Forestland Ecosystem Services
3.2. Analysis of MSPA Results
3.3. Construction of Forestland ESP
- Final Confirmation of Ecological Source Areas
- 2.
- Construction of Comprehensive Resistance Surface
- 3.
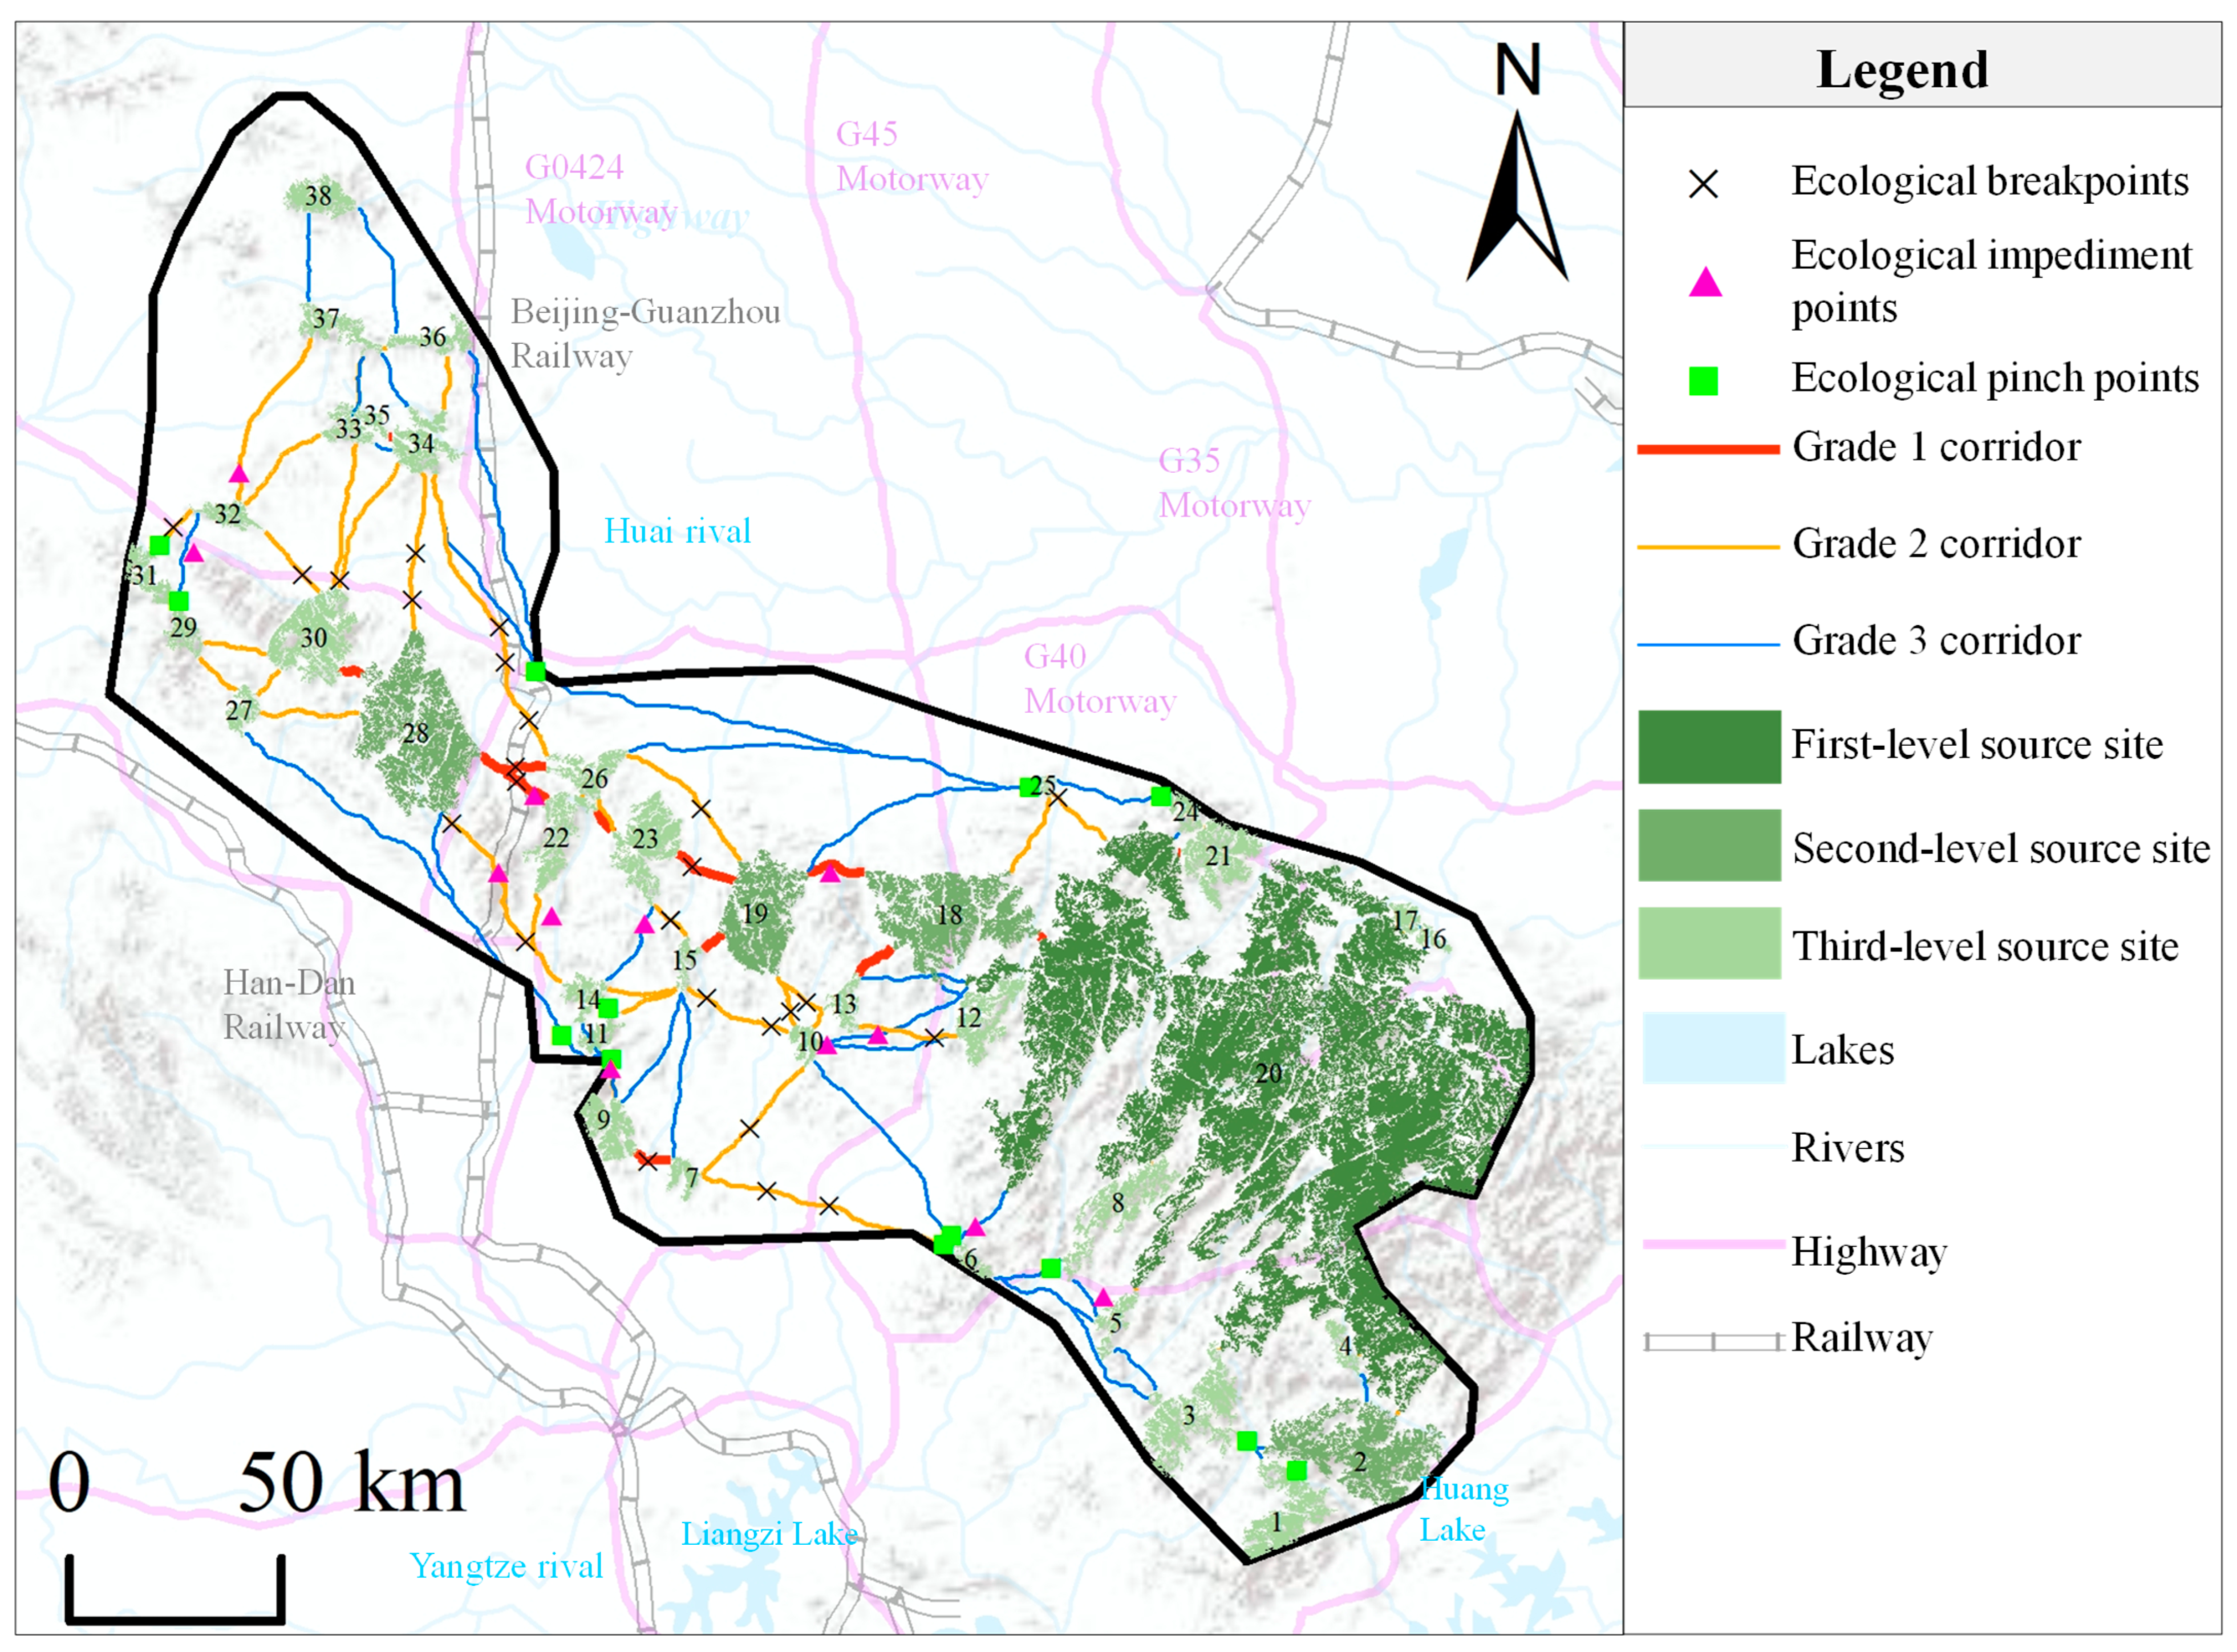
- Corridor Extraction and Classification
- Fifteen first-level corridors, totaling 110.22 km in length;
- Forty-two second-level corridors, totaling 800.78 km in length;
- Thirty-four third-level corridors, totaling 1388.07 km in length.
- 4.
- Ecological Nodes
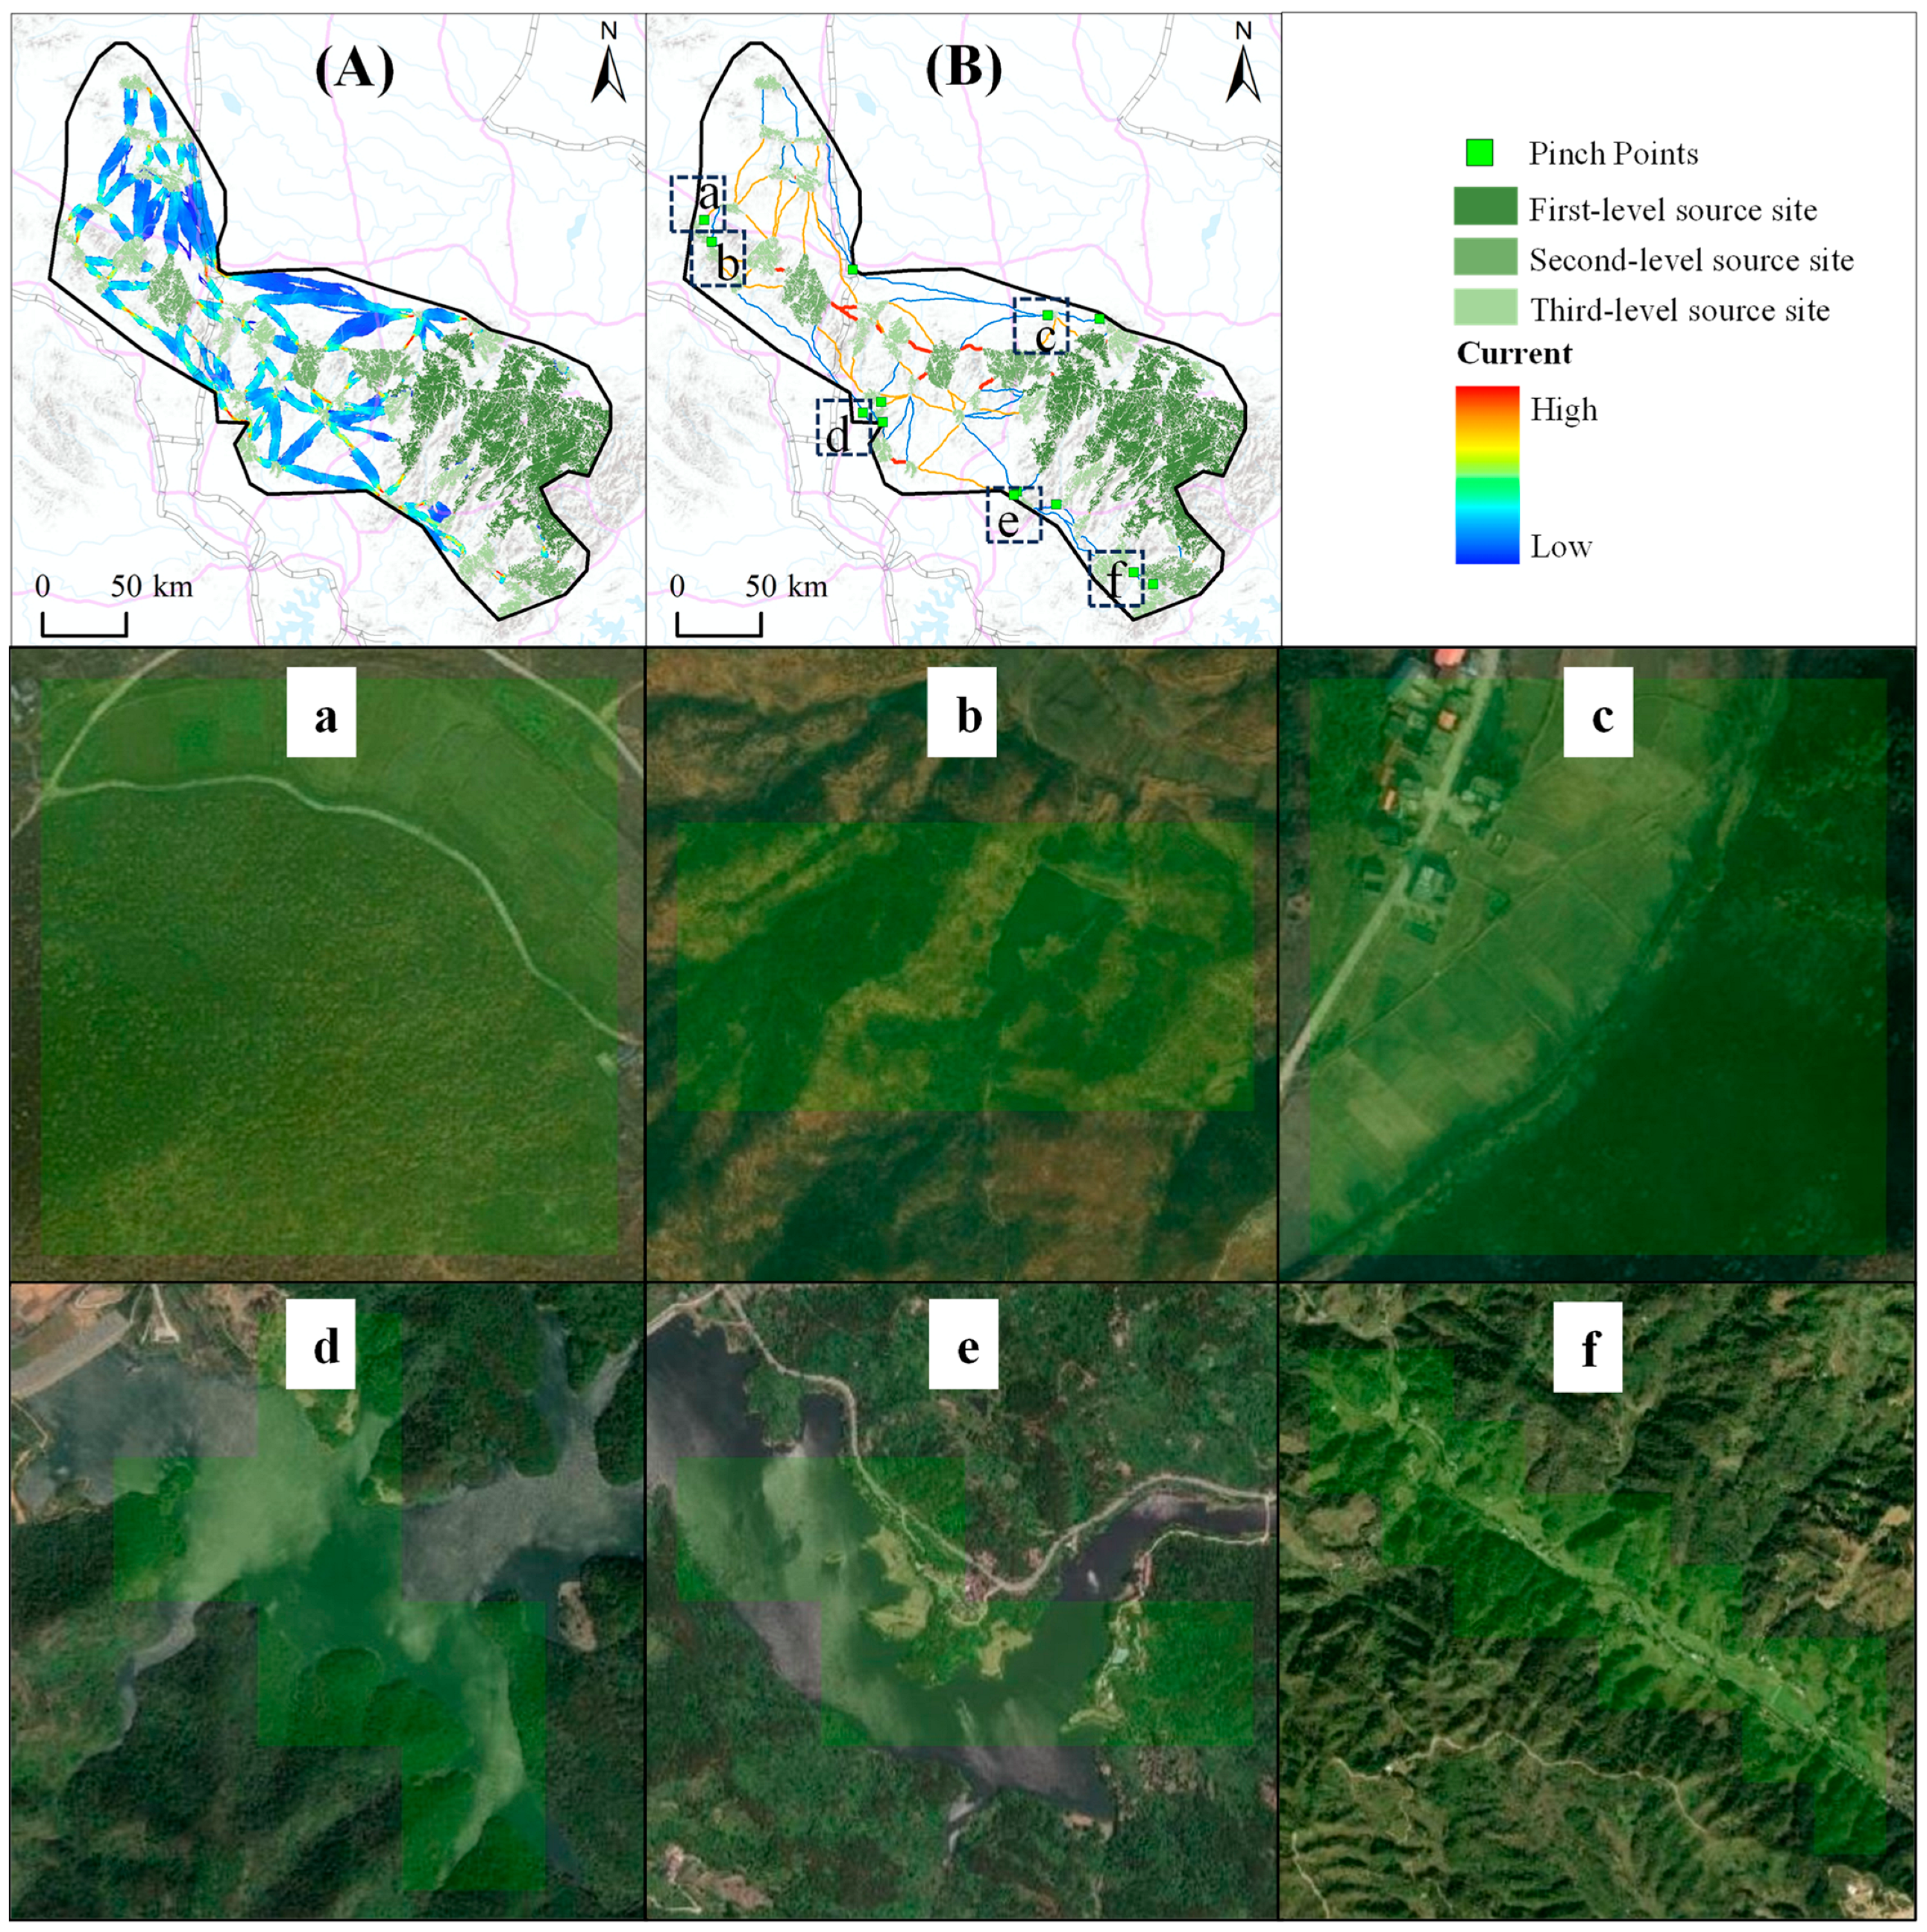
- Pinch points
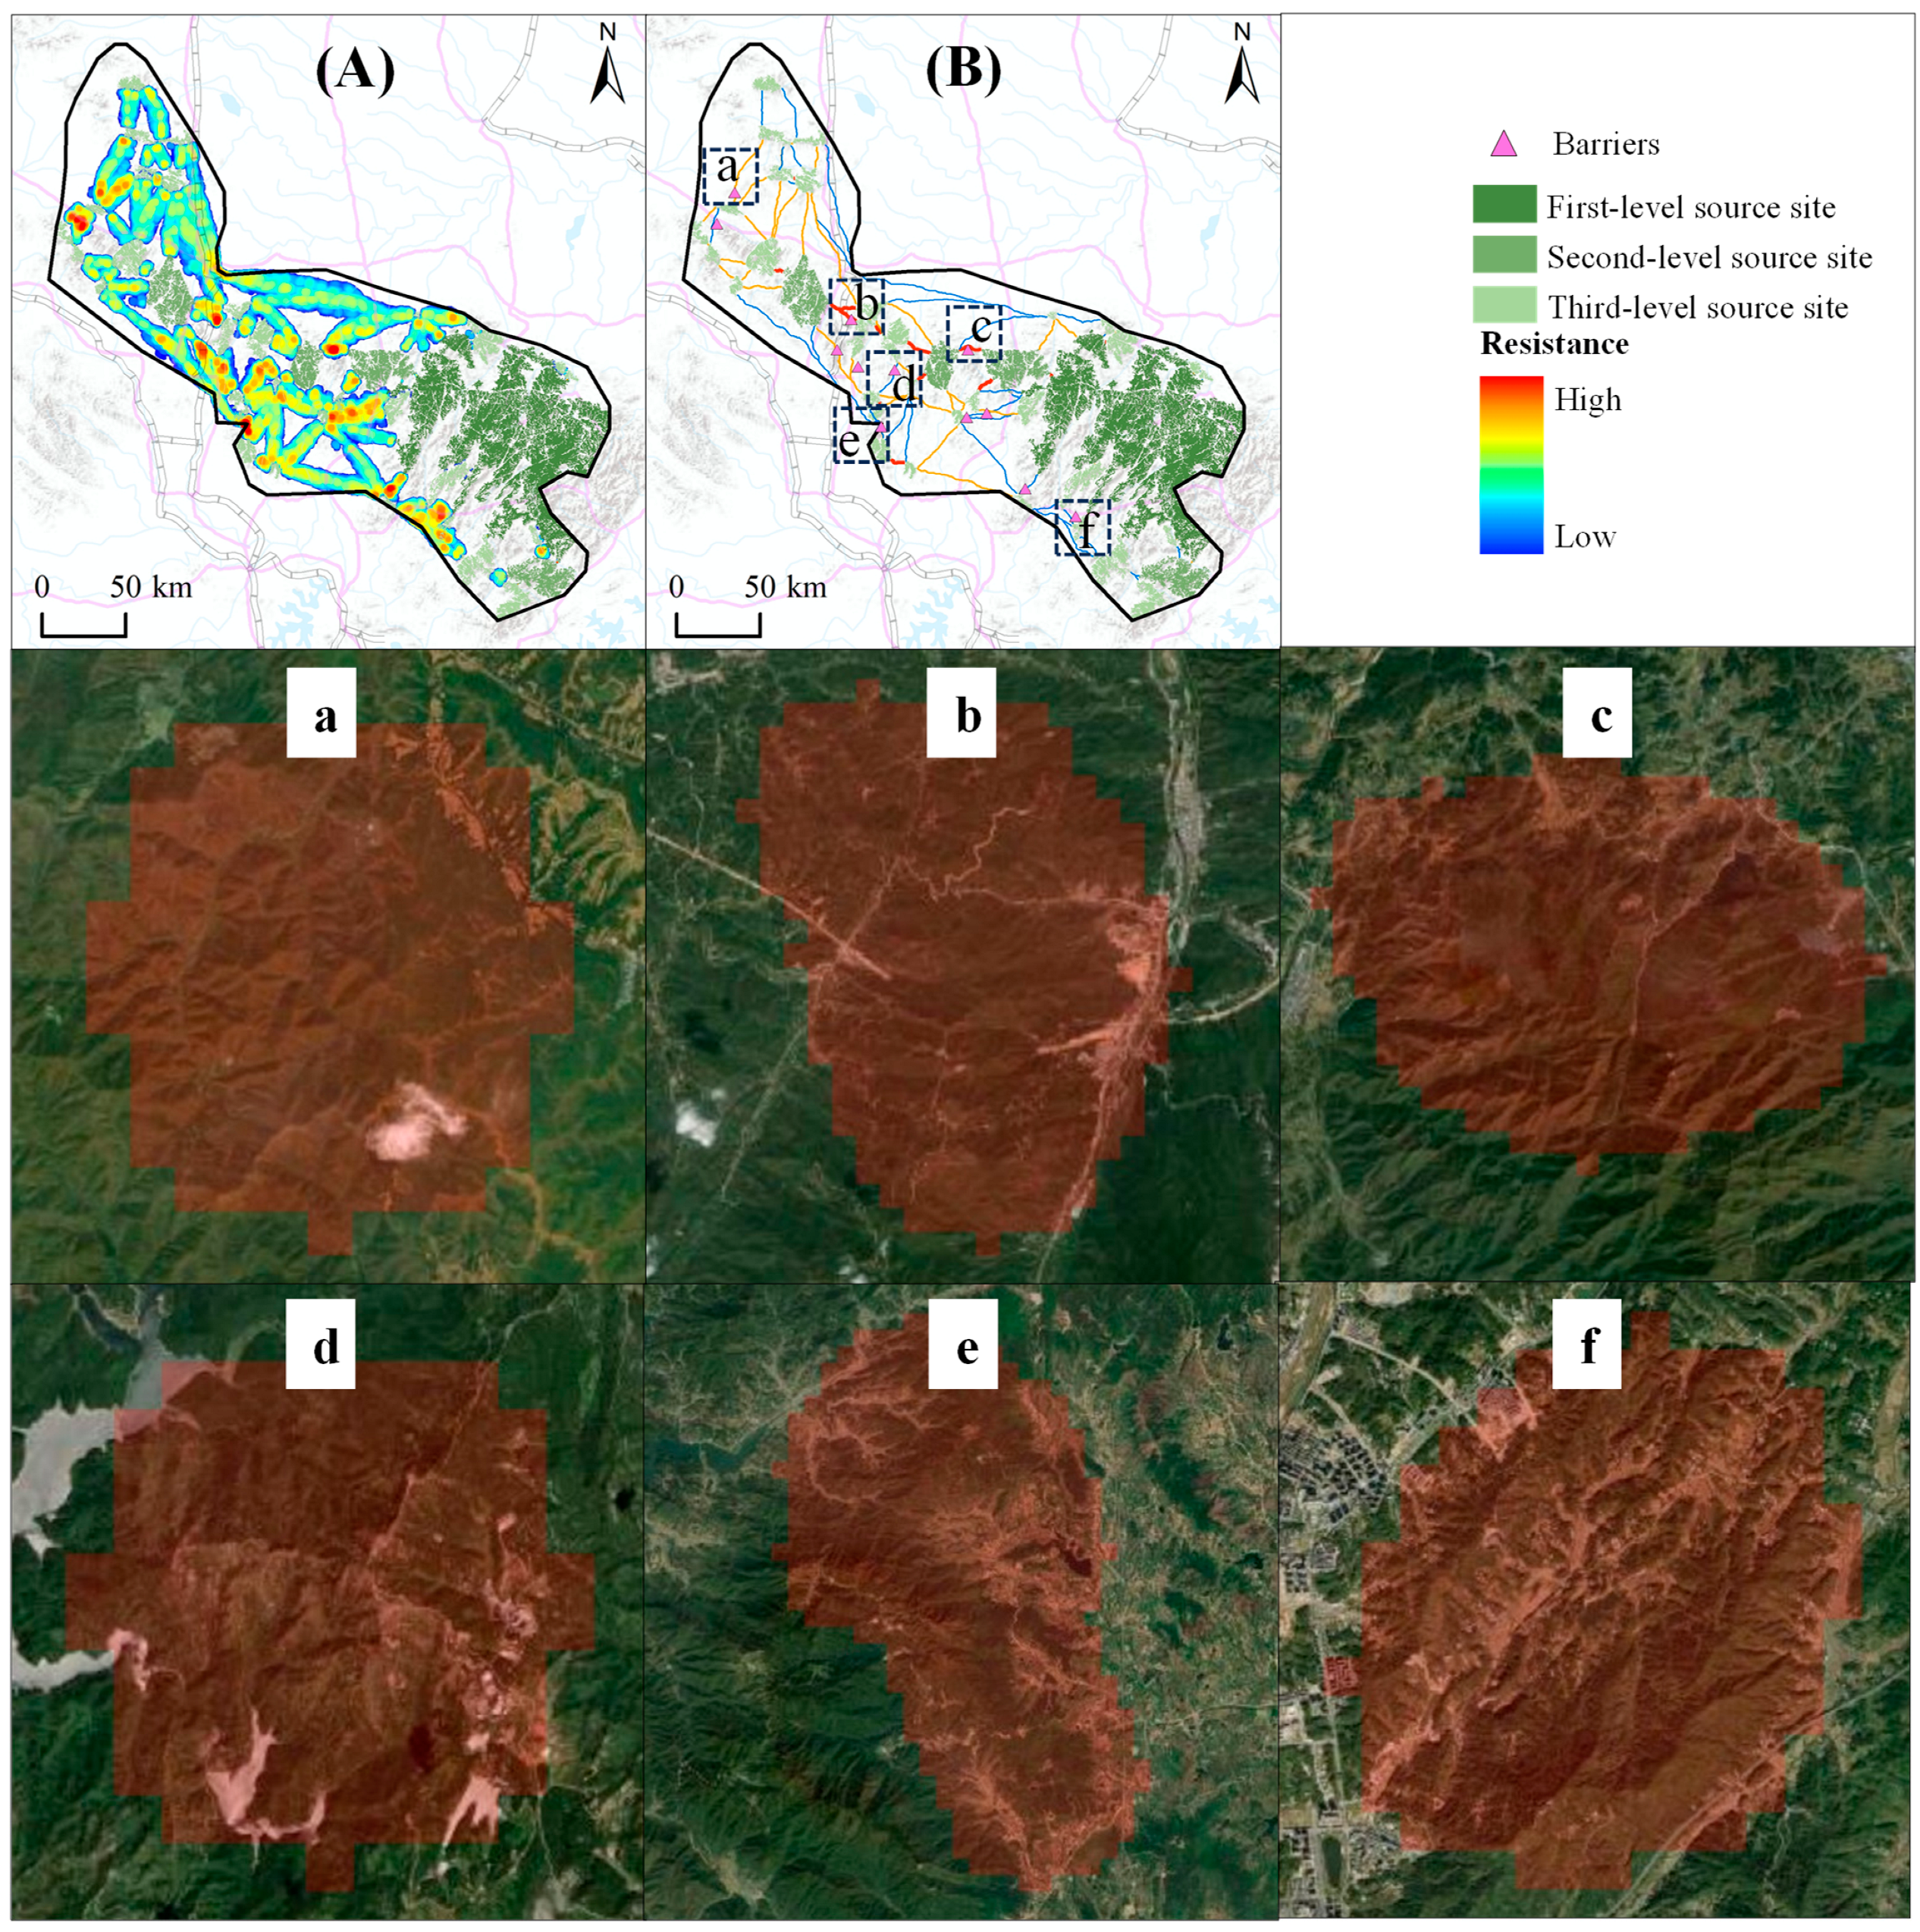
- Barriers
3.4. Restoration Strategies for Forestland ESP
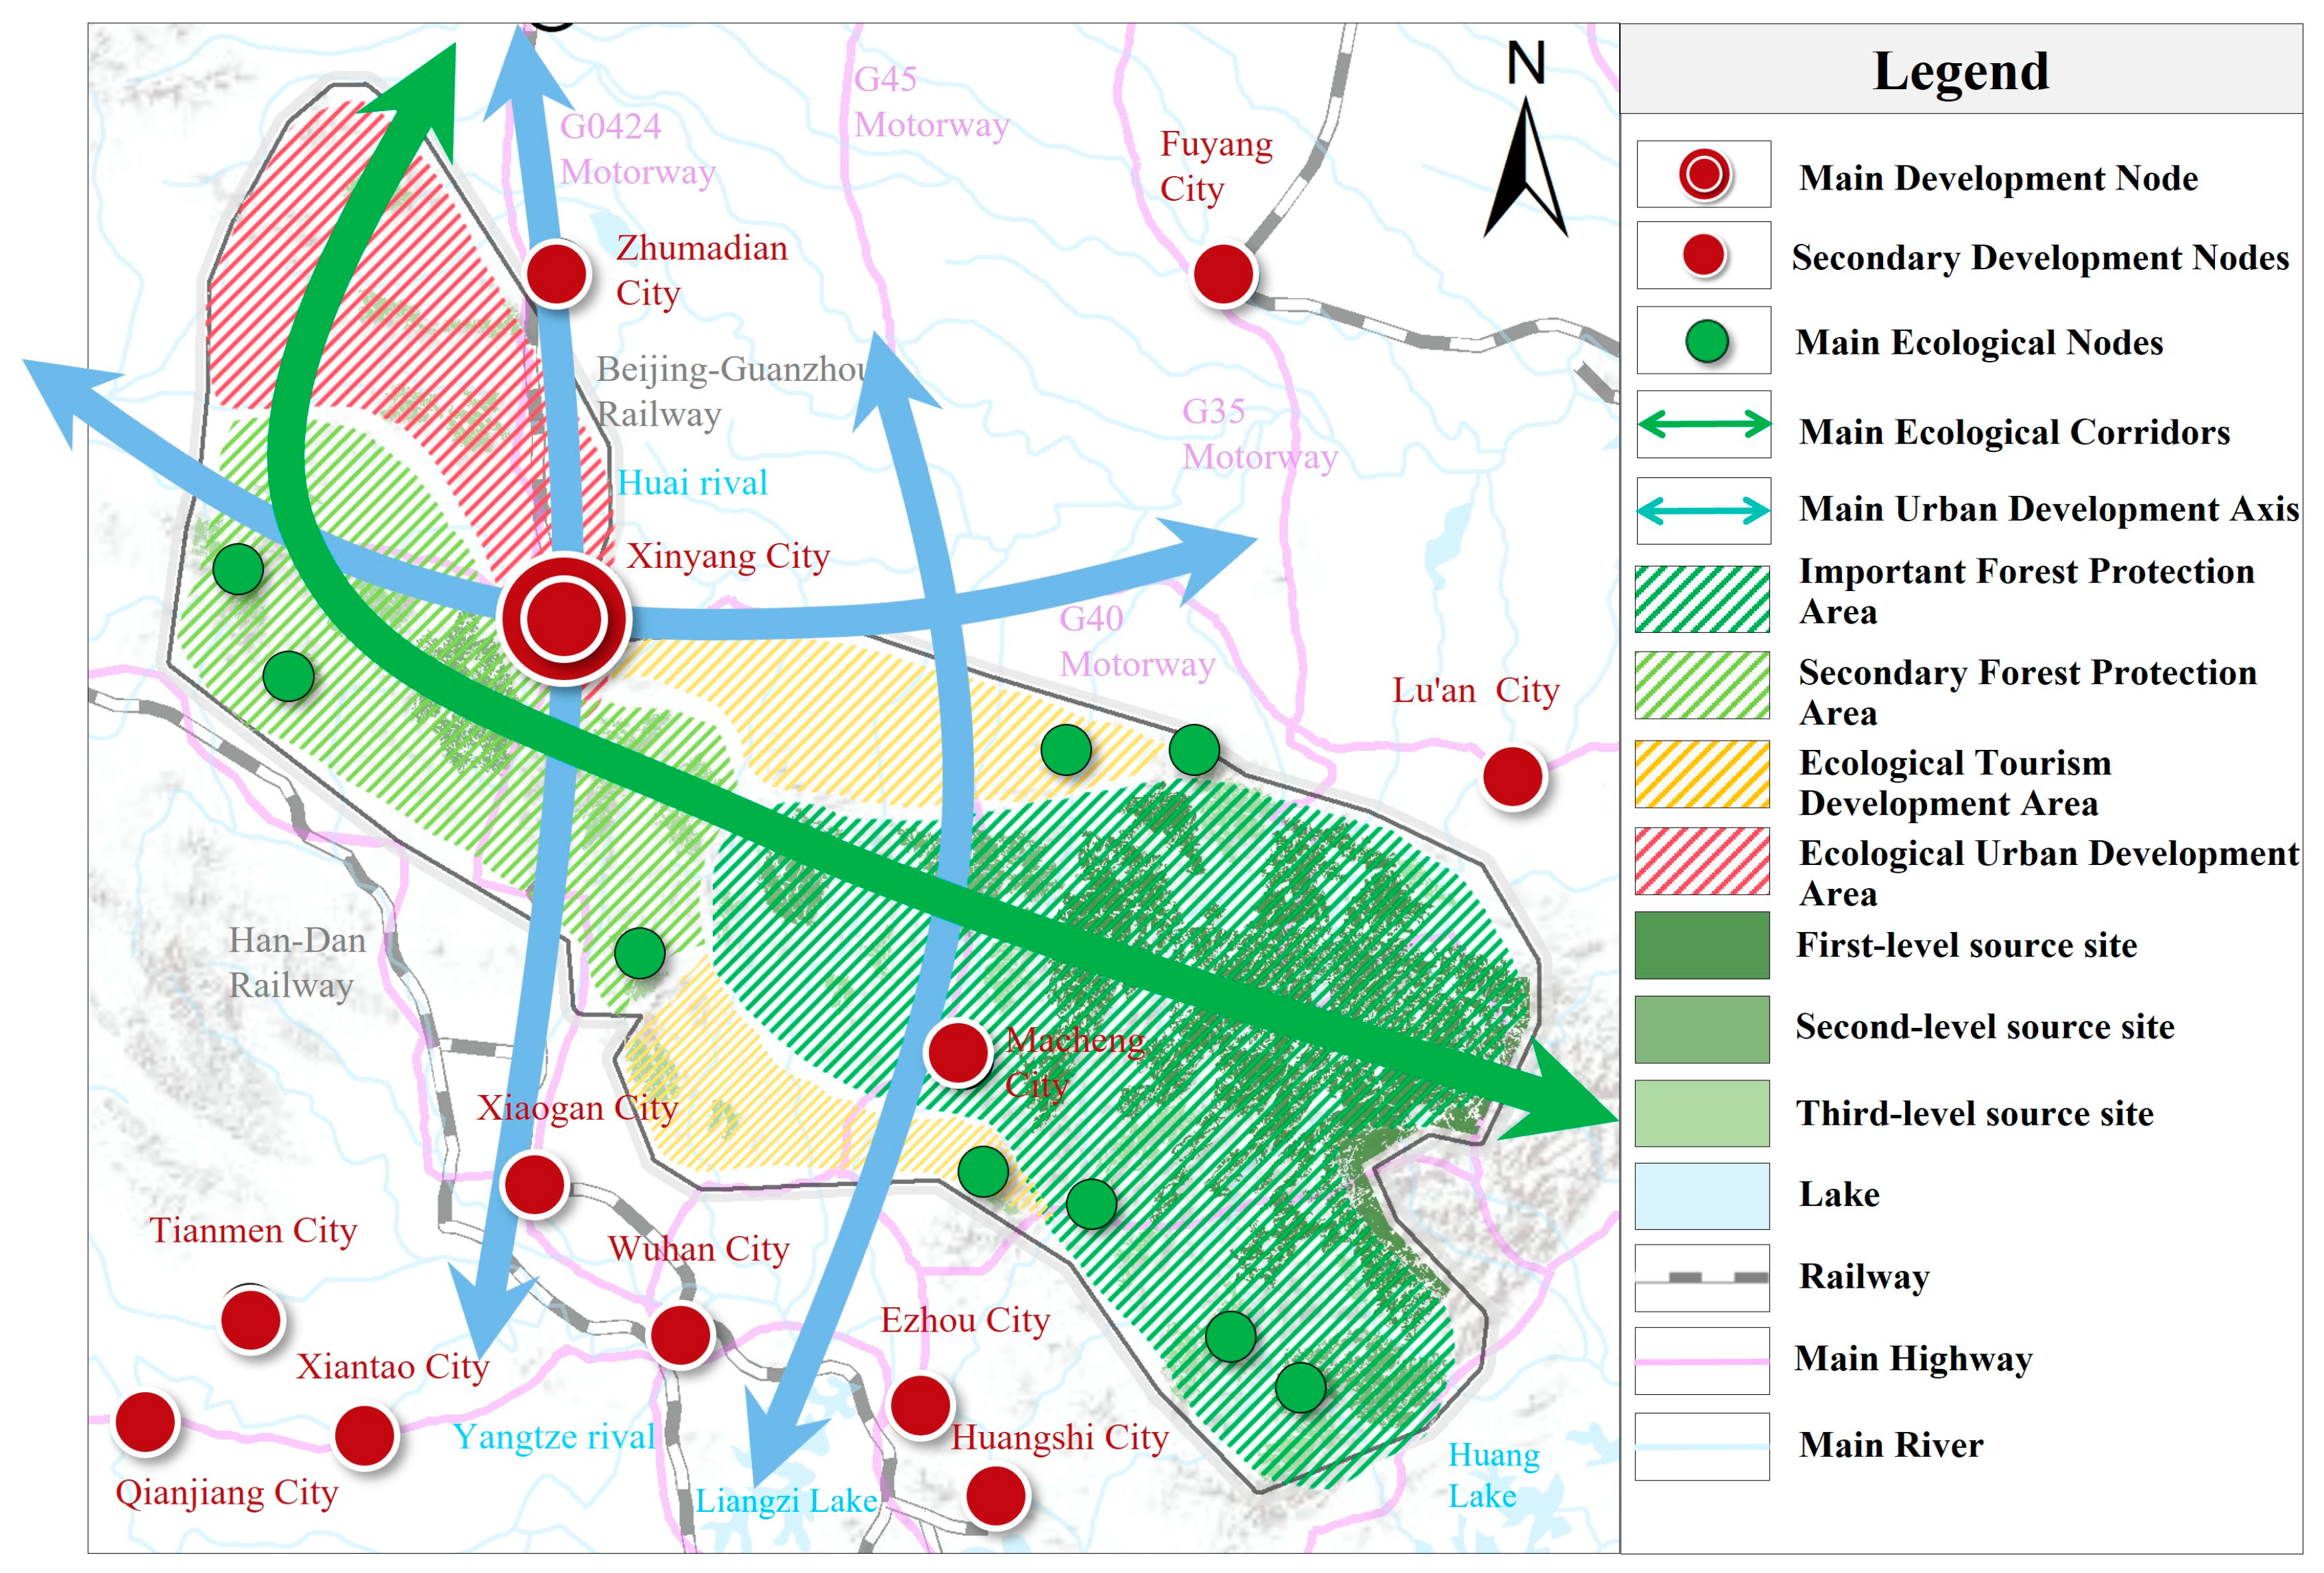
- Forestland ESP
- Restoration strategies
4. Discussion
4.1. Discussion on the Functions of Forestland Ecosystem Services
4.2. Construction and Restoration of Forestland ESP
4.3. Limitations and Future Prospects
- Limitations
- Future Prospects
5. Conclusions
Author Contributions
Funding
Data Availability Statement
Conflicts of Interest
Abbreviations
| ESP | Ecosystem Service Pattern |
| FESI | Forestland Ecosystem Service Index |
| MSPA | Morphological Spatial Pattern Analysis |
| SC | Soil Conservation |
| WC | Water Conservation |
| CS | Carbon Sequestration |
| WSF | Windbreak and Sand Fixation |
| BC | Biodiversity Conservation |
| FR | Forest Recreation |
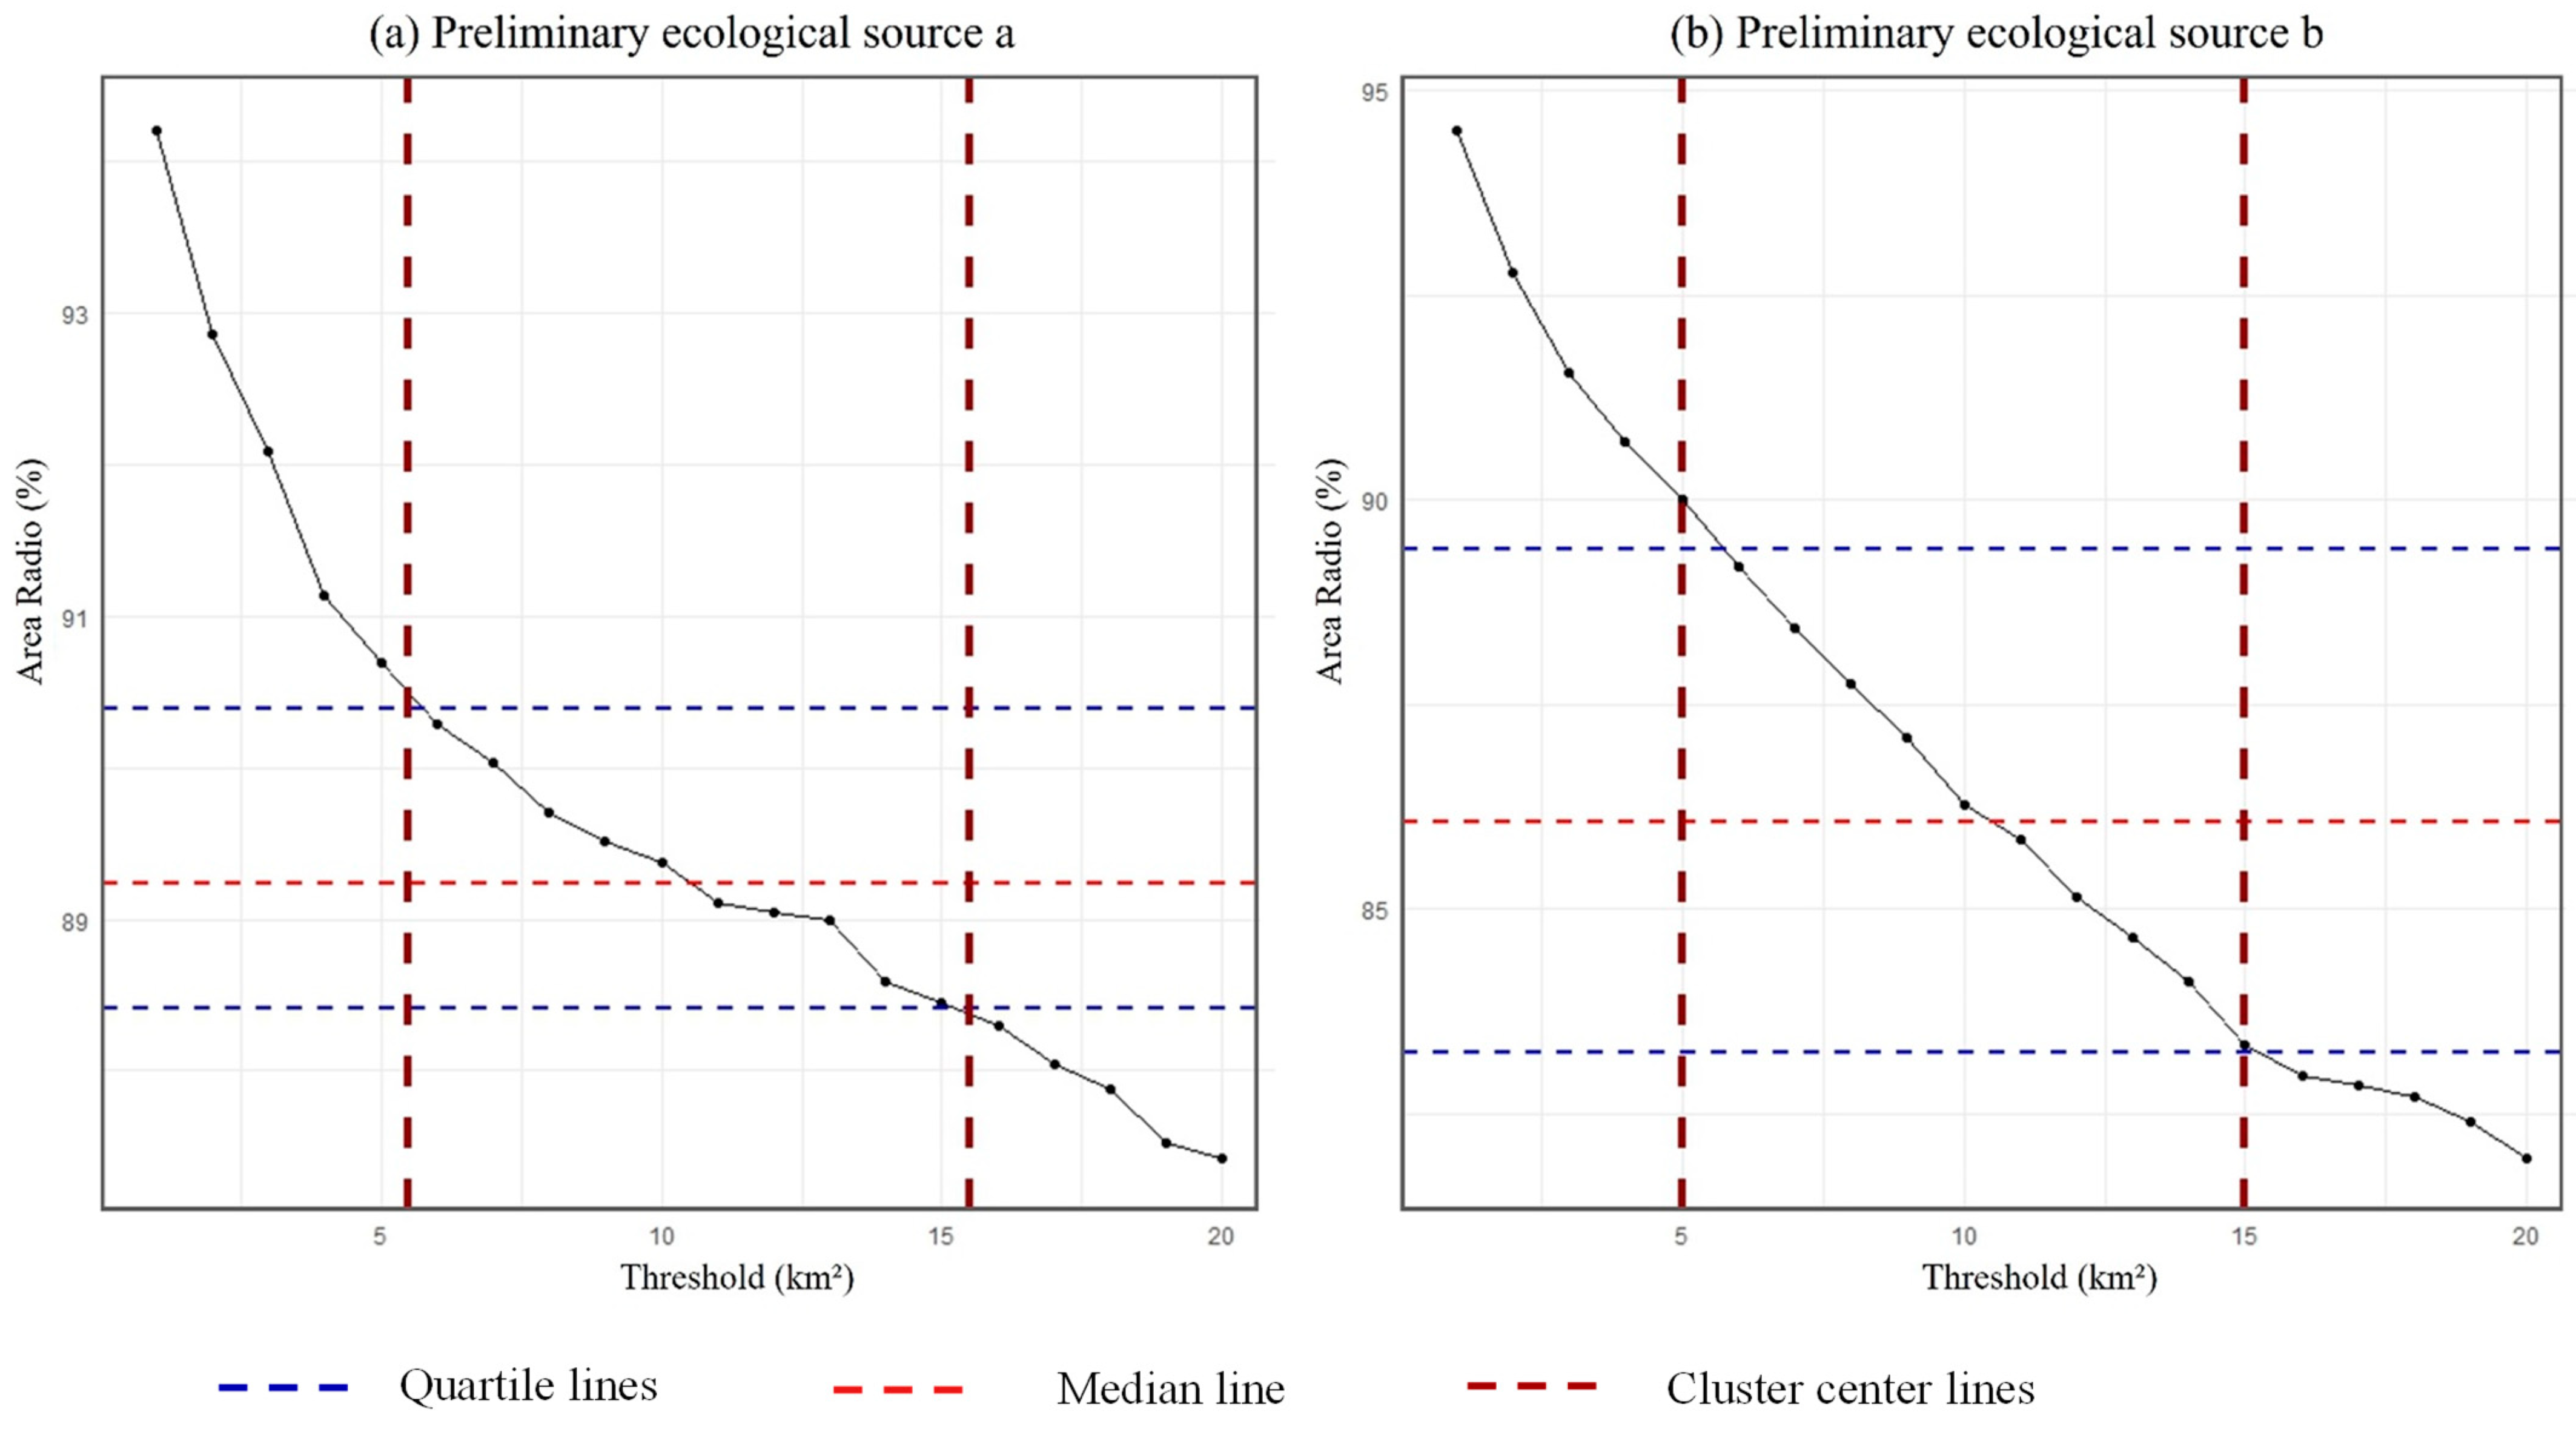
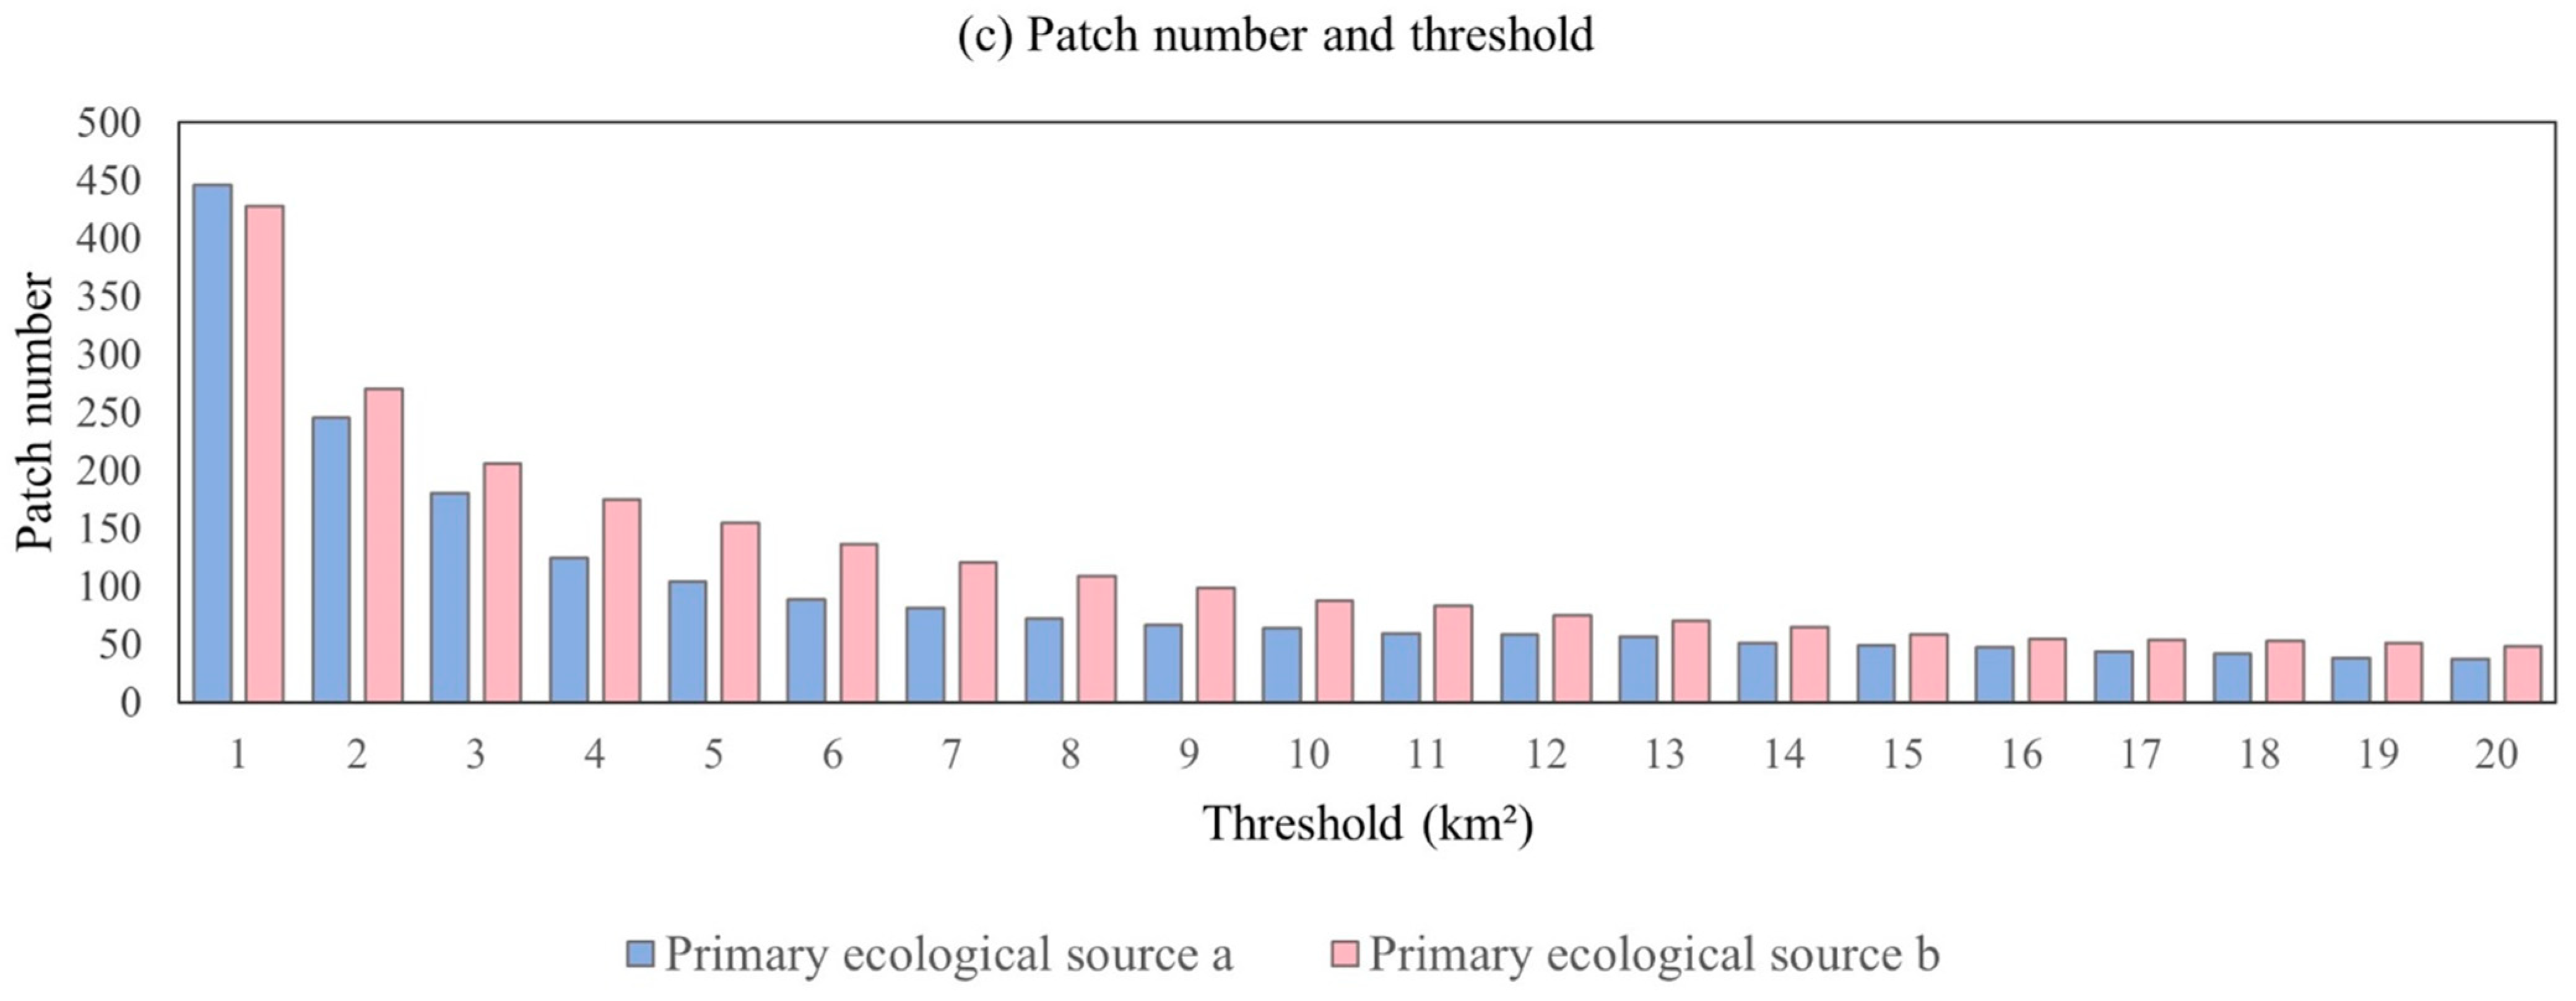
Appendix A
Appendix A.1. The K-Means Method Was Used to Select the Threshold
Appendix A.2. Parameter Settings for Comprehensive Resistance Surface Construction

| Factor Name | 1st Level | 2nd Level | 3rd Level | 4th Level | 5th Level | Weight |
|---|---|---|---|---|---|---|
| DEM (m) | <200 | 200–300 | 300–500 | 500–1000 | >1000 | 0.0993 |
| Slope (°) | <2 | 2–6 | 6–15 | 15–25 | >25 | 0.3003 |
| TR (m) | <10 | 10–20 | 21–30 | 31–50 | >50 | 0.2764 |
| NDVI (Index) | >0.8 | 0.6–0.8 | 0.4–0.6 | 0.2–0.4 | <0.2 | 0.0464 |
| River Proximity Distance (m) | <1000 | 1000–3000 | 3000–5000 | 5000–7000 | >7000 | 0.0158 |
| LULC | Forest, Water | Grassland | Cropland | Barren | Built-up land | 0.0251 |
| POP(person/km2) | <200 | 200–300 | 300–500 | 500–700 | >700 | 0.0451 |
| GDP (Unit: 10,000 CNY/km2) | <500 | 500–1000 | 1000–1500 | 1500–3000 | >3000 | 0.0522 |
| NTL(nW/cm2/sr) | <2 | 2–5 | 5–15 | 15–20 | >20 | 0.0058 |
| Road Proximity Distance (m) | >6000 | 4000–6000 | 2000–4000 | 1000–2000 | <1000 | 0.1335 |
References
- Miklós, L.; Diviaková, A.; Izakovičová, Z. Procedures of Designing the Territorial System of Ecological Stability. In Ecological Networks and Territorial Systems of Ecological Stability; Springer: Cham, Switzerland, 2019; pp. 43–118. [Google Scholar] [CrossRef]
- Meier, K.; Kuusemets, V.; Luig, J.; Mander, Ü. Riparian buffer zones as elements of ecological networks: Case study on Parnassius mnemosyne distribution in Estonia. Ecol. Eng. 2005, 24, 531–537. [Google Scholar] [CrossRef]
- Zhou, L.; Qin, Y.; Cheng, J.; Zhu, H.; Li, M.; Zhang, J.; LeBleu, C.; Shen, G.; Chen, T.; Liu, Y. Urban ecosystem services, ecological security patterns and ecological resilience in coastal cities: The impact of land reclamation in Macao SAR. J. Environ. Manag. 2025, 373, 12375. [Google Scholar] [CrossRef] [PubMed]
- Wang, J.; Bai, Y.; Huang, Z.; Ashraf, A.; Ali, M.; Fang, Z.; Lu, X. Identifying ecological security patterns to prioritize conservation and restoration: A case study in Xishuangbanna tropical region, China. J. Clean. Prod. 2024, 444, 141222. [Google Scholar] [CrossRef]
- Ali, A. Linking forest ecosystem processes, functions and services under integrative social–ecological research agenda: Current knowledge and perspectives. Sci. Total Environ. 2023, 892, 164768. [Google Scholar] [CrossRef]
- Notice of the State Forestry Administration on Deepening the Study and Implementation of General Secretary Xi Jinping’s Important Speech on Forest Ecological Security. Available online: https://www.gov.cn/xinwen/2016-03/09/content_5051126.htm (accessed on 26 January 2025).
- Harvard Graduate School of Design. Available online: https://www.gsd.harvard.edu/person/richard-t-t-forman/ (accessed on 24 February 2025).
- Forman, R.T.T. Some general principles of landscape and regional ecology. Landsc. Ecol. 1995, 10, 133–142. [Google Scholar] [CrossRef]
- Yu, K. Security patterns and surface model in landscape ecological planning. Landsc. Urban Plan. 1996, 36, 1–17. [Google Scholar] [CrossRef]
- Dong, X.; Wang, F.; Fu, M. Research progress and prospects for constructing ecological security pattern based on ecological network. Ecol. Indic. 2024, 168, 112800. [Google Scholar] [CrossRef]
- Shu, R.; Ma, G.; Zou, Y.; Guo, N.; Su, H.; Zhang, G. Bibliometric analysis of ecological security pattern construction: Current status, evolution, and development trends. Ecol. Indic. 2024, 169, 112754. [Google Scholar] [CrossRef]
- Aminzadeh, B.; Khansefid, M. A case study of urban ecological networks and a sustainable city: Tehran’s metropolitan area. Urban Ecosyst. 2010, 13, 23–36. [Google Scholar] [CrossRef]
- Momeni Dehaghi, I.; Soffianian, A.; Hemami, M.-R.; Pourmanafi, S.; Salmanmahiny, A.; Wu, G.-M. Exploring structural and functional corridors for wild sheep (Ovis orientalis) in a semi-arid area. J. Arid Environ. 2018, 156, 27–33. [Google Scholar] [CrossRef]
- Opinions of the State Council on Strengthening Key Work on Environmental Protection. Available online: https://www.gov.cn/gongbao/content/2011/content_1977824.htm (accessed on 26 January 2025).
- Cao, C.; Luo, Y.; Xu, L.; Xi, Y.; Zhou, Y. Construction of ecological security pattern based on InVEST-Conefor-MCRM: A case study of Xinjiang, China. Ecol. Indic. 2024, 159, 111647. [Google Scholar] [CrossRef]
- Peng, J.; Yang, Y.; Liu, Y.X.; Hu, Y.N.; Du, Y.Y.; Meersmans, J.; Qiu, S.J. Linking ecosystem services and circuit theory to identify ecological security patterns. Sci. Total Environ. 2018, 644, 781–790. [Google Scholar] [CrossRef] [PubMed]
- Ma, J.; Li, L.; Jiao, L.; Zhu, H.; Liu, C.; Li, F.; Li, P. Identifying Ecological Security Patterns Considering the Stability of Ecological Sources in Ecologically Fragile Areas. Land 2024, 13, 214. [Google Scholar] [CrossRef]
- The Dabie Mountain Nature Reserve in Xinyang, Henan Has Passed the National Review. Available online: https://sthjt.henan.gov.cn/2014/01-15/1005933.html (accessed on 26 January 2025).
- Tongbai County: “Integration of Four Types of Tourism” Boosts the Thriving Development of All-for-One Tourism. Available online: https://www.tongbai.gov.cn/2025/01-14/859624.html (accessed on 26 January 2025).
- Premium Scenic Area: Hubei Dabie Mountain Main Peak Sports Tourism Scenic Area. Available online: https://tyj.hubei.gov.cn/bmdt/ztzl/2024jpxm/2024jpjq/202406/t20240617_5239967.shtml (accessed on 26 January 2025).
- Introduction to the Huai River Source. Available online: http://www.fecomee.org.cn/zthd/hhysdkcx/hhy/201308/t20130808_567729.html (accessed on 26 January 2025).
- What Is GIS?|Geographic Information System Mapping Technology. Available online: https://www.esri.com/en-us/what-is-gis/overview (accessed on 24 February 2025).
- The 30 m Annual Land Cover Datasets and Its Dynamics in China from 1985 to 2023. 2023. Available online: https://zenodo.org/record/12779975 (accessed on 26 January 2025).
- National Tibetan Plateau Data Center. Available online: https://data.tpdc.ac.cn/ (accessed on 26 January 2025).
- National Climatic Data Center. Available online: https://www.ncei.noaa.gov/ (accessed on 26 January 2025).
- NASA-Earthdata. Available online: https://www.earthdata.nasa.gov/ (accessed on 26 January 2025).
- Geographic Spatial Data Cloud. Available online: https://www.gscloud.cn/home (accessed on 26 January 2025).
- Resource and Environmental Science Date Platform. Available online: https://www.resdc.cn/ (accessed on 26 January 2025).
- OpenStreetMap (OSM). Available online: https://www.openstreetmap.org/ (accessed on 26 January 2025).
- Amap. Available online: https://ditu.amap.com/ (accessed on 15 November 2024).
- The National Standard “Specifications for Assessment of Forest Ecosystem Services” Led by the Forest Environment and Protection Institute Has Been Officially Released. Available online: https://www.caf.ac.cn/info/1254/37110.htm (accessed on 25 January 2025).
- Technical Specification for Investigation and Assessment of National Ecological Status—Ecosystem Services Assessment. Available online: https://www.mee.gov.cn/ywgz/fgbz/bz/bzwb/stzl/202106/t20210615_839011.shtml (accessed on 25 January 2025).
- Technical Specification for Supervision of Ecological Conservation Redline—Ecological Function Evaluation (on Trial). Available online: https://sthjt.yn.gov.cn/hjbz/sthjbhbz/202404/t20240418_237970.html (accessed on 26 January 2025).
- Technical Guidelines for the Assessment of Resource and Environmental Carrying Capacity and the Suitability of National Territorial Spatial Development (Pilot Edition). Available online: https://www.gov.cn/zhengce/zhengceku/2020-01/22/content_5471523.htm (accessed on 26 January 2025).
- Gong, J.; Zhang, Y.; Qian, C.Y. Temporal and spatial distribution of net ecosystem productivity in the Bailongjiang Watershed of Gansu Province. Acta Ecol. Sinica 2017, 37, 5121–5128. [Google Scholar]
- Chi, Y.; Xu, K.; Wang, J.; Zhang, L. Identifying regional ecological space in Beijing, Tianjin, and Hebei. Acta Ecol. Sinica 2018, 38, 8555–8563. [Google Scholar]
- MSPA. Available online: https://forest.jrc.ec.europa.eu/en/activities/lpa/mspa/ (accessed on 26 January 2025).
- Conefor. Available online: http://www.conefor.org/ (accessed on 26 January 2025).
- Ye, X.; Cheng, S.; Wang, Q. Spatial Pattern Optimization of “Production-living-ecological’Space in Dabie Mountain Area Based on Ecological SecurityPattern: A Case Study of Lu’an City, Anhui Province. J. Mianyang Teach. Coll. 2023, 42, 119–125. [Google Scholar] [CrossRef]
- Linkage Mapper. Available online: https://linkagemapper.org/ (accessed on 26 January 2025).
- Order of the State Forestry Administration (No. 27). Available online: https://www.gov.cn/flfg/2011-08/02/content_1918095.htm (accessed on 26 January 2025).
- Policy Interpretation of the “Implementation Plan for the High-Quality Development of the Dabie Mountain Revolutionary Old District in the New Era”. Available online: https://www.ah.gov.cn/public/1681/7945641.html (accessed on 26 January 2025).
- Lu’an City’s “Combination of Measures” to Continue Improving the Water Ecological Compensation Mechanism in the Dabie Mountain Area. Available online: https://sthjt.ah.gov.cn/hbzx/gzdt/sxdt/121433621.html (accessed on 26 January 2025).
- In 2003, China Experienced “Dramatic Changes” with the Huai River Flood Topping the List. Available online: https://www.chinacourt.org/article/detail/2004/01/id/99027.shtml (accessed on 26 January 2025).
- Chen, G.; Wei, Q.; Li, W.; Yuan, Z.; Jian, M. Quantitative analysis of the mechanism of abnormal weather and climate disasters in 2003 I-Flood in the Huaihe River Basin and extreme heat in the south in summer. J. Trop. Meteorol. 2005, 21, 44–54. [Google Scholar] [CrossRef]
- Huaihe River Ecological and Economic Belt Development Plan. Available online: https://www.gov.cn/zhengce/zhengceku/2018-12/31/content_5434891.htm (accessed on 26 January 2025).
- Lu’an City: Innovative Integration of Culture and Tourism Makes “Poetry and the Distant Future” Stand Out and Shine. Available online: http://www.ah.xinhuanet.com/20240914/4cb0b9ab20944e7194720657d47b5bc3/c.html (accessed on 26 January 2025).
- Torres-Díaz, V.; del Río-Rama, M.d.l.C.; Álvarez-García, J.; Simonetti, B. Environmental sustainability and tourism growth: Convergence or compensation? Qual Quant. 2024. [Google Scholar] [CrossRef]
- Li, Z.; Liu, J.; Ma, R.; Xie, W.; Zhao, X.; Wang, Z.; Zhang, B.; Yin, L. Construction of Ecological Security Pattern Based on Ecosystem Services, Sensitivity, Connectivity, and Resistance—A Case Study in the Huang-Huai-Hai Plain. Land 2024, 13, 2243. [Google Scholar] [CrossRef]
- InVEST Models. Available online: https://naturalcapitalproject.stanford.edu/software/invest/invest-models (accessed on 26 January 2025).
- Ge, Y. Evaluation of Ecological Security and Spatial Pattern Construction in Dabie Mountain Area Based on Ecosystem Services. Master’s Thesis, Henan University, Kaifeng, China, 2024. Available online: https://kns.cnki.net/kcms2/article/abstract?v=Sx3iFXVSxlKO4_7EDKKHnvPgMXSE7U-3heIsxXp15a4CqW0l2Pkalwx6yXyQvD2OOO-7uoTNWxLHe1qcD7r2dOHSs6tQh8RNfipY49-f48muCAc-GPriOAloLClLvFbCKgboDPLU7hc2AKV2Vl4sdTnXxsWWhd-61Hxtrd62QW53eVidOES_ytp3GAJyT3ArSjZWl4QnE0M=&uniplatform=NZKPT&language=CHS (accessed on 26 January 2025).
- Li, S.; Li, Y.; Jiang, N.; Xu, W. Development of key ecological conservation and restoration projects in the past century. Ecol. Front. 2025, 45, 1–6. [Google Scholar] [CrossRef]
- Yang, Y.; Wang, Y.; Zhou, H.; Chen, X.; Tao, S.; Kong, Y. Evaluation of the effect of road barriers on wildlife habitats. Transp. Res. Part D Transp. Environ. 2024, 131, 104218. [Google Scholar] [CrossRef]
- He, J.; Huang, M.; Zhao, H.; Chen, F. The Process of Urban Networked Spatial Growth and Its Impact on Regional Ecosystem: A Case Study of Urban Agglomeration in the Middle Reaches of the Yangtze River. Geomat. Inf. Sci. Wuhan Univ. 2023. [Google Scholar] [CrossRef]
- Wang, J.; Wang, J.; Song, J.; Xu, X.S.; Shen, H.T.; Li, S. Optimized cartesian k-means. IEEE Trans. Knowl. Data Eng. 2015, 27, 180–192. [Google Scholar] [CrossRef]
- Dickson, B.G.; Albano, C.M.; Anantharaman, R.; Beier, P.; Fargione, J.; Graves, T.A.; Gray, M.E.; Hall, K.R.; Lawler, J.J.; Leonard, P.B.; et al. Circuit-theory applications to connectivity science and conservation. Conserv. Biol. 2019, 33, 1234–1245. [Google Scholar] [CrossRef]


| Category | Data Name | Year | Parameter Data Type | Data Source |
|---|---|---|---|---|
| Basic Data | Land Use/Land Cover (LULC) | 2003, 2013, 2023 | Resolution 30 m | Zenodo Repository [23] |
| Natural Factor | Temperature | 2003, 2013, 2023 | Resolution 1 KM | National Tibetan Plateau Data Center [24] |
| Precipitation | 2003, 2013, 2023 | Resolution 1 KM | National Tibetan Plateau Data Center [24] | |
| Relative Humidity (RH) | 2003, 2013, 2023 | Resolution 1 KM | National Tibetan Plateau Data Center [24] | |
| Wind Speed | 2003, 2013, 2023 | / | National Climatic Data Center [25] | |
| NPP | 2003, 2013, 2023 | Resolution 500 M | Nasa EarthData [26] | |
| NDVI | 2003, 2013, 2023 | Resolution 1 KM | Nasa EarthData [26] | |
| DEM | Resolution 30 m | Geospatial Data Cloud [27] | ||
| Slope | / | Generated from DEM data. | ||
| Topographic Relief (TR) | / | Generated from DEM data. | ||
| Social Factor | Population (POP) | The Seventh National Population Census | Resolution 1 KM | Resource and Environmental Science Date Platform [28] |
| Gross Domestic Product (GDP) | 2023 | Resolution 1 KM | Resource and Environmental Science Date Platform [28] | |
| Nighttime Lights (NTL) | 2023 | Resolution 1 KM | Resource and Environmental Science Date Platform [28] | |
| Accessibility Factor | Road and railway | 2003, 2013, 2023 | Shapefile | OSM [29] |
| river | 2003, 2013, 2023 | Shapefile | OSM [29] | |
| Points of Interest (POI) | Scenic spots, intangible cultural heritage, cultural relics, conservation units, and traditional villages | 2003, 2013, 2023 | Shapefile | Amap [30] |
| Indicator Name | 2003 | 2013 | 2023 |
|---|---|---|---|
| ) | 23,047.4007 | 24,149.3256 | 24,041.1015 |
| Soil Conservation (×109 kg) | 11,138.5711 | 6795.7785 | 6893.1700 |
| ) | 22.9992 | 24.0495 | 33.1663 |
| Carbon Sequestration (×109 kg) | 11.4621 | 12.8422 | 15.0621 |
| Windbreak and Sand fixation (Index, Mean) | 293.3546 | 383.1574 | 411.6767 |
| Biodiversity Conservation (Index, Mean) | 0.1426 | 0.1514 | 0.1381 |
| Forest Recreation (Index, Mean) | 0.2067 | 0.6619 | 0.7337 |
| FESI (Index, Mean) | 1.8292 | 1.8450 | 1.8567 |
| Name | % | % | % | |||
|---|---|---|---|---|---|---|
| Branch | 1058.32 | 4.59 | 1093.32 | 4.53 | 1239.13 | 5.15 |
| Edge | 2208.58 | 9.58 | 2376.54 | 9.84 | 2850.20 | 11.86 |
| Islet | 711.37 | 3.09 | 779.09 | 3.23 | 811.46 | 3.38 |
| Core | 15,451.93 | 67.04 | 15,956.96 | 66.08 | 15,095.30 | 62.79 |
| Bridge | 1597.99 | 6.93 | 1708.22 | 7.07 | 1723.13 | 7.17 |
| Loop | 979.90 | 4.25 | 1037.12 | 4.29 | 1092.62 | 4.54 |
| Perforation | 1039.31 | 4.51 | 1198.09 | 4.96 | 1229.27 | 5.11 |
| Name | Quantity | Area (km2) | % |
|---|---|---|---|
| First-level source site | 1 | 5320.94 | 56.40 |
| Second-level source site | 4 | 1637.28 | 17.35 |
| Third-level source site | 33 | 2476.58 | 26.25 |
| Sum | 38 | 9434.80 | 100.00 |
Disclaimer/Publisher’s Note: The statements, opinions and data contained in all publications are solely those of the individual author(s) and contributor(s) and not of MDPI and/or the editor(s). MDPI and/or the editor(s) disclaim responsibility for any injury to people or property resulting from any ideas, methods, instructions or products referred to in the content. |
© 2025 by the authors. Licensee MDPI, Basel, Switzerland. This article is an open access article distributed under the terms and conditions of the Creative Commons Attribution (CC BY) license (https://creativecommons.org/licenses/by/4.0/).
Share and Cite
Wang, X.; Xu, S.; Huang, X.; Yang, C.; Li, Y. Optimization and Construction of Forestland Ecological Security Pattern: A Case Study of the Huai River Source–Dabie Mountains in China. Forests 2025, 16, 426. https://doi.org/10.3390/f16030426
Wang X, Xu S, Huang X, Yang C, Li Y. Optimization and Construction of Forestland Ecological Security Pattern: A Case Study of the Huai River Source–Dabie Mountains in China. Forests. 2025; 16(3):426. https://doi.org/10.3390/f16030426
Chicago/Turabian StyleWang, Xiaofang, Shilin Xu, Xin Huang, Chaochen Yang, and Yongsheng Li. 2025. "Optimization and Construction of Forestland Ecological Security Pattern: A Case Study of the Huai River Source–Dabie Mountains in China" Forests 16, no. 3: 426. https://doi.org/10.3390/f16030426
APA StyleWang, X., Xu, S., Huang, X., Yang, C., & Li, Y. (2025). Optimization and Construction of Forestland Ecological Security Pattern: A Case Study of the Huai River Source–Dabie Mountains in China. Forests, 16(3), 426. https://doi.org/10.3390/f16030426