Article

Characteristics of Biomass and Carbon Stocks Accumulation and Biomass Estimation Model in Kandelia obovata Mangroves at the Northern Edge of Its Distribution in China

1
State Key Laboratory of Subtropical Silviculture, Zhejiang A&F University, Hangzhou 311300, China
2
School of Environmental and Resources Science, Zhejiang A&F University, Hangzhou 311300, China
3
Zhejiang Institute of Subtropical Crops, Wenzhou 325005, China
4
Marine Academy of Zhejiang Province, Hangzhou 310012, China
5
Zhejiang Province Key Think Tank, Institute of Ecological Civilization, Zhejiang A&F University, Hangzhou 311300, China
*
Author to whom correspondence should be addressed.
Forests 2025, 16(3), 451; https://doi.org/10.3390/f16030451
Submission received: 26 January 2025 / Revised: 27 February 2025 / Accepted: 28 February 2025 / Published: 2 March 2025
(This article belongs to the Section Forest Inventory, Modeling and Remote Sensing)

Abstract

:
Mangrove ecosystems rank among the most productive on Earth. Conducting research on the biomass prediction model of mangroves, as well as achieving simple and efficient estimations of the biomass of mangrove plant organs and the overall biomass, is of utmost significance for evaluating the productivity of the mangrove ecosystem and offering guidance for the future planning, restoration, and management of mangroves. This study examines the biomass distribution characteristics of Kandelia obovata at the northern edge of its range in China and develops models for estimating the biomass of its various components and individual trees. The findings provide valuable references for accurately assessing the biomass of Kandelia obovata plantations in Zhejiang Province. We measured the biomass of different components (branches, leaves, roots) using the harvest method and employed independent variables, including basal diameter (D), tree height (H), diameter squared (D2), the product of diameter squared and height (D2H), and the product of basal diameter and height (DH). Dependent variables included the leaf, branch, root, and total biomass. We developed linear, quadratic, and power function regression equations, selecting the optimal models based on the coefficient of determination (R2), significance of regression, root mean square error (RMSE), and Akaike Information Criterion (AIC). The total biomass ranged from 0.100 to 0.925 Mg ha−1, while the carbon stocks ranged from 0.038 to 0.377 Mg C ha−1. Results indicated that branch biomass accounted for the highest proportion (47.44%~68.35%), while leaf biomass (8.61%~27.83%) and root biomass (23.04%~25.64%) were relatively lower. Similarly, branch carbon storage constituted the highest proportion (52.68%~77.79%), with leaf (8.70%~29.36%) and root carbon storage (13.51%~20.55%) being lower. The optimal model exhibited R2 values ranging from 0.594 to 0.921 and significant F-tests (p < 0.001). Single variables D, D2, and combined variables D2H and DH provided the best fits. Basal diameter (D) and tree height (H) effectively predict the biomass of Kandelia obovata across different ages, with combined variables DH and D2H enhancing model accuracy. The biomass estimation model for total biomass is: WTotal = 0.0584(DH)1.3918 (R2 = 0.908, F = 2459.87, RMSE = 0.448). This model serves as a reliable tool for estimating the biomass of Kandelia obovata mangroves at the northern edge of its distribution in China.

1. Introduction

Mangroves are coastal wetland forests found in tropical and subtropical intertidal zones. They are characterized by periodic tidal inundation and are dominated by evergreen shrubs or small trees known as mangrove species. Mangrove ecosystems are among the most productive on Earth and are key targets for global biodiversity conservation and wetland ecological protection [1,2]. These wetlands have significant carbon sequestration potential and play a crucial role in mitigating climate change and maintaining the global carbon cycle. Studies show that, despite covering only 0.1% of the Earth’s surface, mangroves sequester 5% of atmospheric carbon [3]. Biomass is a critical component of carbon storage and sequestration in mangrove ecosystems. Under the Kyoto Protocol framework, mangroves are considered a viable option for the Clean Development Mechanism (CDM) [4]. Quantifying mangrove biomass is essential for understanding the structure and function of these ecosystems, reflecting the community’s capacity to utilize natural resources, and analyzing carbon storage distribution patterns in tropical and subtropical coastal areas [5,6]. This research is vital for evaluating mangrove ecosystem productivity, exploring global carbon cycles, and guiding future mangrove planning, restoration, and management [7]. Recently, rapidly and accurately estimating mangrove biomass has become a significant research topic due to its implications for global climate change [8,9]. Thus, developing biomass prediction models for mangroves is crucial for efficiently estimating the biomass of various plant organs and the entire mangrove plant.
The natural southern and northern distribution limits of mangroves in China are Sanya City in Hainan Province (18°12′ N) and Fuding City in Fujian Province (27°20′ N), respectively, with the northernmost artificial introduction occurring in Zhoushan City, Zhejiang Province (29°32′ N). Due to human activities and climate change, mangrove ecosystems have experienced severe degradation. Between 2000 and 2012, the global annual loss of mangroves was 0.16% to 0.39%, with Southeast Asia experiencing a loss of 3.58% to 8.08% [10]. In China, approximately 62% of mangroves were lost between 1973 and 2000 [11,12]. Since 2000, significant efforts have been made to protect and restore mangroves. By 2020, the total area of mangroves in China had reached 27,100 hectares, reflecting a 23.04% increase from 2000, with artificial afforestation being the primary driver of this increase [13]. In Zhejiang Province, which marks the northern boundary for artificial mangrove introduction, efforts to plant mangroves began in the 1950s and intensified after 2000. By 2020, the mangrove area in Zhejiang Province totaled 386.77 hectares, including 257.01 hectares in Wenzhou and 129.76 hectares in Taizhou, with the primary planting species being Kandelia obovata (368.48 hectares) and Aegiceras corniculatum (18.29 hectares) [14]. As of 2022, the total mangrove area in Zhejiang Province had increased to 493 hectares, with 363 hectares in Wenzhou and 130 hectares in Taizhou. Kandelia obovata, an evergreen shrub or small tree in the Rhizophoraceae family and Kandelia genus, is the most widely distributed and cold-tolerant true mangrove species in China and has become a major planting species in Zhejiang.
Biomass underpins material cycling and energy flow within ecosystems and serves as a crucial indicator of ecosystem productivity. Biomass estimation methods include direct harvest, remote sensing estimation method and model-based approaches. While direct harvest methods are the most accurate, they are labor-intensive, destructive, and impractical for large-scale biomass estimation [15]. Remote sensing estimation methods are techniques that obtain electromagnetic wave information from target ground objects through sensors at a distance and then invert this information to estimate biomass. For example, unmanned aerial vehicles (UAVs) are equipped with LiDAR sensors to monitor vegetation growth parameters [16]. These technologies allow for large-scale, non-invasive monitoring but require complex data processing due to the influence of cloud cover and water content. Model-based methods utilize mathematical modeling to develop regression equations that relate biomass to easily measured factors (e.g., diameter at breast height, tree height, canopy width) or their combinations, allowing for rapid, accurate, and non-destructive biomass predictions [17,18].
Allometric growth equations offer a convenient and effective means of estimating tree biomass. There is a quantifiable relationship between tree factors (e.g., diameter at breast height (DBH) and tree height (H)) and the biomass of various tree organs [19]. Combining DBH and H to create biomass growth equations is a reliable method for estimating the biomass of different tree organs and the entire plant, and this approach is widely adopted [18,20]. Including both DBH and H in biomass models can enhance the accuracy of estimates.
Currently, allometric growth equations are the most commonly used method in mangrove biomass research [21] due to their simplicity and low destructiveness. However, factors such as plant species, growing environments, and tree ages can influence the growth patterns of mangrove species [22]. Thus, it is essential to select the most appropriate species-specific allometric growth equations based on actual community survey results, preferably using equations from the research region [23]. This study investigates Kandelia obovata mangrove plantations in Wenzhou, Zhejiang, by measuring the biomass of different organs of individual Kandelia obovata trees and developing biomass models for each organ and the whole plant.

2. Materials and Methods

2.1. General Description of the Study Area

The study area is located in Wenzhou City, southeastern Zhejiang Province (7°03′ N to 28°36′ N, 119°37′ E to 121°18′ E). The terrain slopes from west to east, with hilly regions in the west transitioning to a coastal plain in the east (Figure 1). The land area covers 12,110 square kilometers, while the sea area encompasses 8649 square kilometers. The region within the −200 m isobath measures 66,700 square kilometers. Wenzhou experiences a humid subtropical monsoon climate with distinct seasonal variations, moderate temperatures, and abundant rainfall. The average annual temperature ranges from 17.3 °C to 19.4 °C, and annual precipitation varies between 1113 mm and 2494 mm. The mangroves in the study area are all artificially planted, primarily consisting of Kandelia obovata. Other mangrove species present in smaller numbers include Myoporum bontioides, Sonneratia apetala, and Aegiceras corniculatum. For this study, Kandelia obovata was chosen as the research subject [24,25].

2.2. Sample Collection

All samples for this study were collected in August and September 2023, during the peak period for mangrove biomass accumulation. Healthy Kandelia obovata trees were selected for biomass modeling in the study area. At each study site, 4–6 plots (5 m × 10 m) were measured. The trees were categorized into different height classes based on basal diameter (D), while crown width and other factors were also considered. After felling, the basal diameter (D) and height (H) of each tree were measured. The trees were then divided into three sections—upper, middle, and lower—and the biomass of each section was recorded. Branches and leaves from the sampled trees were collected and weighed fresh. Root biomass was obtained via full excavation. Roots were carefully extracted from adjacent soil by surface-to-depth digging and then weighed.
The sampled organs were transported to the laboratory, where they were first placed in an oven at 105 °C for 2 h to kill the green tissue. They were then dried at 65 °C to a constant weight and weighed to determine the dry mass. Moisture content was calculated based on the fresh and dry weights. Fresh biomass was converted to dry biomass, and the proportions and carbon content of each component were determined. Carbon content was determined using a fully automatic solid total organic carbon analyzer. Basic information on the collected Kandelia obovata samples is presented in Table 1.

2.3. Data Analysis

2.3.1. Biomass Model Selection and Evaluation

In this study, basal diameter (D), tree height (H), diameter squared (D2), the product of diameter squared and height (D2H), and the product of basal diameter and height (DH) were selected as independent variables. These variables were used to fit linear, quadratic, and power function models. Model performance was assessed using the coefficient of determination (R2), significance of regression (p-value), root mean square error (RMSE), and Akaike Information Criterion (AIC). The general forms of the equations are as follows:
y = a + bx
y = a + bx + cx2
y = axb
In these equations, y represents the dependent variables (leaf biomass, branch biomass, root biomass, and total biomass), while x represents the independent variables (D, H, D2, D2H, DH). The coefficients a and b are model parameters. The RMSE and AIC are calculated using the following formulas:
RMSE = 1 n 1 n ( y i - y ¯ i ) 2
AIC = 2k + nln(RSS/n)
In these formulas, y i represents the observed biomass values, y ¯ i represents the predicted biomass values, k is the number of parameters in the model, n is the number of samples, and RSS is the residual sum of squares. A smaller AIC and RMSE, as well as a larger R2 value, indicate a better model fit.

2.3.2. Carbon Content

The carbon content of each component and its proportion of the total biomass were determined. The carbon content of the total biomass of Kandelia obovata was calculated using the following formula:
TB[C]% = [(LB[C] × LB%) + (SB[C] × SB%) + (RB[C] × RB%)]/100
In this context: TB[C]—Carbon content of the total biomass of the tree.LB[C]—Carbon content of the leaves. LB%—Biomass proportion of the leaves.SB[C]—Carbon content of the branches and stems. SB%—Biomass proportion of the branches and stems. RB[C]—Carbon content of the roots. RB%—Biomass proportion of the roots.
All statistical analyses were performed using IBM SPSS 26.0, and graphical representations were generated using Origin Pro 2021. The natural logarithm transformation is used to fit the power function model. One-way ANOVA was used to examine differences in biomass among compartments.

3. Results

3.1. The Carbon Content Rate of Each Component

The carbon storage in mangrove biomass is determined by measuring vegetation biomass and multiplying it by the vegetation carbon content coefficient. At each sampling site, Kandelia obovata exhibits higher carbon content in branches and leaves compared to roots. Specifically, carbon content in leaves ranges from 38.71% to 41.26%, in branches from 38.92% to 45.37%, and in roots from 25.88% to 29.51%. Overall, the carbon content of Kandelia obovata ranges from 36.55% to 40.79% (Table 2).

3.2. Biomass and Carbon Storage Distribution Characteristics of Each Component

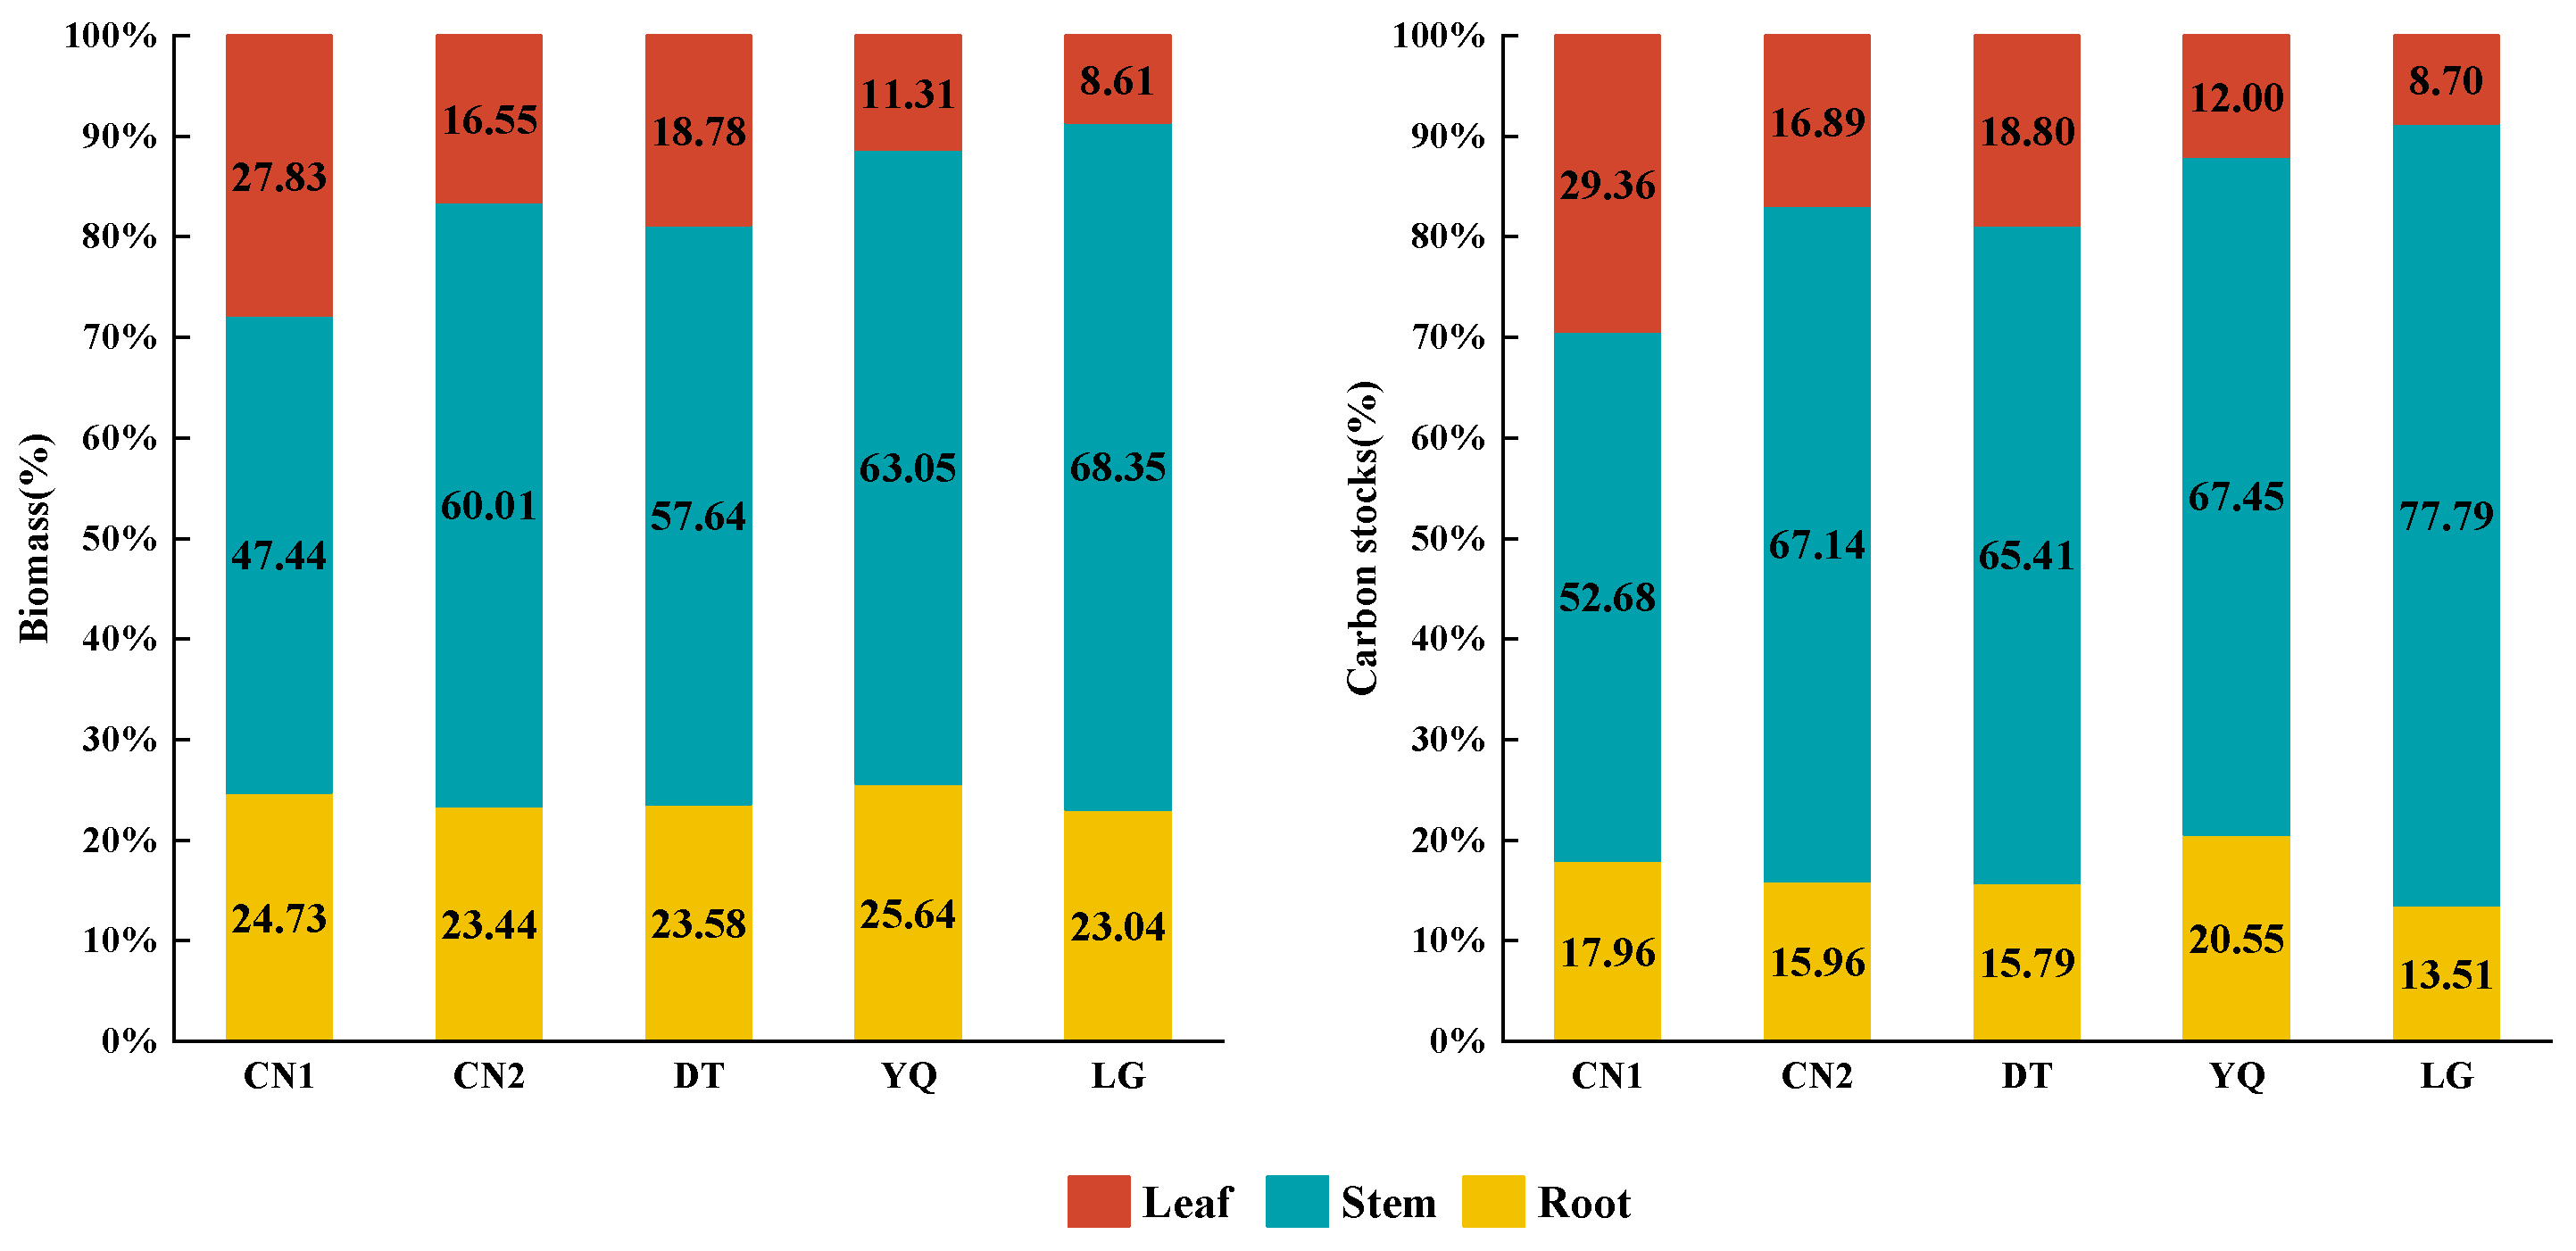
In the five regions studied, Kandelia obovata exhibits a biomass and carbon storage distribution pattern where branch biomass is predominant, while leaf and root biomass are relatively lower (Figure 2). Specifically, leaf biomass ranges from 8.61% to 27.83%, branch biomass from 47.44% to 68.35%, and root biomass from 23.04% to 25.64%. Similarly, leaf carbon storage ranges from 8.70% to 29.36%, branch carbon storage from 52.68% to 77.79%, and root carbon storage from 13.51% to 20.55%. Among the sampling sites, LG demonstrates the highest proportions of branch biomass and carbon storage, at 68.35% and 77.79%, respectively, whereas the lowest proportions of leaf biomass and carbon storage are observed at 8.61% and 8.70%, respectively.
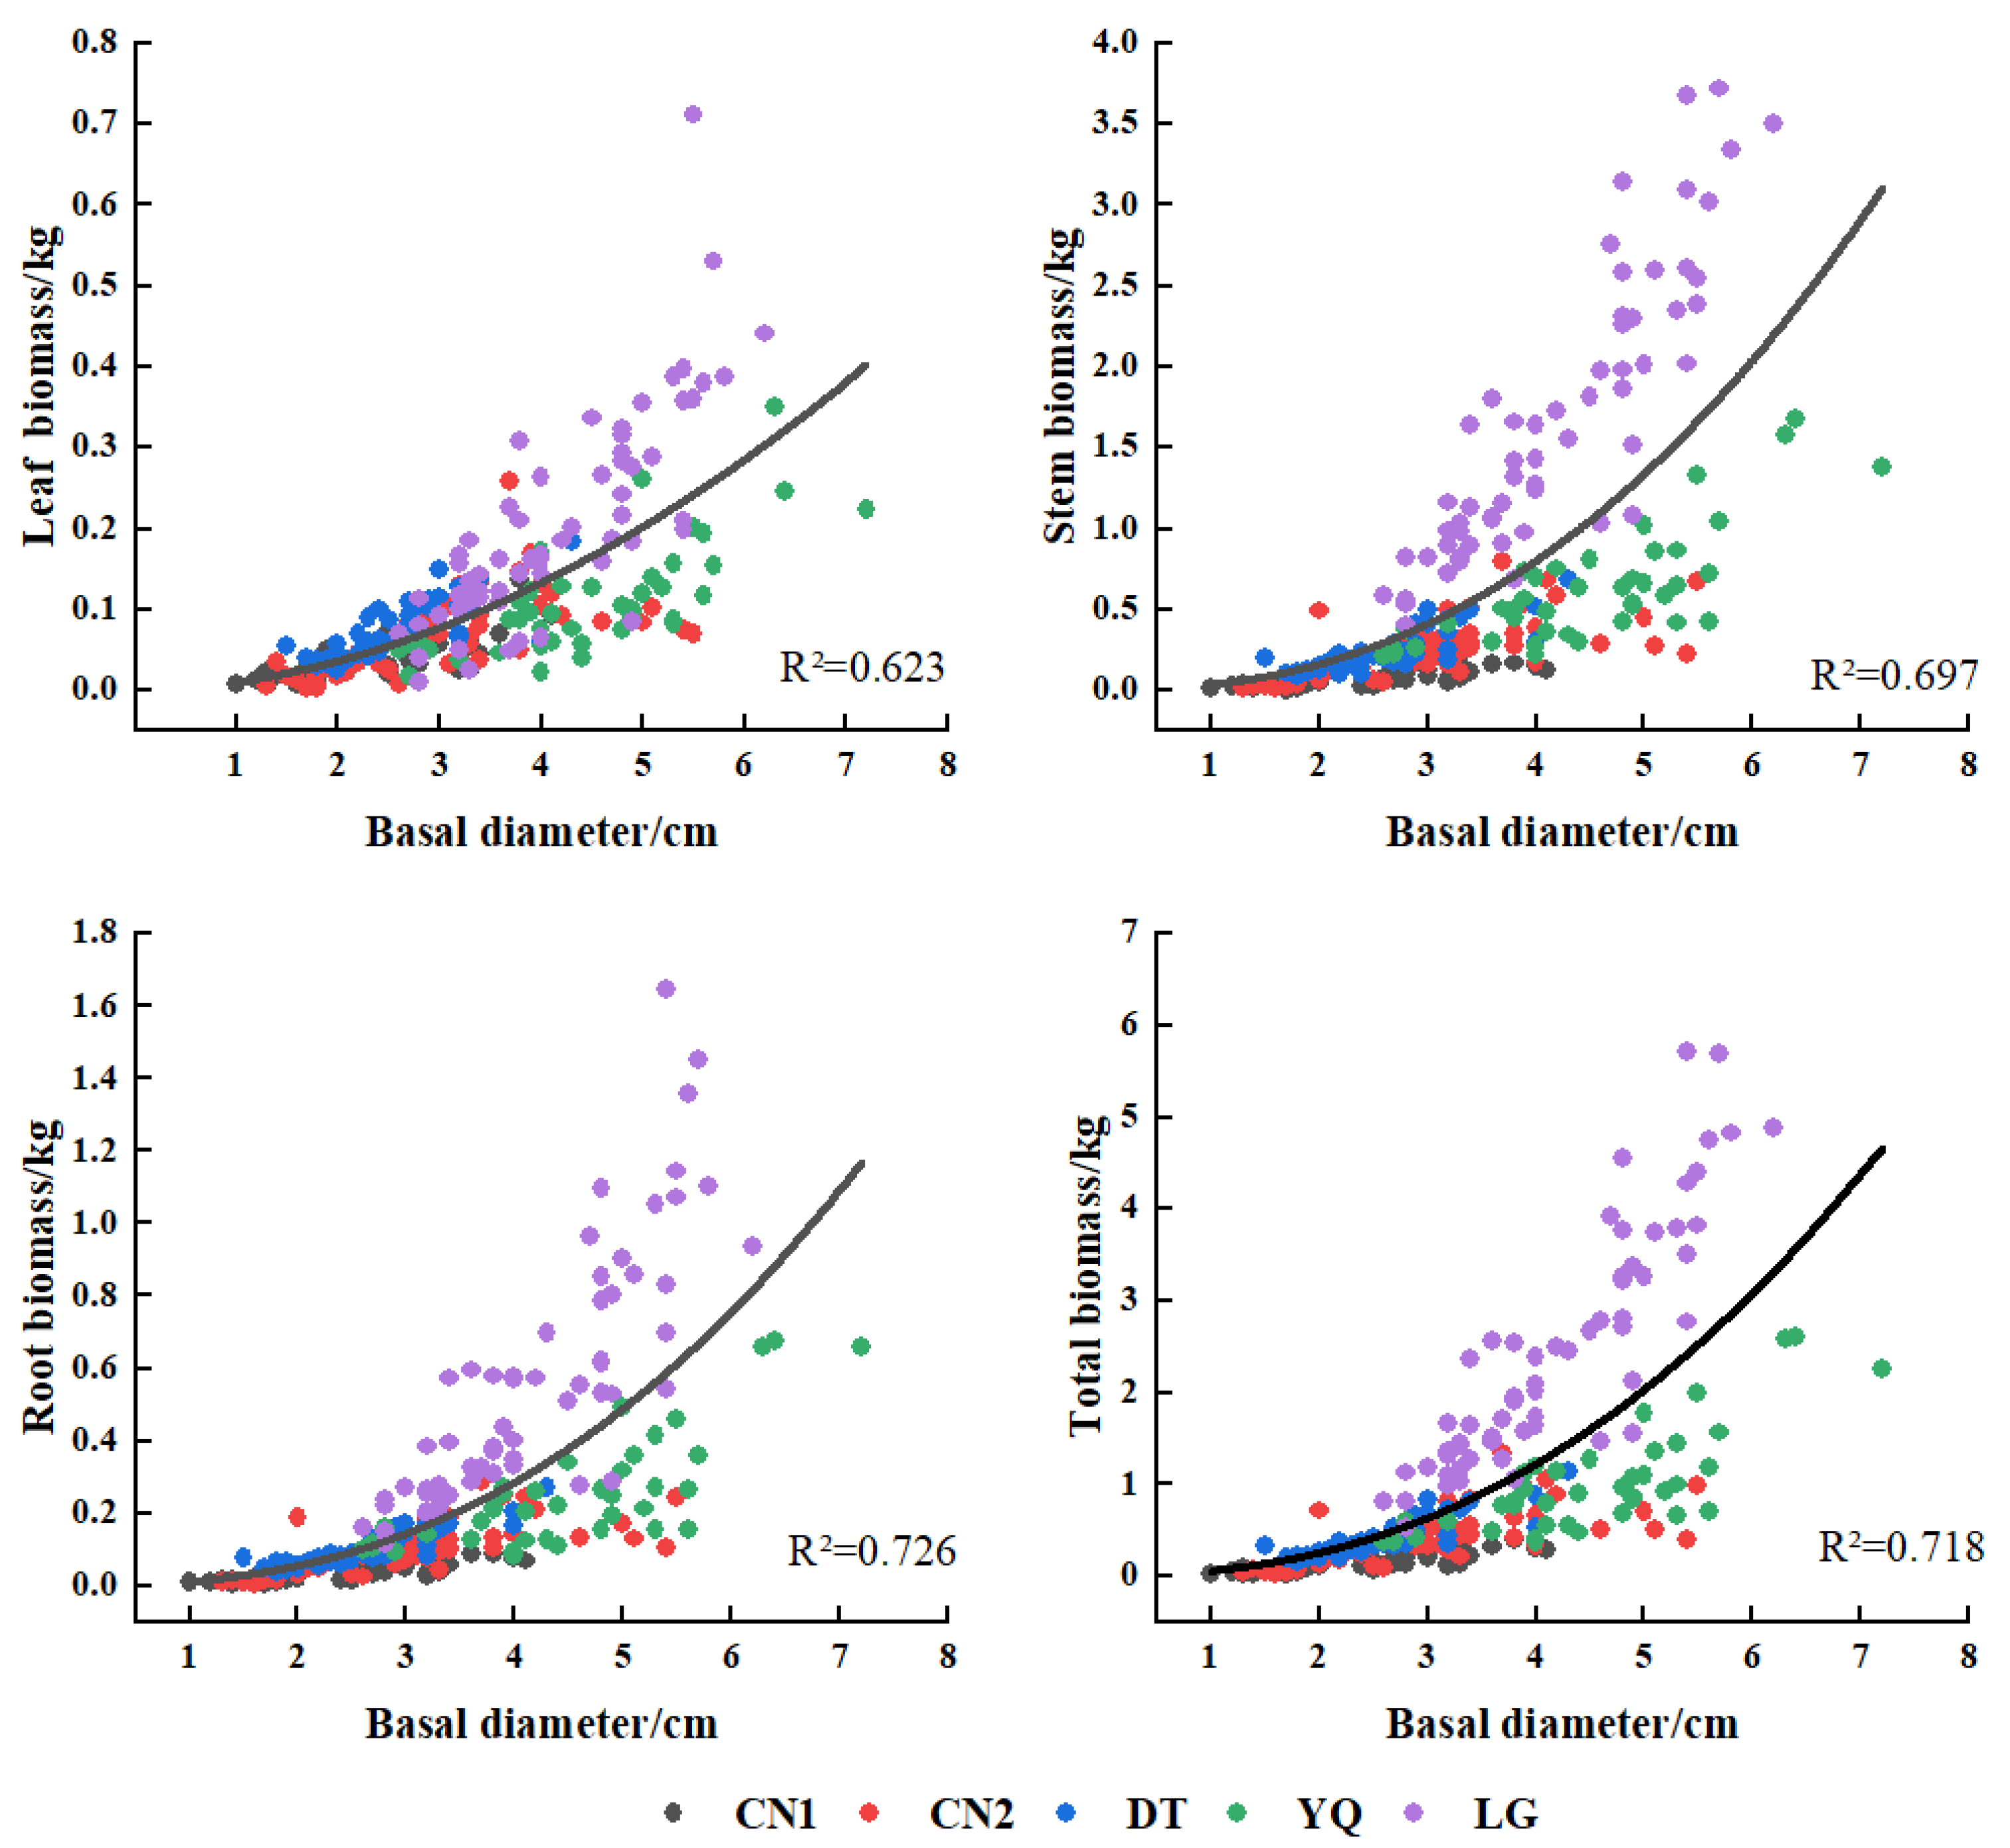
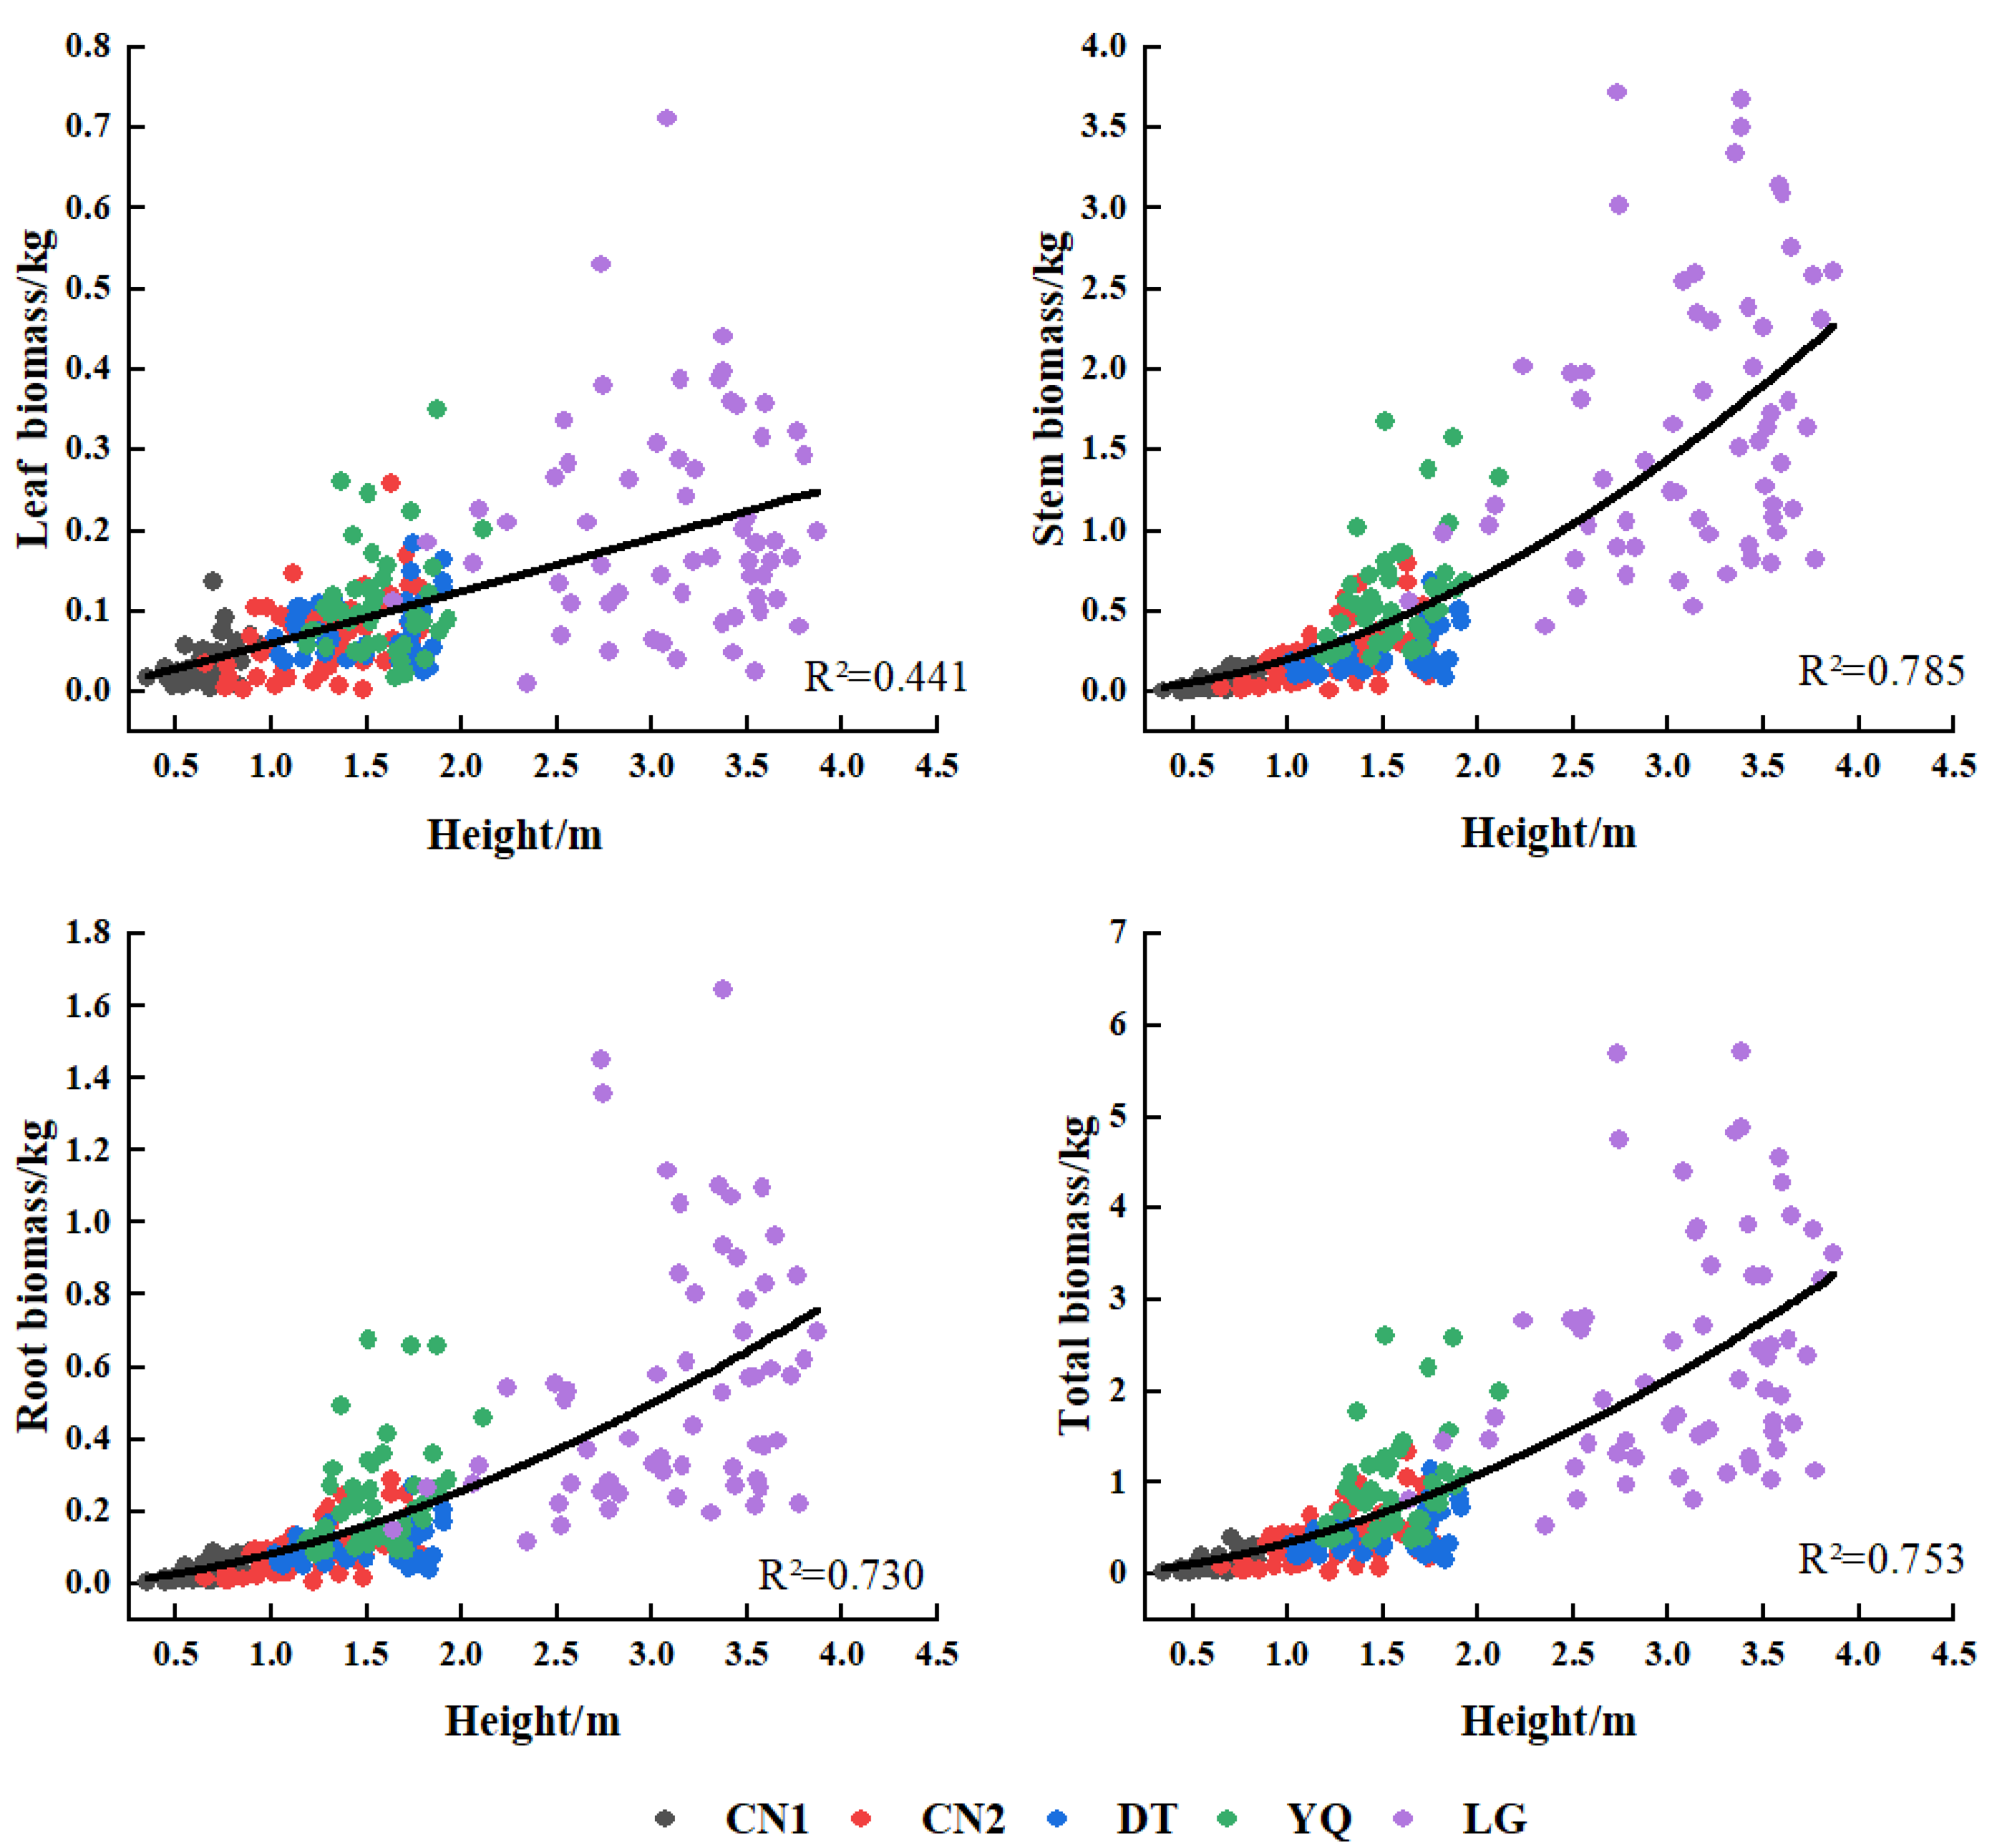
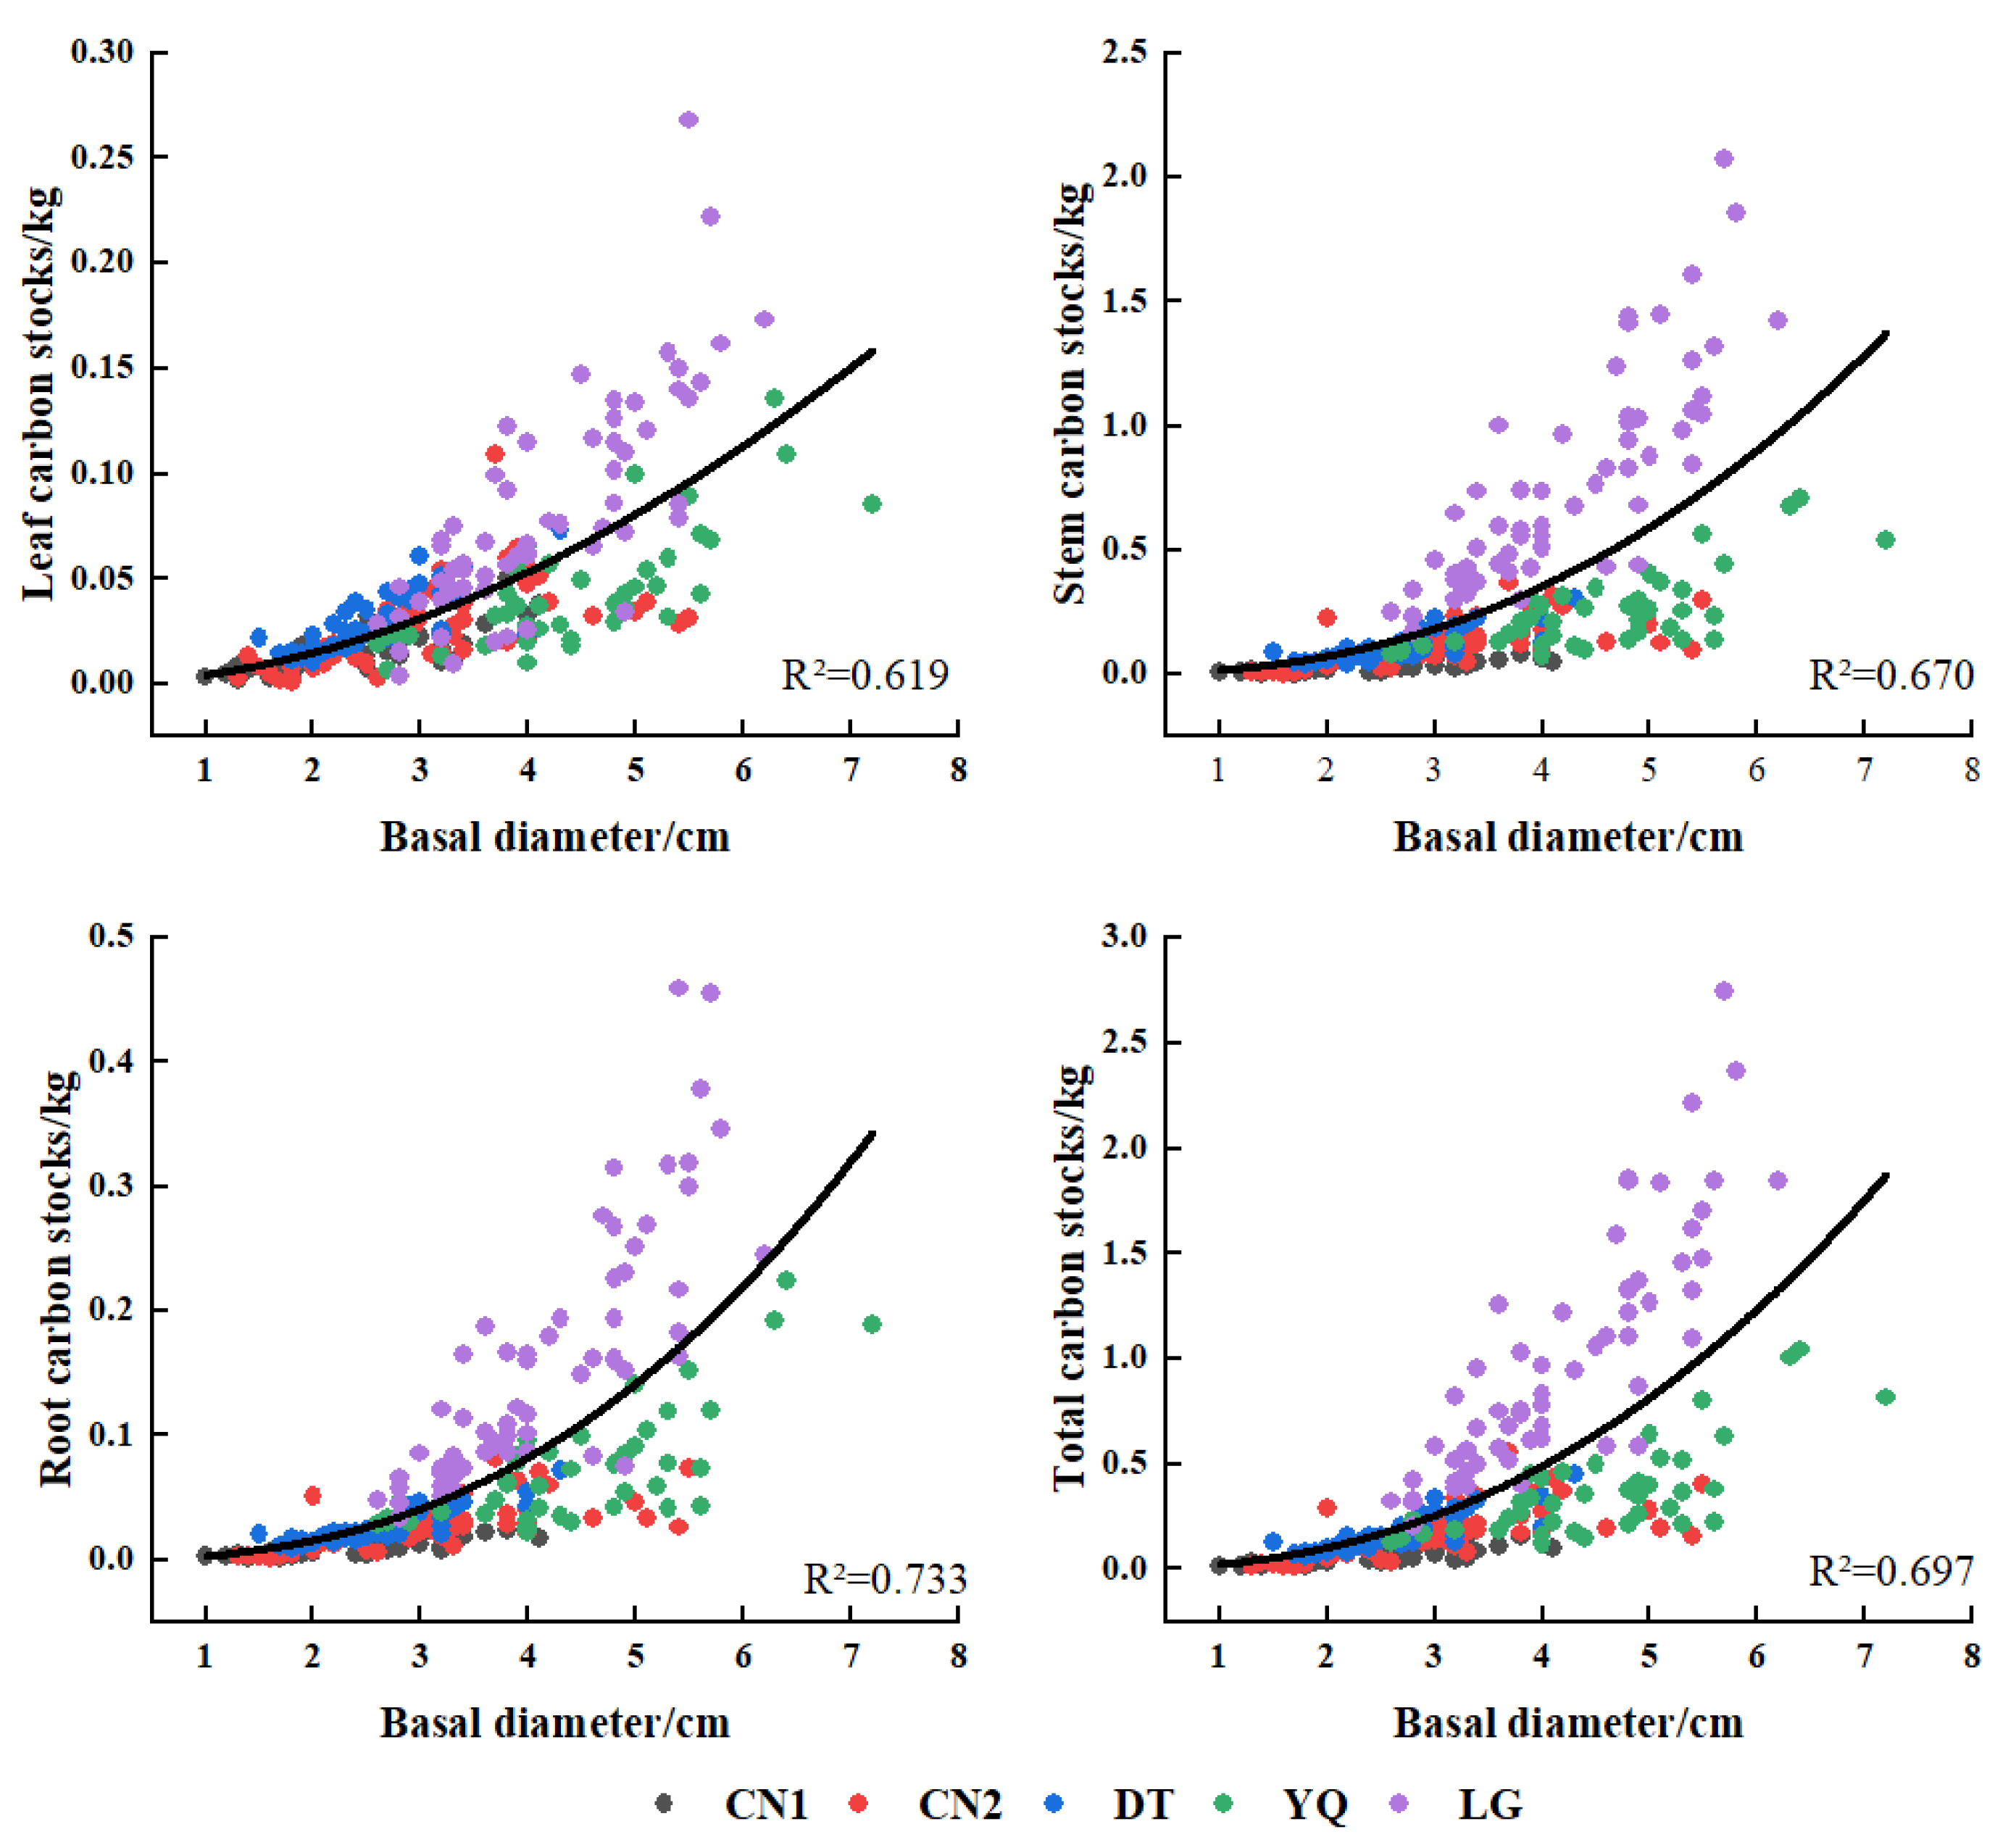
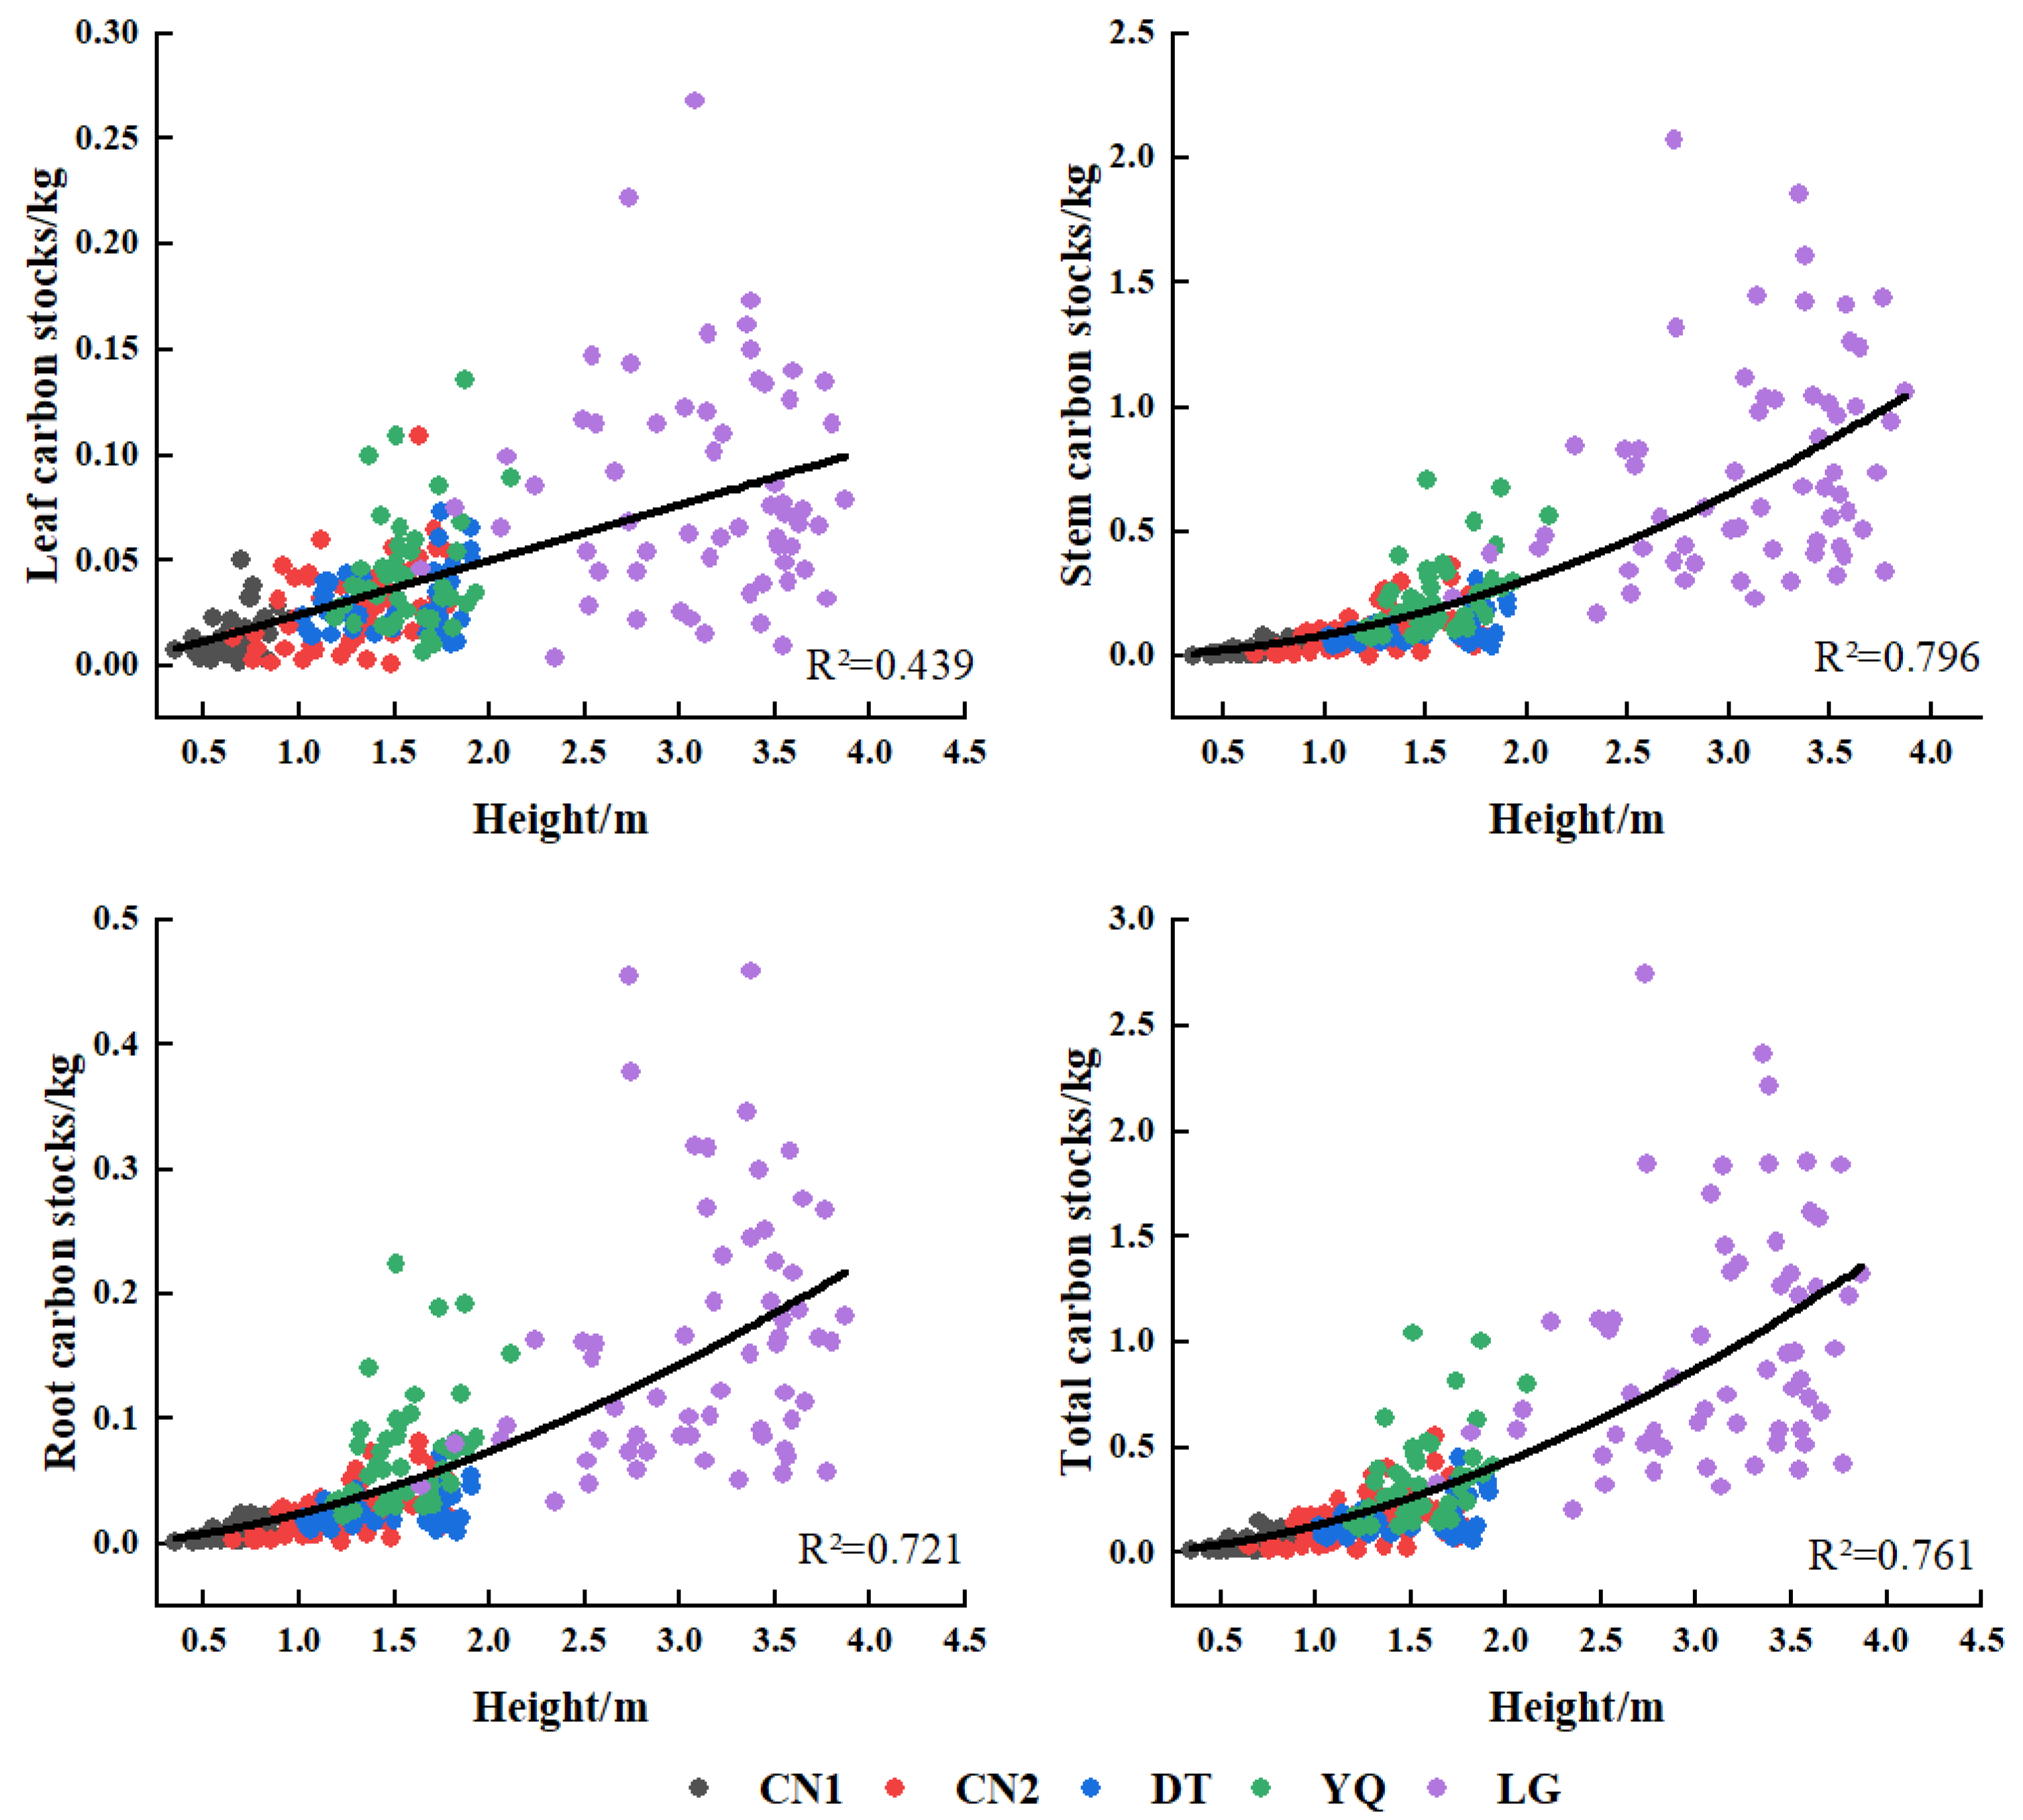
Overall, the biomass and carbon stocks of each Kandelia obovata component increase with basal diameter and tree height(R2). Variations in biomass and carbon storage across different sampling points correspond with changes in basal diameter and tree height (Figure 3, Figure 4, Figure 5 and Figure 6). At the LG sampling site, the relationship between biomass and carbon storage with basal diameter is more pronounced than at other sites. For example, as the basal diameter increases from 2.6 cm to 5.7 cm, the leaf biomass rises from 0.069 kg to 0.530 kg, branch biomass from 0.588 kg to 3.716 kg, root biomass from 0.158 kg to 1.452 kg, and total biomass from 0.815 kg to 5.698 kg. Correspondingly, leaf carbon storage increases from 0.028 kg to 0.221 kg, branch carbon storage from 0.247 kg to 2.069 kg, root carbon storage from 0.048 kg to 0.456 kg, and total carbon storage from 0.322 kg to 2.747 kg (Figure 3 and Figure 5). In contrast, changes in biomass and carbon storage with tree height at the LG and YQ sampling sites exhibit considerable variability without a clear trend (Figure 4 and Figure 6).
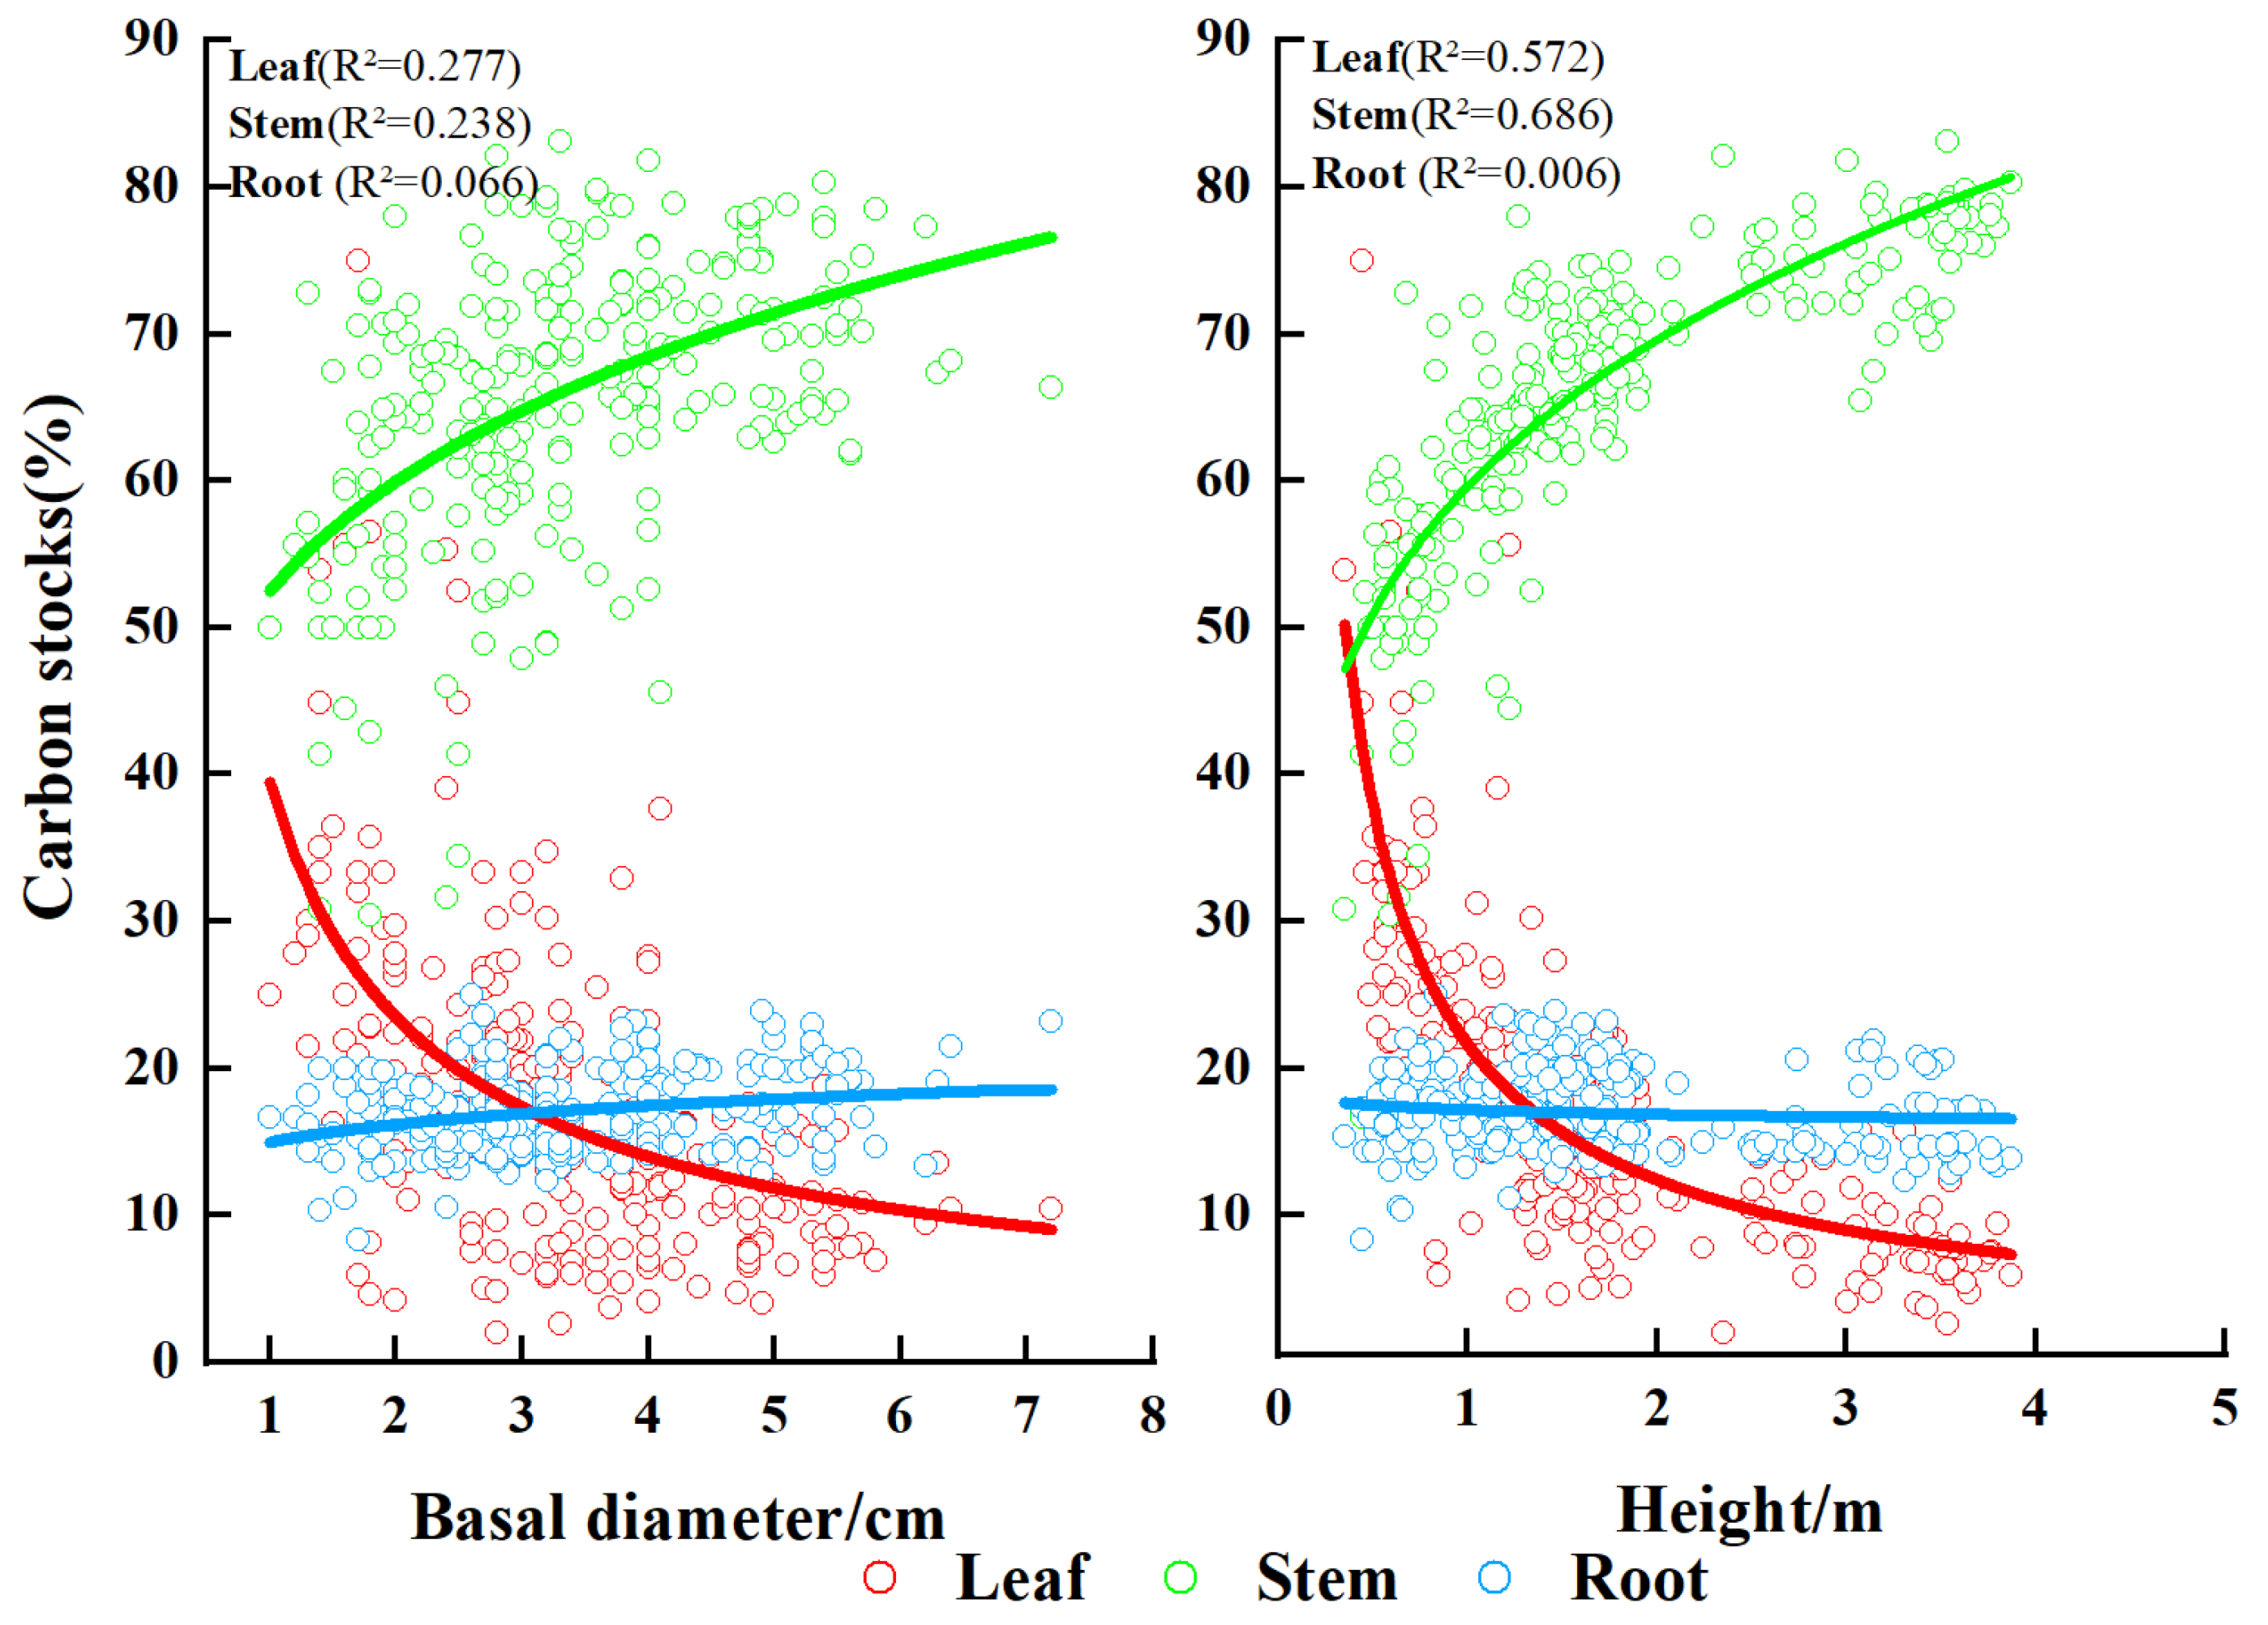
The proportions of branch and root biomass, as well as carbon storage, exhibit similar trends with changes in basal diameter and tree height (Figure 7 and Figure 8). Specifically, the proportion of leaf biomass and carbon storage declines while the proportion of branch biomass and carbon storage increases. Changes in the proportion of root biomass and carbon storage are less pronounced compared to those of leaves and branches, suggesting that root biomass remains relatively stable as Kandelia obovata grows. As the tree height increases from 0.59 m to 3.87 m, the proportion of leaf biomass decreases from 52.86% to 5.71%, and the proportion of branch biomass increases from 30.90% to 74.36%. Similarly, the proportion of leaf carbon storage decreases from 56.27% to 5.94%, while branch carbon storage proportion increases from 31.15% to 80.24%. In contrast, the changes in root biomass and carbon storage are comparatively minor.

3.3. Biomass Model of Each Component of Kandelia Obovata

Biomass equations for Kandelia obovata were developed using basal diameter (D) and tree height (H) as explanatory variables, with leaf, stem, root, and total biomass as response variables. The criteria for selecting the optimal biomass equations included high explanatory power (R2), significant F-values, low root mean square error (RMSE), small Akaike Information Criterion (AIC) values, and simplicity of the equation form.
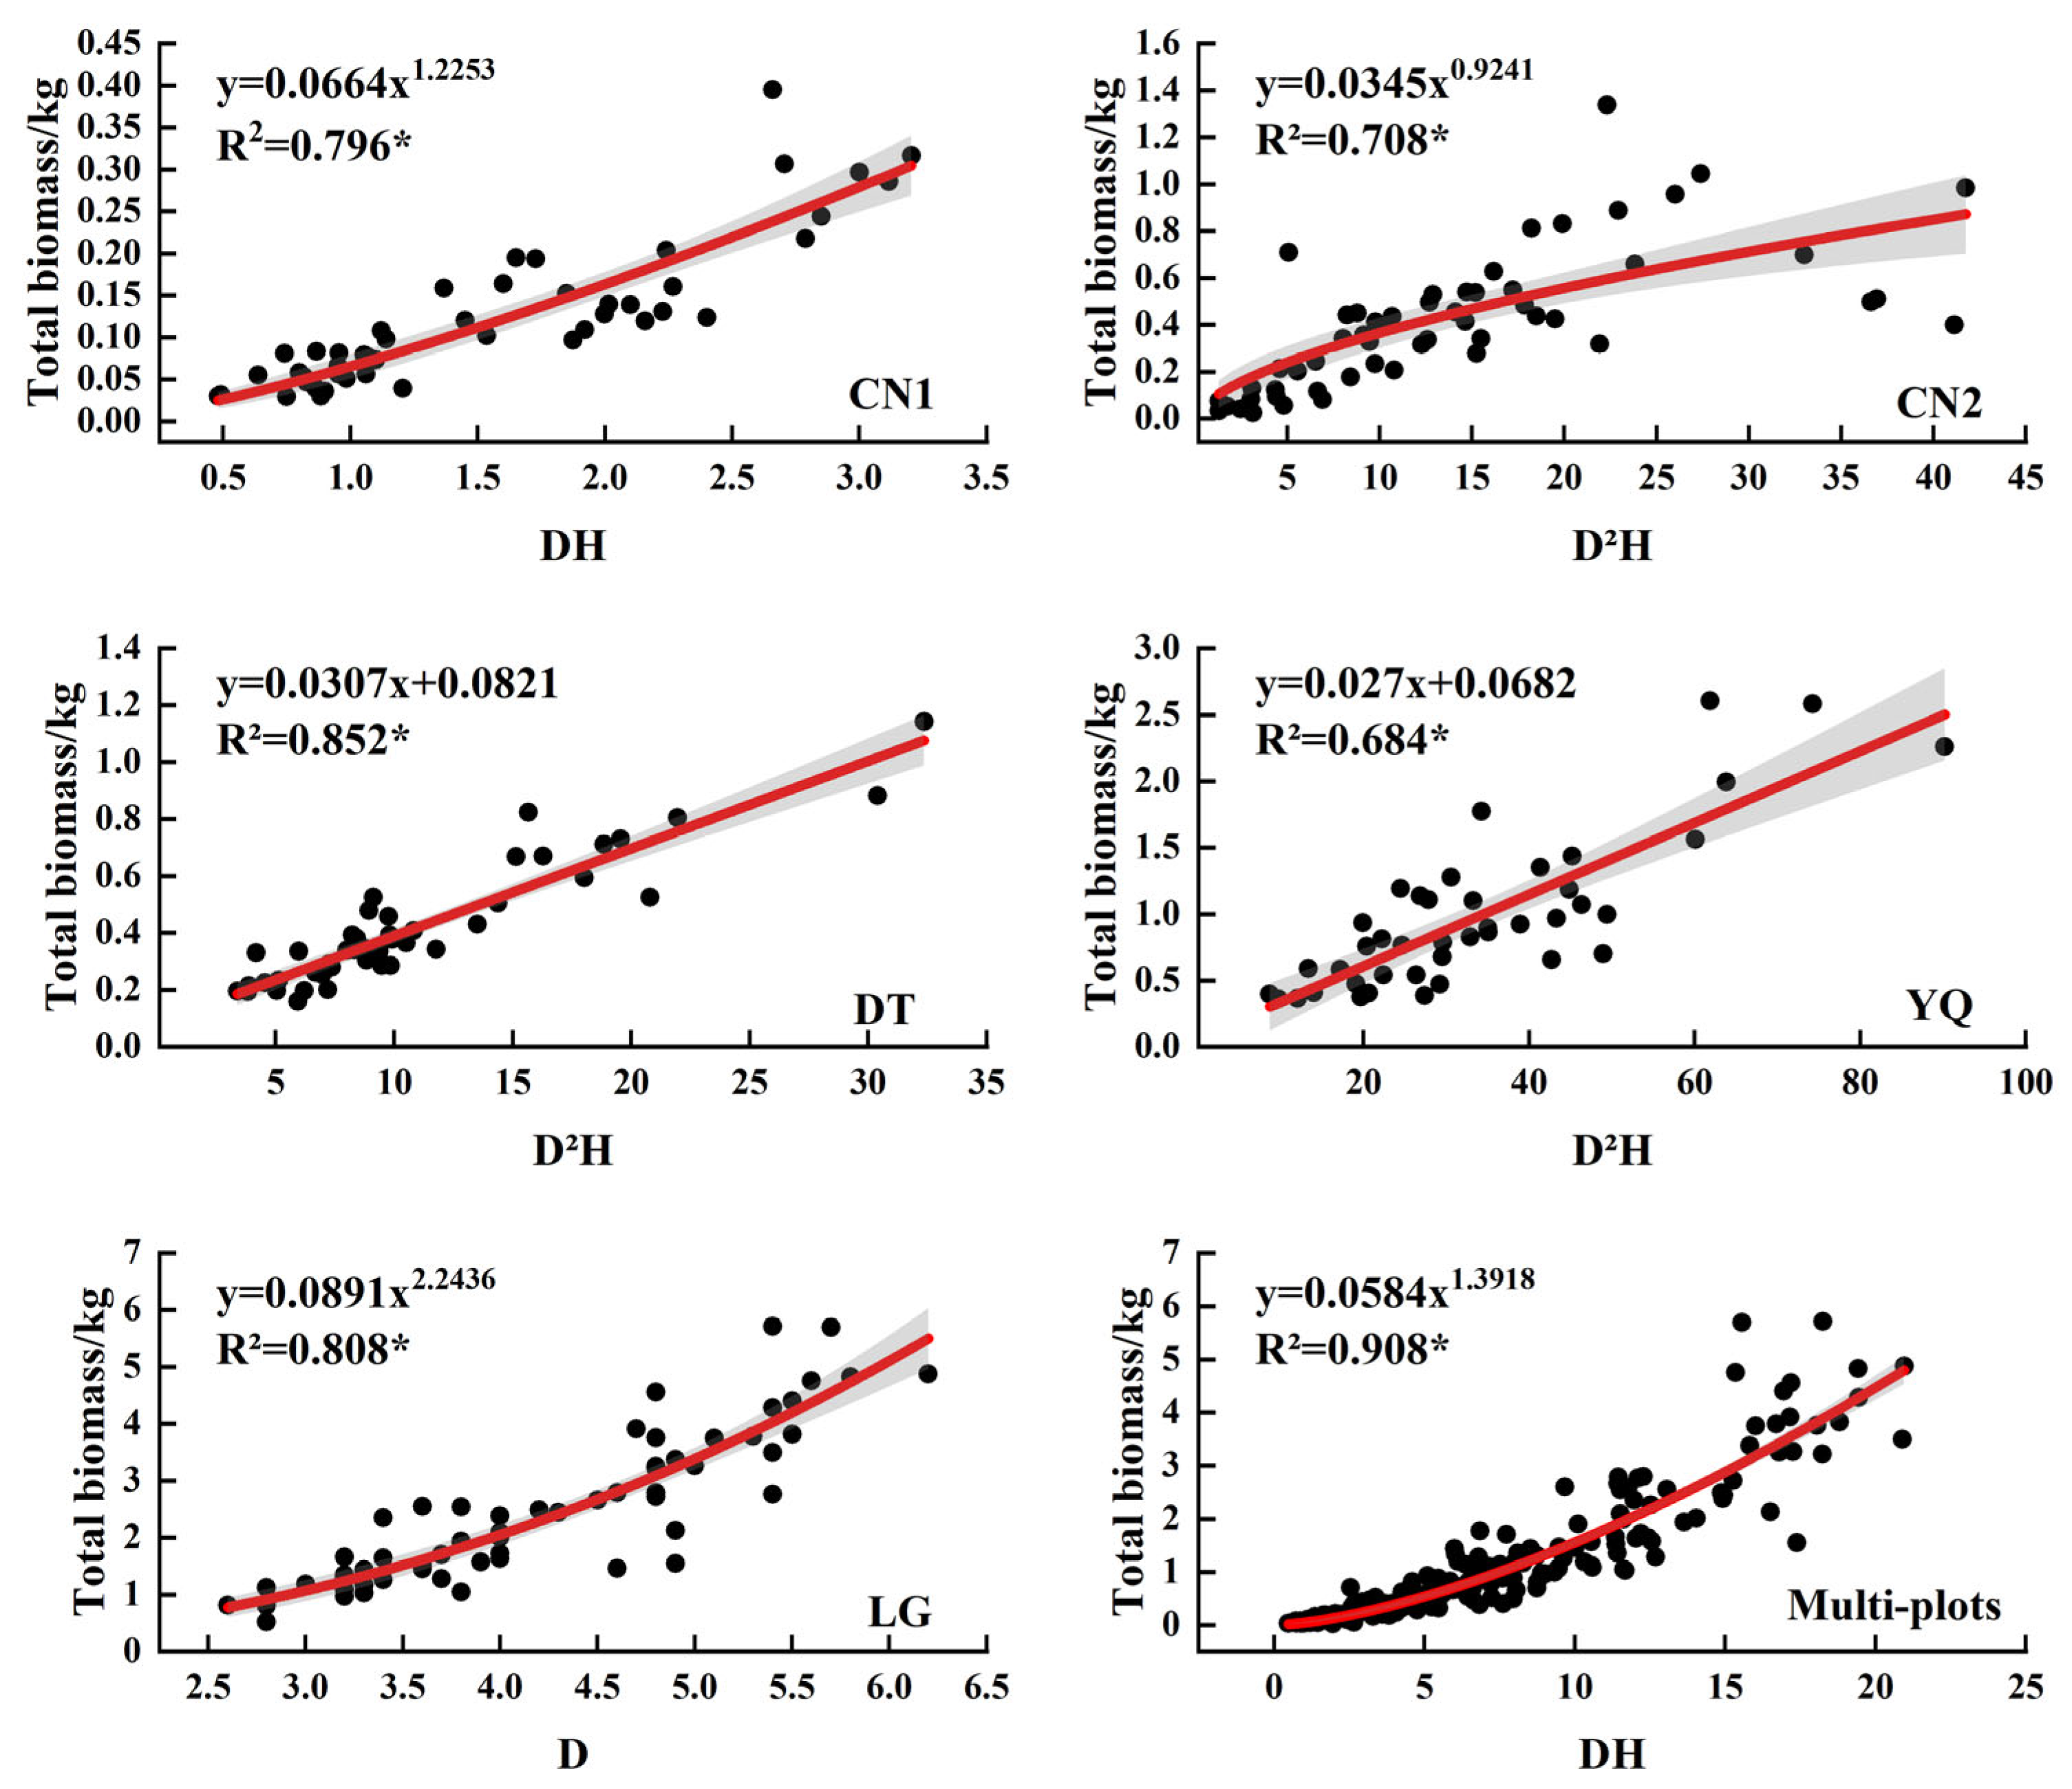
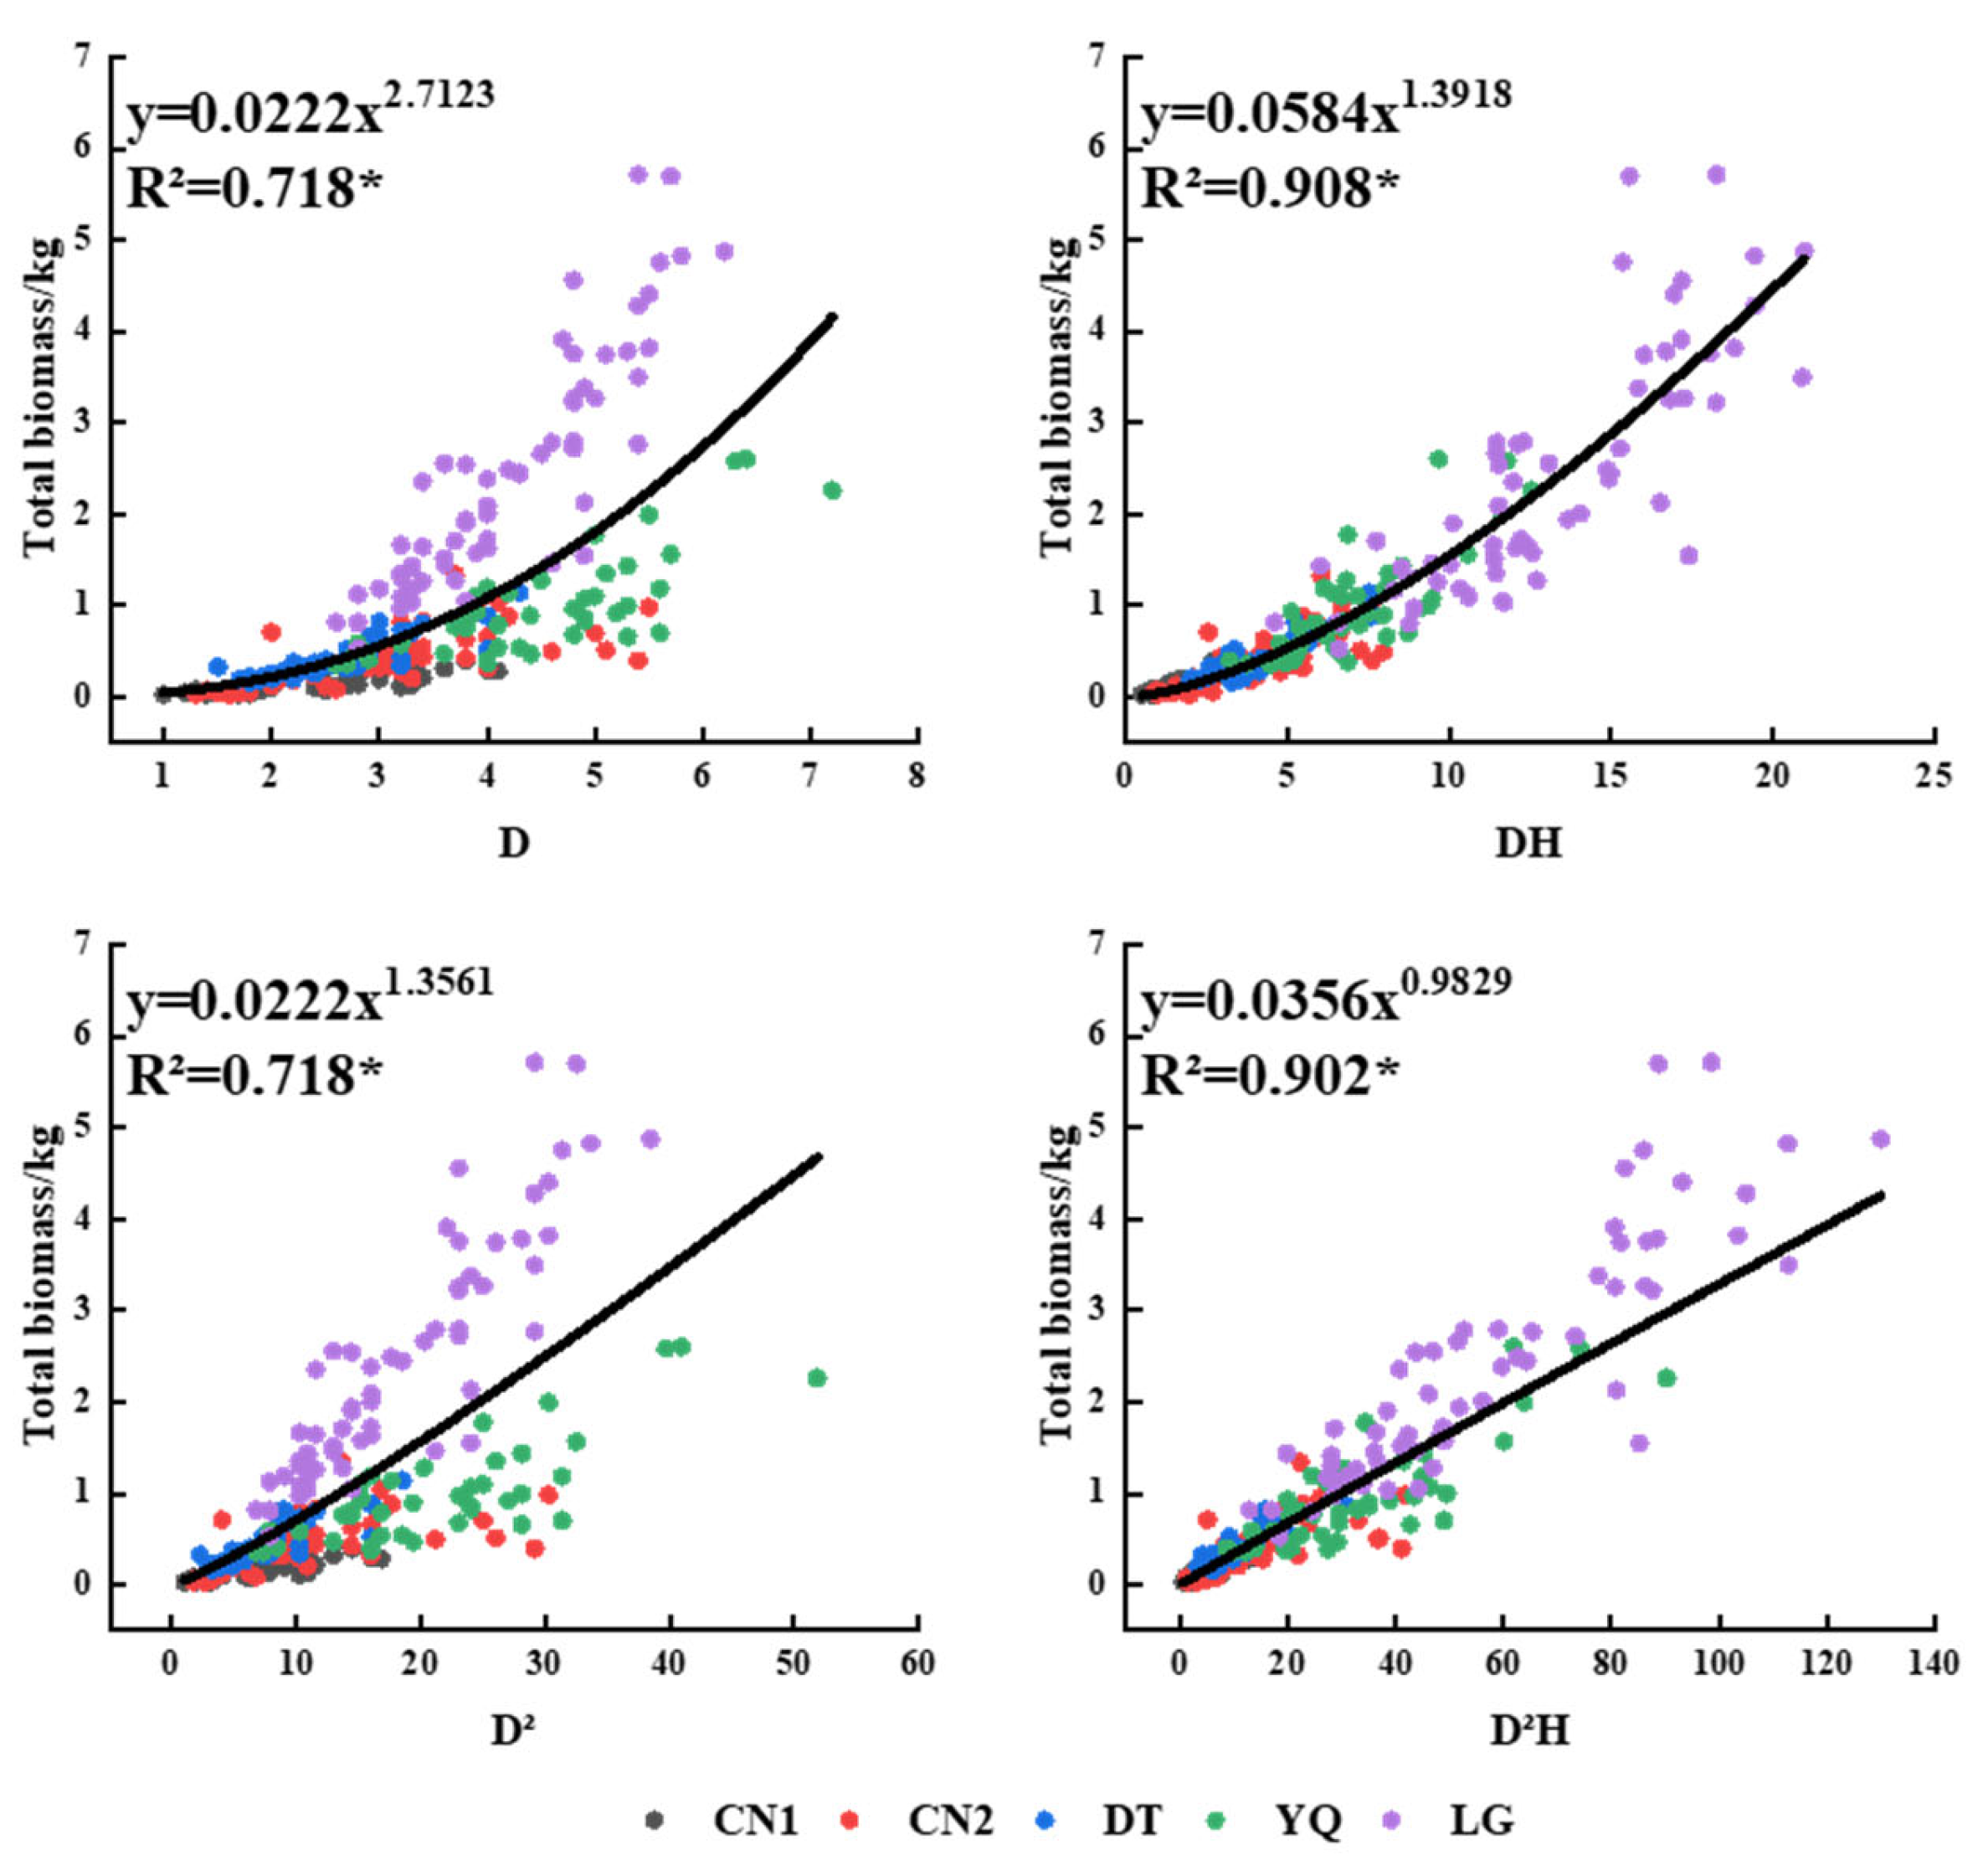
The optimal models for each biomass component exhibited R2 values ranging from 0.579 to 0.920, and F-tests were significant (p < 0.01). The best-fitting models for all sampling points used either single variables (D, D2) or combined variables (D2H, DH) (Table 2, Figure 9). For leaf biomass, the model fit was relatively lower, while branch biomass models demonstrated a higher fit (Table 2). Single variables D and D2 provided the best fit for leaf biomass (R2 = 0.546 to 0.642, p < 0.001). Variable D also showed a good fit for branch biomass (R2 = 0.802, p < 0.001) and total biomass (R2 = 0.808, p < 0.01) at the LG site. Combined variables D2H and DH yielded the best fit for branch, root, and total biomass (R2 = 0.648 to 0.920, p < 0.01). The use of combined variables enhanced the prediction accuracy of the models (Figure 10). For all sampling points of Kandelia obovata, combined variables DH and D2H provided the best fit, with R2 values of 0.690 for leaf biomass, 0.920 for branch biomass, 0.896 for root biomass, and 0.908 for total biomass (Table 3).
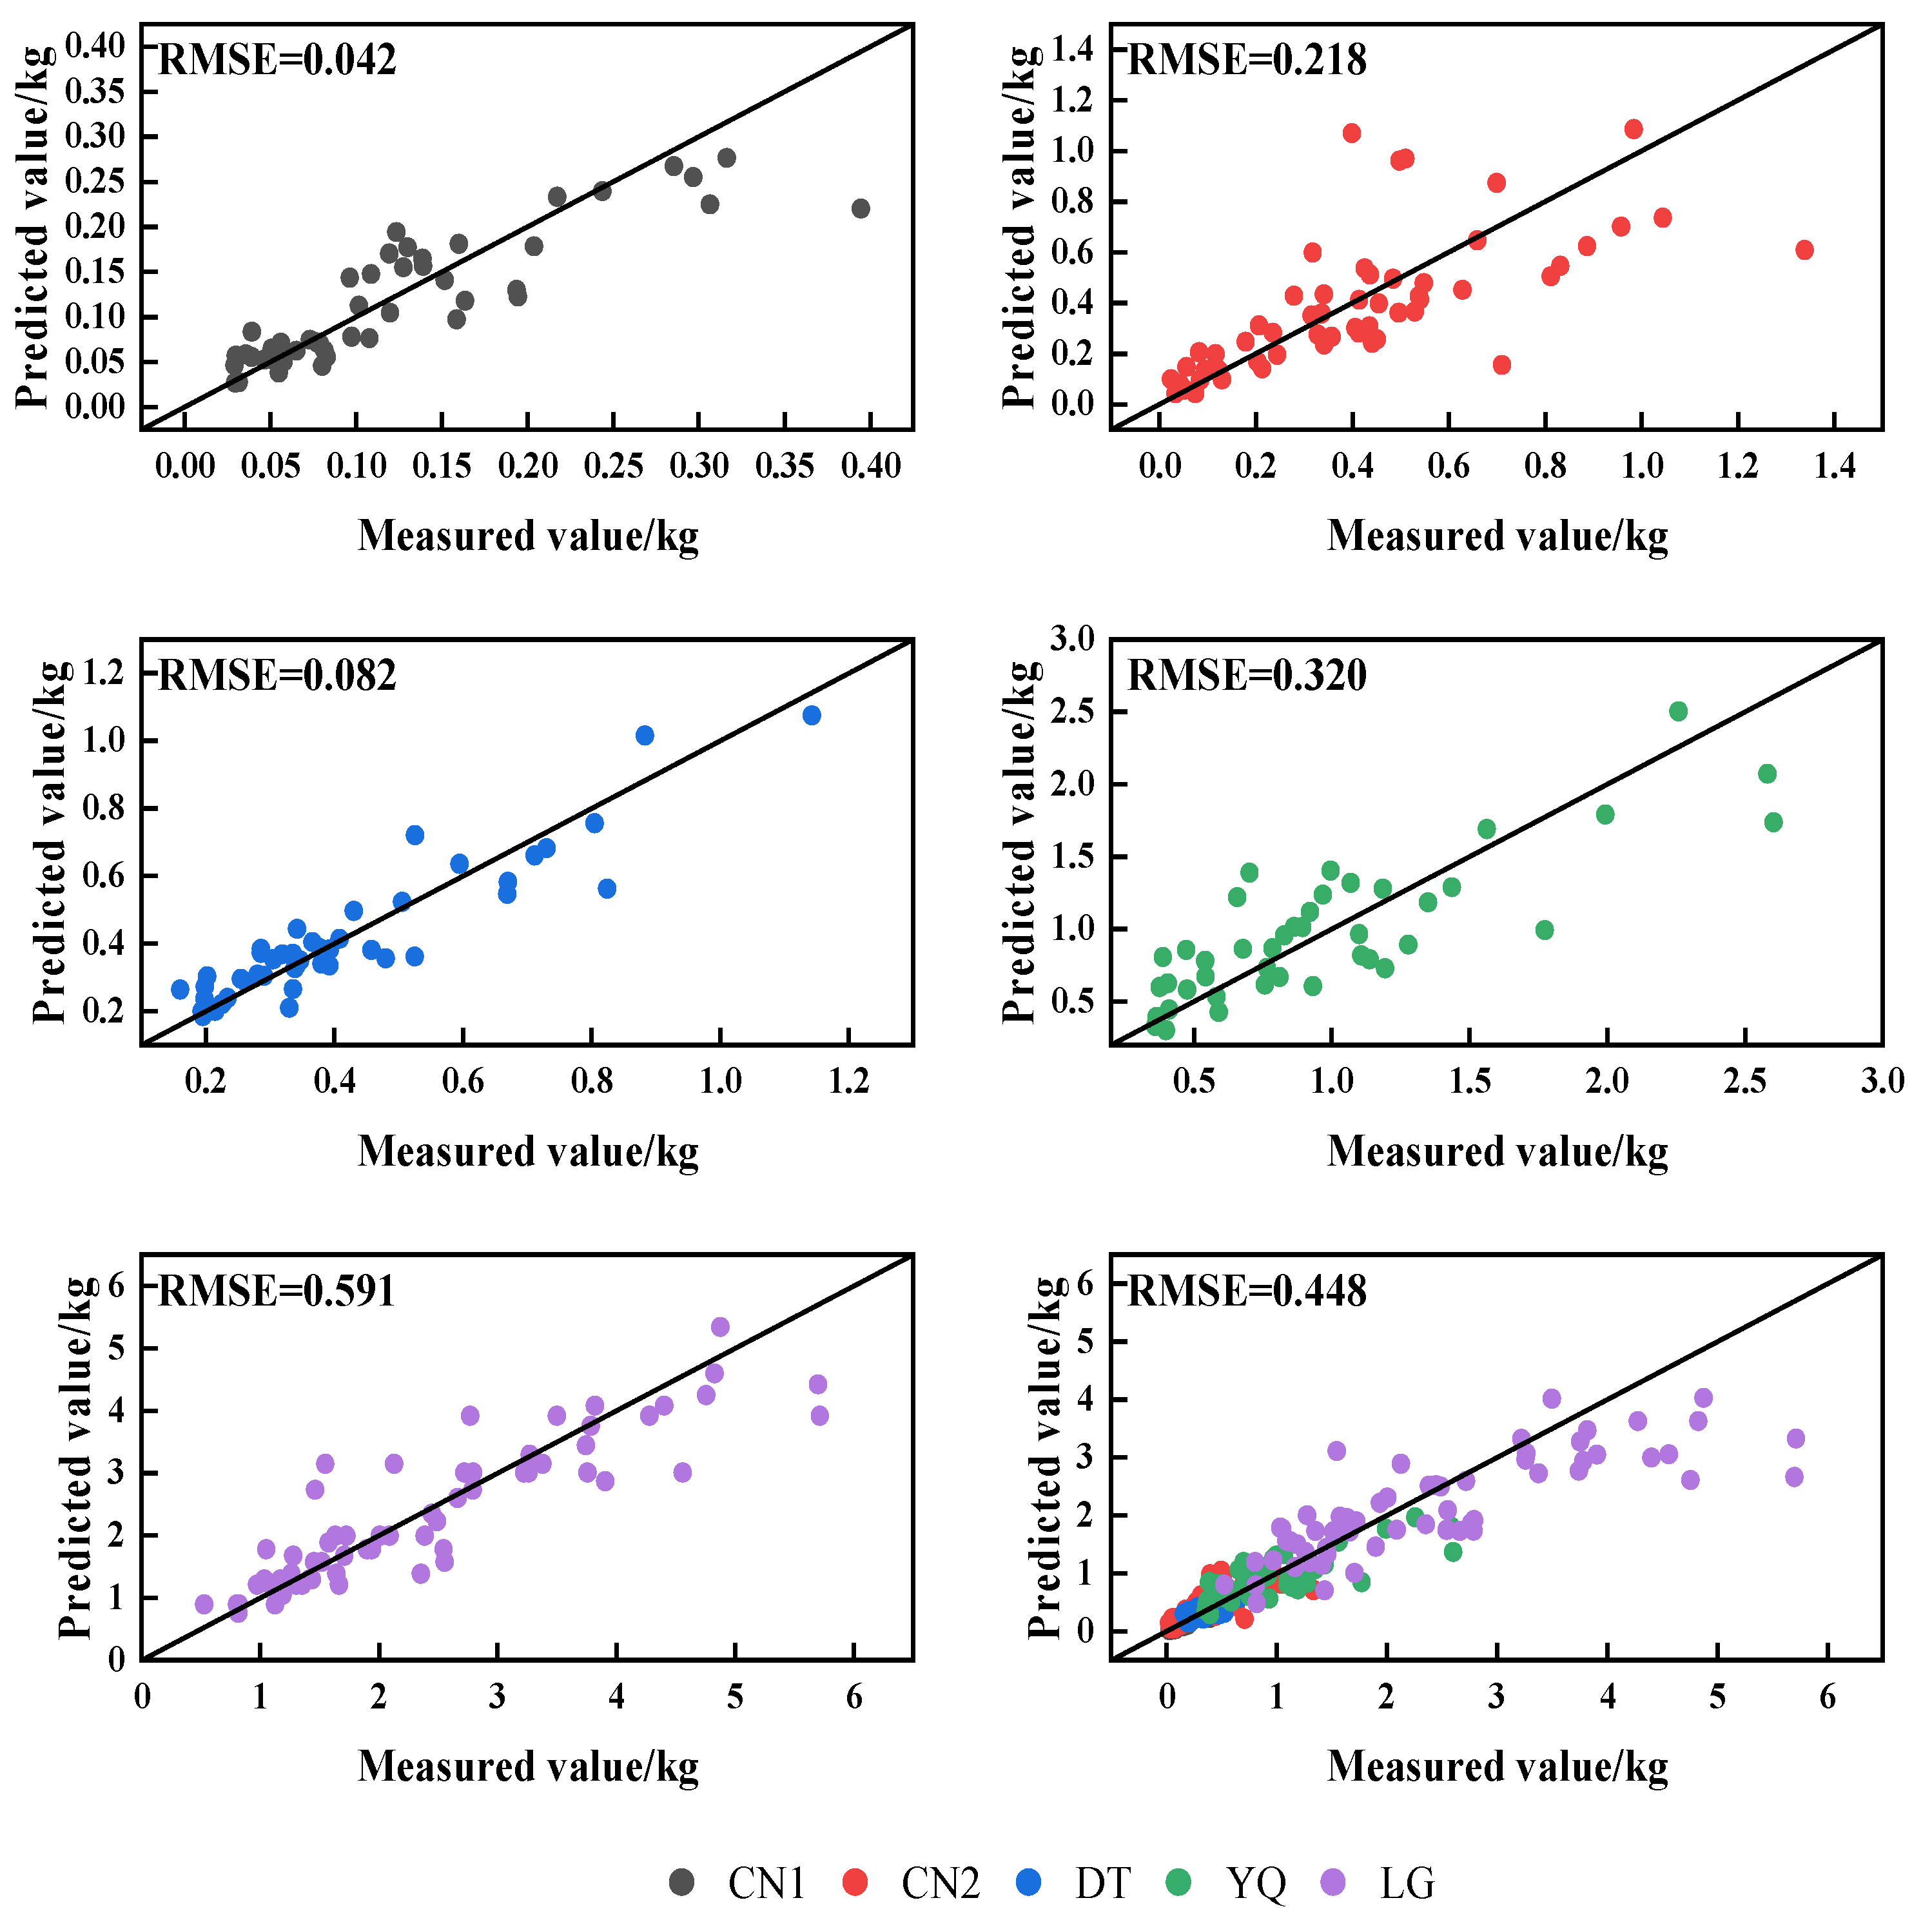
The comparison of observed and predicted total biomass (Table 3, Figure 11) indicates variation in the root mean square error (RMSE) both across different sampling points and among models aggregating. The multi-plot biomass model exhibits an RMSE intermediate between those of individual sampling point models, suggesting it offers reliable predictive accuracy across diverse locations.

3.4. Biomass and Carbon Storage at Each Sample Plot

The data presented clearly indicate a trend of increasing biomass and carbon storage with the age of Kandelia obovata plantations. The biomass values for the 5-year, 7-year, 9-year, 14-year, and 20-year plantations are 0.105 ± 0.005 Mg/ha, 0.263 ± 0.041 Mg/ha, 0.357 ± 0.046 Mg/ha, 0.489 ± 0.092 Mg/ha, and 0.868 ± 0.032 Mg/ha, respectively. Correspondingly, the carbon storage values are 0.040 ± 0.002 Mg/ha, 0.107 ± 0.019 Mg/ha, 0.138 ± 0.019 Mg/ha, 0.179 ± 0.033 Mg/ha, and 0.354 ± 0.016 Mg/ha. The growth rates of biomass are 0.021 ± 0.001 Mg ha−1 yr−1, 0.038 ± 0.006 Mg ha−1 yr−1, 0.040 ± 0.005 Mg ha−1 yr−1, 0.035 ± 0.006 Mg ha−1 yr−1, and 0.043 ± 0.002 Mg ha−1 yr−1, while the carbon storage growth rates are 0.008 ± 0.000 Mg C ha−1 yr−1, 0.015 ± 0.002 Mg C ha−1 yr−1, 0.016 ± 0.002 Mg C ha−1 yr−1, 0.013 ± 0.002 Mg C ha−1 yr−1, and 0.018 ± 0.001 Mg C ha−1 yr−1, respectively (Table 4).
The observed increase in biomass and carbon storage with age aligns with the general growth patterns of forest ecosystems. Both biomass and carbon storage growth rates exhibit an upward trend as the plantations age, indicating that they are in a phase of active growth and organic matter accumulation. This trend is particularly pronounced in the 20-year-old plantation, which demonstrates the highest growth rates for both biomass and carbon storage. This suggests that even at 20 years of age, the Kandelia obovata plantations remain in a phase of accelerated growth, capable of sequestering significant amounts of carbon from the atmosphere.

4. Discussion

4.1. Estimation of Carbon Content Rate in Kandelia obovata Mangroves

Generally, the accepted carbon content for woody tissues is 50%, while for non-woody tissues, it ranges from 45% to 50%. However, studies show that carbon content in plants is mainly determined by species-specific genetic traits and environmental factors. Using a general conversion coefficient of 45% or 50% for estimating carbon content can lead to inaccuracies [26]. Carbon content varies between regions, species, tree sizes, and components. Using a fixed value (45% or 50%) as the carbon content conversion coefficient can significantly affect carbon storage estimates. Measuring the actual carbon content of tree biomass by multiplying it with the corresponding carbon content coefficient for specific tree species, components, and regions provides more accurate estimates [27]. Different growth environments for the same species can cause variations in carbon content, indicating that a fixed carbon content rate is inadequate for precise estimation. Vinh et al. conducted a study on diverse tree species across multiple regions and discovered that environmental factors and species-specific characteristics give rise to substantial fluctuations in carbon content [28]. In this study, the carbon content of different components of the tree was measured and utilized as the conversion coefficient. The results indicated that the measured carbon content, ranging from 37.76% to 40.79%, was lower than the default value of 45.1% for mangrove carbon content recommended by the Intergovernmental Panel on Climate Change (IPCC). This approach enables a more accurate estimation of carbon storage, effectively circumvents the errors induced by the general coefficient, and enhances the accuracy of the research.

4.2. Biomass Distribution and Allocation in Trees at Different Growth Stages

The distribution pattern of biomass across different tree organs reflects the tree’s life history strategy. Throughout its growth, a plant adjusts its biomass allocation to adapt to environmental changes and competition at various stages. Tree age influences biomass distribution due to changes in growth and resource allocation, balancing physiological activities and organ functions. Typically, as trees age, the proportion of biomass allocated to the trunk increases, while the proportions allocated to branches and leaves decrease [29]. In younger trees, a higher proportion of biomass is allocated to branches and leaves to enhance photosynthesis, which is critical for survival. As trees mature, more biomass is directed towards trunk growth for physical stability, resulting in a smaller proportional increase in leaf biomass compared to trunk biomass. Consequently, the proportion of trunk biomass rises with age, while leaf biomass proportion declines [30]. The proportion of root biomass in total biomass does not follow a consistent age-related pattern. Variations in the aboveground-to-belowground biomass ratio in mangrove plants are linked to habitat heterogeneity. In mature mangroves, leaf biomass proportion is generally low. Mangrove biomass is affected by multiple factors, with significant variations observed across different tree ages. In this study, Kandelia obovata branches contribute significantly to total biomass, with branch biomass accounting for over 45% of total biomass and branch carbon storage representing over 50% of total carbon storage. Biomass and carbon storage distribution change with tree age, with higher allocation to branches needed to maintain stability in muddy substrates. Notably, our study aligns with Zhu, D. H. et al. in emphasizing the importance of branch carbon storage (>50% of total) but diverges by attributing this to substrate stability demands rather than climate-driven allocation [31]. This contradicts the assumption that carbon allocation in mangroves is primarily shaped by latitudinal or climatic gradients. Rovai et al.’s study underscores local geomorphological factors as equally critical drivers [32]. On a macro scale, climate variables like temperature, solar radiation, precipitation, and storm surge frequency affect mangrove biomass in a zonal pattern [33]. Climate change, a major global factor, can reshape temperature and precipitation, which significantly impacts the growth conditions of mangrove plantations [34]. This aligns with the understanding that global factors, especially climate change, influence growth and carbon storage in these ecosystems. Locally, a complex set of factors determines mangrove growth rates and biomass accumulation. These include habitat-related elements such as salinity, nutrient conditions, and hydrology, as well as species traits, tree age, soil fertility, nutrient availability, and management practices like irrigation and fertilization [35]. Latitude is also crucial as it determines solar radiation, which is essential for photosynthesis and biomass production. The combined effects of these factors are complex and variable [36].

4.3. Analysis of Biomass Estimation Model

Constructing allometric growth models using tree height, diameter (D), or other explanatory variables is an effective and convenient method for estimating forest biomass. Typically, these allometric equations are represented as power functions, with most models employing tree height and D either separately or in combination.
Accurate allometric growth equations require numerous sample plots and detailed plant surveys, including measurements of D and tree height. Reliable equations can only be developed with adequate data [37]. However, the dense nature of mangrove forests makes it challenging to accurately estimate individual tree height. Consequently, some studies have relied solely on D to develop allometric models. Incorporating both tree height and D generally improves the accuracy of biomass estimation. In this study, the most effective variables for estimating the total biomass of Kandelia obovata at various sampling sites were D, D2, D2H, and DH. Equations using D2H and DH as explanatory variables demonstrated high accuracy. Models that used height alone generally had lower accuracy compared to those using D, indicating that D has a greater impact on biomass estimation. In practice, tree height is often included as a secondary parameter to enhance model accuracy [26]. Using either single explanatory variables (D, D2, H) or combined variables (D2H, DH) simplifies the modeling process while maintaining practicality. Observations from optimal models indicated that even single variables can provide satisfactory prediction accuracy. For the Kandelia obovata biomass model at the LG site, D was the most effective variable for predicting branch biomass (R2 = 0.802) and total biomass (R2 = 0.808), demonstrating high model accuracy.
Given that Kandelia obovata, like many mangrove species, typically grows as a shrub or small tree with easily measurable height, selecting optimal biomass models requires balancing parameter robustness, explanatory capacity, and practical applicability. Mangroves constitute complex ecosystems where interactions between tree measurement variables are inherently nonlinear. While variations in plant communities, growth environments, and developmental stages may lead to location-specific differences in allometric equations for mangrove species [38], regional variations in growth relationships within the same species are generally minimal, with biomass disparities primarily attributed to tree age, habitat conditions, and wood density [39].
Although existing studies emphasize the importance of integrating both tree height and D in biomass estimation models, our findings highlight the superior predictive capacity of D for Kandelia obovate [40]. Notably, while earlier research posited comparable contributions of height and diameter in general forest biomass models, our results demonstrate that D alone achieves high-accuracy biomass predictions for this species (e.g., total biomass R2 = 0.808). Furthermore, regarding model complexity, despite proposals advocating multi-variable models to enhance precision [41], our analysis reveals that simplified models using D2H or DH perform equivalently. These parsimonious models not only maintain high predictive accuracy but also reduce computational complexity, providing a practical solution for mangrove biomass estimation.
This study also observed differential model performance across biomass components: branch biomass models for Kandelia obovata exhibited significantly higher accuracy compared to leaf biomass models, underscoring the need for component-specific modeling approaches in mangrove ecosystems.

4.4. Limitations and Future Research Directions

In this study, several limitations were found. The sample collection was limited to a small area and specific growth conditions, so it may not represent all Kandelia obovata. Micro-environmental factors like soil microbes and root exudates on biomass allocation were not well-explored. Also, the short research time made it difficult to understand long-term biomass allocation changes. For the allometric growth model, the small number and limited scope of samples reduced its generalizability. The model didn’t consider factors like pests, diseases, and extreme climate, which could lower prediction accuracy. To address these issues, future research should expand sample collection across different climate zones, soil types, and growth stages to improve carbon content conversion coefficients. Biomass distribution research needs to analyze how micro-environmental factors work and monitor long-term changes. Different management measures’ effects on biomass and carbon storage should also be studied for mangrove conservation. When building the allometric growth model, increasing sample quantity and diversity, especially from different regions, is important. Adding factors like pests, diseases, climate, and soil nutrients can improve the model’s prediction and adaptability.

5. Conclusions

This study presents substantial and original contributions to the comprehension of Kandelia obovata mangroves in the northern regions of China.
Employing comprehensive field surveys and in-depth analysis of sample data sourced from a wide array of mangrove planting areas, this research meticulously unravels the intricate distribution patterns of biomass and carbon content among diverse components of Kandelia obovata. The novel finding regarding the biomass and carbon storage proportions—where branches account for a relatively larger proportion compared to leaves and roots, and the clear demonstration that both biomass and carbon storage increase concomitantly with diameter (D) and tree height—significantly enriches the extant knowledge within this domain.
The development of allometric growth models constitutes another pivotal contribution of this study. By utilizing D, D2, D2H, and DH as predictive variables, the study attains fitting accuracies for total biomass spanning from 0.684 to 0.908. Notably, among these models, those with DH as a predictor, such as the reference model (WTotal = 0.0584(DH) D1.3918 (R2 = 0.908, F = 2459.87, RMSE = 0.448)), offer an especially robust and reliable approach for estimating the biomass of Kandelia obovata in northern China. These models not only furnish highly accurate biomass predictions for the Zhejiang region but also establish a benchmark for analogous research endeavors in other geographical areas.
Moreover, the precise determination of carbon conversion coefficients for leaves (ranging from 38.71% to 41.26%), branches (from 38.92% to 45.37%), roots (from 25.88% to 29.51%), and an overall range of 36.55% to 40.79% represents a critical advancement. These coefficients enable highly accurate estimations of carbon storage in Kandelia obovata mangroves within the northern distribution area of China, thereby playing a crucial role in elucidating the significance of these mangroves in the global carbon sequestration process.
Collectively, the practical implications of this study are far-reaching. The biomass prediction models developed herein can be directly applied to optimize the planning of mangrove restoration projects, precisely estimate the carbon sequestration potential, and effectively evaluate the efficacy of conservation measures. In essence, this research not only fills critical lacunae in the academic understanding of Kandelia obovata mangroves in northern China but also offers tangible and actionable tools for their conservation and restoration, thereby making a substantial impact on both the scientific community and environmental conservation efforts.

Author Contributions

Conceptualization, Y.S.; data curation, J.C.; formal analysis, J.C.; investigation, J.C., W.D. and H.S.; funding acquisition, Y.S.; Project administration, Y.Z. and G.C.; Supervision, S.Y. and X.P.; writing—original draft preparation, J.C. All authors have read and agreed to the published version of the manuscript.

Funding

This research was funded by the Key Research and Development Program of Zhejiang Province (Grant Nos. 2023C02003; 2021C02005) and the National Natural Science Foundation of China (Grant Nos. 32001315; U1809208; 31870618).

Data Availability Statement

Data are contained within the article.

Acknowledgments

We would like to thank the editor and anonymous reviewers for their contributions to the peer-review process of our study.

Conflicts of Interest

The authors declare that they have no conflict of interest.

References

  1. Chen, J.; Zeng, S.; Gao, M.; Chen, G.; Zhu, H.; Ye, Y.J. Potential effects of sea level rise on the soil-atmosphere greenhouse gas emissions in Kandelia obovata mangrove forests. Acta Oceanol. Sin. 2023, 42, 25–32. [Google Scholar] [CrossRef]
  2. Nijbroek, R.P. Mangroves, mudbanks and seawalls: Whose environmental knowledge counts when adapting to sea level rise in Suriname? J. Political Ecol. 2014, 21, 533–550. [Google Scholar] [CrossRef]
  3. Bhomia, R.K.; Kauffman, J.B.; McFadden, T.N. Ecosystem carbon stocks of mangrove forests along the Pacific and Caribbean coasts of Honduras. Wetl. Ecol. Manag. 2016, 24, 187–201. [Google Scholar] [CrossRef]
  4. Yee, S. REDD and BLUE Carbon: Carbon Payments for Mangrove Conservation. 2010. Available online: https://escholarship.org/uc/item/2bc6j8pz (accessed on 15 July 2023).
  5. Bai, J.; Meng, Y.; Gou, R.; Lyu, J.; Lin, G. Mangrove diversity enhances plant biomass production and carbon storage in Hainan island, China. Funct. Ecol. 2021, 35, 774–786. [Google Scholar] [CrossRef]
  6. Ellison, A.M.; Felson, A.J.; Friess, D.A. Mangrove Rehabilitation and Restoration as Experimental Adaptive Management. Front. Mar. Sci. 2020, 7, 327. [Google Scholar] [CrossRef]
  7. Veettil, B.K.; Pereira, S.F.R.; Quang, N.X. Rapidly diminishing mangrove forests in Myanmar (Burma): A review. Hydrobiologia 2018, 822, 19–35. [Google Scholar] [CrossRef]
  8. Jia, M.; Wang, Z.; Mao, D.; Huang, C.; Lu, C. Spatial-temporal changes of China’s mangrove forests over the past 50 years: An analysis towards the Sustainable Development Goals (SDGs). Chin. Sci. Bull. 2021, 66, 3886–3901. [Google Scholar] [CrossRef]
  9. Zhao, J.; Xie, H.; Ma, J.; Wang, K. Integrated remote sensing and model approach for impact assessment of future climate change on the carbon budget of global forest ecosystems. Glob. Planet. Change 2021, 203, 103542. [Google Scholar] [CrossRef]
  10. Richards, D.R.; Friess, D.A. Rates and drivers of mangrove deforestation in Southeast Asia, 2000–2012. Proc. Natl. Acad. Sci. USA 2016, 113, 344–349. [Google Scholar] [CrossRef]
  11. Jia, M.; Wang, Z.; Zhang, Y.; Mao, D.; Wang, C. Monitoring loss and recovery of mangrove forests during 42 years: The achievements of mangrove conservation in China. Int. J. Appl. Earth Obs. Geoinform. 2018, 73, 535–545. [Google Scholar] [CrossRef]
  12. Jia, M.; Wang, Z.; Zhang, Y.; Ren, C.; Song, K. Landsat-based estimation of mangrove forest loss and restoration in Guangxi province, China, influenced by human and natural factors. IEEE J. Sel. Top. Appl. Earth Obs. Remote Sens. 2014, 8, 311–323. [Google Scholar] [CrossRef]
  13. Youshao, W. Impacts, challenges and opportunities of global climate change on mangrove ecosystems. J. Trop. Oceanogr. 2021, 40, 1–14. [Google Scholar]
  14. Wang, Q.X.; Song, L.; Agusti, S.; Duarte, C.; Christakos, G.; Wu, J.P. Changes of the Macrobenthos Community with Non-native Mangrove Rehabilitation (Kandelia obovata) and Salt Marsh Invasion (Spartina alterniflora) in Ximen Island, Zhejiang, China. Ocean Sci. J. 2021, 56, 395–405. [Google Scholar] [CrossRef]
  15. Hu, T.Y.; Zhang, Y.Y.; Su, Y.J.; Zheng, Y.; Lin, G.H.; Guo, Q.H. Mapping the Global Mangrove Forest Aboveground Biomass Using Multisource Remote Sensing Data. Remote Sens. 2020, 12, 1690. [Google Scholar] [CrossRef]
  16. Zhu, Z.; Huang, M.M.; Zhou, Z.Y.; Chen, G.X.; Zhu, X.D. Stronger conservation promotes mangrove biomass accumulation: Insights from spatially explicit assessments using UAV and Landsat data. Remote Sens. Ecol. Conserv. 2022, 8, 656–669. [Google Scholar] [CrossRef]
  17. Dong, L.H.; Li, F.R.; Song, Y.W. Error structure and additivity of individual tree biomass model for four natural conifer species in Northeast China. Yingyong Shengtai Xuebao 2015, 26, 704. [Google Scholar]
  18. Wang, Z.; Du, H.; Song, T.; Peng, W.; Zeng, F.; Zeng, Z.; Zhang, H. Allometric models of major tree species and forest biomass in Guangxi. Acta Ecol. Sin. 2015, 35, 4462–4472. [Google Scholar]
  19. Dong, L.H.; Li, F.R.; Jia, W.W. Development of tree biomass model for Pinus koraiensis plantation. J. Beijing For. Univ. 2012, 34, 16–22. [Google Scholar]
  20. Fu, L.Y.; Tang, S.Z.; Zhang, H.R. Generalized above-ground biomass equations for two main species in northeast China. Acta Ecol Sin. 2015, 35, 150–157. [Google Scholar]
  21. Zhao, H.; Li, Z.; Zhou, G.; Qiu, Z.; Wu, Z. Site-specific allometric models for prediction of above-and belowground biomass of subtropical forests in Guangzhou, southern China. Forests 2019, 10, 862. [Google Scholar] [CrossRef]
  22. Kebede, B.; Soromessa, T. Allometric equations for aboveground biomass estimation of Olea europaea L. subsp. cuspidata in Mana Angetu Forest. Ecosyst. Health Sustain. 2018, 4, 1–12. [Google Scholar] [CrossRef]
  23. Huang, R.X.; Wu, Z.L.; Peng, J.W.; Xue, C.Q.; Luo, Y.; Su, Z.Y. Biomass model of Bruguiera gymnorrhiza in Guangdong. J. Northwest A F Univ.—Nat. Sci. Ed. 2019, 47, 86–94. [Google Scholar]
  24. Lin, Q.-l.; Gu, X.-x.; Chen, X.-w.; Guo, X.-d.; Cai, L.-z.; Lin, L.; Chen, W.-d.; Dong, Y.; Feng, H.-y.; Cai, H.-c.; et al. Coastal wetland restoration based on mangrove Kandelia obovata substitution controlling Spartina alterniflora invasion: A case study of Aojiang Estuary in Zhejiang Province. Chin. J. Ecol. 2020, 39, 1761. [Google Scholar]
  25. Wu, W.Z.; Zhao, Z.X.; Yang, S.; Liang, L.C.; Chen, Q.X.; Lu, X.; Liu, X.; Zhang, X.W. The mangrove forest distribution and analysis of afforestation effect in Zhejiang Province. J. Trop. Oceanogr. 2022, 41, 67–74. [Google Scholar]
  26. Dong, L.; Zhang, L.; Li, F. Allometry and partitioning of individual tree biomass and carbon of Abies nephrolepis Maxim in northeast China. Scand. J. For. Res. 2016, 31, 399–411. [Google Scholar] [CrossRef]
  27. Ong, J.; Gong, W.; Wong, C. Allometry and partitioning of the mangrove, Rhizophora apiculata. For. Ecol. Manag. 2004, 188, 395–408. [Google Scholar] [CrossRef]
  28. Vinh, T.V.; Marchand, C.; Linh, T.V.K.; Vinh, D.D.; Allenbachd, M. Allometric models to estimate above-ground biomass and carbon stocks in Rhizophora apiculata tropical managed mangrove forests (Southern Viet Nam). For. Ecol. Manag. 2019, 434, 131–141. [Google Scholar] [CrossRef]
  29. Yang, S.-C.; Lu, W.-X.; Zhen, Z.; Si, L. Mangrove wetlands: Distribution, species composition and protection in China. Subtrop. Plant Sci. 2017, 46, 301. [Google Scholar]
  30. Xu, Y.; Du, A.; Wang, Z.; Zhu, W.; Li, C.; Wu, L. Effects of different rotation periods of Eucalyptus plantations on soil physiochemical properties, enzyme activities, microbial biomass and microbial community structure and diversity. For. Ecol. Manag. 2020, 456, 117683. [Google Scholar] [CrossRef]
  31. Zhu, D.H.; Hui, D.F.; Wang, M.Q.; Yang, Q.; Li, Z.; Huang, Z.J.; Yuan, H.M.; Yu, S.X. Allometric growth and carbon storage in the mangrove Sonneratia apetala. Wetl. Ecol. Manag. 2021, 29, 129–141. [Google Scholar] [CrossRef]
  32. Rovai, A.S.; Twilley, R.R.; Castañeda-Moya, E.; Riul, P.; Cifuentes-Jara, M.; Manrow-Villalobos, M.; Horta, P.A.; Simonassi, J.C.; Fonseca, A.L.; Pagliosa, P.R. Global controls on carbon storage in mangrove soils. Nat. Clim. Change 2018, 8, 534–538. [Google Scholar] [CrossRef]
  33. Pandey, P.C.; Anand, A.; Srivastava, P.K. Spatial distribution of mangrove forest species and biomass assessment using field inventory and earth observation hyperspectral data. Biodivers. Conserv. 2019, 28, 2143–2162. [Google Scholar] [CrossRef]
  34. Rovai, A.S.; Twilley, R.R.; Castañeda-Moya, E.; Midway, S.R.; Friess, D.A.; Trettin, C.C.; Bukoski, J.J.; Stovall, A.E.L.; Pagliosa, P.R.; Fonseca, A.L.; et al. Macroecological patterns of forest structure and allometric scaling in mangrove forests. Glob. Ecol. Biogeogr. 2021, 30, 1000–1013. [Google Scholar] [CrossRef]
  35. Kauffman, J.B.; Bernardino, A.F.; Ferreira, T.O.; Giovannoni, L.R.; Gomes, L.E.D.; Romero, D.J.; Jimenez, L.C.Z.; Ruiz, F. Carbon stocks of mangroves and salt marshes of the Amazon region, Brazil. Biol. Lett. 2018, 14, 20180208. [Google Scholar] [CrossRef]
  36. Wang, R.; Li, X.-J.; Cai, J.-B.; Zhang, D.-Q.; He, D.-J.; Liu, C.; Wang, Q.-B.; Zheng, K.-J.; Lin, F. Comparative study on biomass of the natural Kandelia Candel forest and its plantation in the coastal area of east Fujian Province. Xinan Linxueyuan Xuebao/J. Southwest For. Univ. 2010, 30, 16–20. [Google Scholar]
  37. Wang, X.; Weng, Y.; Liu, G.; Krasowski, M.; Yang, C. Variations in carbon concentration, sequestration and partitioning among Betula platyphylla provenances. For. Ecol. Manag. 2015, 358, 344–352. [Google Scholar] [CrossRef]
  38. Zanvoa, S.M.G.; Mensah, S.; Salako, K.; Kakaï, R.G. Tree height-diameter, aboveground and belowground biomass allometries for two West African mangrove species. Biomass Bioenerg. 2023, 176, 106917. [Google Scholar] [CrossRef]
  39. Zhao, H.-b.; Zhou, G.-y.; Li, Z.-j.; Qiu, Z.-j.; Wu, Z.-m.; Wang, X. Biomass allocation and allometric growth models of four common tree species in Southern subtropical evergreen broad-leaved forest. Sci. Silvae Sin. 2022, 58, 23–31. [Google Scholar]
  40. Njana, M.A.; Bollandsås, O.M.; Eid, T.; Zahabu, E.; Malimbwi, R.E. Above- and belowground tree biomass models for three mangrove species in Tanzania: A nonlinear mixed effects modelling approach. Ann. For. Sci. 2016, 73, 353–369. [Google Scholar] [CrossRef]
  41. Wang, M.S.; Madden, M.; Hendy, I.; Estradivari; Ahmadia, G.N. Modeling projected changes of mangrove biomass in different climatic scenarios in the Sunda Banda Seascapes. Int. J. Digit. Earth 2017, 10, 457–468. [Google Scholar] [CrossRef]
Figure 1. (a) A map of China, with the red mark highlighting the location of Zhejiang Province. (b) Map of Zhejiang Province. The light-green area represents most of Zhejiang Province, and the beige area represents part of Wenzhou. The red, five-pointed stars represent the sampling plots; there are four of them, labeled as (1) Cangnan County, (2) Longgang, (3) Dongtou District, and (4) Yueqing, and there is a scale in kilometers (km) in the lower-right corner of the map. On the right, (1)–(4) are the real-life photos of the corresponding sampling plots, showing the local vegetation and other landscape conditions.
Forests 16 00451 g001
Figure 2. Biomass and carbon stocks allocation of leaves, stems, and roots in the five plots. The bar chart shows the percentages of biomass (left) and carbon content (right) in plant leaves, stems, and roots across groups (CN1, CN2, DT, YQ, and LG). Red represents the leaf, cyan represents the stem, and yellow the root. Each group’s bar consists of color segments for different parts, with corresponding percentage values marked on them.
Forests 16 00451 g002
Figure 3. Relationship between basal diameter (D) and biomass of each component of trees. The scatter points in different colors in the figure represent different plots: gray for CN1, red for CN2, blue for DT, green for YQ, and purple for LG. The black curve in each sub-graph is the fitted curve, which represents the trend of biomass with respect to the basal diameter. The “R2” value marked next to it represents the goodness-of-fit.
Forests 16 00451 g003
Figure 4. Relationship between total height (H) and biomass of each component of trees. The scatter points in different colors in the figure represent different plots: gray for CN1, red for CN2, blue for DT, green for YQ, and purple for LG.
Forests 16 00451 g004
Figure 5. Relationship between basal diameter (D) and carbon stocks of each component of trees. The scatter points in different colors in the figure represent different plots: gray for CN1, red for CN2, blue for DT, green for YQ, and purple for LG.
Forests 16 00451 g005
Figure 6. Relationship between total height (H) and carbon stocks of each component of trees. The scatter points in different colors in the figure represent different plots: gray for CN1, red for CN2, blue for DT, green for YQ, and purple for LG.
Forests 16 00451 g006
Figure 7. Relationship between basal diameter (D), total height (H) and biomass proportion of each component of trees. Hollow circles represent biomass ratios of plant components: red (leaf), green (stem), and blue (root). The green and red curves depict stem and leaf biomass trends with base diameter or height, respectively, while the blue line indicates root biomass levels.
Forests 16 00451 g007
Figure 8. Relationship between basal diameter (D), total height (H) and carbon stocks proportion of each component of trees. Hollow circles represent biomass ratios of plant components: red (leaf), green (stem), and blue (root). The green and red curves depict stem and leaf biomass trends with base diameter or height, respectively, while the blue line indicates root biomass levels.
Forests 16 00451 g008
Figure 9. Total biomass model diagram. The figure shows the relationship between Total biomass (kg) under different plots (CN1, CN2, DT, YQ, LG, and Multi-plots) and different independent variables (DH, D2H, D2H, etc., respectively; the specific meanings need to be determined in conjunction with the research background). The scatter points in each subgraph represent the sample data points, and the red curve is the fitting curve, whose corresponding fitting equation and determination coefficient (R2) are also labeled in the graph. A * indicates statistical significance(p < 0.01).
Forests 16 00451 g009
Figure 10. Relationship between total biomass and different variables.(*: p < 0.01). The scatter points in different colors in the figure represent different plots: gray for CN1, red for CN2, blue for DT, green for YQ, and purple for LG.
Forests 16 00451 g010
Figure 11. Relationship between predicted and measured total biomass of Kandelia obovate. The scatter points in different colors in the figure represent different plots: gray for CN1, red for CN2, blue for DT, green for YQ, and purple for LG.
Forests 16 00451 g011
Table 1. Basic statistics of sample tree of Kandelia obovate. CN1 and CN2—the plots in Cangnan County; DT—the plots in Dongtou District; YQ—the plots in Yueqing, LG—the plots in Longgang. N—number of individuals per species; H—total height (m); D—basal diameter (cm); LB—leaf biomass (kg); SB—stem biomass (kg); RB—root biomass (kg).
PlotsAgesND (cm)H (m)LB (kg) (Mean ± SD)SB (kg) (Mean ± SD)RB (kg) (Mean ± SD)
CN15471.1~4.10.35~0.950.034 ± 0.0250.059 ± 0.0430.031 ± 0.023
CN27551.3~5.50.65~1.780.069 ± 0.0480.249 ± 0.1830.097 ± 0.067
DT9451.5~4.31.02~1.910.078 ± 0.0370.240 ± 0.1350.098 ± 0.049
YQ14422.6~7.21.19~2.110.111 ± 0.0690.617 ± 0.3610.251 ± 0.156
LG20612.6~6.21.64~3.870.209 ± 0.1331.657 ± 0.8680.559 ± 0.351
average 3.3 ± 1.2 1.70 ± 0.920.105 ± 0.099 0.617 ± 0.769 0.223 ± 0.275
Table 2. Carbon conversion factor of each component.
plotsLB[C]% (Mean ± SD)SB[C]% (Mean ± SD)RB[C]% (Mean ± SD)TB[C]% (Mean ± SD)
CN139.48 ± 2.6141.85 ± 3.4527.53 ± 2.3637.76 ± 1.90
CN241.26 ± 2.7145.37 ± 0.5327.58 ± 1.8140.43 ± 1.23
DT38.71 ± 1.7544.06 ± 0.7325.88 ± 1.1738.67 ± 1.30
YQ39.29 ± 2.8038.92 ± 4.2929.51 ± 2.1036.55 ± 3.27
LG40.44 ± 1.8844.73 ± 5.0028.87 ± 1.6740.79 ± 3.71
average39.94 ± 2.8443.23 ± 4.1527.90 ± 2.8639.05 ± 3.04
p-value<0.01<0.01<0.01<0.01
Table 3. Best fit models for the prediction of the biomass. CN1 and CN2—the plots in Cangnan County; DT—the plots in Dongtou District; YQ—the plots in Yueqing; LG—the plots in Longgang; multi-plots represent all sampling plots. LB—leaf biomass; SB—stem biomass; RB—root biomass. CF—correction factor.
PlotsVariateEquationsxabcR2Frmseaiccf
CN1LBy = a + bxD20.0065 0.0047 0.579 61.93 0.016 −383.17
SBy = a + bx + cx2DH0.0067 0.0134 0.0104 0.822 101.93 0.018 −371.40
RBy = a + bx + cx2DH0.0036 0.0068 0.0055 0.815 96.93 0.010 −430.22
TBy = axbDH0.0664 1.2253 0.796 175.46 0.042 −294.94 1.05
CN2LBy = axbD20.0058 1.0201 0.546 63.82 0.045 −337.38 1.23
SBy = axbD2H0.0172 0.9865 0.701 124.44 0.142 −210.52 1.16
RBy = axbD2H0.0076 0.9486 0.729 142.58 0.049 −327.17 1.13
TBy = axbD2H0.0345 0.9241 0.708 128.41 0.218 −163.52 1.14
DTLBy = a + bxD2H0.0281 0.0046 0.635 74.68 0.022 −337.88
SBy = a + bxD2H0.0310 0.0192 0.850 244.01 0.052 −262.61
RBy = a + bxD2H0.0229 0.0069 0.832 212.86 0.020 −348.37
TBy = a + bxD2H0.0821 0.0307 0.852 247.54 0.082 −220.97
YQLBy = a + bxD20.0021 0.0053 0.563 51.50 0.045 −256.45
SBy = a + bxD2H0.0416 0.0171 0.695 91.21 0.197 −132.55
RBy = a + bxD2H0.0120 0.0070 0.648 73.55 0.091 −197.30
TBy = a + bxD2H0.0682 0.0270 0.684 86.43 0.320 −91.75
LGLBy = a + bxD20.0362 0.0134 0.642 105.84 0.079 −1267.05
SBy = axbD0.0689 2.1621 0.802 239.53 0.391 −465.67 1.03
RBy = axbD2H0.0073 1.0557 0.788 219.54 0.198 −805.28 1.04
TBy = axbD0.0891 2.2436 0.808 247.98 0.591 −258.72 1.03
Multi-plotsLBy = a + bxD2H0.0249 0.0031 0.690 552.15 0.055 −1444.09
SBy = axbDH0.0265 1.5563 0.920 2854.15 0.273 −644.80 1.08
RBy = axbDH0.0137 1.3923 0.896 2132.50 0.128 −1024.91 1.09
TBy = axbDH0.0584 1.3918 0.908 2459.87 0.448 −397.02 1.07
Table 4. Biomass and carbon stocks.
PlotAgesNumber of BranchesMean ± SD D (m)Mean ± SD H (m)Biomass (Mg/ha)Carbon Stocks (MgC/ha)Biomass Accumulation Rate (Mgha−1yr−1)Carbon Stock Accumulation Rate (MgCha−1yr−1)
CN1-153823.0 ± 0.90.61 ± 0.100.106 0.040 0.021 0.008
CN1-253972.8 ± 1.00.59 ± 0.110.100 0.038 0.020 0.008
CN1-353982.7 ± 1.00.61 ± 0.100.101 0.038 0.020 0.008
CN1-454002.8 ± 0.80.75 ± 0.100.112 0.042 0.022 0.008
CN2-173173.1 ± 0.91.09 ± 0.170.256 0.104 0.037 0.015
CN2-273212.7 ± 0.91.04 ± 0.150.202 0.082 0.029 0.012
CN2-373093.6 ± 1.11.35 ± 0.140.320 0.129 0.046 0.018
CN2-473173.2 ± 1.21.35 ± 0.170.274 0.111 0.039 0.016
DT193602.7 ± 0.71.47 ± 0.170.351 0.136 0.039 0.015
DT294842.3 ± 0.60.90 ± 0.130.318 0.123 0.035 0.014
DT394622.7 ± 0.71.65 ± 0.240.432 0.167 0.048 0.019
DT494082.5 ± 0.61.12 ± 0.160.328 0.127 0.036 0.014
YQ1143643.9 ± 1.11.67 ± 0.210.611 0.223 0.044 0.016
YQ2144033.3 ± 1.11.60 ± 0.220.489 0.179 0.035 0.013
YQ3142884.0 ± 0.91.66 ± 0.150.477 0.174 0.034 0.012
YQ4143173.2 ± 1.11.67 ± 0.220.378 0.138 0.027 0.010
LG1202233.8 ± 1.12.97 ± 0.430.865 0.353 0.043 0.018
LG2202053.9 ± 1.03.02 ± 0.400.809 0.330 0.040 0.016
LG3202133.9 ± 1.03.17 ± 0.360.851 0.347 0.043 0.017
LG4202014.1 ± 1.13.05 ± 0.390.925 0.377 0.046 0.019
LG5202083.9 ± 1.32.97 ± 0.460.865 0.353 0.043 0.018
LG6201814.3 ± 1.13.07 ± 0.350.882 0.360 0.044 0.018
average 325 ± 873.2 ± 1.1 1.61 ± 0.80 0.457 ± 0.282 0.180 ± 0.116 0.036 ± 0.009 0.014 ± 0.004
p-value <0.01<0.01<0.01<0.01<0.01<0.01
Disclaimer/Publisher’s Note: The statements, opinions and data contained in all publications are solely those of the individual author(s) and contributor(s) and not of MDPI and/or the editor(s). MDPI and/or the editor(s) disclaim responsibility for any injury to people or property resulting from any ideas, methods, instructions or products referred to in the content.