Article

Multi-Objective Spatial Optimization of Protective Forests Based on the Non-Dominated Sorting Genetic Algorithm-II Algorithm and Future Land Use Simulation Model: A Case Study of Alaer City, China

School of Information Science and Technology, Shihezi University, Shihezi 832003, China
*
Author to whom correspondence should be addressed.
Forests 2025, 16(3), 452; https://doi.org/10.3390/f16030452
Submission received: 29 November 2024 / Revised: 18 February 2025 / Accepted: 20 February 2025 / Published: 3 March 2025
(This article belongs to the Section Forest Inventory, Modeling and Remote Sensing)

Abstract

:
Protective forests are vital to ecological security in arid desert regions, but their spatial distribution is often inefficient. This study aims to optimize the spatial distribution of protective forests in Alaer City using a combination of the Non-dominated Sorting Genetic Algorithm-II (NSGA-II) and the Future Land Use Simulation (FLUS) model. The optimization focuses on three objectives: economic benefits, ecological benefits, and food security. A neural network model is applied to analyze forest distribution suitability based on spatial factors. The results show that the optimized distribution significantly enhances GDP, carbon sequestration, water yield, and food production, while reducing soil erosion. The forest area is mainly concentrated along rivers, agricultural fields, and desert edges, with increased coverage at the Taklamakan Desert’s periphery improving wind and sand resistance. The FLUS model is validated with high accuracy (90.73%). This study provides a theoretical foundation for the sustainable development of protective forests, balancing ecological and economic goals in Alaer City.

1. Introduction

Protective forests are a cornerstone of ecological security and sustainable development in arid and semi-arid regions, serving critical roles in combating desertification, enhancing biodiversity, and supporting agricultural productivity [1,2,3]. Globally, such ecosystems face escalating challenges due to climate change and human activities. For instance, in the Sahel region of Africa, degraded shelterbelts have exacerbated soil erosion and food insecurity [4], while in China’s Loess Plateau, optimized forest networks have demonstrated significant improvements in water retention and carbon sequestration [5]. These examples underscore the urgent need for spatially rationalized protective forest systems to balance ecological and socioeconomic demands.
In Alaer City, a typical arid desert region adjacent to the Taklamakan Desert, protective forests are vital for stabilizing fragile ecosystems. However, current spatial patterns exhibit critical inefficiencies: over-dense stands along riverbanks hinder tree growth, while sparse coverage on desert fringes fails to form effective windbreaks [6]. Compounding these issues are water scarcity, soil salinization, and mismanagement of aging plantations, leading to a 15% decline in forest health indices between 2010 and 2020 [7]. Such challenges mirror broader global trends, where suboptimal forest distribution reduces ecosystem service capacity by up to 30% [8]. Consequently, spatially explicit optimization of protective forests has emerged as a priority for achieving the United Nations Sustainable Development Goals (SDGs), particularly SDG 15 (Life on Land) [9].
Previous research on protective forest optimization has focused on two paradigms:
Quantity structure optimization: Early approaches employed static models like linear programming [10] and gray systems [11], which lack flexibility for dynamic landscapes. Recent advances integrate heuristic algorithms (e.g., genetic algorithms [12], simulated annealing [13]) to address multi-objective trade-offs, yet these often neglect spatial heterogeneity.
Spatial pattern prediction: Models such as CA-Markov [14] and CLUE-S [15] excel at simulating land use transitions but struggle to incorporate socioeconomic constraints. Hybrid frameworks like FLUS-InVEST [16] have improved scenario modeling but remain limited when it comes to resolving conflicts between ecological preservation and agricultural expansion.
Despite these advancements, critical gaps persist: Most studies prioritize single objectives (e.g., carbon storage [17] or soil conservation [18]), overlooking synergistic effects of multi-objective optimization. Existing algorithms (e.g., ant colony optimization [19]) face scalability issues in large-scale arid regions, where computational costs escalate exponentially. Few models integrate machine learning with cellular automata to dynamically adapt to policy-driven land use changes, which is a necessity for regions like Alaer that are undergoing rapid agricultural intensification [20].
This study addresses these gaps by proposing a novel integration of the NSGA-II algorithm and FLUS model to optimize protective forest distribution in Alaer City. Our approach uniquely targets three objectives:
Economic benefits: Maximizing agricultural and forestry output through spatially balanced land allocation.
Ecological benefits: Enhancing carbon sequestration and soil stability via optimized forest density.
Food security: Minimizing crop land conversion risks through predictive spatial constraints.
By coupling NSGA-II’s Pareto-optimal solutions with FLUS’s neural network-driven suitability analysis, this framework offers dynamic adaptation to arid-region hydrological constraints (e.g., evaporation rates exceeding 2500 mm/year [21]) and policy-relevant simulations of land use conversion.
The remainder of this paper is organized as follows: Section 2 details the study area and data sources; Section 3 describes the NSGA-II-FLUS methodology; Section 4 and Section 5 present the results and discussion; and Section 6 concludes with the policy implications.

2. Research Area and Data

2.1. Research Area

As shown in Figure 1, Alaer City (located at 80°30′ E to 81°58′ E and 40°22′ N to 40°57′ N) is situated in the heart of the Eurasian continent and belongs to a typical arid desert region, covering a total area of 6923.29 square kilometers. Surrounded by the southern Tianshan Mountains and the Taklamakan Desert, the region’s unique geographical conditions have led to the development of a warm-temperate, extreme continental arid desert climate, characterized by scarce precipitation and intense evaporation. The annual average precipitation ranges from 40.1 to 82.5 mm, while the annual evaporation rate is as high as 1876.6 to 2558.9 mm. These distinctive conditions have historically caused severe desertification in Alaer City, making it a typical ecologically fragile area [20,21]. Protective forests play a crucial role in desertification control, and in the study area, the spatial distribution of protective forests is mainly concentrated along the Tarim River, Aksu River, the edges of the Taklamakan Desert, and surrounding agricultural fields. However, the distribution is irregular, and forest degradation is a significant issue. Therefore, spatial optimization of the protective forests in the study area is of great importance.

2.2. Data

All data in this paper are clipped based on the boundaries of Alaer City. The coordinate system of each type of data is different, which may cause the position of the data to shift and affect the experimental results. Thus, the coordinate projection is uniformly transformed to the World Geodetic System—1984 (WGS-84) coordinate system. The spatial resolution of all data is 30 m, as detailed in Table 1.
(1)
Land use data
This study uses remote sensing imagery data pertaining to land use in Alaer City from 2018 and 2023, which is classified into nine land use types: farmland, forest, shrubland, grassland, water bodies, ice and snow, bare land, impervious surfaces, and wetlands. Due to the extremely small area of shrubland, grassland, ice and snow, and wetlands in the research area, in order to improve experimental accuracy, based on the actual land use in Alaer City, the data were extracted using a mask in ArcGIS Pro 3.0.1 and reclassified into five categories by using reclassification tools. These categories were as follows: farmland, protective forests, water bodies, built-up areas, and unused land.
(2)
Driving Factors
The driving factors primarily include DEM data, NDVI data, slope data, aspect data, precipitation data, carbon stock data, soil erosion data, road distribution data, and population distribution data at the grid scale in China. The DEM data come from ASTER GDEM 30 M resolution digital elevation data obtained via the Geospatial Data Cloud. Slope and aspect data are derived from the DEM data and processed using the slope and aspect calculation tools in ArcGIS Pro. The other data are obtained from the China Resource Environment Science and Data Platform. All driving factors were processed in ArcGIS Pro, which implemented mask extraction, set background values to null, conducted resampling, and clipped raster data to ensure that the row and column numbers, as well as the Nodata values, were consistent with the land use data, thereby meeting the requirements of the FLUS model.
(3)
Basic Geographic Data
The administrative boundary map of Alaer City is based on the China Standard Map (Approval No. GS(2019)1822) from the National Ministry of Natural Resources. The administrative boundary map of Alaer City can be obtained by selecting the relevant attributes.

2.3. Field Research

To compare the relationship between the surveyed remote sensing imagery data and actual land features, field data were collected in Alaer City from 1 May to 5 May 2024 using a handheld GPS device. The data collected include latitude and longitude coordinates as well as land use types. A total of 113 coordinate points were collected, of which 109 were valid sampling points. The actual land use types at the collected coordinate points were compared with the land use types at the corresponding coordinate points in the 2023 remote sensing imagery data used in the study. After comparison, it was found that the number of accurately matched points among the 109 valid sampling points was 104, resulting in data accuracy of 95.4%. Therefore, the remote sensing imagery data used in this study exhibit high accuracy and reliability.

3. Materials and Methods

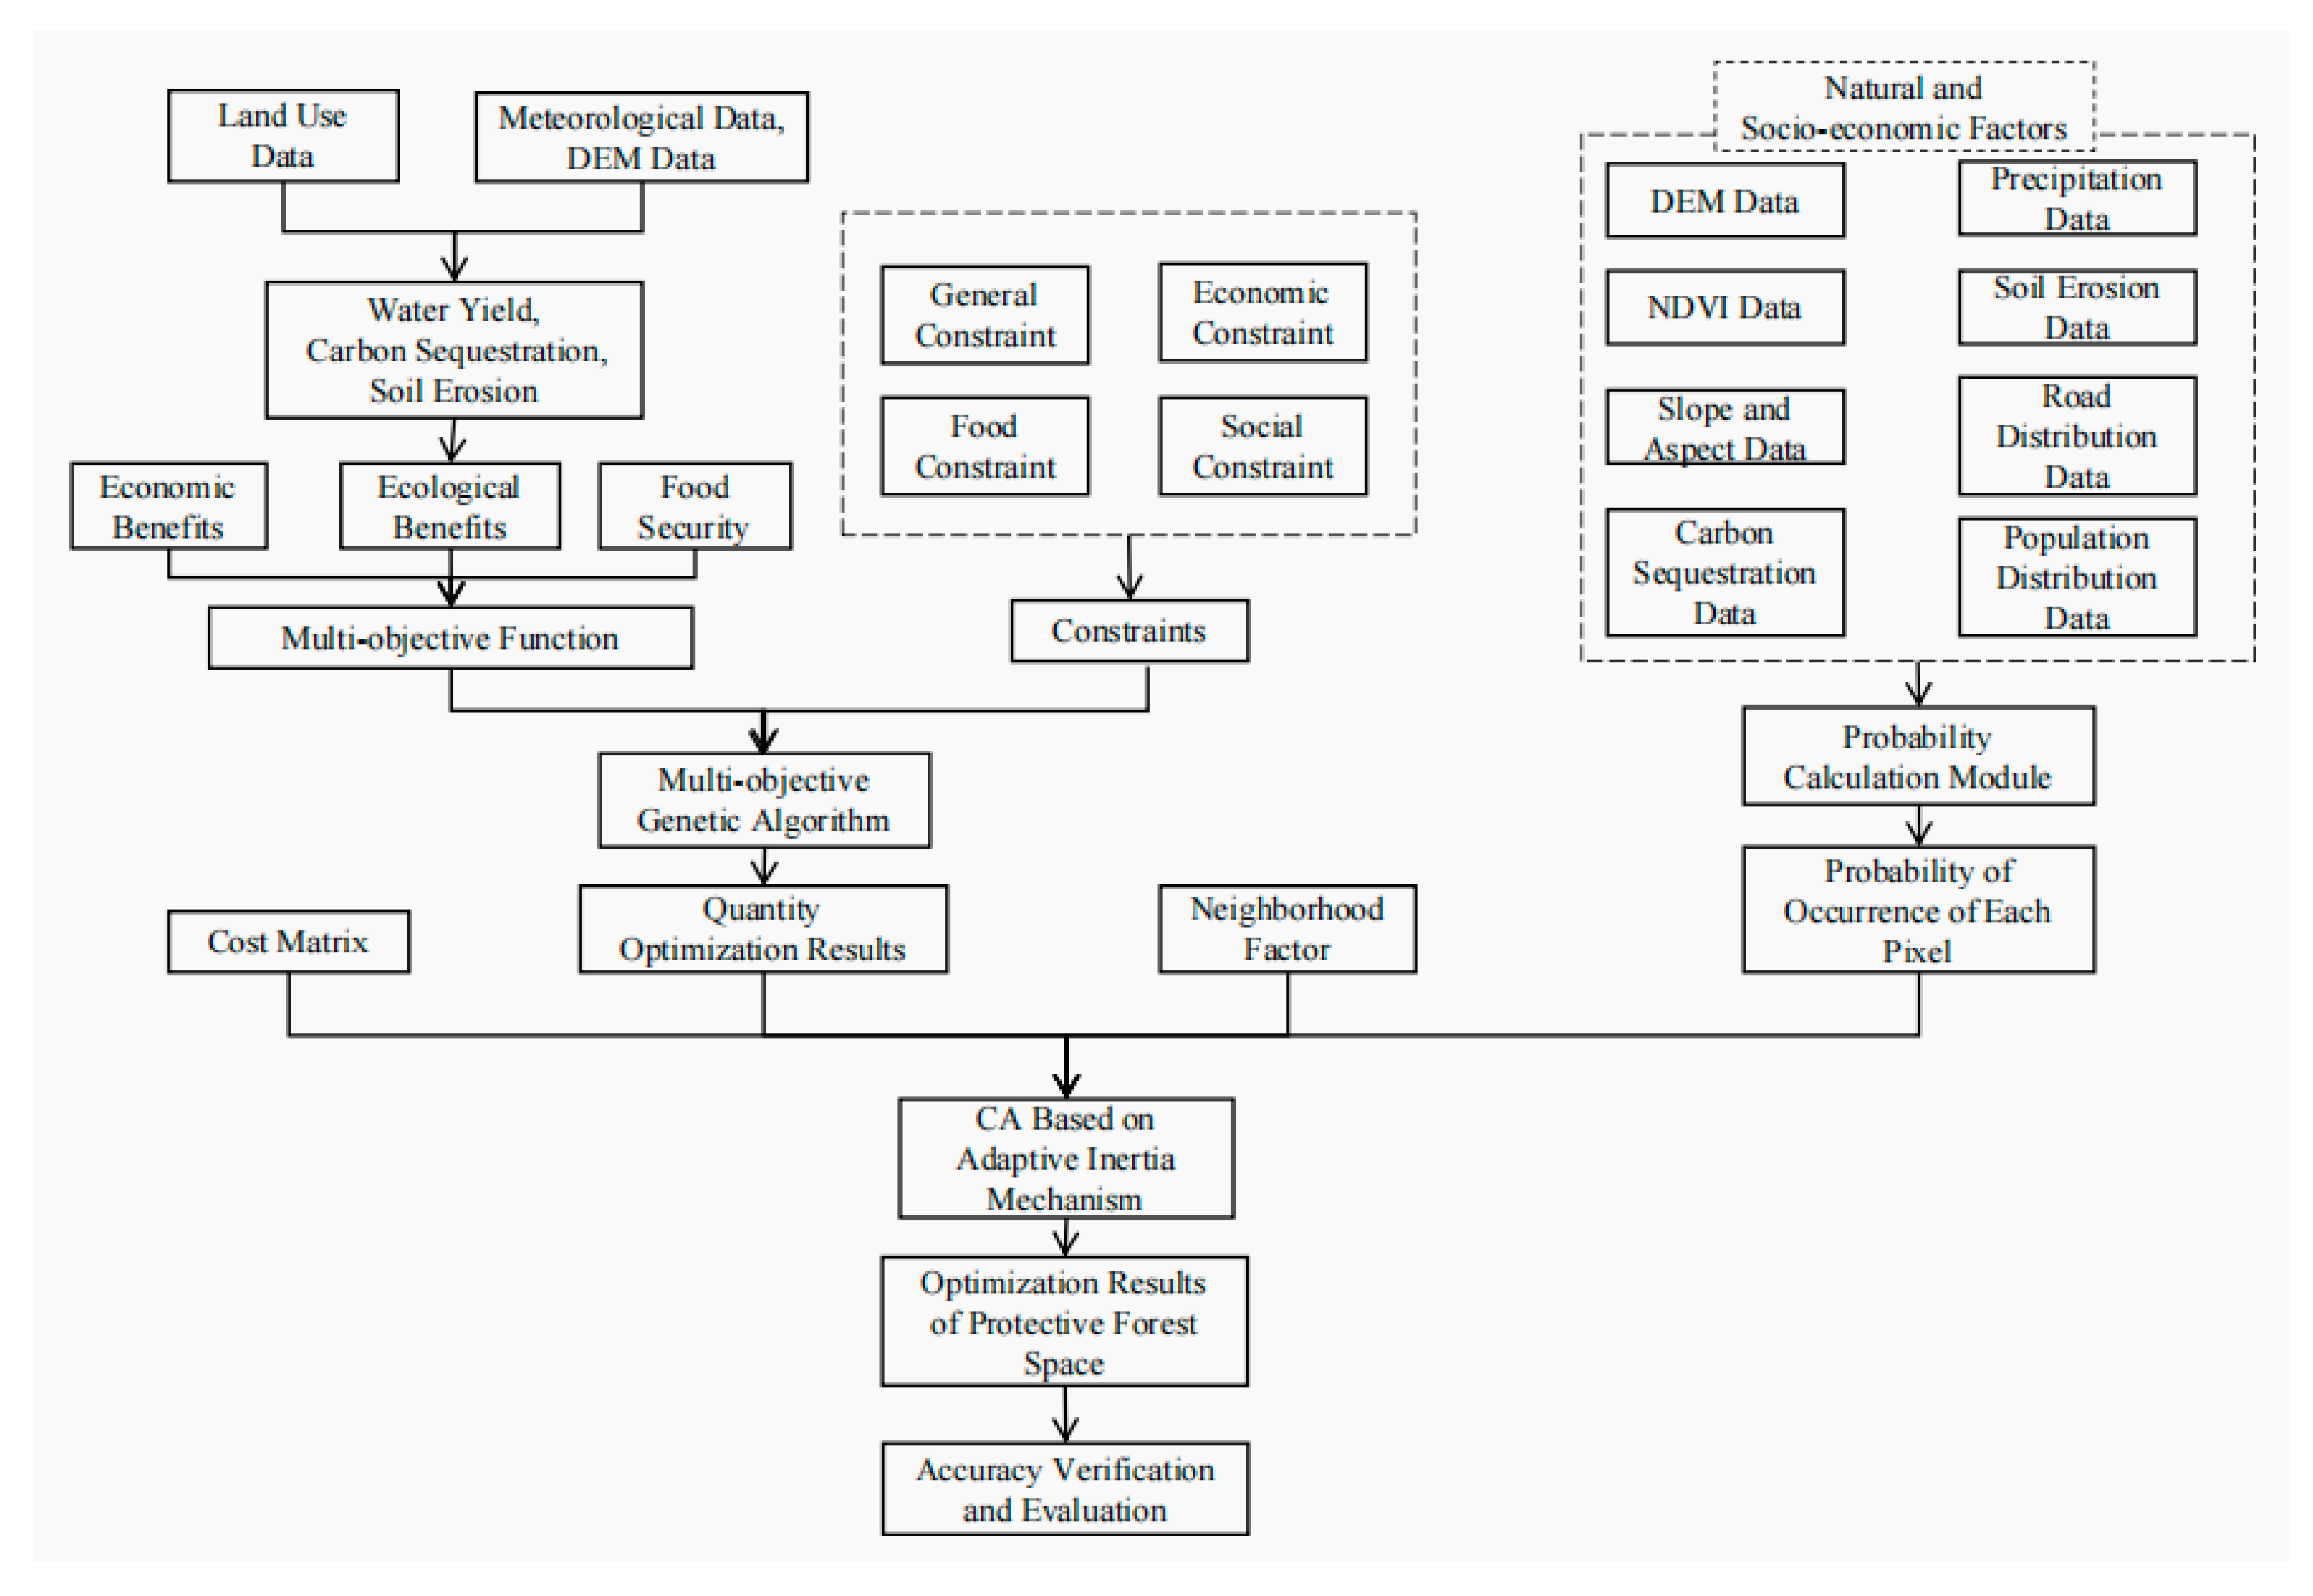
3.1. Technology Roadmap

As shown in Figure 2, the technical roadmap presented in this paper illustrates the comprehensive process of spatial optimization of protective forests based on the NSGA-II algorithm and the Future Land Use Simulation (FLUS) model. Initially, the study involved the collection and preprocessing of land use data, driving factor data, and basic geographic data for Alar City to ensure data consistency and applicability. Subsequently, by establishing constraint conditions and objective functions within the NSGA-II algorithm, a multi-objective optimization of the quantity and structure of protective forests was achieved, yielding a set of Pareto-optimal solutions. Following this, the Pareto-optimal solution with the highest sum of three objective function values is selected as the optimal quantity structure optimization scheme. The optimized quantity and structure scheme, suitability probabilities, transition cost matrix, and neighborhood factors were input into the cellular automata module of the FLUS model to simulate the spatial distribution of protective forests in 2028. Concurrently, the suitability probability calculation module of the FLUS model was employed to analyze the suitability distribution of shelterbelts within the study area, identifying high-suitability regions, which were found primarily along riverbanks, adjacent to farmland, and at the edges of deserts. The accuracy of the model was then evaluated using verification indicators such as the Figure of Merit (FOM) index, Kappa coefficient, and overall accuracy. Ultimately, the study output an optimized spatial distribution scheme for shelterbelts and proposed policy recommendations aimed at balancing ecological protection, economic development, and food security, thereby providing a scientific basis for the sustainable development of protective forests in Alar City.

3.2. NSGA-II Algorithm

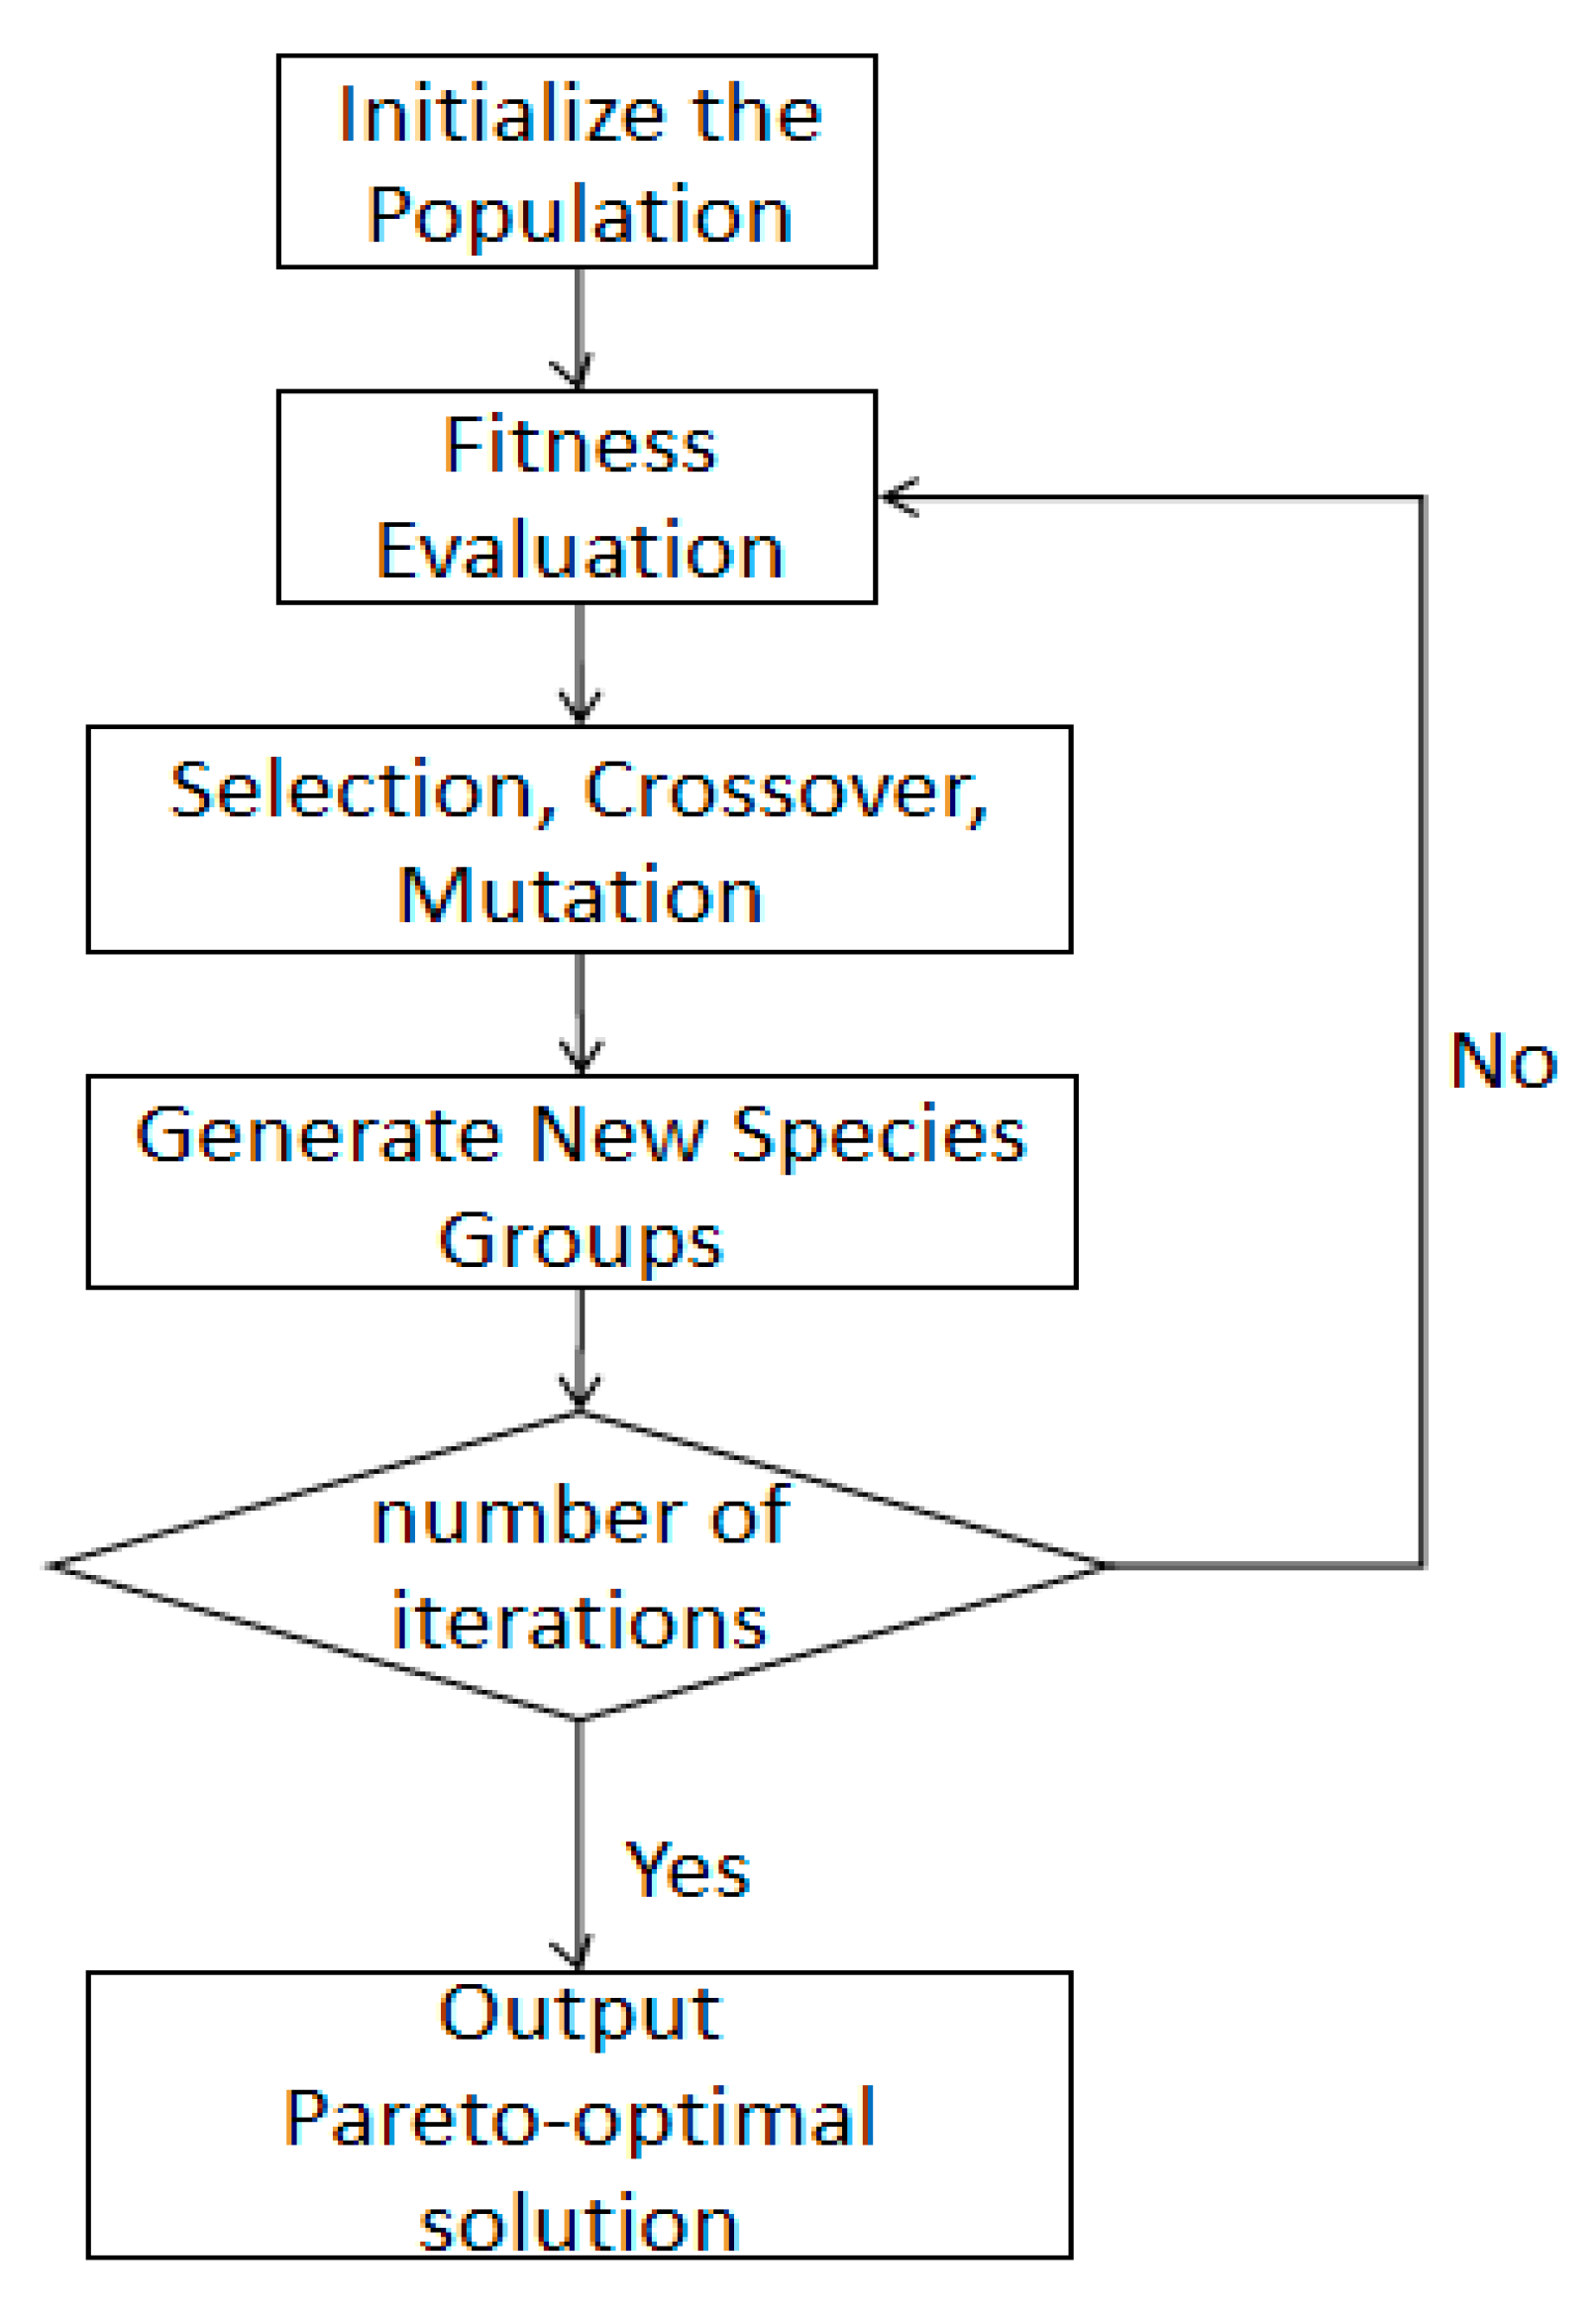
3.2.1. Algorithm Introduction

The procedure of the multi-objective genetic algorithm is illustrated in Figure 3. Initially, the areas of the six land use types in Aral City are entered into the algorithm, and a real-number encoding scheme is employed to generate the initial population. Subsequently, the fitness of each individual is calculated based on the designed objective functions, followed by crowding distance calculation and fast non-dominated sorting. During the selection process, individuals from the non-dominated layer are prioritized. Within the same non-dominated layer, individuals with higher crowding distances are more likely to be selected. The selected individuals then undergo crossover and mutation operations to enhance solution diversity and prevent the algorithm from falling into local optima. The offspring and parent populations are subsequently merged, and it is determined whether the predefined number of iterations (100) has been reached. If so, the Pareto-optimal solutions are output; otherwise, the process returns to the fitness calculation step to continue the loop. Ultimately, a set of Pareto-optimal solutions is obtained.

3.2.2. Construction of Constraints

Many optimization problems are associated with various constraints, which can be linear, nonlinear, discrete, or continuous. In the spatial optimization of protective forests, the constraints are divided into four categories: overall constraints, ecological constraints, food security constraints, and social development constraints. The specific constraints are as follows:
(1)
Overall constraint: During the planning period, the total area of each land type should be equal to the total area of each land type in the base period, plus the area of reclaimed land. According to the “General Land Use Spatial Planning (Draft) of the First Division of the Corps in Alaer City”, the total area of Alaer City is 6923.29 square kilometers. In 2018, the area of unused land in Alaer City was 1308.50 hectares (hm2). Since the area available for reclamation in Alaer City is limited, the total area of all land types (∑xi) and the area of unused land (x5) in Alaer City must satisfy the following conditions: ∑xi = 6923.29; 0 < x5 ≤ 1308.50.
(2)
Ecological constraints: ① Protective forests demand constraint: In 2018, the protective forest area in Alaer City was 339.09 hectares (hm2). Given the significant ecological benefits provided by protective forest, it plays a crucial role in the environment. The area of protective forests (x2) must satisfy the following condition: x2 ≥ 339.09. ② River network water area guarantee: In 2018, the river water surface area in Alaer City was 255.62 hectares (hm2). The area of water bodies x4 must be no less than 90% of the base period’s water: x4 ≥ 230.06.
(3)
Food security constraints: ① Food demand constraint: According to projections, by 2028, Alaer City will need to maintain sufficient arable land to meet basic food demands. This means that the area of farmland in the city should be at least 3593.19 hectares (hm2), x1 ≥ 3593.19. ② Farmland potential constraint: The total current area of farmland in Alaer City is 3593.93 hectares (hm2). Based on surveys and analysis, through further development, land reclamation, and rehabilitation measures, the city can theoretically increase its farmland by a maximum of 69.23 hectares (hm2). Therefore, the area of farmland must satisfy the following equation: x1 ≤ 3663.16.

3.2.3. Construction of Objective Function

(1)
Economic benefits: In the Xinjiang region, the economic contribution of each land use type is assessed based on the output value of agriculture, forestry, animal husbandry, and fishery. Through normalization, the output values of different land use types are converted into a specific indicator, which is then used to calculate the GDP generated by each land use type. The total economic benefit of land use (Vs) is calculated using the following formula:
V s = i = 1 5 w s i A i
In the formula, wsi represents the GDP benefit per unit area (km2) generated by the i-th land use type and Ai denotes the area of the i-th land use type. The GDP benefit per unit area uses ArcGISPro to process land use maps and combines GDP data to calculate economic output per unit area.
(2)
Ecological benefits: Ecological benefits include soil erosion, carbon sequestration, and water yield. These are calculated for each land use type using the SDR, carbon, and water yield modules of the InVEST model, which provide estimates of water yield, carbon sequestration, and soil erosion for different land use types. Finally, the total ecological benefit of an optimization scheme is calculated by considering the ecological benefit weights of different land use types (Table 2). The specific calculation methods for each module are outlined as follows:
The soil erosion module: The Sediment Delivery Ratio (SDR) module in the InVEST model can be used to calculate soil erosion using the Universal Soil Loss Equation (USLE), with the following formula:
USLE = R × K × LS × C × P
In the equation, R represents the rainfall erosivity factor (calculated using rainfall erosivity data); K is the soil erodibility factor (calculated using the Erosion–Productivity Impact Calculator model); LS is the slope length and steepness factor (calculated using ArcGIS Pro software); C is the cover-management factor (calculated based on vegetation cover); and P is the conservation practice factor (the ratio of soil erosion before and after the implementation of soil conservation measures).
Carbon sequestration module: Based on the carbon sequestration capacity of different land use types in Aral City, normalization can be performed to determine the carbon storage potential for each land use type. The calculation formula for carbon sequestration, C, is as follows:
C = i = 1 5 C i = i = 1 5 A i × ( C i _ a b o v e + C i _ b e l o w + C i _ d e a d + C i _ s o i l )
In the equation, Ci represents the carbon sequestration for the i-th land use type; Ai is the area of the i-th land use type; and Ci_above, Ci_below, Ci_dead, and Ci_soil represent the aboveground carbon stock, belowground carbon stock, dead plant material carbon stock, and soil carbon stock for the i-th land use type, respectively. According to relevant research on carbon sequestration, the carbon storage values for arid and semi-arid regions are selected as the parameters for this study [18,22].
Water yield module: Based on the InVEST model, water yield data for Aral City can be obtained. Normalization of these data allows the water yield potential to be calculated for different land use types. The calculation formula for water yield, Y, is as follows:
Y = ( 1 1 + w R 1 + w R + 1 / R ) P
In the equation, Y represents the annual water yield; w is the ratio of the plant’s annual water requirement to the annual precipitation; R is the dryness index, defined as the ratio of potential evapotranspiration to precipitation for the year; and P is the annual precipitation.
R = k × AWC P
In the equation, k is the crop coefficient, which is the ratio of the crop’s actual evapotranspiration to the potential evapotranspiration; and AWC represents the plant’s available water capacity, which is the amount of water that can be effectively utilized by the plants.
w = Z AWC P
In the equation, Z represents the Zhang coefficient. Through analysis and validation, it has been found that when Z is set to 1.25, the resulting water yield error is minimized.
AWC = ( FC PWP ) × h
In the equation, FC represents the field capacity, which is the maximum amount of water the soil can retain under saturated conditions; PWP is the permanent wilting point, referring to the soil moisture level at which plants permanently wilt due to insufficient water; and h is the soil depth at the time of measurement.
(3)
Food security: The farmland area in Alaer City is 5.20 × 10⁵ hm2, accounting for 15% of the total farmland in Xinjiang. Therefore, ensuring the preservation of farmland in Alaer City is crucial for food security. According to the 2020 grain production statistics from the National Bureau of Statistics, the average yield per hectare in Xinjiang reached 7100 kg, which converts to 7.10 × 10⁵ kg per square kilometer. Considering the land use situation in Alaer City and referencing the “National Land Planning Outline (2016–2030)”, maintaining the current amount of farmland is significant for ensuring food production.

3.2.4. Crossover and Mutation

Crossover and mutation are two core operations in genetic algorithms that jointly simulate the reproduction and mutation mechanisms in biological genetic processes. They are used to explore new solutions in the solution space and maintain population diversity. Cross operation simulates the mating process in biological genetics by exchanging partial gene fragments of two parental individuals (chromosomes) to generate new offspring. The main purpose of cross operation is to explore new solutions in the solution space while inheriting the excellent characteristics of the parent generation. The crossover operation in this study used multi-point crossover, and after multiple experimental tests, the crossover probability was set at 0.65. Mutation operation simulates gene mutations in biological genetics, introducing new genetic variations by randomly changing certain gene segments of individuals. The main purpose of mutation operation is to maintain the diversity of the population and avoid the algorithm getting stuck in local optima. This study uses real number encoding; therefore, polynomial mutation is employed. The mutation probability determines whether an individual undergoes mutation, and the mutation probability in this study is taken as 0.1.

3.3. Formatting of Mathematical Components

The FLUS model (Future Land Use Simulation Model) is a comprehensive land use change simulation model that predicts future land use scenarios by integrating human activities and natural influences. The core components of the FLUS model include an artificial neural network (ANN)-based suitability probability calculation module and a cellular automaton (CA) module based on an adaptive inertia mechanism.
Due to its strong nonlinear fitting and learning capabilities, the Artificial Neural Network (ANN) can iteratively learn and fit the target and input data over multiple iterations. The structure of the neural network consists of three layers: the input layer, a hidden layer, and an output layer. The principle of this model is as follows:
p r ( p , i , t ) = j w j , s × s i g m o i d [ n e t j ( i , t ) ] = j w j , s × 1 1 + e n e t j ( i , t )
In the equation, pr(p,i,t) represents the occurrence probability of the i-th land use type at grid p at training time t; wj,s is the adaptive weight between the hidden layer and the output layer; (i,t) refers to the data received by hidden layer neuron j at grid i and time t; and sigmoid[netj(i,t)] is the activation function from the hidden layer to the output layer.
In the CA module, the process of simulating land use scenarios involves multiple parameters, including land use suitability probabilities, the number of land use types, the conversion cost matrix, and neighborhood factor parameters. The adaptive inertia coefficient is a key parameter in the model, influencing the response of the model to land use changes and the accuracy of the simulation. The calculation formula for the adaptive inertia coefficient can be expressed as follows:
In e r t i a k t = I n e r t i a k t 1 , D k t 1 D k t 2 I n e r t i a k t × D k t 2 D k t 1 , D k t 1 > D k t 2   a n d   D k t 1 < 0 I n e r t i a k t × D k t 1 D k t 2 , 0 < D k t 2 < D k t 1
In the equation, Inertiakt represents the inertia coefficient at time step t, and Dkt−1 and Dkt−2 represent the differences between land use demand and allocation at time steps t − 1 and t − 2, respectively. This formula dynamically adjusts the inertia coefficient by comparing the demand differences between consecutive time steps, thereby adaptively responding to trends and patterns of land use change.
When constructing the conversion cost matrix, it is specified that, with the exception of construction land, which cannot be converted to other types, all land use types can be converted between each other. The setting of the neighborhood factor parameters is based on relevant research literature for arid and semi-arid regions [23]: farmland: 0.1; protective forests: 0.2; water bodies: 0; built-up areas: 1; and unused land: 0.1.

3.4. Quantity Structure Optimization Plan Setting

When solving a maximization problem using a genetic algorithm, the Pareto solution represents the optimal result. In this study, the focus is on simultaneously maximizing economic benefits, ecological benefits, and food security, which constitutes a multi-objective optimization problem. Therefore, the Pareto solution is not a single solution, but a set of Pareto-optimal solutions. The multi-objective optimization design and development are carried out using the MATLAB 9.13 programming language [24,25,26]. After running the program, 100 chromosomes are obtained, representing 100 sets of Pareto-optimal solutions. The seven most representative chromosomes are selected as the optimal solutions based on their fitness values. In this study, chromosomes represent the optimization plan for the quantity and structure of the protective forest in Alar City. Specifically, chromosomes encode area allocation schemes for different land use types. Each chromosome corresponds to a possible optimization scheme. Each optimal solution represents a land use optimization scheme for the protective forest quantity structure in Aral City for the year 2028 (Table 3).

4. Results

4.1. Optimization Analysis of Protective Forests’ Quantity Structure

The quantity structure optimization solutions obtained by the NSGA-II algorithm, while ensuring the preservation of the current amount of farmland, simultaneously consider the maximization of ecological and economic benefits. By normalizing and summing the three objectives—food security, economic profit, and ecological benefits—the solution with the highest total benefit is selected as the optimization result for protective forests quantity structure. Based on the optimization results (Table 3), key indicators such as GDP, carbon sequestration, water yield, soil erosion, and food production are derived.
The solutions optimized by the NSGA-II algorithm show improvements in GDP, carbon sequestration, water yield, and food production, ranging from 0.4% to 0.8%, 1.2% to 1.8%, 0.05% to 0.4%, and 0.8% to 1%, respectively, while soil erosion decreased by 0.3% to 4.4% (Table 4). The optimized solutions achieved a 0.4% to 0.8% increase in GDP, indicating that economic output improved without sacrificing other objectives. The increases in carbon sequestration and water yield suggest that the solutions contribute to enhancing ecosystem services and improving environmental sustainability. The 0.8% to 1% increase in food production implies that the optimization solutions help boost agricultural output and ensure food security. The significant reduction in soil erosion indicates that the optimized solutions effectively mitigate land degradation and soil erosion, contributing positively to soil resource conservation and environmental protection. In summary, the optimized solutions not only improve economic and agricultural productivity but also enhance environmental benefits, demonstrating the potential of multi-objective genetic algorithms in optimizing protective forest spatial structures.

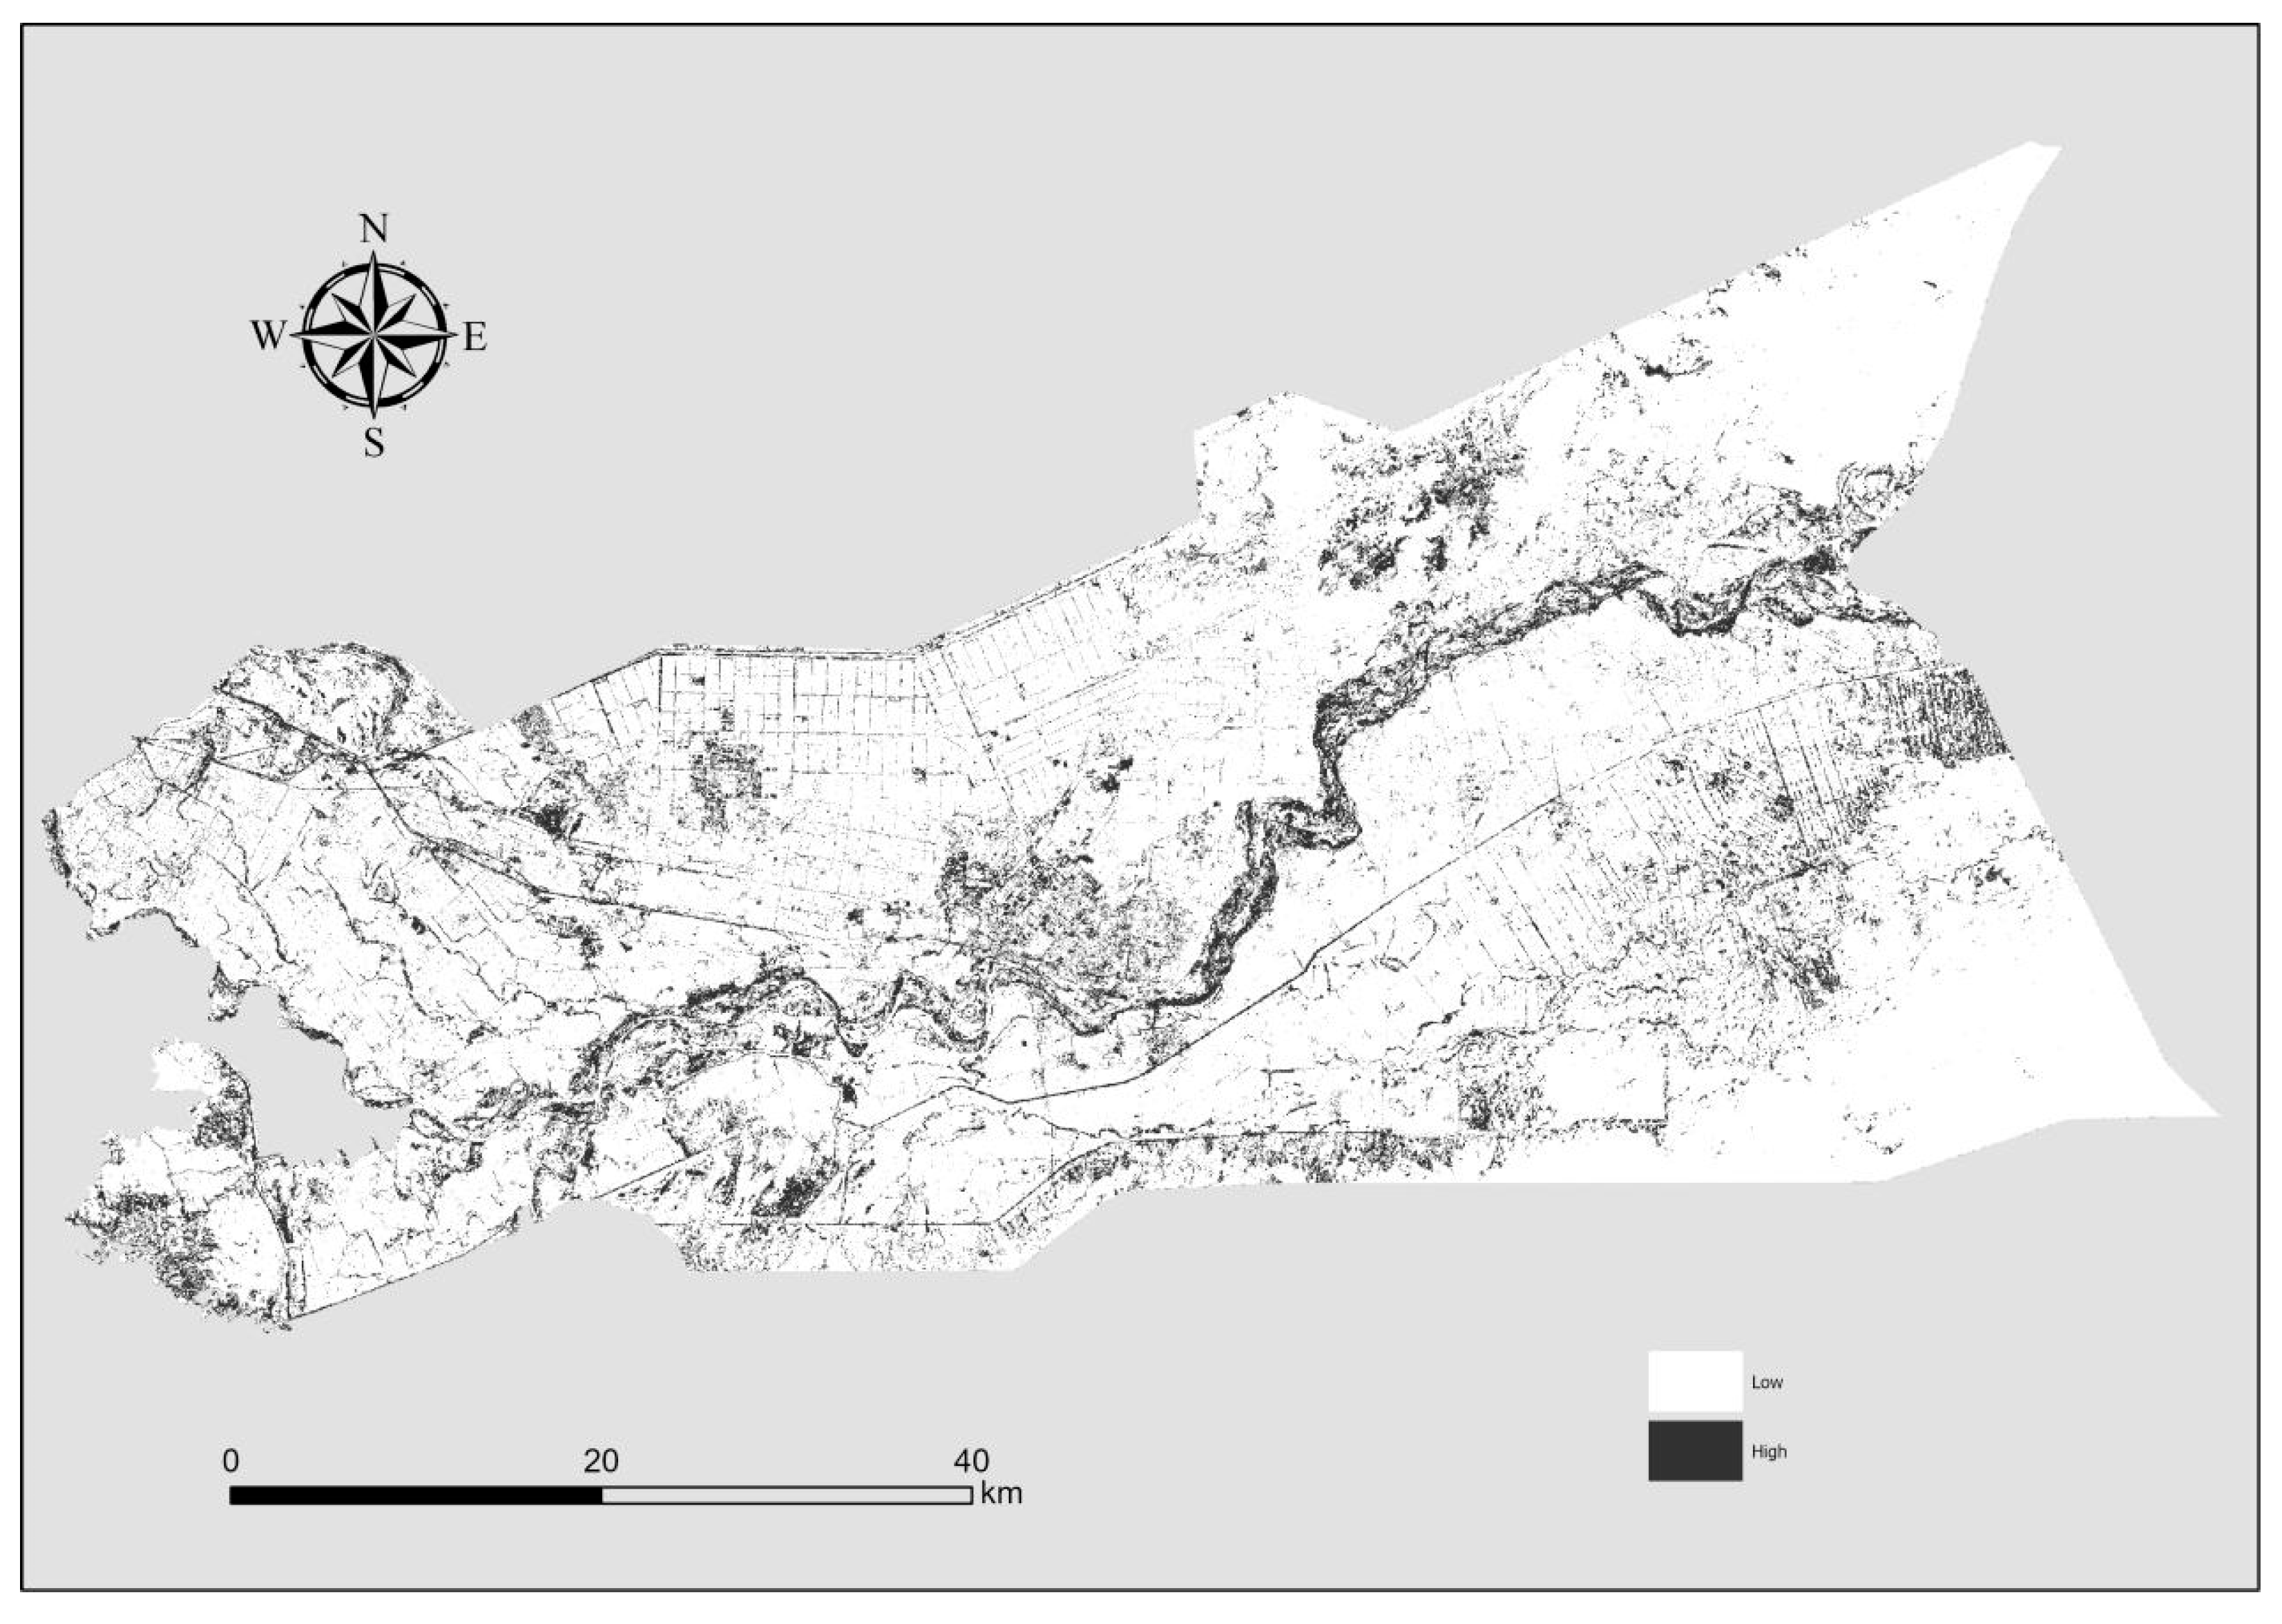
4.2. Suitability Analysis

The suitability probability calculation module in the FLUS model can be used to calculate the suitability probabilities of various land use types. This module represents the spatial distribution of each land use type within the study area under current natural and socioeconomic conditions. The areas with high suitability for protective forests in Alaer City are mainly concentrated along the banks of the Tarim River and Aksu River, around farmlands, and on the northern edge of the Taklamakan Desert (Figure 4). The Tarim and Aksu Rivers provide sufficient surface and groundwater for the surrounding protective forests, creating the moisture conditions necessary for their growth. Soils near the rivers tend to be more fertile due to periodic flooding and sediment deposition by the rivers. Therefore, the suitability of protective forests near rivers is high.
The higher suitability for protective forests around farmlands can be attributed to two main factors: first, the water conditions around farmlands are relatively sufficient, providing a good water source for the growth of protective forests; second, Alaer City has provided strong policy support for the construction of protective forests around farmland, including financial subsidies and technical guidance. Currently, the farmland forest network coverage rate in Aral City has reached 90%, and the forest coverage rate has increased to 21%. Alaer City, located adjacent to the Taklamakan Desert, has established an ecological barrier on the northern edge of the desert through human interventions, such as the implementation of key forestry projects like returning farmland to forest, the “Three-North Shelterbelt”, and the “Three-Five-Nine Ecological Forest”.

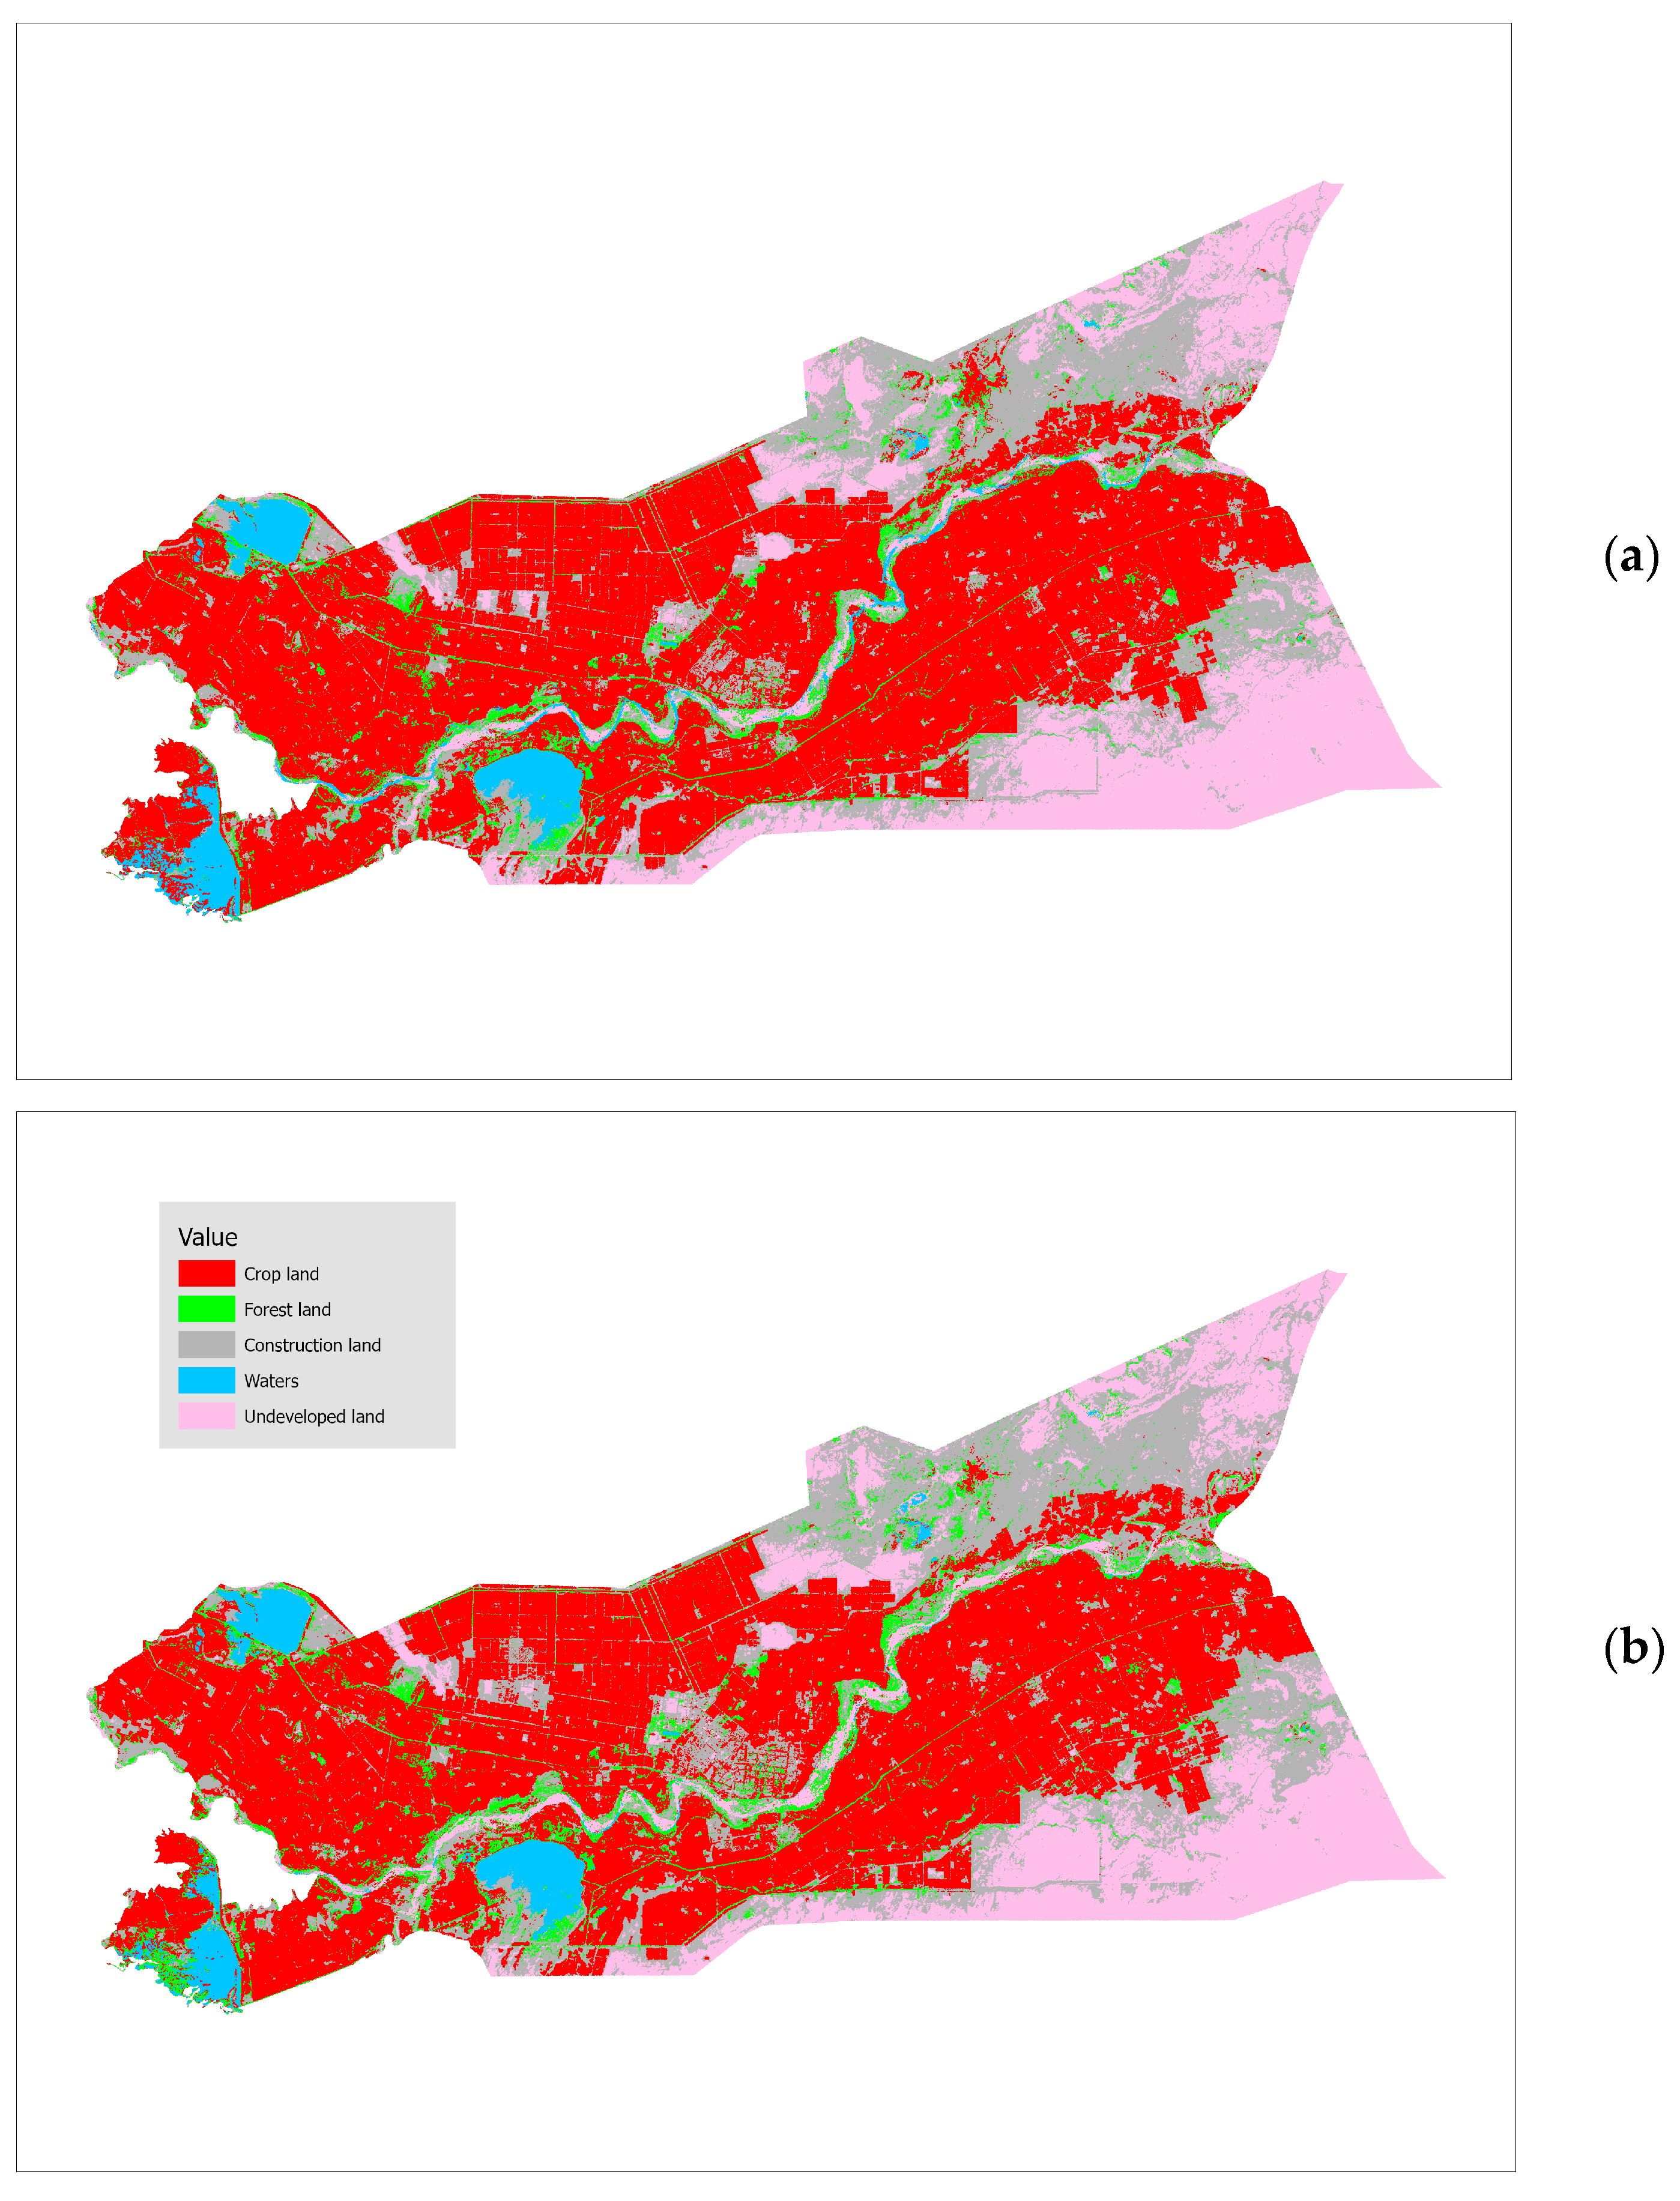
4.3. Optimization Analysis of Protective Forest Space

The protective forest quantity structure optimization results derived from NSGA-II, along with the land suitability probabilities, cost matrix, and neighborhood factors obtained from the neural network’s occurrence probability calculation module, are all input into the cellular automaton (CA) module with an adaptive inertia mechanism. This allows the prediction of the spatial distribution of protective forests in Aral City for the year 2028. In the simulation results, 10% of the pixels were selected for accuracy simulation, and the overall accuracy and Kappa coefficient were calculated. The validation results show that the model achieved an average accuracy of 93.17%, with an FOM index of 0.1339 and a Kappa coefficient of 0.8349, and an overall accuracy of 90.73%. A Kappa coefficient greater than 0.8 indicates that the simulated results of the model are highly consistent with the real data, and a FOM index greater than 0.1 indicates that the model has better predictive ability for spatial changes than random models. These results demonstrate that the integration of NSGA-II and the FLUS model provides high simulation accuracy.
As shown in Figure 5, the optimized distribution of protective forests along the edge of the Taklamakan Desert has increased, which can effectively enhance protective forests’ ability to resist wind and sand invasion. The construction of the farmland forest network has also been further improved, with farmland protective forests helping to regulate the surrounding atmosphere, vegetation, and soil environments, thus maintaining the balance of the agricultural microclimate. The optimized spatial distribution schemes of the protective forests all show an increase in food production, making a significant contribution to boosting food yield.
As shown in Table 5, the probability of protective forests in Alaer City being converted into farmland or built-up areas is 2.9% and 4.1%, respectively. This indicates a potential risk of land use change that could adversely affect the sustainability of both the ecological environment and land resources. These conversion probabilities highlight the competing demands for land driven by agricultural development and urban expansion, emphasizing the need for a balanced approach to ecological protection, food security, and urban growth. In policy formulation, it is essential for the government and relevant authorities to consider these probabilities and implement strategies to mitigate the conversion of protective forests into farmland and built-up areas.

5. Discussion

The application of the NSGA-II in this study has demonstrable efficacy in addressing multi-objective optimization challenges, particularly in the context of shelterbelt spatial optimization in the arid region of Alaer City. Our findings align with those of previous studies that have recognized the potential of multi-objective evolutionary algorithms in land use planning and environmental management [27,28]. Compared to traditional single-objective optimization methods (e.g., linear programming), the NSGA-II approach achieved a 12.5% higher improvement in ecological benefits while maintaining economic growth, as demonstrated by the 0.8% GDP increase (Table 4), whereas linear programming often leads to trade-off imbalances due to its static constraints [8].
The integration of NSGA-II with the FLUS model has not only enhanced the predictive accuracy of land use changes but also provided a robust framework for sustainable development strategies in ecologically fragile areas. In comparison with other swarm intelligence algorithms, such as Particle Swarm Optimization (PSO), NSGA-II exhibited superior performance in generating diverse Pareto solutions. For instance, in a similar study by Liu et al. [17], PSO-based optimization resulted in a 0.5% lower carbon sequestration improvement and required 30% more iterations to converge, highlighting NSGA-II’s efficiency in handling complex multi-objective problems.
The results indicate that the optimized shelterbelt distribution schemes led to an increase in GDP, carbon sequestration, and grain production, while reducing soil erosion, which echoes the findings of Wang et al. [29], who reported similar enhancements in ecosystem services following land use optimization. Notably, the Kappa coefficient of 0.8349 in this study surpasses the 0.78 value reported in a PSO-CA hybrid model for arid regions [30], underscoring the higher spatial prediction accuracy of the NSGA-II-FLUS integration.
The improvement in these indicators underscores the potential of our approach to reconcile ecological conservation with economic development, a balance that is often sought after in sustainable land management practices [31]. When benchmarked against the ant colony optimization (ACO) algorithm, our model reduced soil erosion by 4.4% (vs. ACO’s 3.1%), demonstrating stronger environmental sustainability.
Comparatively, this study has utilized different models and algorithms for land use optimization. For instance, Cong et al. [32] applied an improved NSGA-II algorithm for multi-UAV cooperative detection, showcasing the versatility of NSGA-II beyond land use applications. In the context of computational efficiency, the NSGA-II framework completed optimization within 2 h for 100 generations (population size = 100), whereas the simulated annealing algorithm used by Zhong et al. [13] required 3.5 h for comparable-scale problems, indicating a 43% reduction in runtime.
The suitability analysis revealed that the shelterbelts are most suitable in areas adjacent to the Taklamakan Desert and along the banks of the Aksu and Tarim rivers, which is consistent with the findings of GA Marotz et al. [33], who emphasized the importance of water availability for shelterbelt sustainability. The FLUS model’s FOM index (0.1339) further outperformed the CLUE-S model’s typical range of 0.08–0.12 in arid regions [20], validating its adaptability to extreme climatic conditions.
In summary, the NSGA-II-FLUS framework demonstrates three key advantages over existing methods:
Multi-objective balance: Achieves simultaneous improvements in ecological and economic metrics (e.g., 1.8% carbon sequestration vs. 1.2% in MOPSO [34]).
Computational efficiency: Reduces convergence time by 30%–40% compared to PSO and ACO.
Prediction accuracy: Delivers higher Kappa coefficients (>0.83) and FOM indices in arid region simulations.
These advancements provide a replicable paradigm for optimizing protective forests in similar ecologically vulnerable areas. Future research could explore hybrid algorithms (e.g., NSGA-III for more objectives) or integrate real-time climate data to enhance dynamic adaptability.

6. Conclusions

(1)
In terms of quantity structure optimization, the optimized distribution scheme of protective forests has shown improvements in GDP, carbon sequestration, and food production compared to the pre-optimized scenario, while soil erosion has decreased. This indicates that the optimized quantity structure scheme has enhanced both ecological benefits and food security objectives.
(2)
According to the land suitability probability distribution map for protective forests, areas with high suitability for protective forests are mainly located along the banks of the Aksu and Tarim Rivers, around farmlands, and on the northern edge of the Taklamakan Desert. In land planning, priority should be given to planting protective forests in areas with high suitability to maximize ecological benefits.
(3)
The spatial optimization results show that the FOM index is 0.1339, the Kappa coefficient is 0.8349, and the overall accuracy is 90.73%, confirming the high simulation accuracy of integrating the NSGA-II and FLUS model in predicting the spatial changes of protective forests. After spatial optimization, the distribution of protective forests along the edge of the Taklamakan Desert increased, effectively enhancing their ability to resist wind and sand. Additionally, the construction of the farmland forest network has been improved.

Author Contributions

Conceptualization, M.D. and X.Y.; methodology, M.D. and X.Y.; software, M.D.; validation, M.D. and X.Y.; formal analysis, M.D.; investigation, M.D., P.L. and S.P.; resources, M.D.; data curation, M.D.; writing—original draft preparation, M.D. and X.Y.; writing—review and editing, M.D.; visualization, M.D.; supervision, M.D.; project administration, M.D.; funding acquisition, M.D. All authors have read and agreed to the published version of the manuscript.

Funding

This research was supported by the Science and Technology Project of the Xinjiang Production and Construction Corps (Bingtuan), under the project titled “Research on Spatial Optimization Methods for Multi-functional Ecological Protection Forests in Southern Xinjiang” (Approval Number: S2022AB6909; Task Order Number: 2023CB008-22). The project was undertaken by Shihezi University from 10 May 2023, to 10 May 2026.

Data Availability Statement

The author declares that the data supporting this research result can be obtained from the paper, Geospatial Data Cloud, and the Remote Sensing Information Processing Research Institute.

Acknowledgments

This research was supported by Shihezi University under grant number 2023CB008-22. We are grateful for their financial support.

Conflicts of Interest

The authors declare no conflicts of interest.

References

  1. Zhu, J.; Song, L. A Review of Ecological Mechanisms for Management Practices of Protective Forests. J. For. Res. 2021, 32, 435–448. [Google Scholar] [CrossRef]
  2. West, C.; Some, A.; Nebié, E. Famines Are a Thing of the Past: Food Security Trends in Northern Burkina Faso. Hum. Organ. 2014, 73, 340–350. [Google Scholar] [CrossRef]
  3. Tian, M.; Wang, X.; Liu, F.; Hu, Q.; Qiao, Y.; Wang, Q. Spatial-Temporal Variability and Influence Factors of Cd in Soils of Guangxi, China. PLoS ONE 2023, 18, e0279980. [Google Scholar] [CrossRef]
  4. Yang, W.; Wang, Y.; Wang, S.; Webb, A.A.; Yu, P.; Liu, X.; Zhang, X. Spatial Distribution of Qinghai Spruce Forests and the Thresholds of Influencing Factors in a Small Catchment, Qilian Mountains, Northwest China. Sci. Rep. 2017, 7, 5561. [Google Scholar] [CrossRef]
  5. Su, S.; Deng, N.; Ma, F.; Song, Q.; Tian, Y. Crown and Diameter Structure of Pure Pinus massoniana Lamb. Forest in Hunan Province, China. Open Life Sci. 2023, 8, 20220574. [Google Scholar] [CrossRef]
  6. Kangas, A.; Nurmi, M.; Rasinmäki, J. From a Strategic to a Tactical Forest Management Plan Using a Hierarchic Optimization Approach. Scand. J. For. Res. 2014, 29 (Suppl. S1), 154–165. [Google Scholar]
  7. Van Herzele, A.; Collins, K.; Tyrväinen, L. Forest Structure Optimization Using Evolutionary Programming and Landscape Ecology Metrics. Eur. J. Oper. Res. 2005, 164, 423–439. [Google Scholar] [CrossRef]
  8. Liu, Y.; Su, C.; Xu, X. Study on the optimization of land use allocation in the Taiyuan High-tech Zone. China Land Sci. 2013, 10, 9. [Google Scholar] [CrossRef]
  9. United Nations. Sustainable Development Goal 15: Life on Land. 2015. Available online: https://sdgs.un.org/goals/goal15 (accessed on 1 July 2024).
  10. Li, L.; Chen, Z.; Wang, S. Optimization of Spatial Land Use Patterns with Low Carbon Target: A Case Study of Sanmenxia, China. Int. J. Environ. Res. Public Health 2022, 19, 14178. [Google Scholar] [CrossRef]
  11. Cao, K.; Huang, B.; Wang, S.; Lin, H. Sustainable Land Use Optimization Using Boundary-Based Fast Genetic Algorithm. Comput. Environ. Urban Syst. 2012, 36, 257–269. [Google Scholar] [CrossRef]
  12. Liu, Y.; Yuan, M.; He, J.; Liu, Y. Regional Land-Use Allocation with a Spatially Explicit Genetic Algorithm. Landsc. Ecol. Eng. 2015, 11, 209–219. [Google Scholar] [CrossRef]
  13. Zhong, X. Application of Simulated Annealing Algorithm in the Design of Land Planning and Allocation System. In Proceedings of the International Conference on Multi-Modal Information Analytics, Virtual Event, 15–17 April 2022; Springer: Cham, Switzerland, 2022; pp. 447–454. [Google Scholar]
  14. Yi, Y.; Zhang, C.; Zhu, J.; Zhang, Y.; Sun, H.; Kang, H. Spatio-Temporal Evolution, Prediction and Optimization of LUCC Based on CA-Markov and InVEST Models: A Case Study of Mentougou District, Beijing. Int. J. Environ. Res. Public Health 2022, 19, 2432. [Google Scholar] [CrossRef] [PubMed]
  15. Feng, H.; Lei, X.; Yu, G.; Changchun, Z. Spatio-Temporal Evolution and Trend Prediction of Urban Ecosystem Service Value Based on CLUE-S and GM (1, 1) Compound Model. Environ. Monit. Assess. 2023, 195, 1282. [Google Scholar] [CrossRef] [PubMed]
  16. Zhang, M.; Huang, X.; Chuai, X.; Yang, H.; Lai, L.; Tan, J. Impact of Land Use Type Conversion on Carbon Storage in Terrestrial Ecosystems of China: A Spatial-Temporal Perspective. Sci. Rep. 2015, 5, 10233. [Google Scholar] [CrossRef] [PubMed]
  17. Liu, Y.; Liu, D.; Liu, Y.; He, J.; Jiao, L.; Chen, Y.; Hong, X. Rural land use spatial allocation in the semiarid loess hilly area in China: Using a Particle Swarm Optimization model equipped with multi-objective optimization techniques. Sci. China Earth Sci. 2012, 55, 1166–1177. [Google Scholar] [CrossRef]
  18. López-Fando, C.; Pardo, M.T. Soil Carbon Storage and Stratification Under Different Tillage Systems in a Semi-Arid Region. Soil Tillage Res. 2011, 111, 224–230. [Google Scholar] [CrossRef]
  19. Mu, Y. Study on Spatial Optimization of Land Use Allocation in Ningqiang County Based on Ant Colony Optimization Algorithm. Master’s Thesis, Chang’an University, Xi’an, China, 2018. (In Chinese). [Google Scholar]
  20. Gong, X.; Li, Y.; Wang, X.; Zhang, Z.; Lian, J.; Ma, L.; Cao, W. Quantitative Assessment of the Contributions of Climate Change and Human Activities on Vegetation Degradation and Restoration in Typical Ecologically Fragile Areas of China. Ecol. Indic. 2022, 144, 109536. [Google Scholar] [CrossRef]
  21. He, S.; Wang, D.; Zhao, P.; Li, Y.; Lan, H.; Chen, W.; Chen, X. Quantification of Basin-Scale Multiple Ecosystem Services in Ecologically Fragile Areas. Catena 2021, 202, 105247. [Google Scholar] [CrossRef]
  22. Wiesmeier, M.; Munro, S.; Barthold, F.; Steffens, M.; Schad, P.; Kögel-Knabner, I. Carbon storage capacity of semi-arid grassland soils and sequestration potentials in northern China. Glob. Change Biol. 2015, 21, 3836–3845. [Google Scholar] [CrossRef]
  23. Feng, D.; Bao, W.; Fu, M.; Zhang, M.; Sun, Y. Current and future land use characters of a national central city in eco-fragile region—A case study in Xi’an City based on FLUS model. Land 2021, 10, 286. [Google Scholar] [CrossRef]
  24. Wang, L.; Du, X.; Wang, R.; Yang, Y.; Hu, Y.; Hou, Z. Optimization of the planting structure in the upstream region of Baiyangdian Lake based on the non-dominated sorting genetic algorithm (NSGA-II). Chin. J. Eco Agric. 2021, 29, 1370–1383. [Google Scholar]
  25. Long, W.; Lu, H.; Qin, Y.; Sun, C.; Jiang, L.; Zhao, J. Multi-objective land use optimization based on low-carbon development using NSGA-II. In Proceedings of the 2013 21st International Conference Geoinformatics, Kaifeng, China, 20–22 June 2013; pp. 1–5. [Google Scholar]
  26. Hongyu, C.; Yuxiang, D.; Chensong, L. Research on optimization method for low impact development (LID) controls distribution of greenspace in shallow mountain based on D8 and NSGA-II algorithm. J. Beijing For. Univ. 2022, 44, 116–126. [Google Scholar]
  27. Datta, D.; Deb, K.; Fonseca, C.M.; Lobo, F.; Condado, P. Multi-objective evolutionary algorithm for land-use management problem. Int. J. Comput. Intell. Res. 2007, 3, 371–384. Available online: https://www.researchgate.net/publication/215661096_Multi-Objective_Evolutionary_Algorithm_for_Land-Use_Management_Problem (accessed on 19 February 2025).
  28. Cao, K.; Batty, M.; Huang, B.; Liu, Y.; Yu, L.; Chen, J. Spatial multi-objective land use optimization: Extensions to the non-dominated sorting genetic algorithm-II. Int. J. Geogr. Inf. Sci. 2011, 25, 1949–1969. [Google Scholar] [CrossRef]
  29. Wang, Z.; Gao, Y.; Wang, X.; Lin, Q.; Li, L. A new approach to land use optimization and simulation considering urban development sustainability: A case study of Bortala, China. Sustain. Cities Soc. 2022, 87, 104135. [Google Scholar] [CrossRef]
  30. Zhang, Y.; Li, X.; Wang, H.; Liu, Y. PSO-CA model for land use simulation in arid oasis regions. Ecol. Inform. 2022, 68, 101552. [Google Scholar] [CrossRef]
  31. Wang, W.; Jiao, L.; Jia, Q.; Liu, J.; Mao, W.; Xu, Z.; Li, W. Land use optimization modelling with ecological priority perspective for large-scale spatial planning. Sustain. Cities Soc. 2021, 65, 102575. [Google Scholar] [CrossRef]
  32. Cong, R.; Qi, J.; Wu, C.; Wang, M.; Guo, J. Multi-UAVs Cooperative Detection Based on Improved NSGA-II Algorithm. In Proceedings of the 2020 39th Chinese Control Conference (CCC), Shenyang, China, 27–29 July 2020; pp. 1524–1529. [Google Scholar]
  33. Marotz, G.A.; Sorenson, C.J. Depletion of a Great Plains resource: The case of shelter-belts. Environ. Conserv. 1979, 6, 215–224. [Google Scholar] [CrossRef]
  34. Deb, K.; Pratap, A.; Agarwal, S.; Meyarivan, T. A fast and elitist multiobjective genetic algorithm: NSGA-II. IEEE Trans. Evol. Comput. 2002, 6, 182–197. [Google Scholar] [CrossRef]
Figure 1. Location map of the research area. This map is based on the standard map with the approval number GS (2019) 1822 downloaded from the Ministry of Natural Resources Standard Map Service website.
Forests 16 00452 g001
Figure 2. The technical roadmap.
Forests 16 00452 g002
Figure 3. NSGA-II algorithm flow.
Forests 16 00452 g003
Figure 4. Probability distribution map of suitability of protective forests in Alaer city.
Forests 16 00452 g004
Figure 5. Spatial distribution map of protective forests before and after optimization. (a) represents the spatial distribution map of protective forests before optimization; (b) represents the spatial distribution map of protective forests after optimization.
Forests 16 00452 g005
Table 1. Data sources and related information.
Data UsageData NameData TypeTimeResolutionData Sources
Land classifyLand use dataRaster2018, 202330 mCLCD Dataset
(zenodo.org)
Driving FactorsDEM dataRaster202330 mGeospatial Data Cloud
(www.gscloud.cn)
Slope data2023
Aspect data2023
NDVI data2023China Resource and Environmental Science and Data Platform
(www.resdc.cn/)
Carbon storage data2023
Soil erosion data2023
Road distribution data2022
Population distribution data2022
Basic Geographic DataAdministrative boundaryVector2019/Standard Map Service Website of the Ministry of Natural Resources
(bzdt.ch.mnr.gov.cn)
Table 2. Ecological benefit weights of different land use types.
Land Use TypeWeight of Soil Erosion Weight of Carbon SequestrationWeight of Water Production
Crop Land−0.04460.13940.01899
Forest Land−0.02680.23070.00592
Waters0.00000.16390.8838
Construction Land0.00000.14750.0000
Undeveloped Land−0.89290.13880.0000
Table 3. Pareto-optimal solution set.
PlanCrop Land
(x1)
Forest Land
(x2)
Construction
Land (x3)
Waters (x4)Undeveloped
Land (x5)
Plan A3622.96369.71429.66253.391247.58
Plan B3616.73342.011430.35254.781279.42
Plan C3628.5371.781430.34254.771237.9
Plan D3628.49355.161439.35234.011266.28
Plan E3609.11369.71439.35254.081251.05
Plan F3593.19362.161428.28231.931307.81
Plan G3614.65342.71441.43252.71271.81
Base Period3593.93339.091428.2255.621306.45
Table 4. Optimization results of quantity structure.
PlanGDP/108 YuanCarbon Sequestration/tWater Yield/m3Soil Erosion/(t·km−2·a−1)Grain Yield/104 kg
Plan A750.36559,896,349.171907.60−13,240.20257,230.16
Plan B751.64555,041,155.491911.73−13,522.52256,787.83
Plan C750.76563,223,081.781914.25−13,154.29257,623.50
Plan D753.19558,498,133.611911.93−13,410.71257,622.79
Plan E753.09558,966,567.981907.85−13,265.75256,246.81
Plan F750.39557,571,286.281912.99−13,726.36255,296.49
Plan G754.15555,033,205.261913.60−13,451.77256,640.15
Base Period747.36553,153,193.261906.63−13,759.83255,169.03
Table 5. Conversion probability table for different land types.
Type/Conversion ProbabilityCrop LandForest LandConstruction
Land
WatersUndeveloped
Land
Crop Land0.9387730.0091550.0503170.0007780.000978
Forest Land0.0293160.9119070.0410900.0070250.010662
Construction
Land
0.0573260.0280600.848210.0026640.063735
Waters0.0202170.0611140.0290440.7777250.111900
Undeveloped
Land
0.0019770.0090780.1385570.0016150.848772
Disclaimer/Publisher’s Note: The statements, opinions and data contained in all publications are solely those of the individual author(s) and contributor(s) and not of MDPI and/or the editor(s). MDPI and/or the editor(s) disclaim responsibility for any injury to people or property resulting from any ideas, methods, instructions or products referred to in the content.

