Article

A Direction-Adaptive DBSCAN-Based Method for Denoising ICESat-2 Photon Point Clouds in Forested Environments

1
College of Forestry, Beijing Forestry University, Beijing 100083, China
2
Beijing Key Laboratory of Precision Forestry, Beijing Forestry University, Beijing 100083, China
3
National Engineering Research Center for Geoinformatics, Aerospace Information Research Institute, Chinese Academy of Sciences, Beijing 100101, China
4
Institute of Plateau Biology of Xizang Autonomous Region, Lhasa 850001, China
*
Authors to whom correspondence should be addressed.
Forests 2025, 16(3), 524; https://doi.org/10.3390/f16030524
Submission received: 13 February 2025 / Revised: 2 March 2025 / Accepted: 14 March 2025 / Published: 16 March 2025
(This article belongs to the Section Forest Inventory, Modeling and Remote Sensing)

Abstract

:
With the launch of the ICESat-2 satellite, global-scale forest parameter monitoring has entered a new phase. However, the background noise in ICESat-2 lidar data significantly impairs the accuracy of signal photon extraction. This study introduces a direction-adaptive DBSCAN method for denoising ICESat-2 photon point clouds, integrating elevation histogram-based coarse denoising with adaptive clustering for fine denoising. The method is applied to data from the Gongbella River Nature Reserve. An innovative aspect of this approach is the introduction of elliptical tilt angle adaptation, which dynamically adjusts the elliptical orientation of the photon point cloud to determine the optimal tilt angle, thus optimizing the denoising effect and reducing computational and memory demands. The direction-adaptive DBSCAN algorithm improves denoising accuracy by dynamically adjusting the neighborhood radius based on the elliptic tilt angle and the distribution of the point cloud. Additionally, the density threshold selection is optimized using the Otsu method, enhancing the accuracy of distinguishing noise photons from signal photons. The method was validated using data from the Gongbella River Nature Reserve, showing significant improvements in denoising accuracy. Compared to existing methods, recall (R) increased by 6.91%, precision (P) improved by 8.82%, and both the F1-score and accuracy rose by 9.52%. The photon point cloud denoising algorithm demonstrated substantial accuracy improvements across multiple data strips, making it particularly effective for processing complex data from ICESat-2, with broad application potential. Both quantitative and qualitative analyses confirm that the algorithm outperforms traditional methods in signal-to-noise ratio and denoising performance, providing reliable technical support for extracting photon point cloud elevation data from forest surfaces and canopies.

1. Introduction

Forests play a critical role in the terrestrial carbon cycle by acting as major carbon sinks, storing significant amounts of carbon in their biomass. This stored carbon is eventually released back into the atmosphere through processes such as respiration, decomposition, or disturbance. Additionally, forests provide a wide array of ecosystem services [1]. Monitoring fluctuations in carbon stocks is essential, as such changes can either mitigate or exacerbate climate change. Accurate characterization of forest productivity, biomass, and structure is pivotal for understanding ecosystem responses to climate change and anthropogenic disturbances, with precise quantification of key parameters, such as forest canopy height, being particularly vital [2]. However, current approaches to denoising ICESat-2 photon point cloud data face considerable challenges, especially when dealing with high background noise, low signal-to-noise ratios, and complex terrain features. These challenges significantly hinder the precise extraction of signal photons, which is crucial for accurate canopy height and biomass estimation. Enhancing the accuracy of forest canopy height estimation can substantially improve assessments of aboveground biomass and wood volume, leading to more effective monitoring of forest degradation and more reliable evaluations of forest restoration efforts [2,3]. Although remote sensing methods can extensively detect forests, they still face limitations in capturing the vertical structure of forest vegetation. The National Forest Inventory Program (NFIP) regularly collects canopy height data through field surveys and, to a limited extent, incorporates airborne LiDAR data to support remote sensing monitoring [4]. Despite airborne LiDAR’s proven effectiveness in forest canopy height estimation, its regional-scale application is constrained by high costs and inefficient data collection methods. Nevertheless, the growing demand for large-scale forest parameter characterization, particularly for reducing uncertainties in forest carbon estimates, has prompted the development of improved regional products, such as biomass estimates, canopy height models, and land cover maps [5]. Satellite-borne LiDAR, with its rapid data acquisition speed and extensive coverage, can extract large volumes of forest vegetation information. This capability makes it a powerful tool for large-scale forest ecosystem monitoring and allows for the inversion of parameters at the individual tree level, establishing it as a crucial technology in the field of forestry remote sensing and detection [6].
ICESat-2 (The Ice, Cloud, and Land Elevation Satellite-2), launched on 15 September 2018, is equipped with the Advanced Topographic Laser Altimeter System (ATLAS), a micro-pulse photon-counting lidar system. Unlike the full-waveform Geoscience Laser Altimeter System (GLAS) used on the original ICESat, photon-counting lidar detects individual photons rather than recording the entire waveform. This approach enhances sensitivity and enables higher-resolution data acquisition with smaller spot sizes. However, it also increases susceptibility to background noise from atmospheric scattering, solar radiation, and instrument limitations, making it more challenging to distinguish signal photons from noise, particularly under low signal-to-noise ratio conditions [7,8,9]. Therefore, effective denoising strategies are essential for accurate canopy height estimation and other applications of ICESat-2 data.
To reduce background noise in ICESat-2 photon point clouds, various denoising methods have been proposed. These methods can generally be classified into three categories: those based on processing local distance statistical parameters [10,11,12], density-based spatial clustering [13], and raster image-based processing [14]. However, raster image-based approaches often lead to poor accuracy due to the rasterization of the point cloud. As a result, recent research has primarily focused on the latter two methods. Wang et al. [15] proposed a density-based clustering algorithm for adaptive denoising of photon counting point cloud data. By modifying the shape of the search region and verifying typical terrain features, the algorithm adapts to various terrains, significantly enhancing denoising effectiveness. However, the method still faces challenges in dealing with high background noise and low signal-to-noise ratios, requiring further optimization. Zhang et al. [16] introduced a multi-feature adaptive denoising algorithm for single-photon point clouds, addressing difficulties in extracting signals from regions with uneven background noise and steep slopes. The algorithm employs a parallelogram-shaped filter kernel, which closely matches the characteristics of single-photon point cloud data and adjusts adaptively based on slope features. The results demonstrate its excellent performance in areas with inhomogeneous background noise and steep slopes. Liu et al. [17] proposed a multilevel adaptive denoising algorithm based on photon spatial density (MLANF). The method first removes random noise photons through coarse denoising and then applies detailed denoising using an adaptive elliptical search model to enhance the DBSCAN algorithm. The results show strong denoising performance, accurately extracting surfaces across various terrain types. NASA’s official ATL08 data processing algorithm employs the DRAGANN (Differential Regression Gaussian Adaptive Nearest Neighbor) algorithm [18], which treats all photon point clouds as uniform entities. Although this method facilitates fast batch processing of large-scale data, it neglects the continuity of neighboring point clouds, making it difficult to remove noisy photons accurately. He et al. [19] addressed the limitations of existing photon classification algorithms in complex terrain regions by proposing an improved Local Outlier Factor (LOFR) algorithm with a rotating search area. The core innovation of this algorithm lies in adapting to terrain slope variations by rotating the search area, improving photon classification accuracy. The results show that the LOFR algorithm effectively classifies photons, and the terrain elevation estimated using the classified photons is highly consistent with airborne LiDAR data. Kong et al. [20] proposed a machine learning-based denoising method for ICESat-2 data, significantly improving the model’s generalization ability and spatial transferability by developing a photon denoising feature parameter system and employing an automated machine learning algorithm (AutoML). This method demonstrated high accuracy in forest canopy height estimation and offered a novel approach for the large-scale application of ICESat-2 data. Wang et al. [21] introduced a segmented photon denoising method, which showed substantial improvements in ICESat-2 data processing. By combining segmented processing, a local eigenparameter system, and automated machine learning algorithms, the method enhances denoising accuracy and improves the model’s generalization and adaptability. These advancements provide a new approach for the application of ICESat-2 data in forest monitoring and topographic mapping. As discussed earlier, different denoising methods for ICESat-2 photon point cloud processing each have unique advantages and limitations. Table 1 summarizes the key features, advantages, and disadvantages of these methods, offering a comprehensive comparison.
In existing research, multiple studies have demonstrated the potential of ICESat-2 for forest monitoring and biomass estimation. Li et al. [22] proposed a machine learning workflow combining ICESat-2 and Sentinel satellite data, successfully mapping the spatial pattern of forest canopy height (H-canopy) in northeastern China. Their work significantly contributed to the estimation of forest carbon stocks. By comparing with airborne LiDAR data, ICESat-2’s canopy height estimates showed high accuracy, proving the potential of ICESat-2 for forest resource monitoring. Narine et al. [23] assessed ICESat-2-derived canopy cover data and proposed a framework for generating a 30-m resolution canopy cover product. The study demonstrated that ICESat-2 data could effectively estimate forest canopy cover, with good correlation (r values ranging from 0.57 to 0.78) when compared to airborne LiDAR and the 2016 National Land Cover Database (NLCD). Further, the study used Random Forest (RF) models to spatially map canopy cover, providing valuable theoretical support for subsequent forest aboveground biomass (AGB) estimation. Additionally, Narine, et al. [24] extended the application of ICESat-2 for estimating AGB. They used ICESat-2’s ATL03 data, combined with Landsat imagery and land cover data, to develop an AGB prediction model based on Random Forest (RF). The final model achieved a good estimation accuracy in the Sam Houston National Forest (SHNF), with an R2 of 0.62 and a root mean square error (RMSE) of 24.63 Mg/ha, further validating the potential of ICESat-2 in AGB estimation. Wang et al. [21] proposed a segmented photon denoising method for ICESat-2 photon data, which effectively improved the application of ICESat-2 data in complex forest environments. The study showed that denoised ICESat-2 data could more accurately estimate forest canopy height, and the method demonstrated good adaptability for denoising data under varying photon count rates and terrain conditions.
In summary, these findings indicate that with appropriate denoising algorithms, ICESat-2 can provide reliable forest monitoring data, especially in estimating forest canopy height and aboveground biomass, showing significant application potential.
Current research on background noise removal for ICESat-2 primarily focuses on enhancing the efficiency and accuracy of traditional algorithms. Despite the proposal of various methods, several challenges remain unresolved. Traditional algorithms often suffer from limited computational power and suboptimal denoising performance, particularly in scenarios with high background noise and low signal-to-noise ratios. Moreover, these methods struggle to adapt to varying terrain features, making noise rejection and ground information retention difficult. Their applicability to weak-beam photon point cloud data is also constrained. Furthermore, traditional algorithms tend to be tailored to specific types or levels of noise, often failing to account for multiple noise types and complex noise scenarios. The ATL03 data from ICESat-2 are influenced by a range of noise sources, including atmospheric disturbances, ground occlusions, and instrumental errors, necessitating a more robust denoising approach capable of handling such complexities. Additionally, many traditional algorithms rely on manually set parameters or thresholds for noise identification and removal. The uncertainty and subjectivity involved in selecting these parameters can lead to inconsistent performance under varying terrain and climatic conditions. Given that ATL03 data encompass diverse terrain and climate types, the stability and generalizability of traditional algorithms may be compromised. Therefore, further refinement and optimization of denoising techniques are essential to improve their efficacy and applicability in processing ATL03 data.
In conclusion, this paper presents a photon point cloud denoising strategy based on the direction-adaptive DBSCAN algorithm to address denoising challenges in diverse noisy environments. The proposed method employs a two-stage process: initial denoising through elevation statistics histograms, followed by fine denoising via direction-adaptive DBSCAN, with the goal of effectively removing noise from raw photon point cloud data acquired by ICESat-2/ATLAS. The study was conducted in an experimental forest within the Gongbella River Nature Reserve, and the denoising performance was assessed using four metrics: F-value, precision (p-value), recall (R-value), and accuracy (Accuracy).
The novelty of this study lies not only in the proposed denoising algorithm but also in its practical applicability to forest monitoring. By effectively denoising the data, the method significantly enhances the quality of photon point clouds, which can indirectly improve the accuracy of forest biomass estimation. Although this study does not directly address biomass estimation, improved data quality facilitates more reliable estimates of forest canopy structure, which is crucial for biomass and carbon stock measurement. Consequently, the denoising method introduced in this paper has significant potential for a wide range of forestry applications, particularly in biomass estimation, carbon stock measurement, and forest inventory.

2. Materials and Methods

2.1. Study Area

The study area for this research is the Gongbella River Nature Reserve, located in Heilongjiang Province, China. Specifically, it is situated in Handaqiao Town, Aihui District, Heihe City, with geographic coordinates ranging from 49°57′ N to 50°15′ N and 126°27′ E to 126°45′ E, covering an area of approximately 479.83 square kilometers. The terrain is diverse, encompassing mountains, hills, and plains, with altitudes ranging from 300 m to 700 m, and an average elevation of around 560 m. The Gongbella River flows through the upper part of the reserve, forming a characteristic forested wetland area. The region experiences a temperate humid continental monsoon climate, with an average annual temperature of approximately −0.5 °C and annual precipitation of 530 mm, concentrated from June to September. These climatic conditions foster the development of forested wetland ecosystems, which are particularly conducive to the growth of mixed coniferous and broadleaf forests, as well as wetland vegetation. The dominant vegetation in the reserve consists of mixed coniferous and broadleaf forests, with common tree species including spruce (Picea asperata), red pine (Pinus koraiensis), and larch (Larix gmelini). Additionally, wetland plants, such as Carex schmidtii and Sium suave, are interspersed within the forest, contributing to a complex canopy structure that significantly influences the reflective properties of LiDAR point cloud data. This reserve represents a specific forest ecosystem type found in temperate northern regions of the world, characterized by a blend of coniferous and broadleaf tree species as well as wetland vegetation. While the ecological conditions may differ from tropical or boreal forest regions, it serves as an important example of mixed temperate forest ecosystems and provides valuable insights into forest dynamics, canopy structure, and biomass estimation in similar forested wetland environments globally.
As illustrated in Figure 1, the overview map of the Gongbella River Nature Reserve shows the location of the study area and the path of the ICESat-2 ATL03 strips, providing a spatial reference for the subsequent canopy height inversion analysis using satellite-borne LiDAR data.

2.2. Study Data

2.2.1. ICESat-2/ATLAS Data

The data utilized in this study are the ATL03 data from ICESat-2/ATLAS, provided by the National Snow and Ice Data Center (NSIDC) and downloaded from (https://search.earthdata.nasa.gov/search) (accessed on 3 September 2024) [25]. ATL03 is global positioning photon data that includes positional information (longitude, latitude, altitude, etc.) for each photon point cloud, categorized by signal, noise, and surface type. However, it is important to acknowledge that the spatial variability of these datasets can be influenced by factors such as terrain complexity, vegetation type, and photon background counting rates. These factors can result in heterogeneous photon data across different geographic regions, leading to variability in signal and noise characteristics. Specifically, in this study, we focus on regions with varying photon background counts, which exhibit different noise levels that may affect the performance of the denoising algorithms. This spatial variability in the ATL03 data is carefully considered when selecting the specific datasets for analysis. The ATL03 data serve as the foundation for generating ATL08, which provides terrestrial vegetation height information [7], and the selected datasets are particularly relevant to the research objectives involving the denoising of photon data under different background conditions.
To comprehensively evaluate the denoising performance under varying noise conditions, this study selects six ATL03 strips based on differences in background photon count rates. These strips include both daytime and nighttime data, representing distinct noise environments. Daytime data typically exhibit higher background noise due to increased solar photon counts, while nighttime data show relatively lower noise levels. By including datasets from both conditions, the study ensures a robust assessment of denoising performance under varying signal-to-noise ratios. The details of the selected datasets are presented in Table 2.
To better visualize the characteristics of the data, this study presents spatial distribution maps of selected raw photon point cloud data. These maps facilitate the analysis of spatial distribution characteristics and highlight the differences between datasets with high and low background noise levels. Specifically, the first set of data (Data 1, Data 2, and Data 3), collected during the daytime, exhibits high background count rates (as shown in Figure 2). This is primarily due to solar radiation and atmospheric scattering effects during the day, where ambient light interference causes more scattered photons to enter the sensor, thereby increasing background noise. The second set of data (Data 4, Data 5, and Data 6), collected at night, shows generally lower background count rates (as shown in Figure 3). At night, the absence of sunlight interference results in reduced background noise, contributing to the lower background count rate. This contrast between the two datasets provides valuable insights for the subsequent evaluation of denoising algorithms.
By comparing the raw point cloud distributions of these two datasets, it becomes evident that the distribution of noise points in the high background count rate data is complex and dense, whereas the low background count rate data exhibits fewer noise points, with a clearer distinction between signal and noise photons. These differences serve as a crucial basis for the subsequent evaluation of the denoising effect.

2.2.2. Validation Data

Due to the absence of direct observational data for validating the accuracy of photon point cloud data, this study predominantly relies on manually labeled photon point cloud classification data for validation. To this end, the PhotonLabeler software (v2.0) [26] was employed to visualize the photon point cloud data as editable scatter plots. Given the substantial volume of ICESat-2/ATLAS data, this study selected photon points with signal confidence ≥ 3 from ATL03, initially labeling them as signal points (labeled as 1), and subsequently filtering out noise points (labeled as 0). Manual annotation was performed during the labeling process using remote sensing imagery from Google Earth. To maintain consistency in the labeling process, a stringent standardized protocol was adhered to, and labeled data were periodically reviewed to ensure accuracy and uniformity. The labeled results were thoroughly examined and cross-checked with remote sensing imagery to ensure uniformity in labeling standards. Ultimately, the labeled photon point cloud data were utilized for validation, providing a reliable basis for assessing the effectiveness of the denoising algorithm.

3. Research Methodology

The direction-adaptive DBSCAN denoising algorithm proposed in this study consists of two stages: coarse denoising based on elevation statistics histograms and fine denoising using the direction-adaptive DBSCAN algorithm. The specific workflow is illustrated in Figure 4.

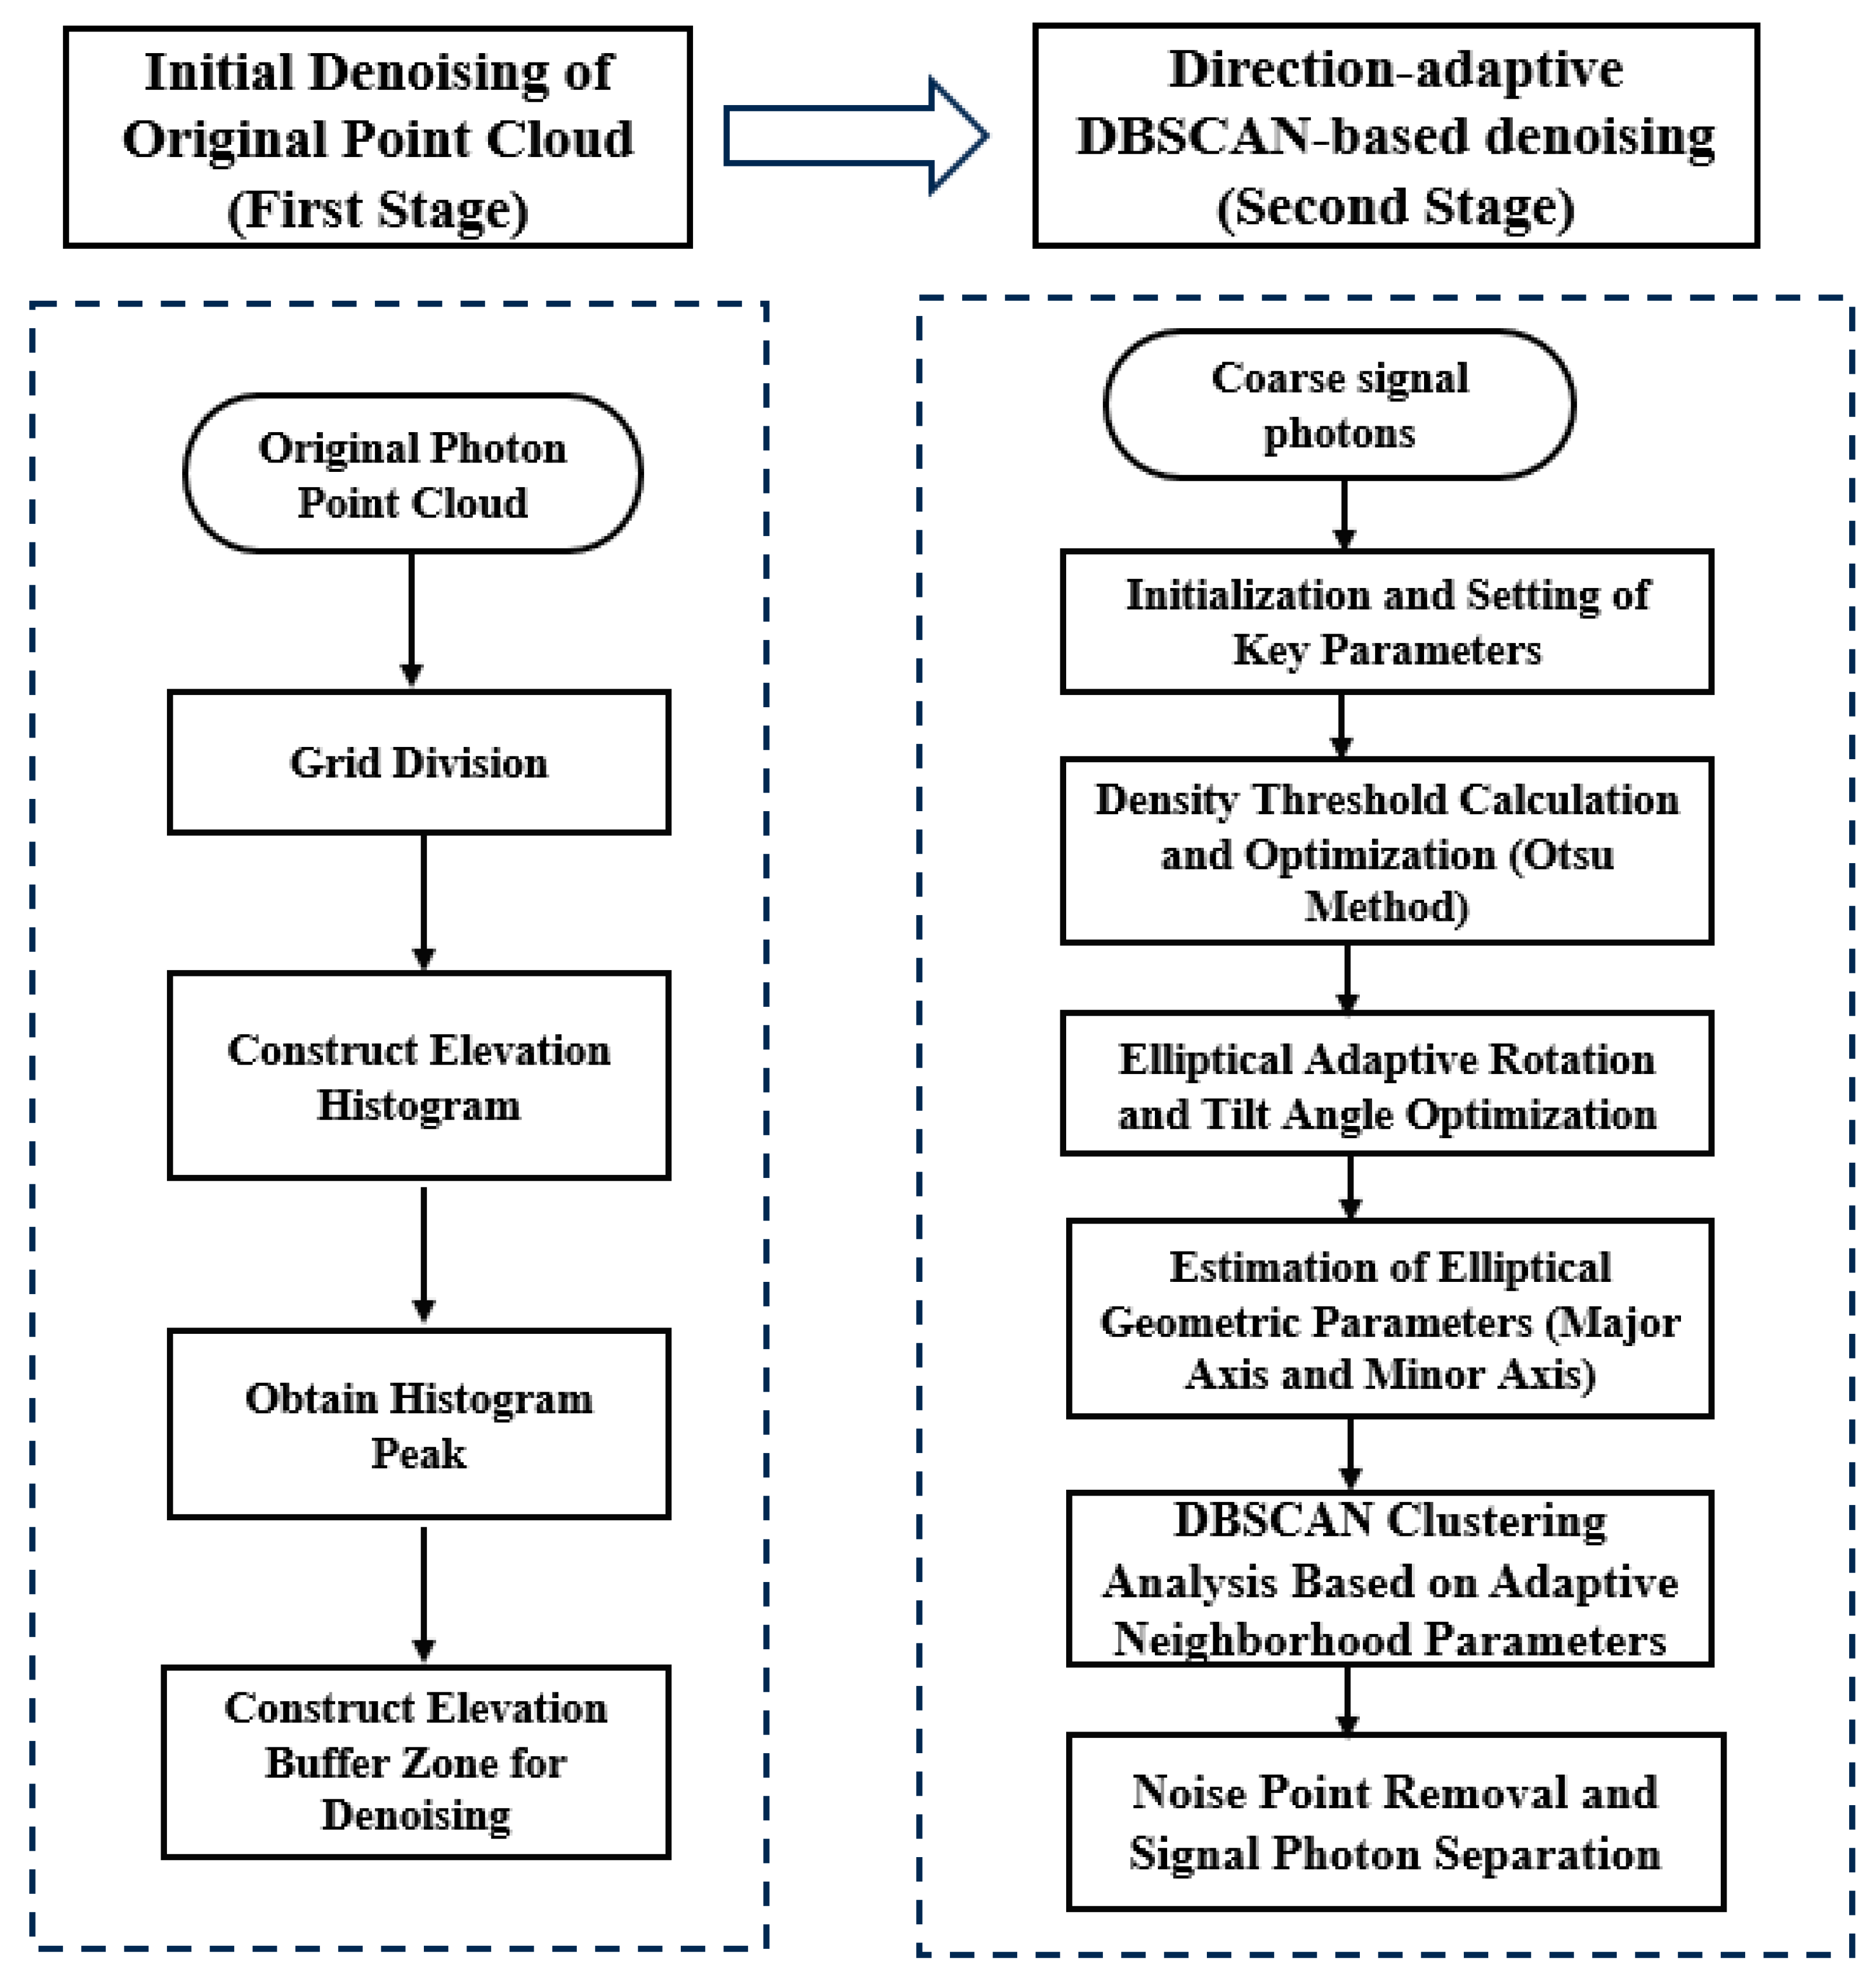
3.1. Primary Coarse Denoising Based on Histograms of Elevation Statistics

Due to the long duration of the ICESat-2/ATLAS original photon point cloud strips and the large study area, the photon point cloud exhibits a significant number of noise and signal points in the two-dimensional profile, which includes track distance and elevation. Direct denoising of the photon point cloud in such cases would result in excessive computational effort, increased redundant work, and inefficiency. Moreover, the large number of noise points would negatively affect the denoising results. Therefore, before fine denoising, a coarse denoising method based on the elevation statistical histogram is employed, taking into account the density differences between signal and noise photons along the elevation axis [6]. This method aims to determine the elevation range of signal photons in the original point cloud, thus reducing the data volume for subsequent denoising tasks. The steps involved are as follows:
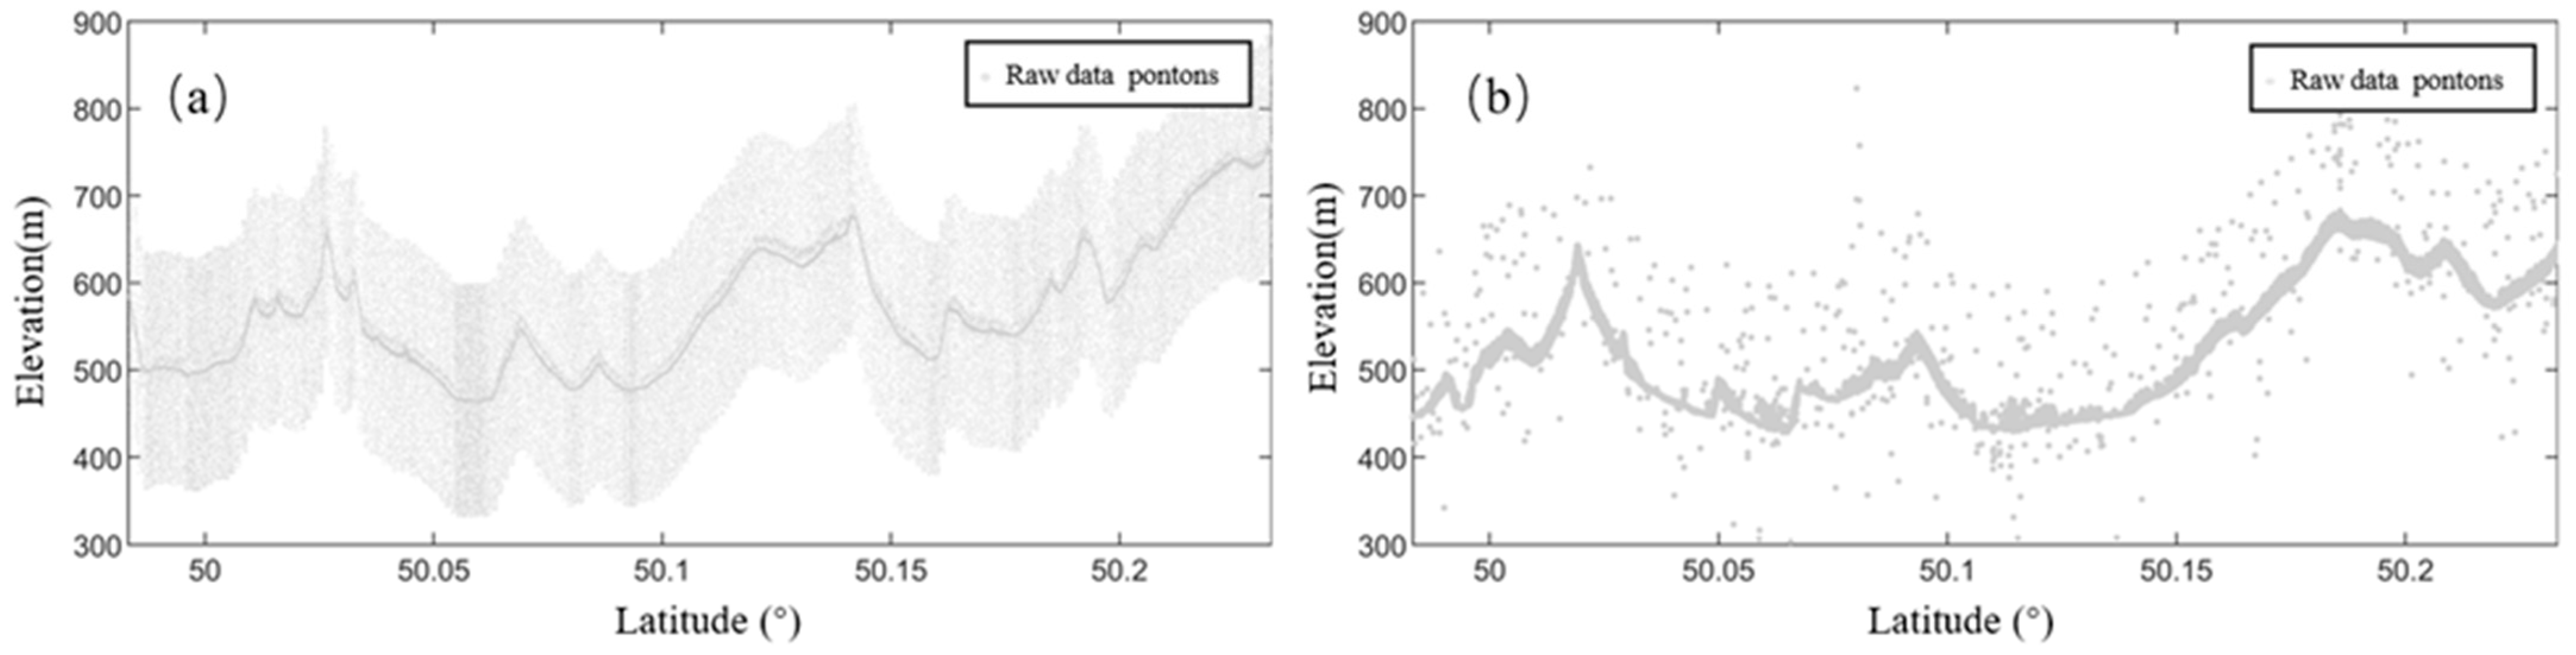
  • Grid Division: The photon point cloud strip is partitioned into grids along the track distance direction, with the grid spacing set to along_track_bin = 300 m. This grid size has been validated through numerous experiments, demonstrating its effectiveness in reducing computational workload and processing time, while maintaining accuracy. The photon point cloud data within each grid is processed independently, thereby reducing computational complexity and ensuring adaptability to varying photon point cloud densities. Figure 5 presents the profile of the original photon point cloud, showing the distribution of signal and noise photons along track distance and elevation, providing the data foundation for the subsequent denoising process.
  • Construct Elevation Statistics Histograms: Within each grid window, elevation statistics are calculated, and elevation histograms are generated. The grid spacing in the elevation direction is set to 100 m (i.e., each 100-m interval forms a data bin). This setting aids in clustering signal photon points while effectively distinguishing noise photons, ensuring high-resolution statistics. The elevation data H = {H1, H2, …, Hn} represent the elevation of each photon point.
    To construct the elevation histogram, the number of photon points n(H) in each elevation interval is counted, and the frequency P(H) of each interval is computed using the following formula:
    P H = n H N
    where N represents the total number of photon points, and n(H) denotes the number of photon points within the elevation interval H.
  • Gaussian Filter Peak Detection: A Gaussian filter is applied to the histogram of elevation statistics for each grid to identify the peak position. Since the signal photon points are typically densely clustered and exhibit a high frequency, the peak position can be considered as the central location of the signal photons. The Gaussian function is expressed as follows:
    G x = 1 2 π σ 2 e x 2 2 σ 2
    where x represents the deviation of the elevation statistics, and σ denotes the standard deviation. The filtered peak position corresponds to the central elevation of the signal photons.
  • Elevation Threshold Setting and Buffer Construction: Based on the peak position Hcenter of the elevation statistics histogram, an elevation threshold, denoted as elevationthreshold, is set, and an elevation buffer is constructed. This threshold is used to determine whether the elevation of a photon point lies within the range of signal photons. In this step, the buffer width is set to ±30 m, meaning that if the difference between the elevation H(i) of a photon point and the central elevation Hcenter of the signal photons is less than or equal to the threshold, the point is classified as a signal photon; otherwise, it is classified as a noise photon. The formula is as follows:
    P oint i = s i g n a l ,   i f H i H center e l e v a t i o n threshold n o i s e ,     i f H i H center > e l e v a t i o n threshold
    where H(i) denotes the elevation of the i-th photon point, Hcenter represents the center elevation of the signal photon, and elevationthreshold is the set elevation threshold.
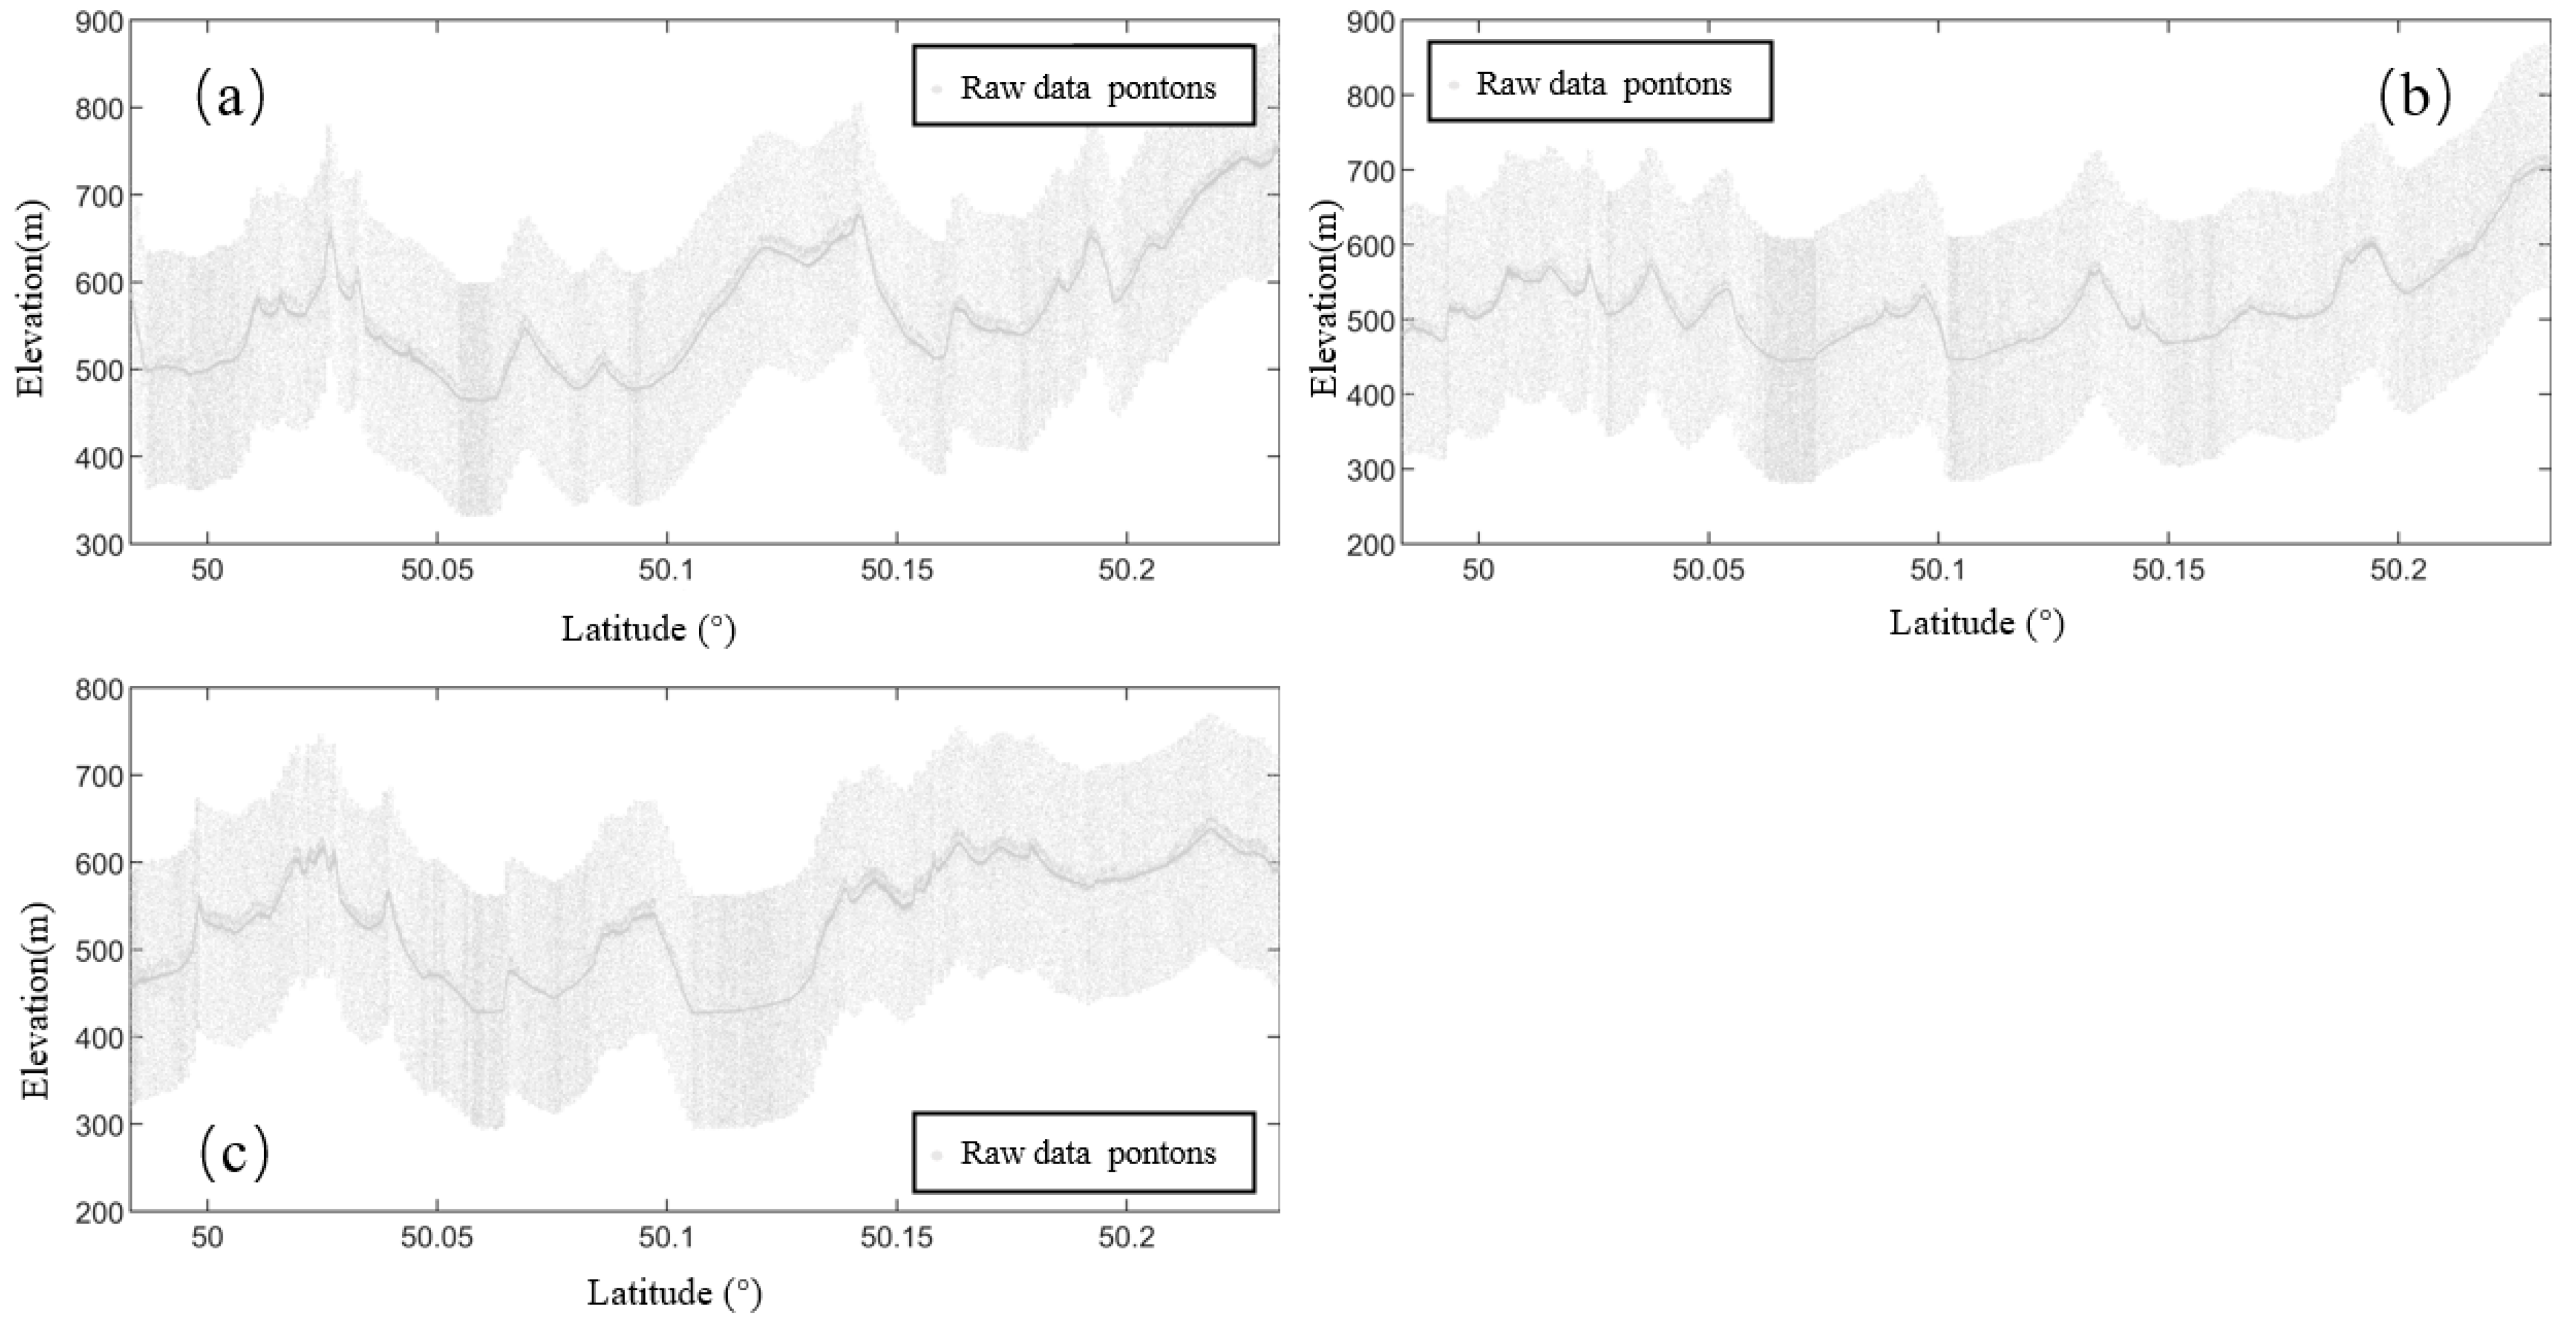
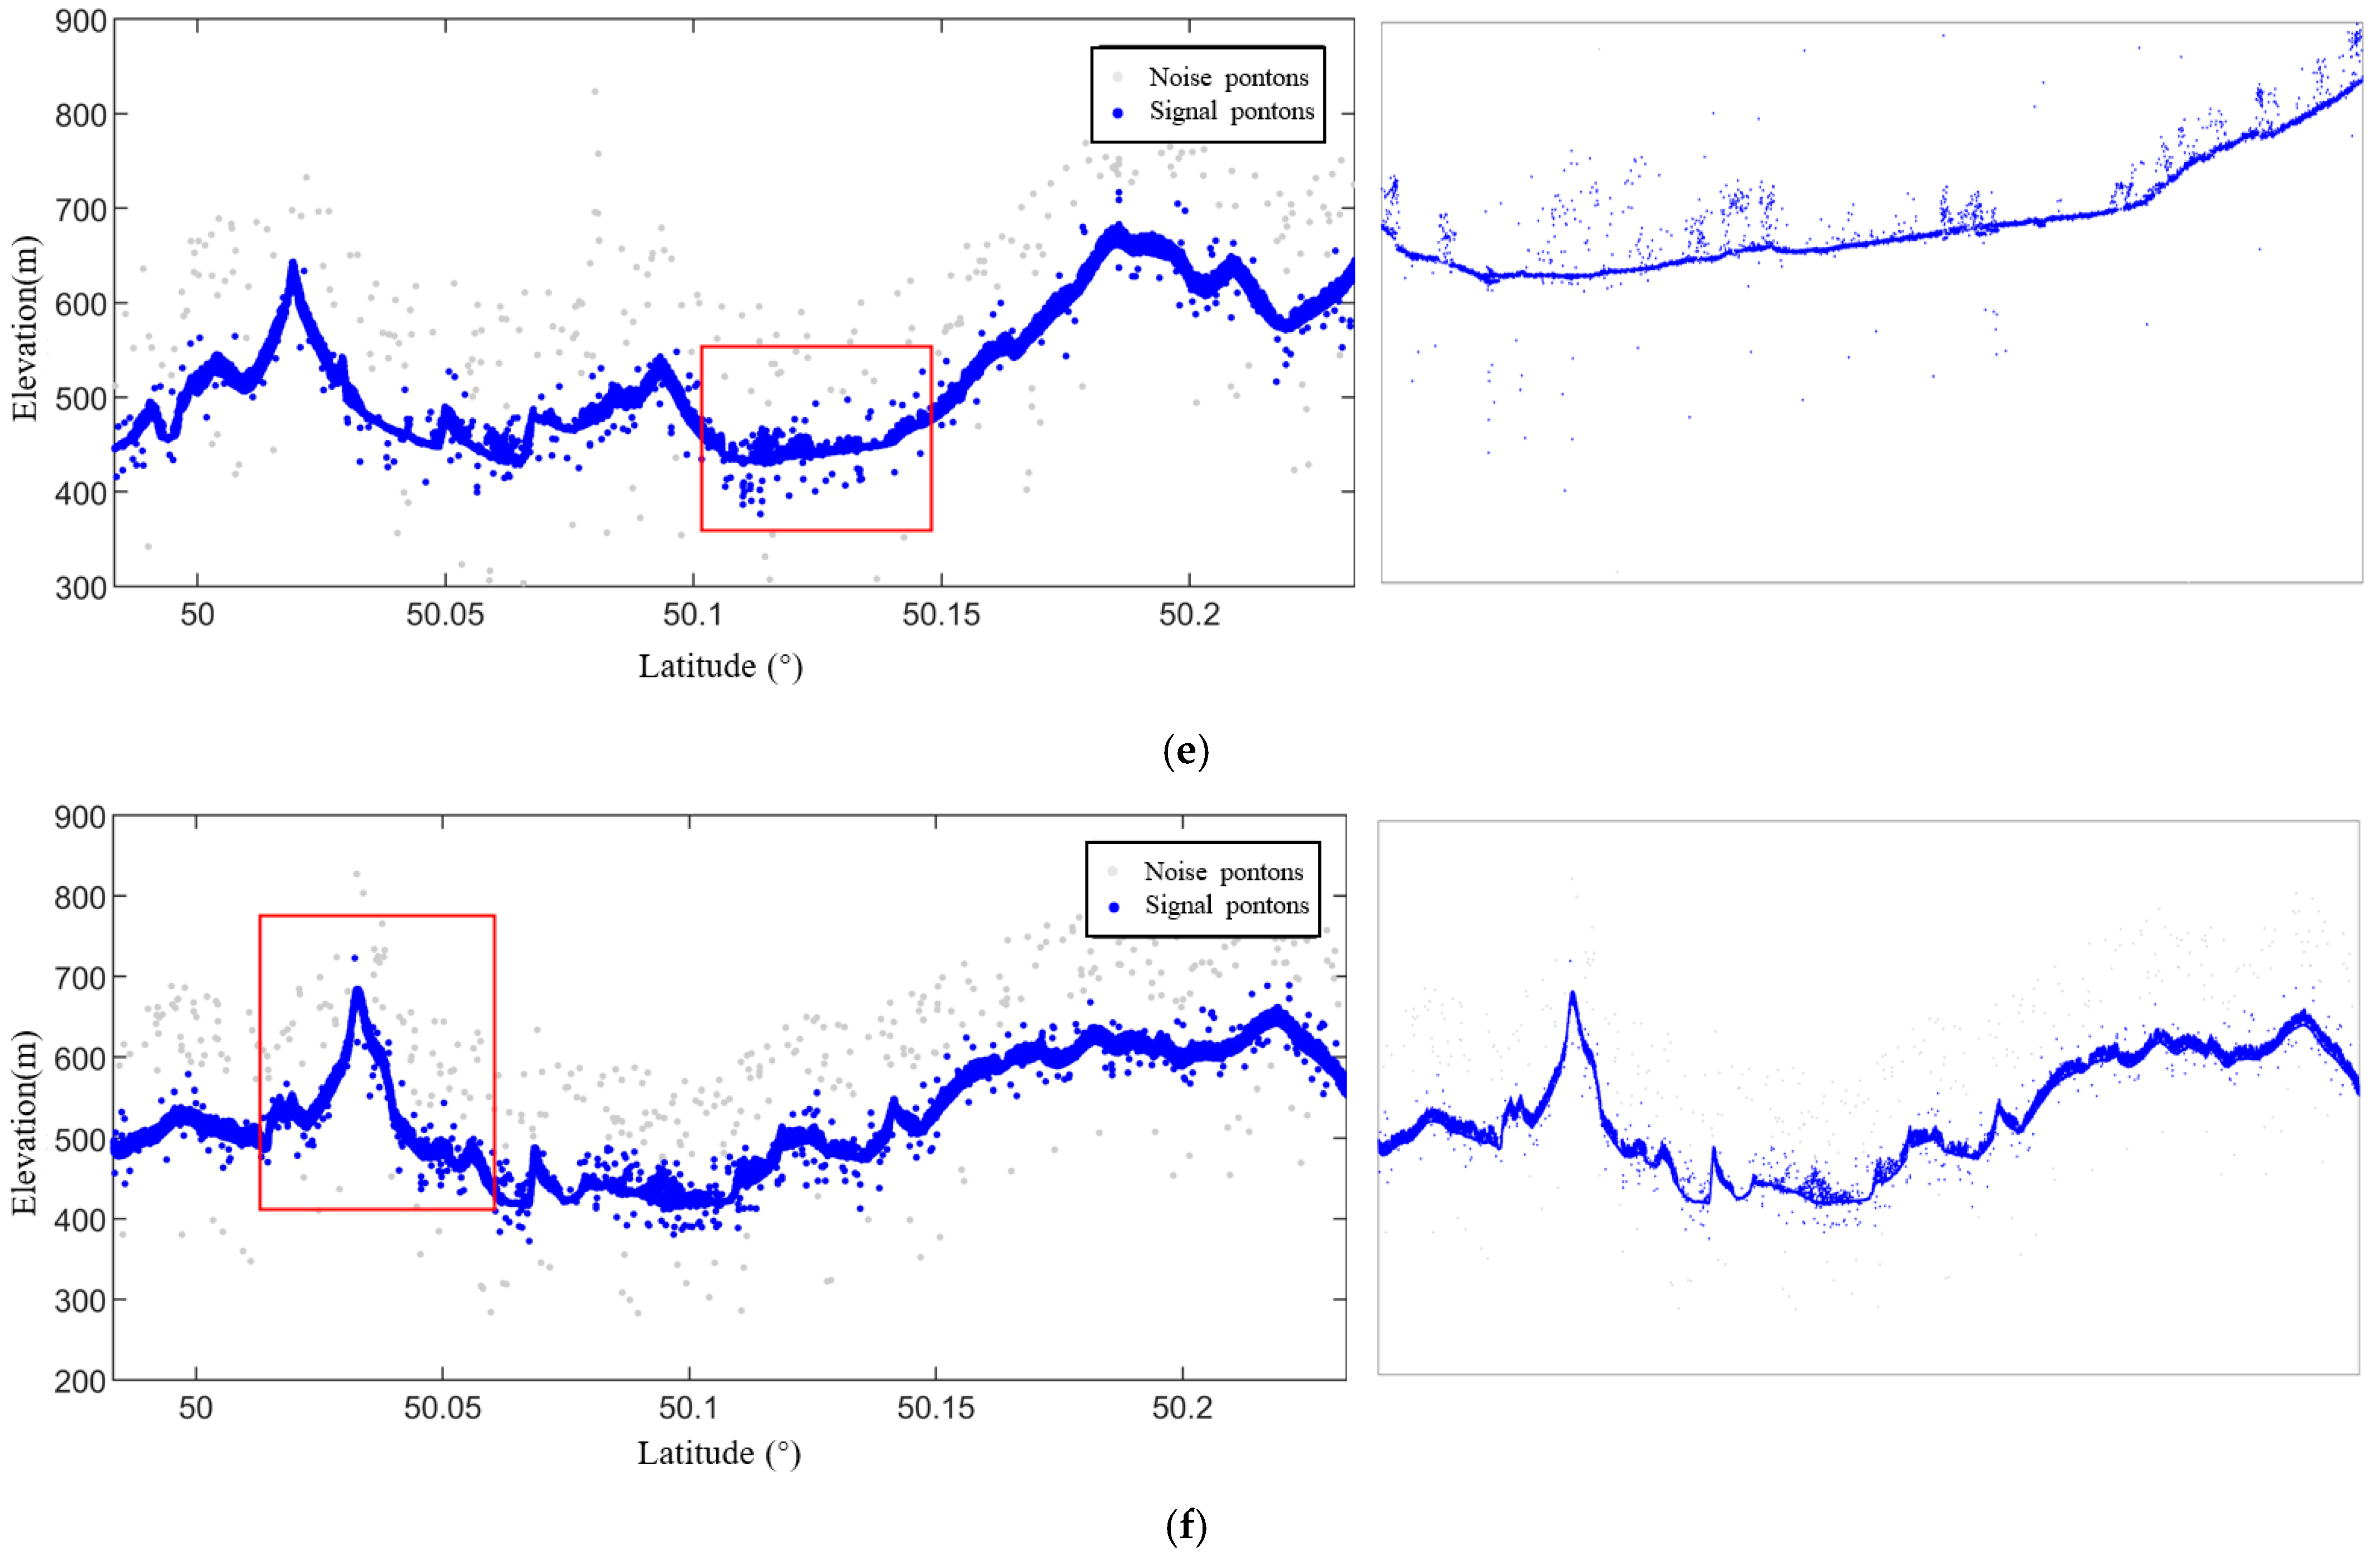
  • Coarse Denoising Processing: Based on the previously defined elevation threshold, photon points that do not meet the specified conditions are eliminated and classified as noise points. After the elimination process, the remaining photon points are identified as signal photons, which provide reliable data for the subsequent fine-denoising step.
    As illustrated in Figure 6, the coarse denoising of the original photon point cloud data, performed using the elevation statistics histogram, successfully distinguishes signal points from noise points, thereby significantly improving the denoising results.

3.2. Direction-Adaptive DBSCAN-Based Quadratic Fine Denoising

After the coarse denoising process, although the signal photons and noise photons are initially distinguished in the elevation direction, the complex spatial distribution of the point cloud still results in some noise points being mixed with the signal photons. To further enhance denoising accuracy, this paper employs the direction-adaptive Density-Based Spatial Clustering of Applications with Noise (DBSCAN) method for fine denoising. This approach offers improved precision in noise point removal and more accurate extraction of signal photons. The traditional DBSCAN method relies on fixed parameters, such as neighborhood distances (Eps) and density thresholds (MinPts), which have limitations when dealing with the spatial distribution heterogeneity of photon point clouds. Specifically, due to the strong local variations in the density and spatial distribution of the photon point cloud, the conventional DBSCAN method cannot dynamically adjust the clustering radius according to regional characteristics. As a result, some signal photons may be misclassified as noise, or noise points may not be entirely removed.
To address this issue, this paper enhances the DBSCAN algorithm by incorporating a direction-adaptive approach. The improved method dynamically adjusts the clustering radius based on local point cloud features, such as spatial distribution and density, thereby enhancing clustering accuracy and denoising performance. By adaptively adjusting the clustering radius with each iteration, the algorithm more effectively distinguishes signal photons from noise photons in high-density regions, overcoming the limitations of the traditional method. This direction-adaptive DBSCAN improvement enables more precise noise point removal and better retention of signal photons, ultimately increasing the overall denoising accuracy.

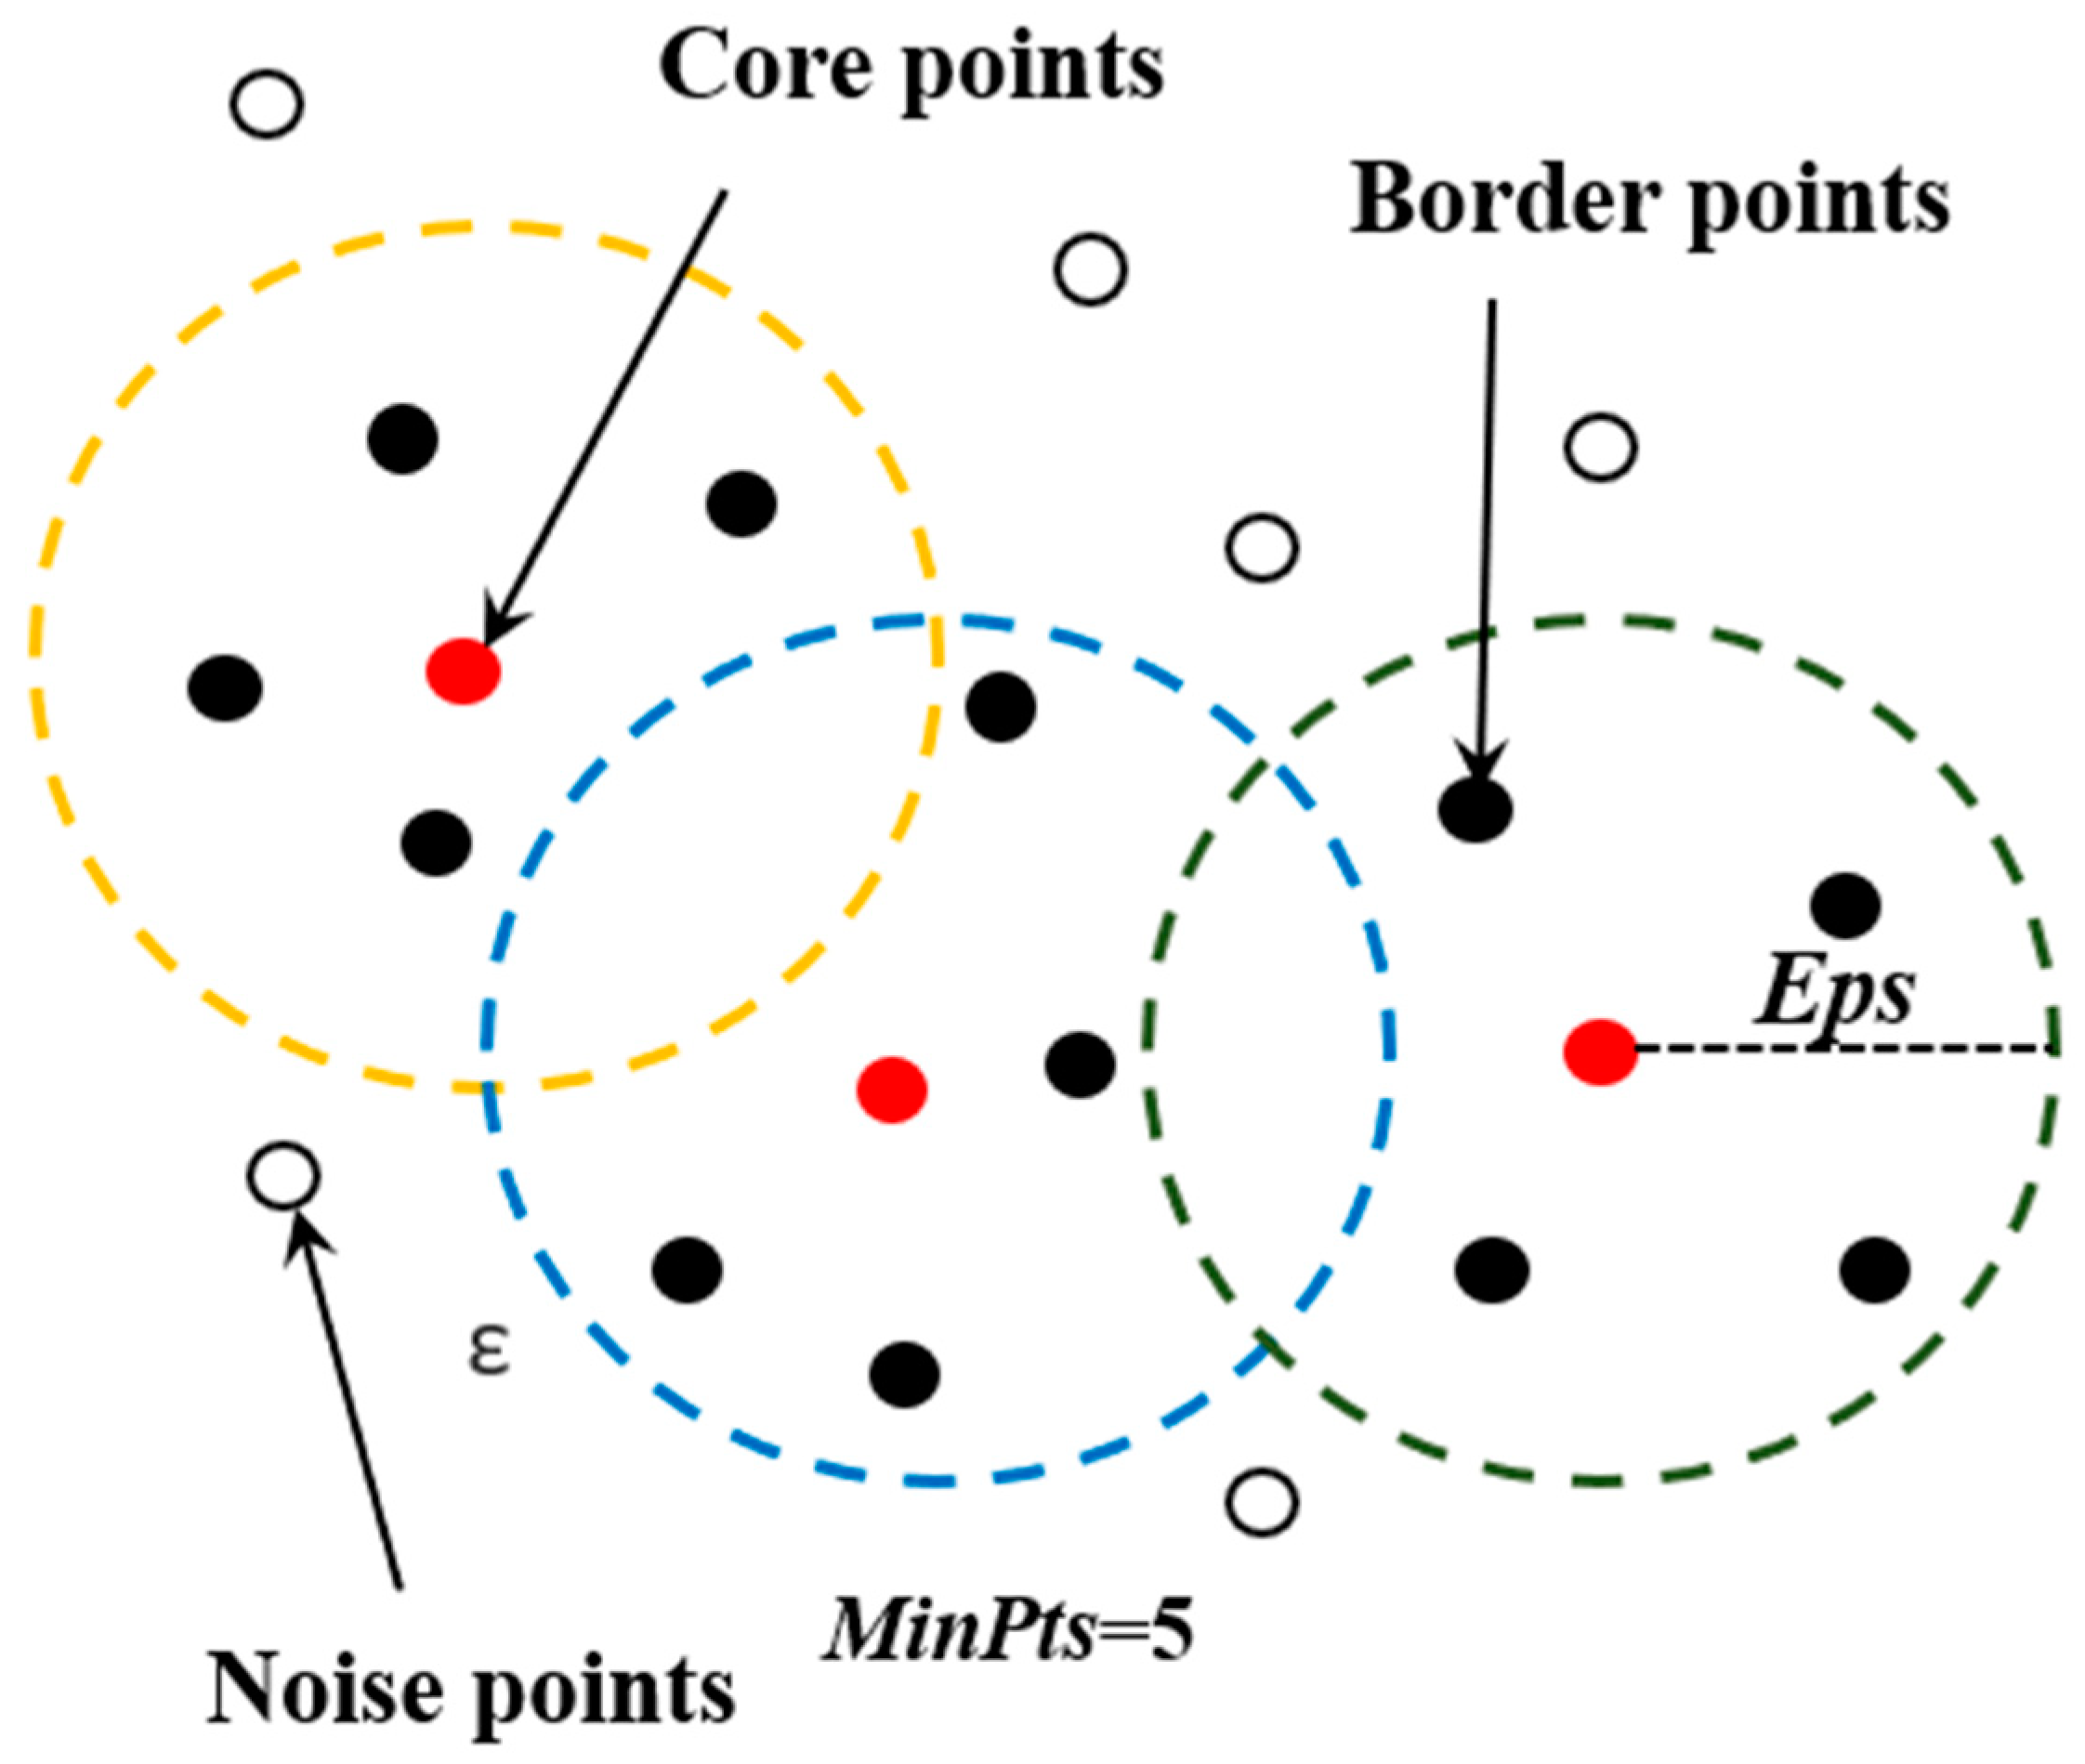
3.2.1. Principles of the DBSCAN Algorithm

DBSCAN is a classical density-based clustering algorithm [27] that identifies cluster structures by analyzing the density distribution of data points and effectively distinguishes noise points. Unlike traditional segmentation methods, DBSCAN does not require specifying the number of clusters in advance; instead, it automatically divides the data into clusters based on the neighborhood density of the points. The basic principle of DBSCAN is as follows: first, the initial radius (Eps) and the minimum number of neighbors (MinPts) are determined. Starting from any point in the dataset, the neighborhood of the point is examined and, if the number of points within the neighborhood exceeds the minimum threshold, the point and its neighbors are grouped into the same cluster. The clustering process is then extended by recursively adding points that meet the conditions, ensuring that eligible points are incorporated into the cluster. This process continues until all categorically assignable points are clustered. The algorithm determines whether data points belong to the same cluster based on two conditions: (1) whether the points are within a specified radius (neighborhood radius), and (2) whether the number of data points in the neighborhood satisfies the minimum sample size requirement. The two key parameters of DBSCAN are the neighborhood radius (Eps) and the minimum sample size (MinPts).
Eps Neighborhood: For any data point p, all data points within the space centered around p and with a radius of Eps are referred to as the neighborhood of p. This relationship is expressed mathematically in the equation:
NEps p = q D Dist p , q Eps
where Dist(p,q) denotes the distance between data points p and q.
The parameter Eps determines the neighborhood range of data points, influencing the evaluation of the shape and density of clusters. If Eps is too small, the clustering may become over-subdivided, causing some clusters to fail to form. Conversely, if Eps is too large, data points from different clusters may be merged, potentially leading to noise points being mistakenly classified as part of a cluster. The parameter MinPts defines the minimum number of points required in the neighborhood of a data point for it to be considered a core point. If there are insufficient points in the neighborhood, the point cannot be classified as a core point. MinPts controls the density of clusters: if their value is too small, it may result in the formation of too many small clusters whereas, if it is too large, multiple clusters may be merged into a single, larger cluster.
In the DBSCAN clustering results, data points are categorized into three types: core points, border points, and noise points. Core points are those whose neighborhoods contain several points greater than or equal to MinPts; border points are those whose neighborhoods contain fewer than MinPts points but are still within the neighborhood of core points; noise points are those that cannot be assigned to any cluster. By expanding the neighborhoods of the core points, DBSCAN can partition the data into multiple clusters. Figure 7 illustrates a schematic representation of the DBSCAN algorithm.
Compared to other commonly used clustering methods, DBSCAN offers significant advantages in handling irregular density distributions and high-noise environments. The k-means clustering algorithm, based on Euclidean distance, divides the data into a predetermined number of clusters, a process which makes it suitable for spherical cluster structures (Figure 8). However, k-means requires the number of clusters to be specified in advance and is highly sensitive to the initial selection of centroids, which can be influenced by noise. In contrast, hierarchical clustering constructs a tree structure to form clusters without requiring the number of clusters to be pre-defined. However, this method is computationally expensive and struggles with large-scale datasets.
DBSCAN, on the other hand, performs adaptive clustering using density thresholds (Eps and MinPts), effectively identifying clusters with varying densities while automatically classifying sparse regions as noise. Additionally, DBSCAN is more robust in handling irregularly shaped clusters and noisy data, making it particularly suitable for denoising ICESat-2 photon point cloud data. Despite these strengths, DBSCAN is sensitive to its parameters, and the optimal settings for Eps and MinPts may vary depending on the dataset.

3.2.2. Direction-Adaptive DBSCAN-Based Denoising Algorithm

  • Parameter Initialization and Adaptive Selection: The initialization of neighborhood radius parameters, specifically the long-axis radius εlong and the short-axis radius εshort, is a crucial step in the direction-adaptive DBSCAN algorithm. Given the limited existing literature on this specific methodology for photon point cloud data, we rely on preliminary experiments and empirical observations to determine their initial values.
    Before the adaptive adjustment process, we conducted a series of experiments by testing a wide range of values to comprehensively assess the algorithm’s performance under various settings. Specifically, the long-axis radius was varied between 0.01 to 0.1 times the spatial extent of the point cloud. This range was chosen because a too small value may lead to excessive fragmentation of clusters, while a too large value may cause distinct clusters to be merged. The short-axis radius was set as a proportion (0.2–0.8) of the long-axis radius. This allows exploration of different neighborhood definitions and their effects on clustering. Typically, the long-axis radius is set to 0.05 times the spatial extent, and the short-axis radius is set to 0.5 times the long-axis radius, which serve as the initial values based on empirical data and the point cloud’s density characteristics. These values strike a balance between over-clustering and under-clustering, ensuring that the algorithm can effectively capture the local density variations in the point cloud.
    The minimum number of points (MinPts) is determined using the Otsu method, which adjusts based on the density distribution of the point cloud. As shown in Figure 9, experiments reveal that setting MinPts to a small value (e.g., 2 or 3) results in over-clustering, where points with low local density are misclassified as core points, leading to fragmented clusters (Figure 9a). Conversely, setting MinPts to a high value (e.g., greater than 12) results in under-clustering, where many moderate-density clusters are missed and many points are incorrectly labeled as noise (Figure 9b). Table 3 summarizes the effects of different Eps and MinPts values on the denoising results.
    The Otsu method fine-tunes the MinPts parameter to ensure accurate identification of core points, especially in regions with varying point densities. The calculation formula for MinPts is as follows:
    MinPts = argmax t i = 1 n P i · C 1 i C 2 i
    where P(i) represents the weight of point i, which can be calculated as the inverse of the distance from point i to its k-nearest neighbors (k is usually set to 5 in our experiments). This weight reflects the local importance of the point in the density distribution. C1(i) and C2(i) denote the intra-class variances of the two classes in the density distribution, and t is the threshold for the maximum inter-class variance.
  • Adaptive computation of the elliptical tilt angle; To enhance the ability of DBSCAN clustering to adapt to the local density variation of the point cloud, it is necessary to compute the optimal elliptical tilt angle θoptimal. This process involves rotating the point cloud dataset at multiple angles and selecting the angle that results in the highest point cloud density after rotation as the optimal tilt angle. The rotation is performed using the rotation matrix R(θ):
    p = R θ · p
    where p represents the coordinates of the original point cloud and p′ represents the coordinates of the rotated point cloud. The density of the rotated point cloud is evaluated by testing multiple angles θ, with the angle θoptimal that maximizes the density selected as the optimal tilt angle.
    θ optimal = argmax θ Density p
  • Long-Axis and Short-Axis Radius Calculation: After rotating the point cloud using the optimal tilt angle θoptimal, the long-axis radius of the ellipse, εlong, and the short-axis radius, εshort, are computed based on the distribution of the rotated point cloud. These radii serve as neighborhood parameters for the DBSCAN clustering algorithm, enhancing the accuracy of the clustering by considering the local density characteristics of the point cloud.
    The long and short axes are calculated as follows:
    ε long = max maximum   distance   between   points   along   the   long   axis
    ε short = max maximum   inter - point   distance   along   t h e   s h ort   axis
  • DBSCAN Clustering Based on Adaptive Neighborhood Parameters: Using the adaptively selected long-axis radius εlong and short-axis radius εshort, DBSCAN clustering is applied to the point cloud data. During the clustering process, for each point pi, the number of points within its neighborhood Nϵ(pi) is calculated, and the point is classified as a core point based on the density threshold MinPts. If the number of points within the neighborhood of the point is greater than or equal to MinPts, the point is designated as a core point and assigned to the same cluster; otherwise, the point is labeled as a noise point.
    The core point determination formula is as follows:
    CorePoint p i = 1 ,   i f N ε p i M i n P t s 0 , o t h e r w i s e
    Here, CorePoint(pi) = 1 indicates that point pi is classified as a core point, representing a signal photon, while CorePoint(pi) = 0 signifies a noise point. This classification forms the basis for subsequent denoising and signal extraction steps.
  • Noise Point Rejection and Signal Photon Extraction: Based on the DBSCAN clustering results, all points identified as noise are discarded, while core points (signal photon points) are retained. The remaining signal photon points constitute the final fine denoising outcome, offering high-quality point cloud data for subsequent analysis.
    The criterion for noise point rejection is as follows:
    Point i = s i g n a l ,   i f   C o r e P o i n t p i = 1 n o i s e ,     i f   C o r e P o i n t p i = 0
    Here, CorePoint(pi) = 1 represents a core point classified as a signal photon, while CorePoint(pi) = 0 indicates a noise point. This classification ensures that only high-confidence signal photons are preserved for further analysis.
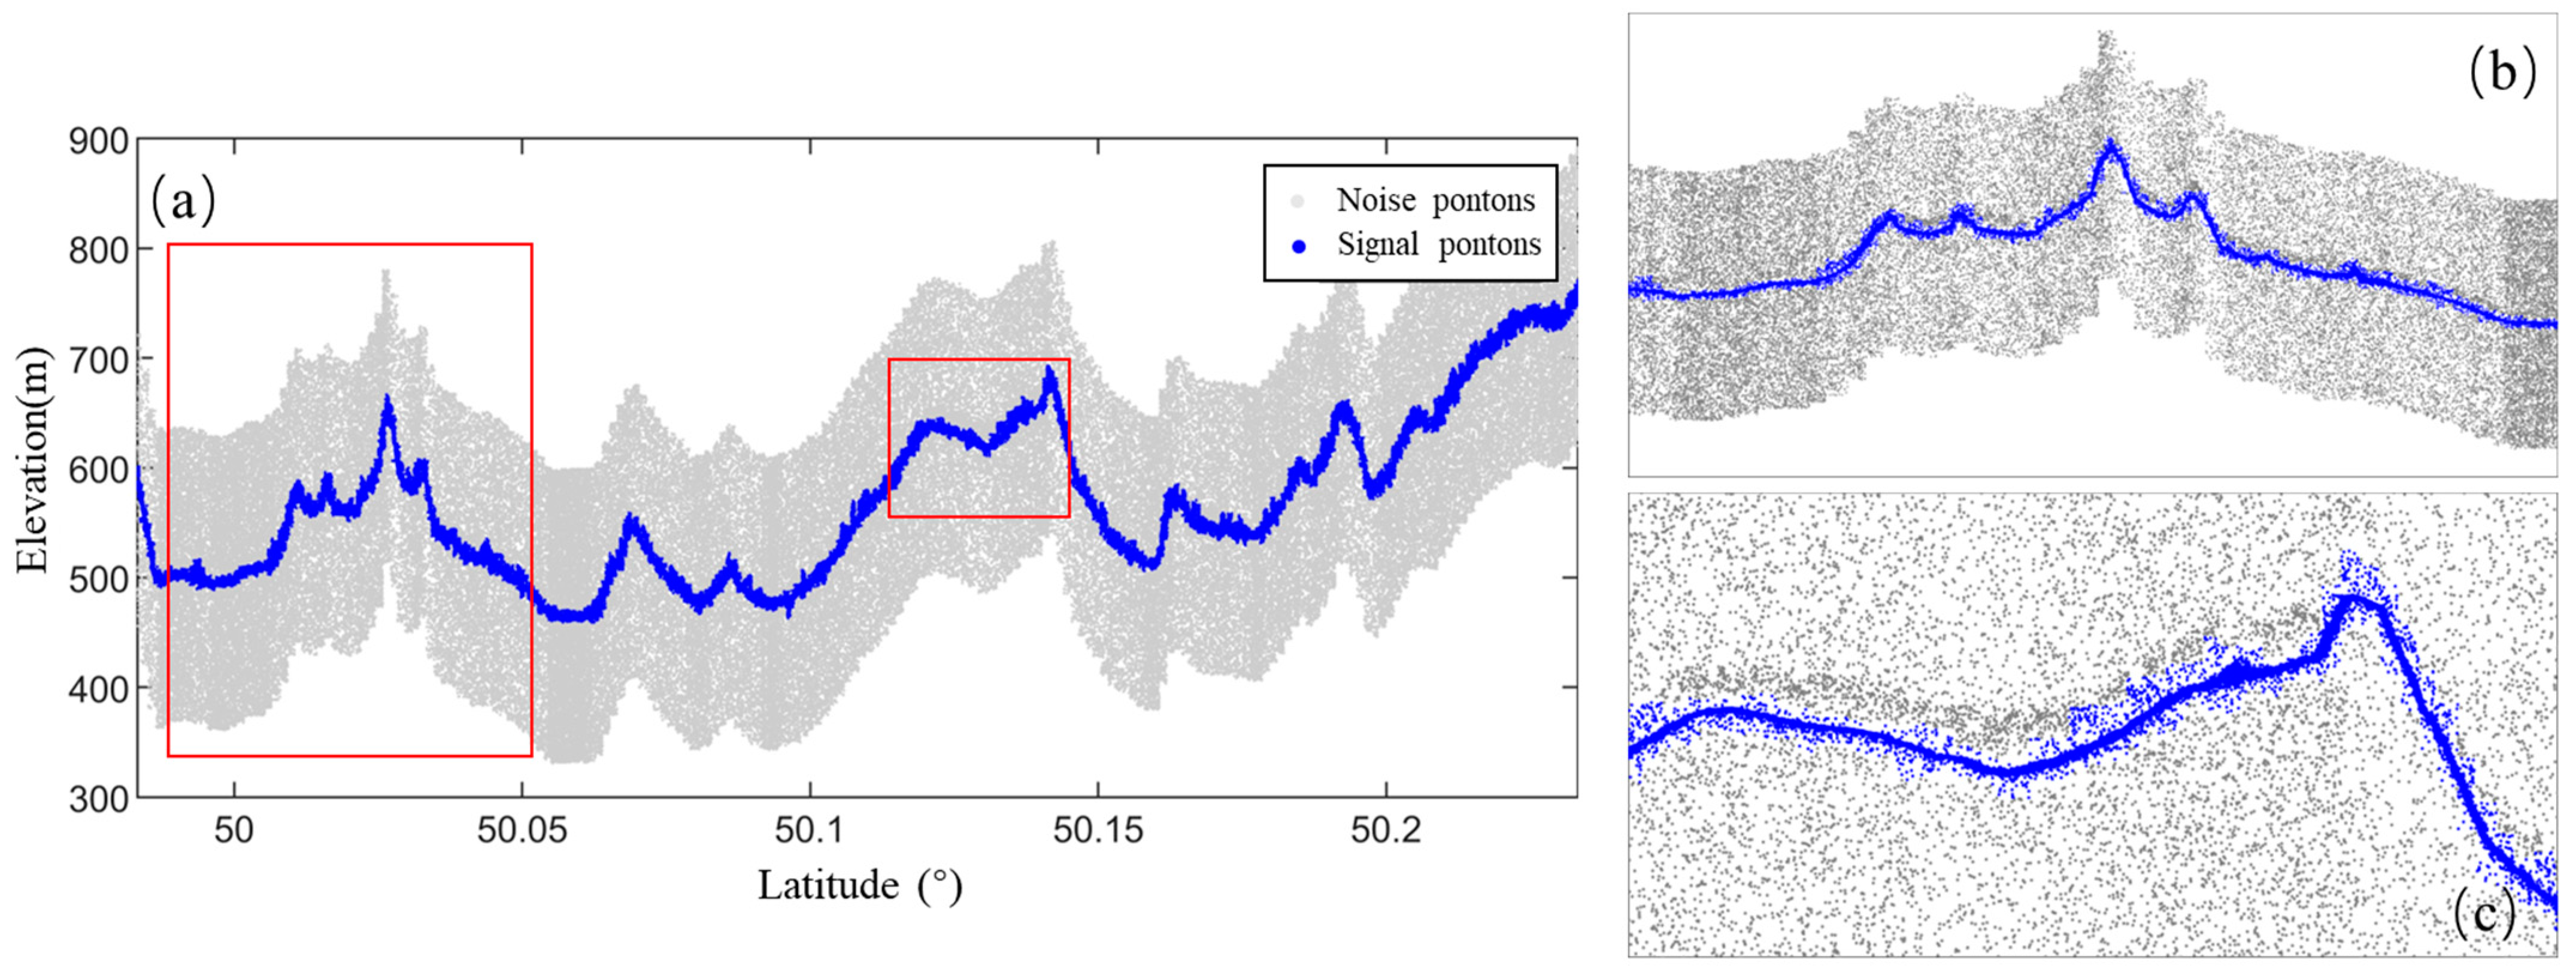
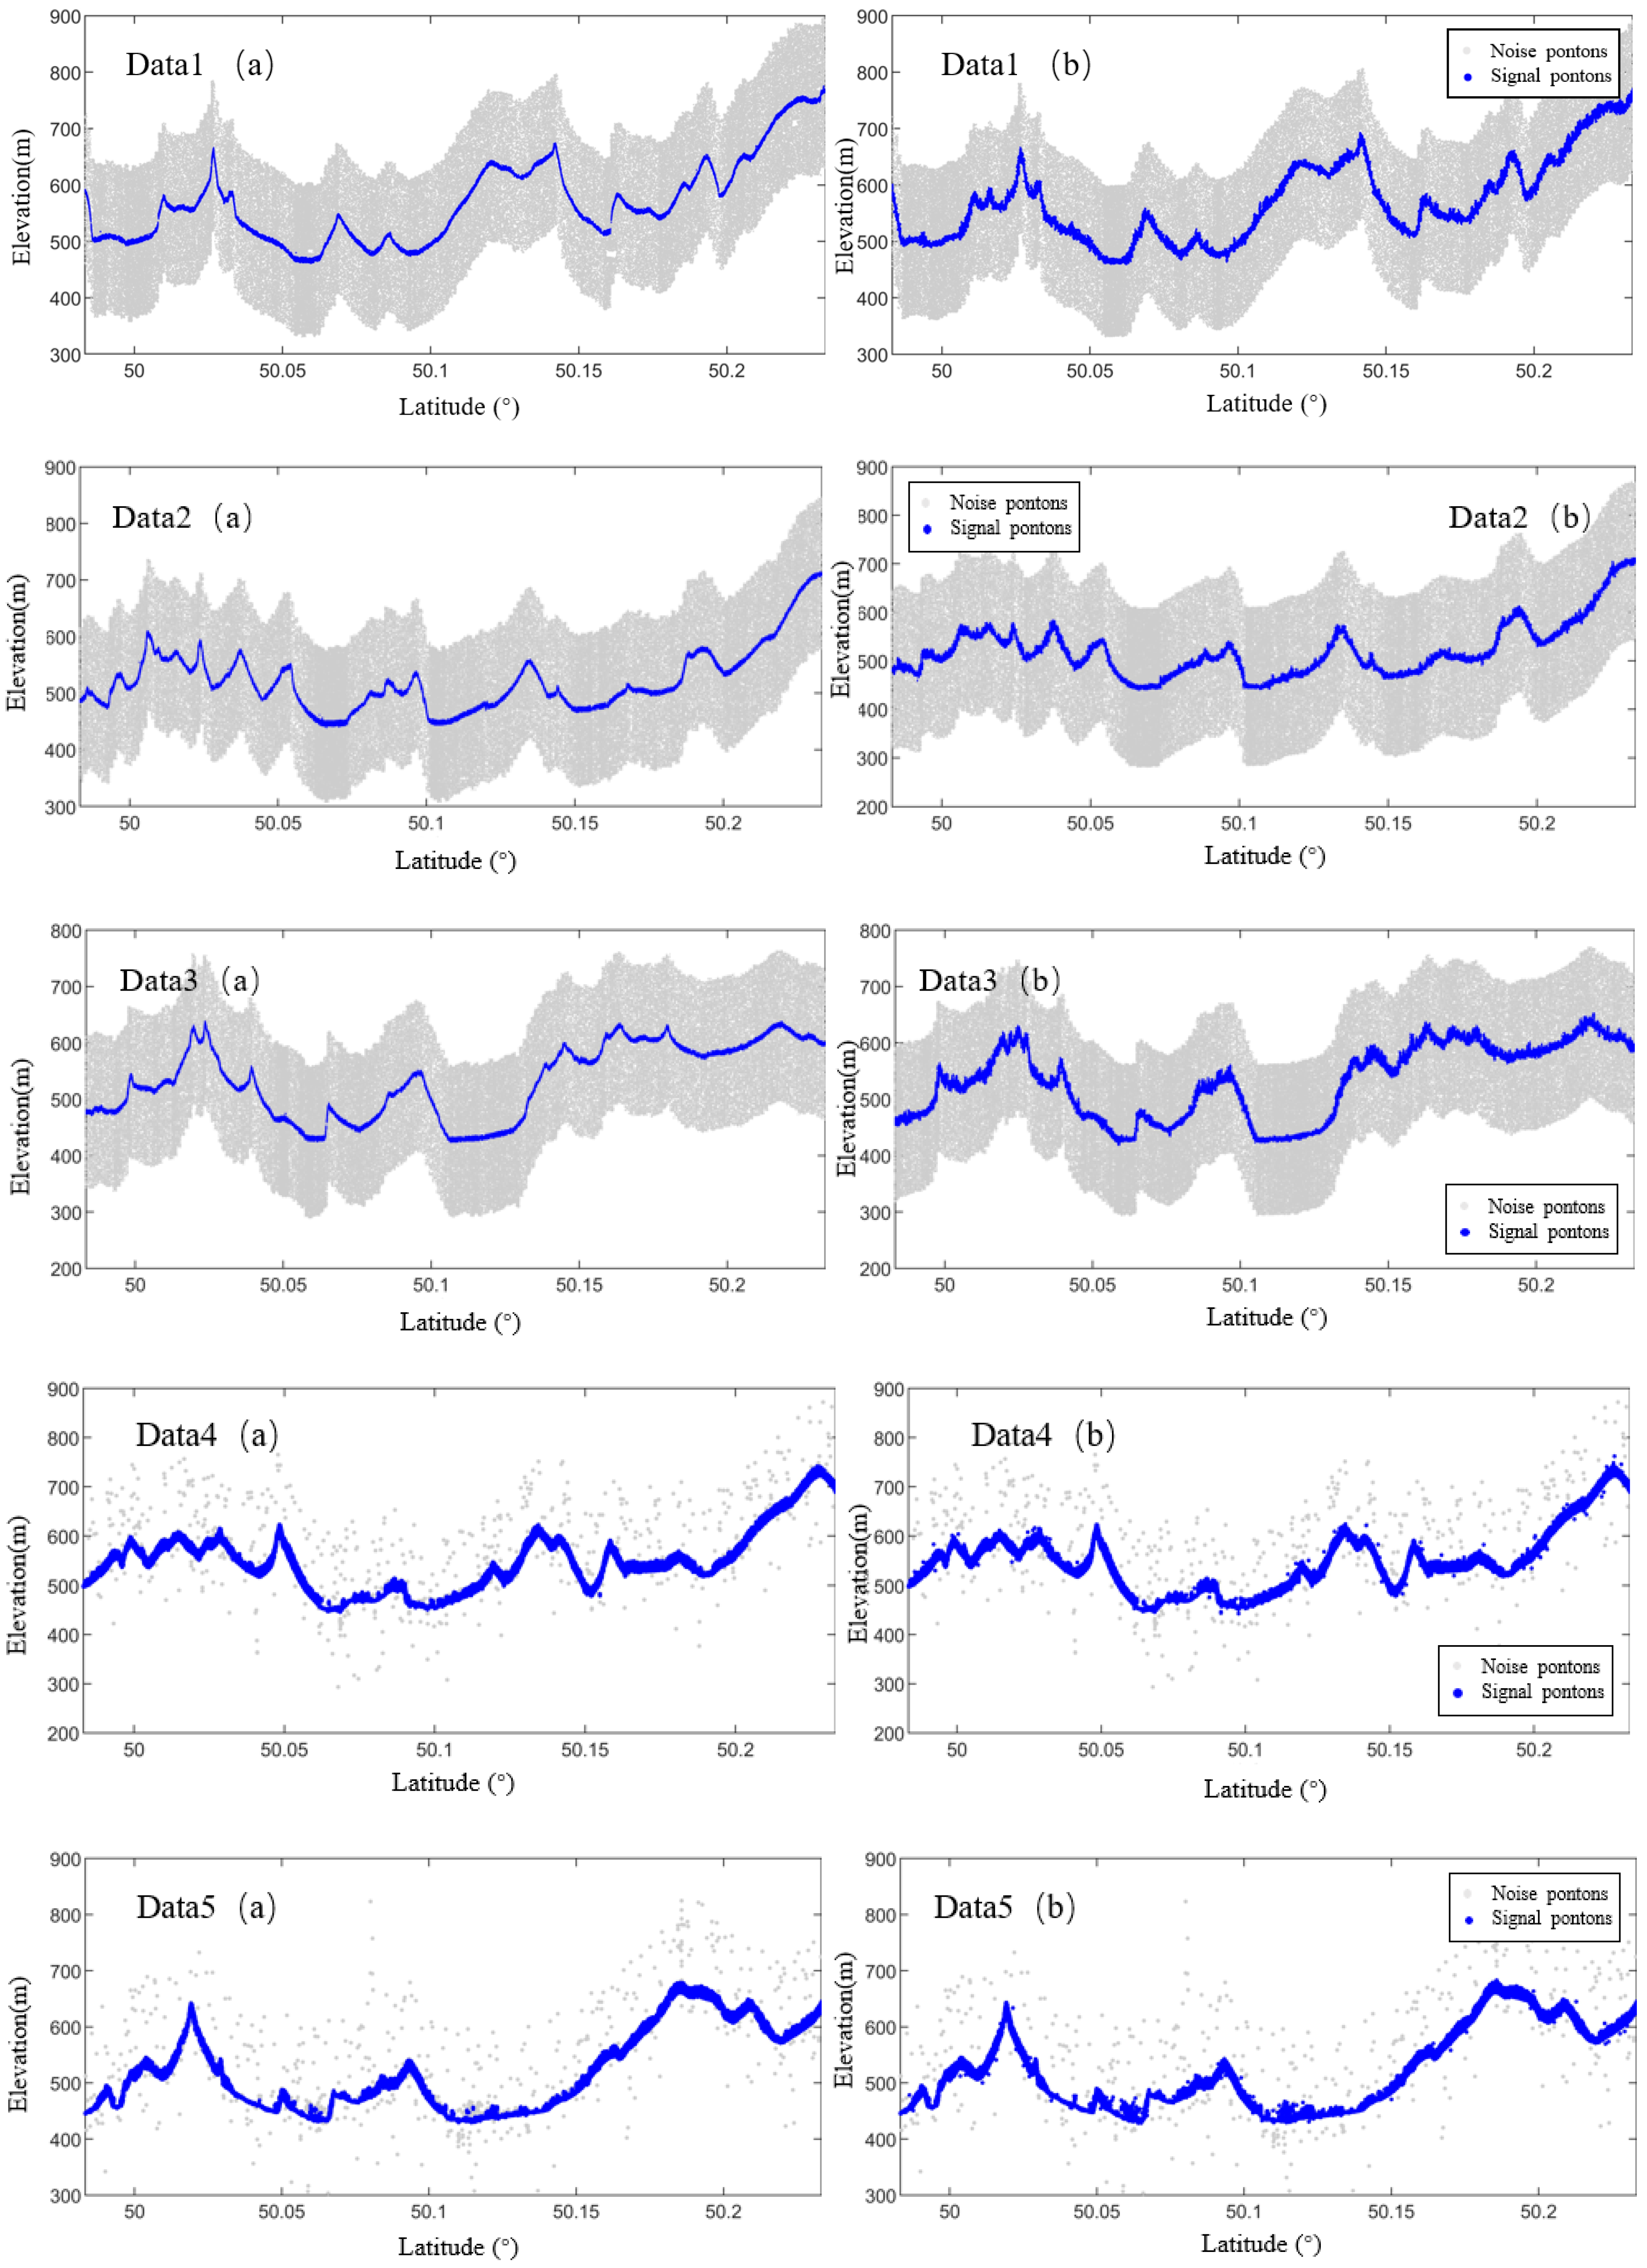
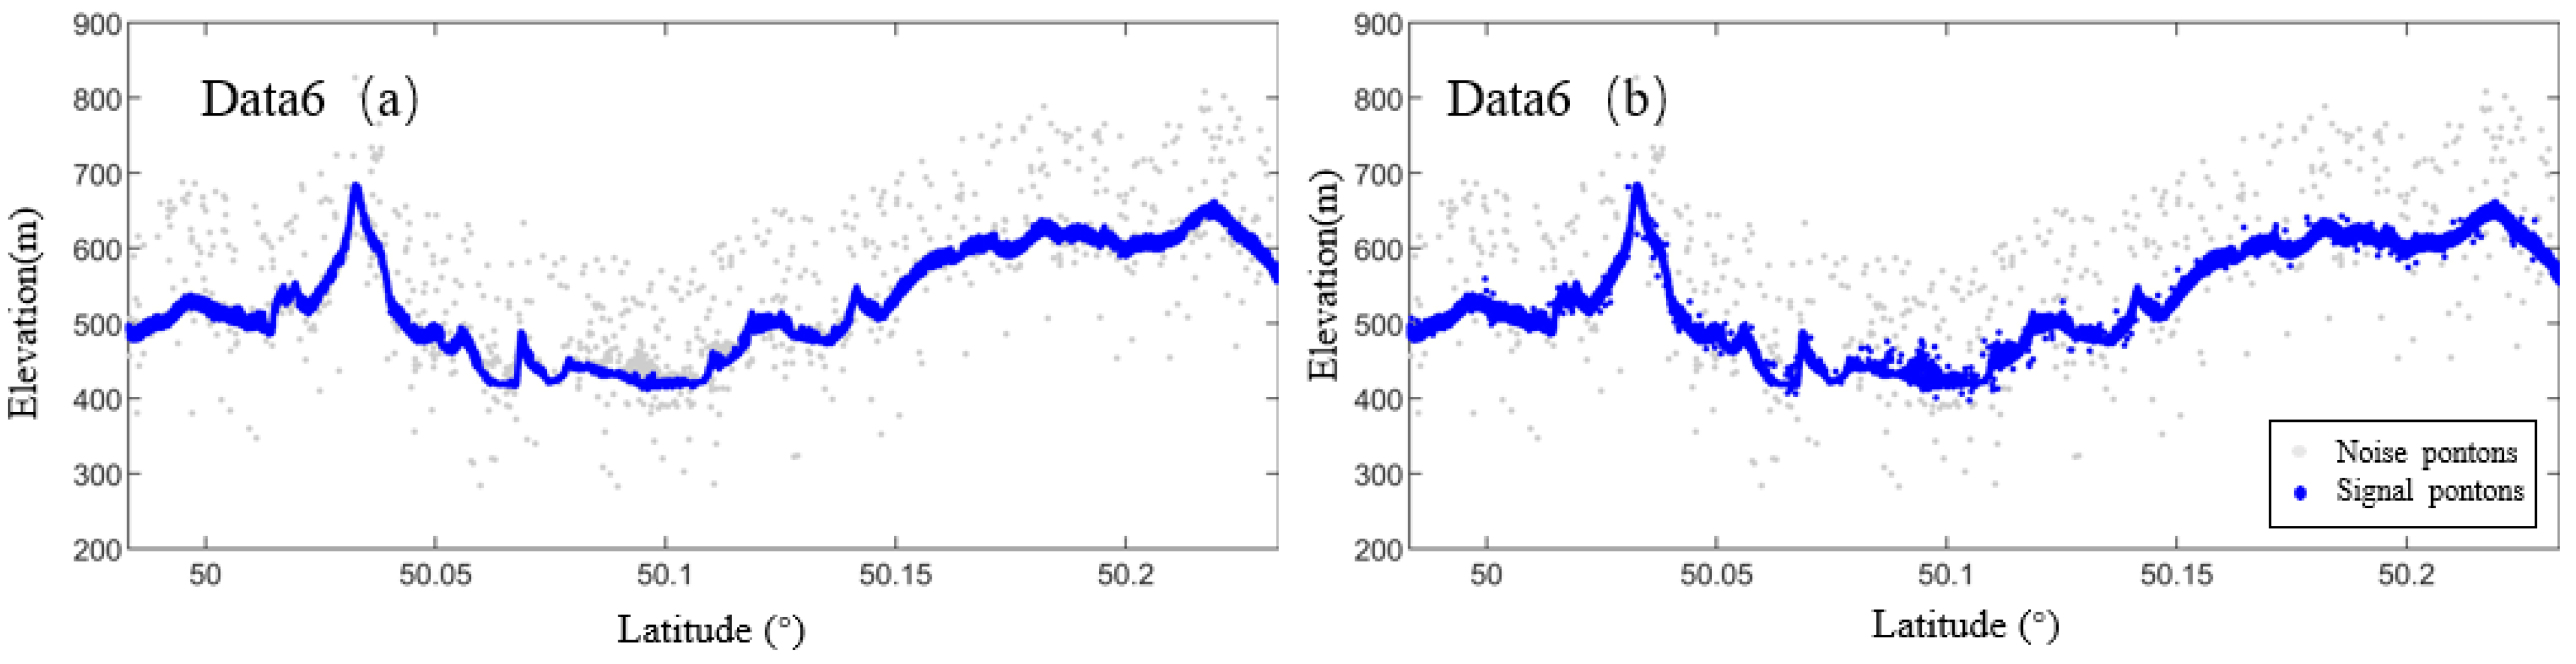
  • Fine Denoising Results: Following the direction-based adaptive DBSCAN clustering process, the distinction between signal photons and noise points is considerably enhanced. In comparison with the coarse denoising results, the denoising accuracy has been significantly improved. The noise points are effectively eliminated, and the signal photons are more precisely extracted. Figure 10 illustrates the point cloud data after the fine denoising process, where the noise points have been removed, the signal photon points are more concentrated, and the denoising effect is markedly improved.

3.3. Precision Evaluation

This study employs both qualitative and quantitative evaluation methods to assess the performance of the direction-based adaptive DBSCAN denoising algorithm. The qualitative method aims to evaluate the overall quality of the denoising results through visual inspection. In contrast, the quantitative method involves decoding the original ATL03 photon point cloud data to manually identify signal photons, which are then treated as true signal photons to evaluate the denoising effectiveness of the proposed approach. To quantitatively assess the algorithm’s performance, this study introduces several evaluation metrics, as outlined in ref. [28], to evaluate the quality of the denoising process.
P = TP TP + FP
R = TP TP + FN
a ccuracy = T P + TN TP + TN + FP + FN
F = 2 PR P + R
In this context, TP represents the number of correctly identified signal photons; TN refers to the number of correctly identified noise photons; FP denotes the number of incorrectly identified signal photons, i.e., noise photons misclassified as signal photons; and FN indicates the number of incorrectly identified noise photons, i.e., signal photons misclassified as noise photons. The variable p represents the ratio of true signal photons detected to the total number of detected photons, while R represents the ratio of detected signal photons to the total number of actual signal photons, which quantifies the method’s ability to detect signal photons. These two metrics are generally interdependent, necessitating the calculation of their harmonic mean, denoted as F, to provide a comprehensive evaluation of the method’s performance.

4. Results

4.1. Qualitative Evaluation

To better assess the universality of the algorithm proposed in this study, the experimental results for six different datasets are visualized and qualitatively analyzed. Figure 11 illustrates the two-dimensional distribution of photon data in both direction and elevation along the track. The dense region in the middle corresponds to the signal photons, while a larger number of noise photons are more sparsely distributed on either side of the signal photon band, set against a strong noise background. Figure 11a displays the photon point cloud profile of Data 2, which exhibits a high signal-to-noise ratio despite the presence of a strong noise background. Figure 11b shows the photon point cloud profile of Data 5, characterized by a low signal-to-noise ratio in a weaker noise background, with the top and bottom of the surface containing a significant number of noise photons.

4.1.1. Comparative Analysis of One-Time Coarse Denoising Results Based on Elevation Statistics Histograms

Figure 12 shows the results of the coarse denoising process based on the elevation statistics histogram. From the distribution of photon points in the figure, the distribution of the original ICESat-2/ATLAS photon point cloud ranges from hundreds to thousands of meters, and there are a large number of noise photons in the data. These noise photons are usually distributed on both sides of the signal photons, showing a more dispersed state. The noise photons have obvious “expansion” in the vertical direction, which makes the boundary between the signal photons and the noise photons blurred, thus affecting the accuracy of the data and the accuracy of the subsequent processing.
To solve this problem, an elevation threshold is set in the coarse denoising process, and the signal photons are distinguished from the noise photons by the statistical analysis of the elevation distribution. In the experimental setup, the bin width of the data is 100 m and the width of the signal photon buffer is set to ±30 m. These settings ensure that the trend of signal photons is better captured in the elevation direction, while noise photons are effectively removed on both sides of the signal band. Specifically, the elevation statistics histogram utilizes this width range to effectively divide the distribution of the photon point cloud, where noise photons are mostly located at the periphery of the signal band and, after the denoising process, the signal photons are concentrated in the core region, which shows an obvious band structure.
In Figure 12, the blue signal dots represent the retained effective signal photons, while the gray noise dots are the rejected noise photons. Through the coarse denoising process, a large number of noise photons can be removed, which significantly reduces the redundant part of the data while retaining the more accurate signal photons. These signal photons show a concentrated band distribution, while the noise photons are distributed on both sides of the signal band and are more discrete. After removing these noise photons, the quality of the data is effectively improved, and the subsequent analysis is no longer interfered with by noise points.
The effect of coarse denoising not only significantly reduces the amount of data, but also improves the efficiency and accuracy of data processing. After this initial denoising process, the subsequent fine denoising and data analysis can be carried out more efficiently. For processing large-scale ICESat-2 photon point cloud data, coarse denoising is an important step that helps to reduce the computational burden, ensure data quality, and provide clear input data for subsequent analysis.

4.1.2. Comparative Analysis of the Results of DBSCAN Denoising Algorithm Based on Directional Adaptive

Figure 13 demonstrates the processing results of the direction-adaptive DBSCAN-based denoising algorithm and the DRAGANN algorithm used in ATL08. From the qualitative analysis results, it can be seen that the direction-adaptive DBSCAN denoising algorithm proposed in this study can efficiently differentiate between noise photon spots and signal photon spots for both the data with high background photon count rate and the data with low background photon count rate. Compared with the ATL08 denoising algorithm, the algorithm proposed in this study demonstrates a better denoising effect in several aspects, especially in dealing with complex terrain and strong noise background. In the following, we will analyze the effect of noise photon removal, the ability of signal photon retention and the adaptability and robustness of the algorithm in several aspects, and explain the rationale and advantages.
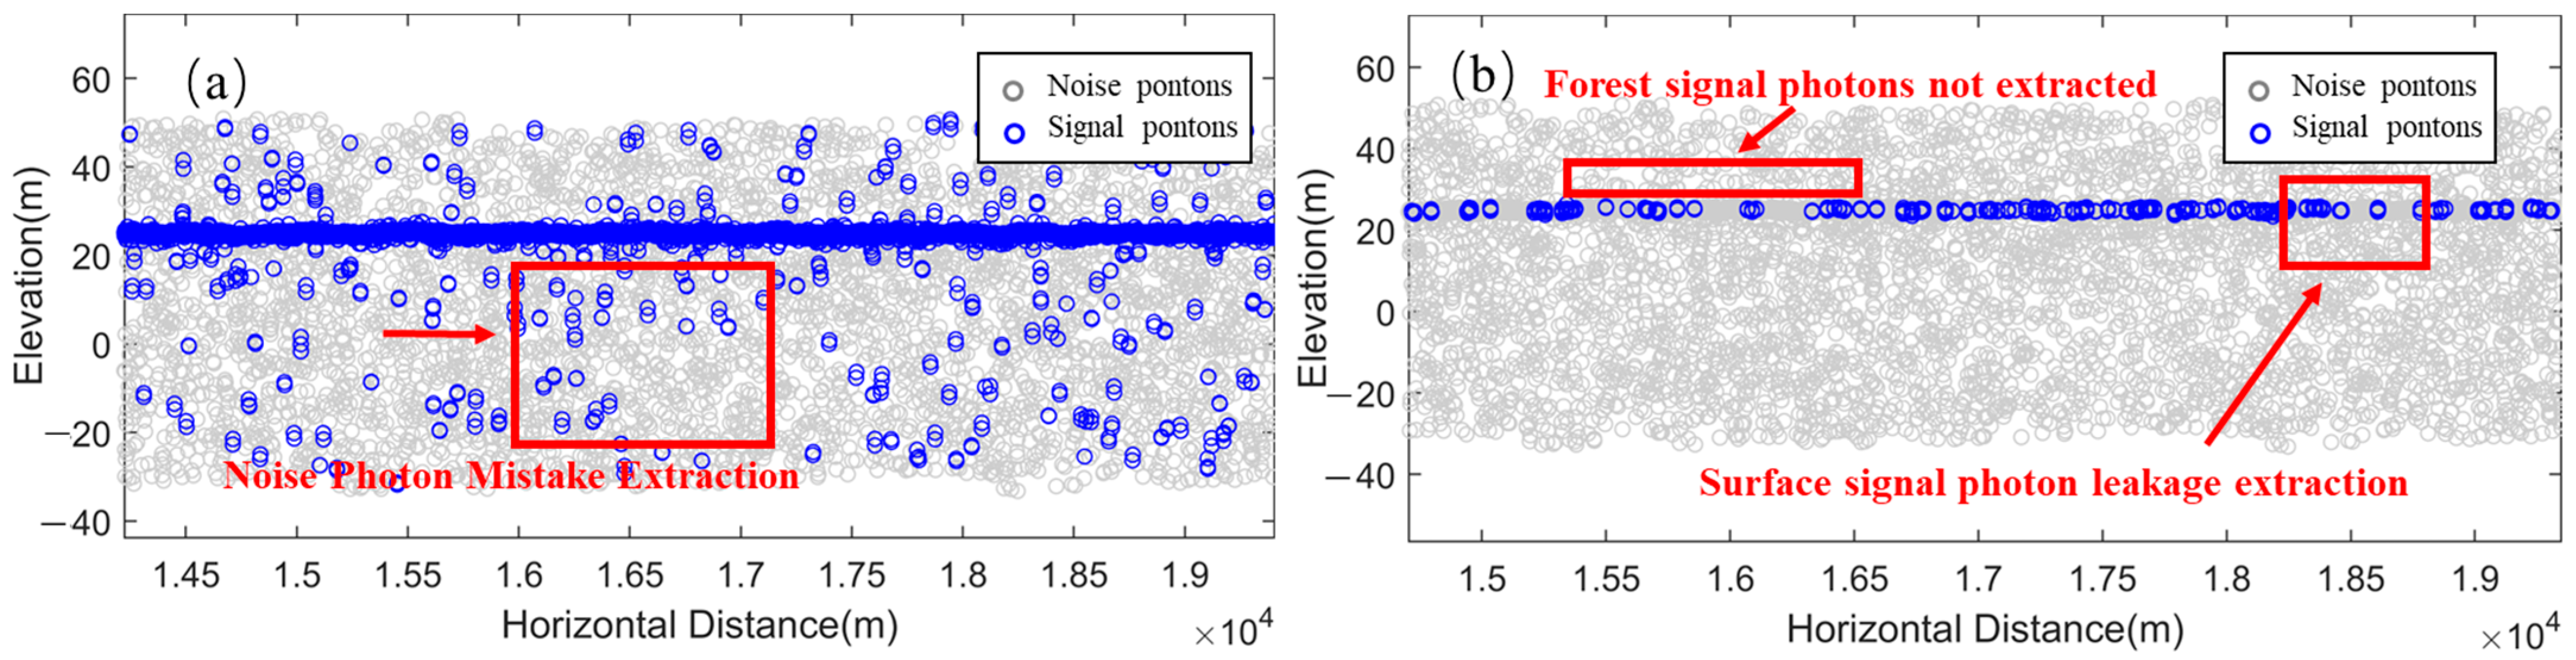
  • Effectiveness of noise photon removal: In terms of the effectiveness of noise photon removal, the direction-adaptive DBSCAN algorithm proposed in this study is significantly better than the ATL08 algorithm. The reason is that the direction-adaptive DBSCAN algorithm is a density-based clustering algorithm that identifies noise and signal points by analyzing the density distribution of the photon point cloud. Specifically, the direction-adaptive DBSCAN algorithm can determine which points belong to noise and which points are signal photons based on the local density variation of the point cloud. In the case of high background noise rate (e.g., Data 1, Data 2, Data 3), the noise photons tend to have similar spatial distributions with the signal photons, and the traditional denoising method of the ATL08 algorithm based on a fixed threshold may lead to some signal photons being misjudged as noise points. In contrast, the direction-adaptive DBSCAN algorithm does not rely on preset thresholds, but dynamically denoises according to the density distribution of the data, which can more accurately identify the noise photons and avoid mistakenly deleting signal points. Therefore, the direction-adaptive DBSCAN algorithm can effectively remove a large number of noise photons in a high-noise background while maintaining the integrity of signal photons.
  • Ability of signal photon retention: the ability of signal photon retention is an important index for evaluating the merits of denoising algorithms. Under the condition of high background noise, traditional denoising methods (e.g., ATL08 algorithm) often face the problem of balancing between denoising accuracy and signal retention. When the boundary between noise photons and signal photons is not obvious, the fixed-threshold method may lead to the erroneous deletion of some signal photons. In contrast, the direction-adaptive DBSCAN algorithm, by dynamically adjusting the local density of the point cloud, can differentiate between noise and signal based on the dense distribution of signal photons, and thus it can effectively retain most of the signal photons and remove those low-density noise photons in a high-noise environment. Taking Data 1 (high background count rate) as an example, under the traditional denoising method, noise photons, and signal photons are mixed, and the denoising process may over-reject the phenomenon, resulting in some signal photons being mistakenly deleted. In contrast, after using the direction-adaptive DBSCAN algorithm, signal photons are effectively retained due to their higher local density, while noise photons are successfully removed utilizing low density. Therefore, the direction-adaptive DBSCAN algorithm significantly outperforms the traditional denoising methods in terms of signal photon retention.
  • Adaptability and robustness of the algorithm: traditional denoising algorithms may not be effective in denoising under different noise backgrounds because the algorithm parameters are not adapted to the specific dataset. For example, the ATL08 algorithm removes noise by setting a fixed threshold, but this method may be over- or under-denoising when the noise background is complex or highly variable. On the contrary, the direction-adaptive DBSCAN algorithm has strong adaptability and robustness. It can automatically adjust the denoising parameters according to the characteristics of different datasets, thus adapting to different noise backgrounds. For example, under high noise backgrounds (e.g., Data 1, Data 2, Data 3), the direction-adaptive DBSCAN algorithm can effectively identify signal photons through high-density regions while, under low noise backgrounds (e.g., Data 4, Data 5, Data 6), the algorithm avoids mistakenly deleting a small number of signal photons by flexibly adjusting the density threshold, thus maintaining a high denoising accuracy.
    In addition, the direction-adaptive DBSCAN algorithm performs particularly well in the case of high terrain complexity. Since the algorithm can recognize the structure of the photon point cloud based on the local density changes, it can effectively recognize the noise photons in complex terrain regions (such as mountains, hills, and other regions with large terrain changes) and avoid the misrecognition problem caused by terrain changes. Therefore, the robustness of the direction-adaptive DBSCAN algorithm under different terrain conditions is also better than traditional denoising algorithms such as ATL08.
  • Computational efficiency of the algorithm: in terms of the computational efficiency of the algorithm, the direction-adaptive DBSCAN algorithm is not only able to improve the denoising effect but is also able to effectively reduce the amount of computation through the setting of adaptive density parameters. Compared with the fixed threshold method, the direction-adaptive DBSCAN algorithm does not need to set a static judgment threshold for each point in the calculation, but dynamically clusters and denoises according to the data density. This makes the algorithm have better computational efficiency when dealing with large-scale photonic point cloud data. In the experiments of this paper, the direction-adaptive DBSCAN-based denoising algorithm can achieve high denoising accuracy while reducing the computational volume, which is especially suitable for real-time processing of large-scale photonic point cloud data.
As shown in Table 4, the differences between the direction-adaptive DBSCAN algorithm and the ATL08 algorithm in terms of noise photon removal, signal photon retention, adaptability, robustness in complex terrain, and computational efficiency are presented.
The direction-adaptive DBSCAN-based denoising algorithm proposed in this study outperforms the traditional ATL08 denoising method in several aspects. First, in terms of the noise photon removal effect, the direction-adaptive DBSCAN algorithm can effectively identify and remove noise photons by analyzing the local density of the photon point cloud. Second, in terms of signal photon retention ability, the direction-adaptive DBSCAN algorithm can flexibly adjust the density threshold to improve the retention rate of signal photons. Third, the direction-adaptive DBSCAN algorithm has strong adaptability and robustness, and can automatically adjust the de-noising strategy according to different noise backgrounds and terrain conditions. Finally, in terms of computational efficiency, the direction-adaptive DBSCAN algorithm can reduce the computational volume while ensuring denoising accuracy, which is suitable for large-scale data processing. Taken together, the denoising algorithm based on direction-adaptive DBSCAN algorithm provides a more efficient and accurate solution for denoising photonic point cloud data.

4.2. Quantitative Evaluation

In this study, to evaluate the denoising effectiveness of the direction-adaptive DBSCAN denoising algorithm, four key evaluation metrics are employed: precision (P), recall (R), accuracy (Accuracy), and F-value (F). By assessment of data from multiple strips (Data 1 to Data 6), the denoising performance of the algorithm across various noise backgrounds is comprehensively evaluated and compared with the existing DBSCAN and ATL08 algorithms. The specific denoising results are presented in Table 5 and Table 8. Additionally, the 95% confidence intervals for precision and recall of each algorithm are shown in Table 6 and Table 9, and the t-test results regarding the performance differences among different algorithms are provided in Table 7 (for high background photon count rate) and Table 10 (for low background photon count rate). These data provide a more in-depth understanding of the algorithm performance.
(1)
Analysis of the Denoising Effect under High Background Photon Counting Rate
The results of datasets Data 1, Data 2, and Data 3 (as shown in Figure 14 and Table 5) show that, in a high-noise environment, the algorithm proposed in this paper exhibits a more excellent denoising effect compared to the DBSCAN and ATL08 algorithms. Taking Data 1 as an example, the precision of the algorithm in this paper is 0.887, the recall is 0.893, the accuracy is 0.926, and the F-value is 0.890, which represents a significant improvement over the DBSCAN algorithm’s precision (0.810), recall (0.815), and F-value (0.812). Moreover, the ATL08 algorithm has a precision of 0.843, a recall of 0.851, and an F-value of 0.847. Although these values show improvement, they are still inferior to those of the algorithm proposed in this paper. The data from Data 2 and Data 3 show a similar pattern, where the algorithm in this paper outperforms the DBSCAN and ATL08 algorithms in all evaluation metrics. In particular, the improvement in the F-value suggests that, in a high-noise environment, the algorithm proposed in this paper can better recognize and remove noise photons while retaining signal photons.
Table 5. Reserve Denoising Results for High Background Photon Counting Rate in the Gongbella River Reserve.
AlgorithmMetricDatasets (High Background Photon Counting Rate)
Data 1Data 2Data 3
DBSCANP0.810230.821780.81802
R0.815460.829620.82815
Accuracy0.860210.865470.87204
F0.812830.825690.82208
ATL08P0.843190.859300.85567
R0.851260.867520.86348
Accuracy0.892370.900840.91011
F0.847020.863390.85957
Direction-adaptive DBSCANP0.8873460.8926230.890873
R0.8932140.8957040.89874
Accuracy0.9257170.9237290.98089
F0.890270.8941610.894789
From the 95% confidence intervals for precision and recall (Table 6), under high background photon count rates, the confidence interval for the precision of the DBSCAN algorithm is (0.8020, 0.8313), and that for the recall is (0.8051, 0.8438). For the ATL08 algorithm, the confidence interval for the precision is (0.8317, 0.8737), and for the recall is (0.8397, 0.8818). In contrast, the confidence interval for the precision of the direction-adaptive DBSCAN algorithm proposed in this paper is (0.8836, 0.8970), and for the recall is (0.8890, 0.9028). It is evident that the confidence intervals of the direction-adaptive DBSCAN algorithm are significantly higher than those of the other two algorithms, and the interval widths are relatively narrow. This not only further confirms the high precision and recall of this algorithm under high-noise backgrounds but also reflects the stability of its results.
Table 6. Confidence Intervals (95%) for Precision and Recall under High Background Photon Count Rate.
AlgorithmMetricHigh Background Photon Count Rate (95% CI)
DBSCANP(0.8020, 0.8313)
DBSCANR(0.8051, 0.8438)
ATL08P(0.8317, 0.8737)
ATL08R(0.8397, 0.8818)
Direction-Adaptive DBSCANP(0.8836, 0.8970)
Direction-Adaptive DBSCANR(0.8890, 0.9028)
The t-test results (Table 7) also strongly support the above conclusions. Under high background photon count rates, there are mostly highly significant differences (p-values less than 0.01) between the direction-adaptive DBSCAN and the DBSCAN, ATL08 algorithms in all metrics. For example, in terms of precision, the t-value for the comparison between the direction-adaptive DBSCAN and the DBSCAN is 19.6882, with a p-value of 0.0000; the t-value for the comparison with the ATL08 is 7.3365, with a p-value of 0.0018. This indicates that there are substantial differences in performance between the direction-adaptive DBSCAN algorithm and the other two algorithms, highlighting its superiority under high-noise backgrounds.
Table 7. t-test Results for Direction-Adaptive DBSCAN vs. DBSCAN, and ATL08 (High Background Photon Count Rate).
MetricDirection-Adaptive DBSCAN vs. DBSCAN (t-Value)Direction-Adaptive DBSCAN vs. DBSCAN (p-Value)Direction-Adaptive DBSCAN vs. ATL08 (t-Value)Direction-Adaptive DBSCAN vs. ATL08 (p-Value)
P19.68820.0000 ***7.33650.0018 ***
R14.98260.0001 ***6.83200.0024 **
Accuracy4.07220.0152 *2.18030.0947
F17.85230.0001 ***7.08080.0021 ***
Note: For the comparisons between Direction-Adaptive DBSCAN and ATL08, and DBSCAN, the p-values from the t-tests are marked with asterisks based on their significance level: “***“ indicates a highly significant difference (p < 0.01). “**“indicates a very significant difference (p < 0.05). “*” indicates a significant difference (p < 0.1). No asterisk indicates no significant difference (p ≥ 0.1).
Further comparison reveals that, although the DBSCAN and ATL08 algorithms possess denoising capabilities, the improvements in their precision and recall are relatively small, and their F-values fail to significantly exceed 0.85. In contrast, the algorithm in this paper achieves significant improvements in precision, recall, and F-value, demonstrating its robustness and adaptability under high-noise backgrounds.
(2)
Analysis of the Denoising Effect under Low Background Photon Counting Rate
In the low-noise background, the analysis results of datasets Data4 to Data6 (Figure 15 and Table 8) show that the denoising effect of the algorithm in this paper is further enhanced. For instance, in Data4, the precision of the algorithm in this paper is 0.997, the recall is 0.998, the accuracy is 0.996, and the F-value is 0.998, which far surpasses those of the DBSCAN algorithm (F-value of 0.941) and the ATL08 algorithm (F-value of 0.972). The same trend is observed in Data5 and Data6, where the algorithm in this paper outperforms the DBSCAN and ATL08 algorithms in all three metrics (precision, recall, and accuracy), and the F-values are close to 1 (F-value of 0.997 for Data5 and 0.997 for Data6). This indicates that, in a low-noise environment, the denoising algorithm proposed in this paper can accurately remove noise photons and retain almost all signal photons, exhibiting a very high denoising effect.
According to the confidence interval data (Table 9), under low background photon count rates, the confidence interval for the precision of the DBSCAN algorithm is (0.9140, 0.9527), and for the recall is (0.9326, 0.9434). For the ATL08 algorithm, the confidence interval for the precision is (0.9492, 0.9796), and for the recall is (0.9639, 0.9777). The confidence interval for the precision of the direction-adaptive DBSCAN algorithm is (0.9953, 0.9986), and for the recall is (0.9981, 0.9982). The confidence intervals of the direction-adaptive DBSCAN algorithm are not only at a higher level but also extremely narrow, indicating that this algorithm not only has excellent performance but also highly stable results in low-noise backgrounds.
The t-test results under low background photon count rates (Table 10) also show that the differences between the direction-adaptive DBSCAN and the DBSCAN, ATL08 algorithms in all metrics are even more significant. For example, in terms of recall, the t-value for the comparison between the direction-adaptive DBSCAN and the DBSCAN is 48.0042, with a p-value of 0.0000; the t-value for the comparison with the ATL08 is 17.0328, with a p-value of 0.0001. The larger t-values and smaller p-values under low-noise conditions indicate that the performance differences between the direction-adaptive DBSCAN algorithm and the other algorithms are further magnified, highlighting the greater superiority of this algorithm.
Especially in terms of the F-value, the performance of the algorithm in this paper is particularly outstanding, with an F-value close to 1, indicating an almost perfect denoising effect. In contrast, the DBSCAN and ATL08 algorithms demonstrate weaker denoising capabilities in low-noise backgrounds, with F-values significantly lower than that of the algorithm in this paper. In particular, the F-value of the DBSCAN algorithm consistently remains below 0.95. This difference indicates that, while the DBSCAN and ATL08 algorithms can reduce noise to a certain extent, the algorithm presented in this paper, with its more accurate denoising model, demonstrates unique advantages, especially in environments with less noise.
The quantitative analysis reveals that the direction-adaptive DBSCAN-based denoising algorithm proposed in this paper significantly outperforms the traditional DBSCAN and ATL08 algorithms across various noise environments. Specifically, the proposed algorithm demonstrates a marked improvement in the F-value under high-noise conditions, highlighting its superior denoising capability through enhanced precision and recall. The F-value improvement ranges from 7% to 9%, thereby validating the algorithm’s effectiveness in handling complex noise environments.
In a low noise background, the F-value of this paper’s algorithm is close to 1, indicating that it is able to remove noise photons almost perfectly and retain almost all signal photons, demonstrating superior denoising precision and accuracy. Meanwhile, the t-test results support the statistically significant difference of the algorithm compared with other methods, further confirming its superiority. The analysis of confidence intervals shows that the results of this paper’s algorithm are more stable and consistent under different noise environments.
Although the present algorithm significantly outperforms the DBSCAN and ATL08 algorithms in terms of denoising effect, the processing time is relatively long due to its more complex computational steps. In our future work, we plan to improve efficiency through parallel computing or algorithm optimization so that the algorithm can be applied more efficiently on large-scale datasets.
In summary, the direction-adaptive DBSCAN-based denoising algorithm demonstrates enhanced robustness and accuracy in high-noise environments, while achieving near-perfect denoising in low-noise conditions. This makes it an ideal solution for denoising photon point cloud data, particularly in tasks involving complex noise backgrounds. Furthermore, the algorithm has significant potential for practical applications, particularly in remote sensing fields, such as forest biomass estimation and biodiversity research. By enabling high-precision denoising, the algorithm improves the quality of photonic point cloud data, facilitating more accurate feature extraction and providing robust data support for tasks such as ecological monitoring, forest resource management, and environmental protection.

5. Conclusions and Discussion

The photonic point cloud denoising algorithm, based on direction-adaptive DBSCAN, proposed in this paper, significantly enhances the denoising accuracy of photon point cloud data by combining coarse denoising using elevation statistics histograms with fine denoising through direction-adaptive DBSCAN. The algorithm first removes obvious noise points by employing the elevation statistics histogram to establish a foundation for subsequent fine denoising. It then dynamically adjusts the neighborhood radius and adaptively selects the ellipse tilt angle using direction-adaptive DBSCAN, thereby effectively improving the differentiation accuracy between signal and noise photons.
Experimental results indicate that this algorithm’s denoising accuracy is significantly improved across multiple data strips, particularly in high-noise scenarios. It outperforms traditional DBSCAN and ATL08 algorithms across all evaluation metrics, with substantial improvements in accuracy, recall, and F1-Score under high-noise conditions. Additionally, memory consumption is reduced, and the algorithm more accurately handles the complex spatial distribution of photon point cloud data. These high-precision denoising results offer significant practical benefits for forestry applications. In forest canopy height estimation, the denoised photon point cloud data can more accurately reflect the true height of the forest canopy, providing more reliable data for the quantitative assessment of forest resources and enabling foresters to gain a more accurate understanding of forest growth and ecological functions. In forest biomass estimation, the clarified photon point cloud data improve the accuracy of calculating tree volume and mass, providing robust support for assessing forest carbon stocks and advancing carbon cycle research.
The algorithm presented in this paper offers distinct advantages over the principal direction-based noise removal algorithm developed by Pan et al. [29]. That algorithm relies on the characteristics of photons in the spatial neighborhood and removes noisy photons by leveraging the angle between the principal direction of the photon and the along-track direction. It performs exceptionally well in handling day/night data with varying signal-to-noise ratios, particularly demonstrating an accuracy of up to 97.43% in denoising nighttime data. Furthermore, it exhibits high accuracy through quantitative evaluations, offering clear advantages in processing nighttime data and reducing computational overhead.
The direction-adaptive DBSCAN denoising algorithm proposed in this paper demonstrates distinct advantages when processing photon data in high-noise and high-density regions. It dynamically adjusts parameters based on data density characteristics, thereby reducing memory consumption and improving computational efficiency. The denoising accuracy is more stable and precise when handling complex terrain and forest structure data, particularly in processing data with high background noise. This significantly enhances the differentiation accuracy of signal photons, providing clearer and more accurate photon point cloud data for forestry applications and supporting more precise monitoring and management of forest resources.
However, although the algorithm in this paper performs well in a variety of test environments, it still has some shortcomings. When dealing with data with poor low signal-to-noise ratio (SNR), the denoising accuracy of the algorithm may be affected due to the difficulty in distinguishing signal photons from noise photons, so more robust noise detection mechanisms need to be explored in the future. When performing the elliptical tilt angle adaptive computation, although the computational and memory burdens are reduced by filtering the high-confidence region, the algorithm may still face high computational overheads when dealing with large-scale photon point cloud data, so optimizing the computational performance of the algorithm to adapt to large-scale data processing is an important research direction. In addition, the experimental data in this paper are mainly derived from ICESat-2 lidar data, and the applicability of the algorithm in other remote sensing data sources needs to be further verified, different data types and distribution characteristics may make the algorithm perform differently, and its generalization and applicability can be evaluated by diversified remote sensing datasets in the future. Moreover, although the maximum interclass variance method (Otsu method) is used to optimize the density threshold, there is still uncertainty in the definition of signal and noise photons in some sparse regions, and further optimization of the photon differentiation method is needed to improve the denoising effect.
In addition to terrain complexity, forest vegetation density is also an important factor affecting the photon point cloud noise. Existing studies have shown that the canopy density of a forest significantly influences the scattering and absorption of laser signals, which in turn alters the return characteristics of photons. In dense forest areas, the spatial shielding effect between trees may weaken the laser signals, increasing noise levels, while in sparse forest areas, the photon return signal is stronger, and noise is lower. Therefore, changes in vegetation density directly affect the noise characteristics of point cloud data and may influence the performance of denoising algorithms. This issue has been explored by Yang et al. [30], who highlighted the effect of vegetation density on denoising accuracy in forest regions, particularly in dense canopies. Similarly, Tang et al. [31] also noted that varying forest structures play a significant role in photon return characteristics, which can pose challenges for photon classification and denoising in forests with differing canopy densities.
Based on the above deficiencies and practical application requirements, future research can be expanded in multiple directions. The algorithm can be applied to airborne LiDAR data processing to assess its applicability and effectiveness under different platforms and data acquisition methods. Airborne LiDAR data has different noise characteristics and spatial distribution, and expanding the applicability of the algorithm is crucial to improving its effectiveness in a wider range of forestry applications. Combining deep learning technology is also an important direction, using its ability to handle complex nonlinear features to further optimize the effect of photon classification and denoising, improve the accuracy and robustness of noise detection and photon classification, and provide more accurate data for forestry applications. In view of the increase in the amount of large-scale remote sensing data, the focus is on optimizing the computational performance of the algorithm, reducing the memory consumption and improving the processing speed, in order to adapt to the processing needs of a larger range and higher resolution point cloud data, and to meet the requirements of large-scale monitoring of forestry resources. The fusion of remote sensing data from multiple sources can also be explored, combining other types of remote sensing data, such as optical images and radar data, to improve the accuracy and denoising effect of the data, provide more comprehensive and accurate information support for tasks such as forest resources monitoring and environmental protection, and contribute to more scientific forestry decision-making and management.
In summary, although there is still room for improvement of the denoising algorithm based on direction-adaptive DBSCAN proposed in this paper, it has demonstrated significant advantages in photonic point cloud data processing, and it has a wide range of application prospects, especially in high-noise and complex point cloud environments. Future research can combine the advantages of other algorithms and focus on optimizing the computational performance, improving the adaptability under low signal-to-noise ratio conditions, and enhancing the versatility of the algorithm, so as to provide solid technical support for a wider range of remotely sensed data processing, and thus encourage the forestry field to achieve more accurate and in-depth results in the areas of forest resources monitoring, management, and ecological research.

Author Contributions

Conceptualization, C.Z. and R.W.; methodology, C.Z.; software, C.Z. and R.W.; validation, C.Z., B.Y. and Y.Y.; formal analysis, C.Z.; investigation, C.Z.; resources, R.W.; data curation, C.Z.; writing—original draft preparation, C.Z.; writing—review and editing, C.Z.; visualization, C.Z. and Y.Y.; supervision, R.W., B.Y., Y.Y., L.Y., F.L. and K.X.; project administration, R.W.; funding acquisition, R.W. All authors have read and agreed to the published version of the manuscript.

Funding

National Natural Science Foundation of China, “Biomass Precision Estimation Model Research for Large-Scale Regions Based on Multi-View Heterogeneous Stereographic Image Pair of Forest” (41971376). The project was funded by the National Natural Science Foundation of China (NSFC). Beijing Natural Science Foundation, “Study on the Red Line Division Mechanism of Water Conservation Ecological Protection in Beijing Based on the SWAT Model and Ecological Security Pattern” (8212031).

Data Availability Statement

The data used in this study is publicly available and can be directly accessed from the Zenodo website (https://doi.org/10.5281/zenodo.14990765).

Conflicts of Interest

The authors declare no conflicts of interest.

References

  1. Schimel, D.; Pavlick, R.; Fisher, J.B.; Asner, G.P.; Saatchi, S.; Townsend, P.; Miller, C.; Frankenberg, C.; Hibbard, K.; Cox, P. Observing terrestrial ecosystems and the carbon cycle from space. Glob. Change Biol. 2015, 21, 1762–1776. [Google Scholar] [CrossRef] [PubMed]
  2. Radtke, P.; Walker, D.; Frank, J.; Weiskittel, A.; DeYoung, C.; MacFarlane, D.; Domke, G.; Woodall, C.; Coulston, J.; Westfall, J. Improved accuracy of aboveground biomass and carbon estimates for live trees in forests of the eastern United States. For. Int. J. For. Res. 2017, 90, 32–46. [Google Scholar] [CrossRef]
  3. Nelson, R.; Valenti, M.A.; Short, A.; Keller, C. A Multiple Resource Inventory of Delaware Using Airborne Laser Data. BioScience 2003, 53, 981–992. [Google Scholar] [CrossRef]
  4. Wulder, M.A.; White, J.C.; Nelson, R.F.; Næsset, E.; Ørka, H.O.; Coops, N.C.; Hilker, T.; Bater, C.W.; Gobakken, T. Lidar sampling for large-area forest characterization: A review. Remote Sens. Environ. 2012, 121, 196–209. [Google Scholar] [CrossRef]
  5. Luo, H.; Yue, C.; Yuan, H.; Chen, S. Improving Forest Canopy Height Estimation Using a Semi-Empirical Approach to Overcome TomoSAR Phase Errors. Forests 2023, 14, 1479. [Google Scholar] [CrossRef]
  6. Magruder, L.A.; Wharton, M.E., III; Stout, K.D.; Neuenschwander, A.L. Noise filtering techniques for photon-counting LADAR data. In Proceedings of the SPIE—The International Society for Optical Engineering, Baltimore, MD, USA, 23–27 April 2012; Volume 8379, p. 24. [Google Scholar]
  7. Zhu, X.; Wang, C.; Xi, X.; Nie, S.; Yang, X.; Li, D. Research progress on data processing and application of ICESat-2 on-board photon counting lidar. Infrared Laser Eng. 2020, 49, 76–85. [Google Scholar]
  8. Wang, M.; Wei, Y.; Yang, B.; Zhou, X. ICESat-2/ATLAS global elevation control point extraction and analysis. J. Wuhan Univ. (Inf. Sci. Ed.) 2021, 46, 184–192. [Google Scholar]
  9. Xia, S.B.; Wang, C.; Xi, X.H. ICESat-2 airborne test point cloud filtering and vegetation height inversion. J. Remote Sens. 2014, 18, 1199–1207. [Google Scholar]
  10. Zhu, X.; Nie, S.; Wang, C.; Xi, X.; Hu, Z. A Ground Elevation and Vegetation Height Retrieval Algorithm Using Micro-Pulse Photon-Counting Lidar Data. Remote Sens. 2018, 10, 1962. [Google Scholar] [CrossRef]
  11. Gwenzi, D.; Lefsky, M.A.; Suchdeo, V.P.; Harding, D.J. Prospects of the ICESat-2 laser altimetry mission for savanna ecosystem structural studies based on airborne simulation data. ISPRS J. Photogramm. Remote Sens. 2016, 118, 68–82. [Google Scholar] [CrossRef]
  12. Moussavi, M.S.; Abdalati, W.; Scambos, T.; Neuenschwander, A. Applicability of an automatic surface detection approach to micro-pulse photon-counting lidar altimetry data: Implications for canopy height retrieval from future ICESat-2 data. Int. J. Remote Sens. 2014, 35, 5263–5279. [Google Scholar] [CrossRef]
  13. Zhang, J.; Kerekes, J.; Csatho, B.; Schenk, T.; Wheelwright, R. A clustering approach for detection of ground in micropulse photon-counting LiDAR altimeter data. In Proceedings of the 2014 IEEE Geoscience and Remote Sensing Symposium, Quebec City, QC, Canada, 13–18 July 2014. [Google Scholar]
  14. Chen, B.; Pang, Y.; Li, Z.; Lu, H.; North, P.; Rosette, J.; Yan, M. Forest signal detection for photon counting LiDAR using Random Forest. Remote Sens. Lett. 2020, 11, 37–46. [Google Scholar] [CrossRef]
  15. Wang, L.; Zhang, X.; Zhang, Y.; Chen, F.; Dang, S.; Sun, T. A Density-Based Multilevel Terrain-Adaptive Noise Removal Method for ICESat-2 Photon-Counting Data. Sensors 2023, 23, 9742. [Google Scholar] [CrossRef] [PubMed]
  16. Zhang, S.; Li, G.; Zhou, X.; Yao, J.; Guo, J.; Tang, X. A single-photon point cloud denoising algorithm based on multi-feature adaptation. Infrared Laser Eng. 2022, 51, 32–42. [Google Scholar]
  17. Liu, J.; Liu, J.; Xie, H.; Ye, D.; Li, P. A Multi-Level Auto-Adaptive Noise-Filtering Algorithm for Land ICESat-2 Photon-Counting Data. Remote Sens. 2023, 15, 5176. [Google Scholar] [CrossRef]
  18. Neuenschwander, A.; Pitts, K. The ATL08 land and vegetation product for the ICESat-2 Mission. Remote Sens. Environ. 2019, 221, 247–259. [Google Scholar] [CrossRef]
  19. He, L.; Pang, Y.; Zhang, Z.; Liang, X.; Chen, B. ICESat-2 data classification and estimation of terrain height and canopy height. Int. J. Appl. Earth Obs. Geoinf. 2023, 118, 103233. [Google Scholar] [CrossRef]
  20. Kong, D.; Pang, Y. ICESat-2 data denoising and forest canopy height estimation using Machine Learning. Int. J. Appl. Earth Obs. Geoinf. 2024, 135, 104263. [Google Scholar] [CrossRef]
  21. Wang, R.; Lu, Y.; Lu, D.; Li, G. Improving extraction of forest canopy height through reprocessing ICESat-2 ATLAS and GEDI data in sparsely forested plain regions. GISci. Remote Sens. 2024, 61, 2396807. [Google Scholar] [CrossRef]
  22. Li, W.; Niu, Z.; Shang, R.; Qin, Y.; Wang, L.; Chen, H. High-resolution mapping of forest canopy height using machine learning by coupling ICESat-2 LiDAR with Sentinel-1, Sentinel-2 and Landsat-8 data. Int. J. Appl. Earth Obs. Geoinf. 2020, 92, 102163. [Google Scholar] [CrossRef]
  23. Narine, L.L.; Popescu, S.C.; Malambo, L. A Methodological Framework for Mapping Canopy Cover Using ICESat-2 in the Southern USA. Remote Sens. 2023, 15, 1548. [Google Scholar] [CrossRef]
  24. Narine, L.L.; Popescu, C.S.; Malambo, L. Using ICESat-2 to Estimate and Map Forest Aboveground Biomass: A First Example. Remote Sens. 2020, 12, 1824. [Google Scholar] [CrossRef]
  25. Neuenschwander, A.; Guenther, E.; White, J.C.; Duncanson, L.; Montesano, P. Validation of ICESat-2 terrain and canopy heights in boreal forests. Remote Sens. Environ. 2020, 251, 112110. [Google Scholar] [CrossRef]
  26. Lonesome, M.; Sorin, P. PhotonLabeler: An Inter-Disciplinary Platform for Visual Interpretation and Labeling of ICESat-2 Geolocated Photon Data. Remote Sens. 2020, 12, 3168. [Google Scholar] [CrossRef]
  27. Ester, M.; Kriegel, H.P.; Sander, J.; Xu, X. A Density-Based Algorithm for Discovering Clusters in Large Spatial Databases with Noise. In Proceedings of the National Conferences on Aritificial Intelligence, Orlando, FL, USA, 18–22 July1999. [Google Scholar]
  28. Cao, B.; Fang, Y.; Gao, L.; Hu, H.; Jiang, Z.; Sun, B.; Lou, L. An active-passive fusion strategy and accuracy evaluation for shallow water bathymetry based on ICESat-2 ATLAS laser point cloud and satellite remote sensing imagery. Int. J. Remote Sens. 2021, 42, 2783–2806. [Google Scholar] [CrossRef]
  29. Pan, J.; Gao, F.; Wang, J.; Zhang, J.; Liu, Q.; Deng, Y. A main direction-based noise removal algorithm for ICESat-2 photon-counting LiDAR data. J. Geod. 2024, 98, 80. [Google Scholar] [CrossRef]
  30. Yang, P.; Fu, H.; Zhu, J.; Li, Y.; Wang, C. An Elliptical Distance Based Photon Point Cloud Filtering Method in Forest Area. IEEE Geosci. Remote Sens. Lett. 2022, 19, 6504705. [Google Scholar] [CrossRef]
  31. Tang, J.; Xing, Y.; Wang, J.; Yang, H.; Wang, D.; Li, Y.; Zhang, A. A Multilevel Autoadaptive Denoising Algorithm Based on Forested Terrain Slope for ICESat-2 Photon-Counting Data. IEEE J. Sel. Top. Appl. Earth Obs. Remote Sens. 2024, 17, 16831–16846. [Google Scholar] [CrossRef]
Figure 1. Overview map of Gongbella River Nature Reserve.
Forests 16 00524 g001
Figure 2. Distribution of high background count rate photon point clouds ((a) Data 1, (b) Data 2, (c) Data 3).
Forests 16 00524 g002
Figure 3. Distribution of low background count rate photon point clouds ((a) Data 4, (b) Data 5, (c) Data 6).
Forests 16 00524 g003
Figure 4. Technology roadmap for directionally adaptive DBSCAN-based denoising algorithm.
Forests 16 00524 g004
Figure 5. Profile of the original photon point cloud.
Forests 16 00524 g005
Figure 6. Coarse denoising map of photon point cloud (a) and zoomed-in map (red outline) of coarse denoising results (b,c).
Forests 16 00524 g006
Figure 7. Schematic diagram of the principle of the DBSCAN algorithm.
Forests 16 00524 g007
Figure 8. Schematic diagram of the principle of K-Means algorithm.
Forests 16 00524 g008
Figure 9. Effect of Different MinPts Values on Denoising Results. (a) Denoising result with MinPts = 2, (b) Denoising result with MinPts = 12).
Forests 16 00524 g009
Figure 10. Fine denoising map of photon point cloud (a) and zoomed-in map (red outline) of fine denoising result (b,c).
Forests 16 00524 g010
Figure 11. Photon raw point cloud profiles of representative regions (a,b).
Forests 16 00524 g011
Figure 12. Photon raw point cloud profiles of representative regions. (a) Data 1 coarse denoising results. (b) Data 2 coarse denoising results. (c) Data 3 coarse denoising results. (d) Data 4 coarse denoising results. (e) Data 5 coarse denoising results. (f) Data 6 coarse denoising results.
Forests 16 00524 g012aForests 16 00524 g012b
Figure 13. Fine denoising result graph (Data1–Data6, where (a) is the denoising result of the ATL08 algorithm and (b) is the denoising result of this paper’s algorithm).
Forests 16 00524 g013aForests 16 00524 g013b
Figure 14. Statistics for the number of data1, data2, and data3 photons.
Forests 16 00524 g014
Figure 15. Statistics of the number of data4, data5, and data6 photons.
Forests 16 00524 g015
Table 1. Comparative Summary of ICESat-2 Photon Denoising Methods.
Method CategoryKey ApproachAdvantagesLimitations
Local Distance Statistical Parameter ProcessingAdaptive density-based clustering with shape-modified search regionAdapts to diverse landforms; improved denoising performancePoor performance under high noise and low signal-to-noise ratios
Density-Based Spatial ClusteringMultilevel Adaptive Filtering (MLANF) with enhanced DBSCANAccurate extraction across diverse land types; robust denoisingIncreased computational complexity; sensitive to parameter tuning
Multi-Feature AdaptationParallelogram filter kernels with slope-based feature adaptationSuperior performance in steep slopes and inconsistent noiseReduced efficiency for large-scale datasets
Raster Image-Based ProcessingRasterization of photon point cloudsSimple implementationPoor accuracy due to point cloud rasterization
Official NASA ATL08 AlgorithmDRAGANN algorithm with differential and adaptive filteringEfficient batch processing of large datasetsIgnores neighboring point cloud continuity
Table 2. ATL03 data used in this experiment.
DateStripData NumberData Acquisition TimePhoton Background Count Rate
7 March 2023GT1LData 1DaytimeHigh
GT2LData 2DaytimeHigh
GT3LData 3DaytimeHigh
6 August 2023GT1LData 4NighttimeLow
GT2LData 5NighttimeLow
GT3LData 6NighttimeLow
Table 3. Effects of Different Eps and MinPts Values on De-noising Results.
EpsMinPtsDenoising Effect DescriptionImpact
0.001–0.052Over-clustering with many low-density points misclassified as core points, increasing noiseExcessive fragmentation, many points misclassified as noise, leading to fragmentation
0.05–0.13Over-clustering, with some points wrongly marked as core points, leading to split clustersOver-splitting of clusters, increased noise points, poor denoising effect
0.05–0.14Proper clustering with good denoising performance, recognizing most clustersBalanced clustering, fewer noise points, better denoising
0.05–0.16Stable clustering, well-preserved cluster structure, optimal denoisingBest denoising effect, effectively removing noise in moderate density point clouds
0.1–0.36Larger clustering range, some small clusters may be missed, but noise decreasesLarger clustering range, may miss small clusters but generally good denoising
0.1–0.38Looser clustering, larger Eps value may merge different clusters, leading to decreased accuracyOver-merging of clusters, poor denoising effect, smaller clusters missed
0.3–0.58Suitable for low-density point clouds, noise decreases, but medium-density clusters may be missedEffective for low-density point clouds, noise reduction, but medium-density clusters may be lost
0.3–0.512Over-loose clustering, many medium-density clusters missed, noise points increasePoor denoising effect, clusters missed, leading to increased noise
Notes: Eps (Long Axis Radius): Affects the clustering range; selecting the appropriate Eps is crucial for effective denoising. MinPts (Minimum Points): Determines whether a point is classified as a core point, influencing clustering quantity and denoising performance.
Table 4. Comparison of Denoising Performance: Direction-Adaptive DBSCAN vs. ATL08 Algorithm.
AspectDirection-Adaptive DBSCANATL08 Algorithms
Noise Photon RemovalEfficient removal of noise by analyzing local densityFixed-threshold method may misclassify signal photons as noise
Signal Photon RetentionEffectively retains signal photons, adjusts threshold dynamicallyStruggles to balance between denoising accuracy and signal retention
AdaptabilityHighly adaptable to different noise environments and terrainsFixed parameters; less effective in varying conditions
Robustness in Complex TerrainEffective in complex terrains due to density-based clusteringLess effective in varying terrains due to reliance on fixed thresholds
Computational EfficiencyMore efficient with large-scale data due to adaptive thresholdsMay require more computation due to static thresholding
Table 8. Denoising Results for Low Background Photon Counting Rate in the Gongbella River Reserve.
AlgorithmMetricDatasets (Low Background Photon Counting Rate)
Data 4Data 5Data 6
DBSCANP0.942340.928560.92918
R0.940180.937850.93584
Accuracy0.953760.928320.93221
F0.941260.933190.93251
ATL08P0.971450.960340.96142
R0.974020.968920.96956
Accuracy0.973630.946310.95411
F0.972230.964580.96547
Direction-adaptive DBSCANP0.9977230.9964720.996638
R0.998140.9981570.998166
Accuracy0.995910.9819640.994879
F0.9979320.9973140.997401
Table 9. Confidence Intervals (95%) for Precision and Recall under Low Background Photon Count Rate.
AlgorithmMetricLow Background Photon Count Rate (95% CI)
DBSCANP(0.9140, 0.9527)
DBSCANR(0.9326, 0.9434)
ATL08P(0.9492, 0.9796)
ATL08R(0.9639, 0.9777)
Direction-Adaptive DBSCANP(0.9953, 0.9986)
Direction-Adaptive DBSCANR(0.9981, 0.9982)
Table 10. t-test Results for Direction-Adaptive DBSCAN vs. DBSCAN, and ATL08 (Low Background Photon Count Rate).
MetricDirection-Adaptive DBSCAN vs. DBSCAN (t-Value)Direction-Adaptive DBSCAN vs. DBSCAN (p-Value)Direction-Adaptive DBSCAN vs. ATL08 (t-Value)Direction-Adaptive DBSCAN vs. ATL08 (p-Value)
P14.09650.0001 ***9.14380.0008 ***
R48.00420.0000 ***17.03280.0001 ***
Accuracy5.80740.0044 **3.54480.0239 *
F21.97350.0000 ***12.43140.0002 ***
Note: For the comparisons between Direction-Adaptive DBSCAN and ATL08, and DBSCAN, the p-values from the t-tests are marked with asterisks based on their significance level: “***“ indicates a highly significant difference (p < 0.01). “**“indicates a very significant difference (p < 0.05). “*” indicates a significant difference (p < 0.1). No asterisk indicates no significant difference (p ≥ 0.1).
Disclaimer/Publisher’s Note: The statements, opinions and data contained in all publications are solely those of the individual author(s) and contributor(s) and not of MDPI and/or the editor(s). MDPI and/or the editor(s) disclaim responsibility for any injury to people or property resulting from any ideas, methods, instructions or products referred to in the content.

