Article

The Impact of Microhabitat and Microtopography on the Photosynthetic Characteristics of Typical Karst Forest Plants in Guizhou, China

1
Guizhou Liping Rocky Desertification Ecosystem Observation and Research Station, Guizhou Academy of Forestry, Guiyang 550005, China
2
Guizhou Libo Karst Forest Ecosystem Observation and Research Station, Guizhou Academy of Forestry, Guiyang 550005, China
3
Guiyang Forest Chief Scheme Work Service Center, Guiyang 550002, China
4
Guizhou Provincial Center for Flood and Drought Disaster Prevention, Guiyang 550000, China
*
Authors to whom correspondence should be addressed.
Forests 2025, 16(3), 532; https://doi.org/10.3390/f16030532
Submission received: 11 February 2025 / Revised: 9 March 2025 / Accepted: 13 March 2025 / Published: 17 March 2025
(This article belongs to the Section Forest Ecophysiology and Biology)

Abstract

:
Twenty-four plants were studied in Guizhou province, China. Based on various microhabitats (soil surface, stone gully, and stone surface) and microtopographies (slope aspect, slope position, and slope degree), the photosynthetic characteristics of the plants were measured, including the net photosynthetic rate (Pn), carboxylation efficiency (CE), stomatal conductance (Gs), water use efficiency (WUE), transpiration rate (Tr), intercellular CO2 concentration (Ci), and light use efficiency (LUE). The results demonstrated remarkable variations in the WUE of four types of plants in three microhabitats, showing that stone gully > soil surface > stone surface; there were no remarkable variations in the Pn, Tr, Ci, Gs, CE, and LUE in the three microhabitats. The Pn, Tr, Gs, and LUE of deciduous trees exhibited remarkably higher values compared to the other species studied in the three microhabitats. The evergreen trees’ WUE was much higher than that of the other plants when they were growing on stone surfaces or in a stone gully. There were remarkable variations in the plants’ photosynthetic characteristics dependent on the microtopography. In terms of slope steepness, the Pn, CE, and LUE were the highest in plants on slopes ≤ 5°. Meanwhile, in terms of slope position, the Pn, Tr, CE, and LUE were highest for plants growing in depressions. Concerning slope aspect, the Pn, Gs, CE, and LUE reached the largest values in plants growing on flat land. Principal component analysis (PCA) indicated that the Pn, LUE, and WUE were the key photosynthetic parameters reflecting the adaptation of plants to karst environments. Correlation analysis revealed that the Pn and LUE displayed a striking positive correlation with the Tr, Ci, Gs, CE, and WUE. The Tr displayed a striking positive correlation with the Ci, Gs, CE, and LUE, while a striking negative correlation was observed with WUE. This study indicated that evergreen trees exhibit conservative strategies, while deciduous trees use strategies associated with high growth rates. This study provides insights important for the restoration and reconstruction of vegetation in karst regions.

1. Introduction

The karst region in Southwest China represents the most extensive expanse of carbonate rock formations globally, with an area of approximately 5.1 × 10⁷ hm2, which accounts for 5.3% of the total national area [1]. Within this region, Guizhou province has the largest area and is also the province with the most extensively developed karst landform in China [2]. Under the dissolution of carbonate rocks, karst regions have formed a broken, complex, and diverse microhabitat on the surface [3], which is mainly classified into the following types: crevice, channel, soil surface, pit, cave, stone gully, and stone surface. These are based on soil distribution and rock exposure [4,5]. A typical feature of the karst microhabitat is heterogeneity and diversity among types [6].
Photosynthesis serves as the primary driving force for plant growth and productivity in terrestrial ecosystems, providing the essential energy needed for plant growth [7]. Photosynthesis, as a basic physiological and biochemical process of plants, responds to environmental changes by adjusting to factors such as CO2 concentration, moisture, light, and temperature [8]. Microhabitats and microtopographies (e.g., slope position, slope, and aspect) are indirect environmental factors that can cause variations in ecological parameters such as soil moisture, light conditions, and temperature, thus having an important impact on a plant’s photosynthetic characteristics [9,10]. The differences in wind and soil moisture in various slope aspects were the dominant factors for the observed variation in the photosynthesis and growth of Taxus wallichiana var. chinensis (Pilg.) Florin [11]. The humidity at various slope positions was the dominant environmental factor controlling the photosynthetic rate of Hippophae rhamnoides L. [10]. The photosynthetic index of Medicago sativa L. exhibited an initial increase followed by a subsequent decrease as the slope degree increased [12]. The difference in soil moisture in various microhabitats was the primary reason for the variations in the photosynthetic characteristics of 10 species of karst plants [13]. The high rock exposure, shallow soil depth, discontinuous vegetation cover, and frequent dry–wet alternation in the karst habitat make vegetation restoration in karst mountain areas very difficult [14]. The photosynthetic characteristics of plants are some of the most important physiological attributes, reflecting the adaptability of plants to habitats; these characteristics are key when studying their productivity, often reflecting the resource utilization methods and growth strategies of plants [15]. By studying plant photosynthetic characteristics, plant photosynthetic efficiency was assessed in different microhabitats and microtopographies. At the same time, according to specific environmental conditions, plant species with high photosynthetic capacity and water use efficiency were selected for planting to improve the success rate of vegetation restoration. Therefore, exploring plants’ photosynthetic physiological characteristics in various microhabitats and microtopographies is helpful for understanding their material accumulation, water use status, carbon assimilation, and growth ability, as well as providing a foundational basis for investigating a plant’s ecological adaptability in karst regions. Additionally, identifying key traits of genetic resources plays an important role in understanding plant adaptability and resilience in karst environments. Determining these traits allows for the identification of characteristics that contribute to environmental tolerance and sustainable vegetation management [16,17].
Shady environment features, such as a wet climate, make the photosynthetic characteristics of plants an important indicator of plant survival and growth in karst regions [14]. Habitat is one of the critical factors that determines growth and photosynthetic changes in plants; these changes can also effectively reflect adaptation to habitat changes, which is a key factor when evaluating a plant’s adaptability to its environment [18]. At present, numerous studies have been conducted on the photosynthetic characteristics of plants in karst regions. The photosynthetic characteristics of Cladrastis platycarpa (Maxim.) Makino [19], Zanthoxylum bungeanum [20], Broussonetia papyrifera, and Rubus tsangii [21] were studied in karst regions. However, a study of the photosynthetic characteristics of single plants cannot efficiently express the plant’s adaptation strategies to complex habitats. At present, there are still very few studies on the photosynthetic characteristics of plants in karst regions relating to microtopography and microhabitat. In this paper, 24 typical karst forest plants were selected and correlation analysis and principal component analysis (PCA) were employed to (1) explore the variations in plant photosynthetic characteristics across various microhabitats in karst regions; (2) elucidate the effects of various microtopographies on plant photosynthetic characteristics; and (3) clarify the adaptation strategies of the dominant species of various plants. This study contributes to a deeper understanding of resource utilization by plants and aims to provide a theoretical foundation for species selection in vegetation restoration and reconstruction within ecologically fragile karst regions.

2. Materials and Methods
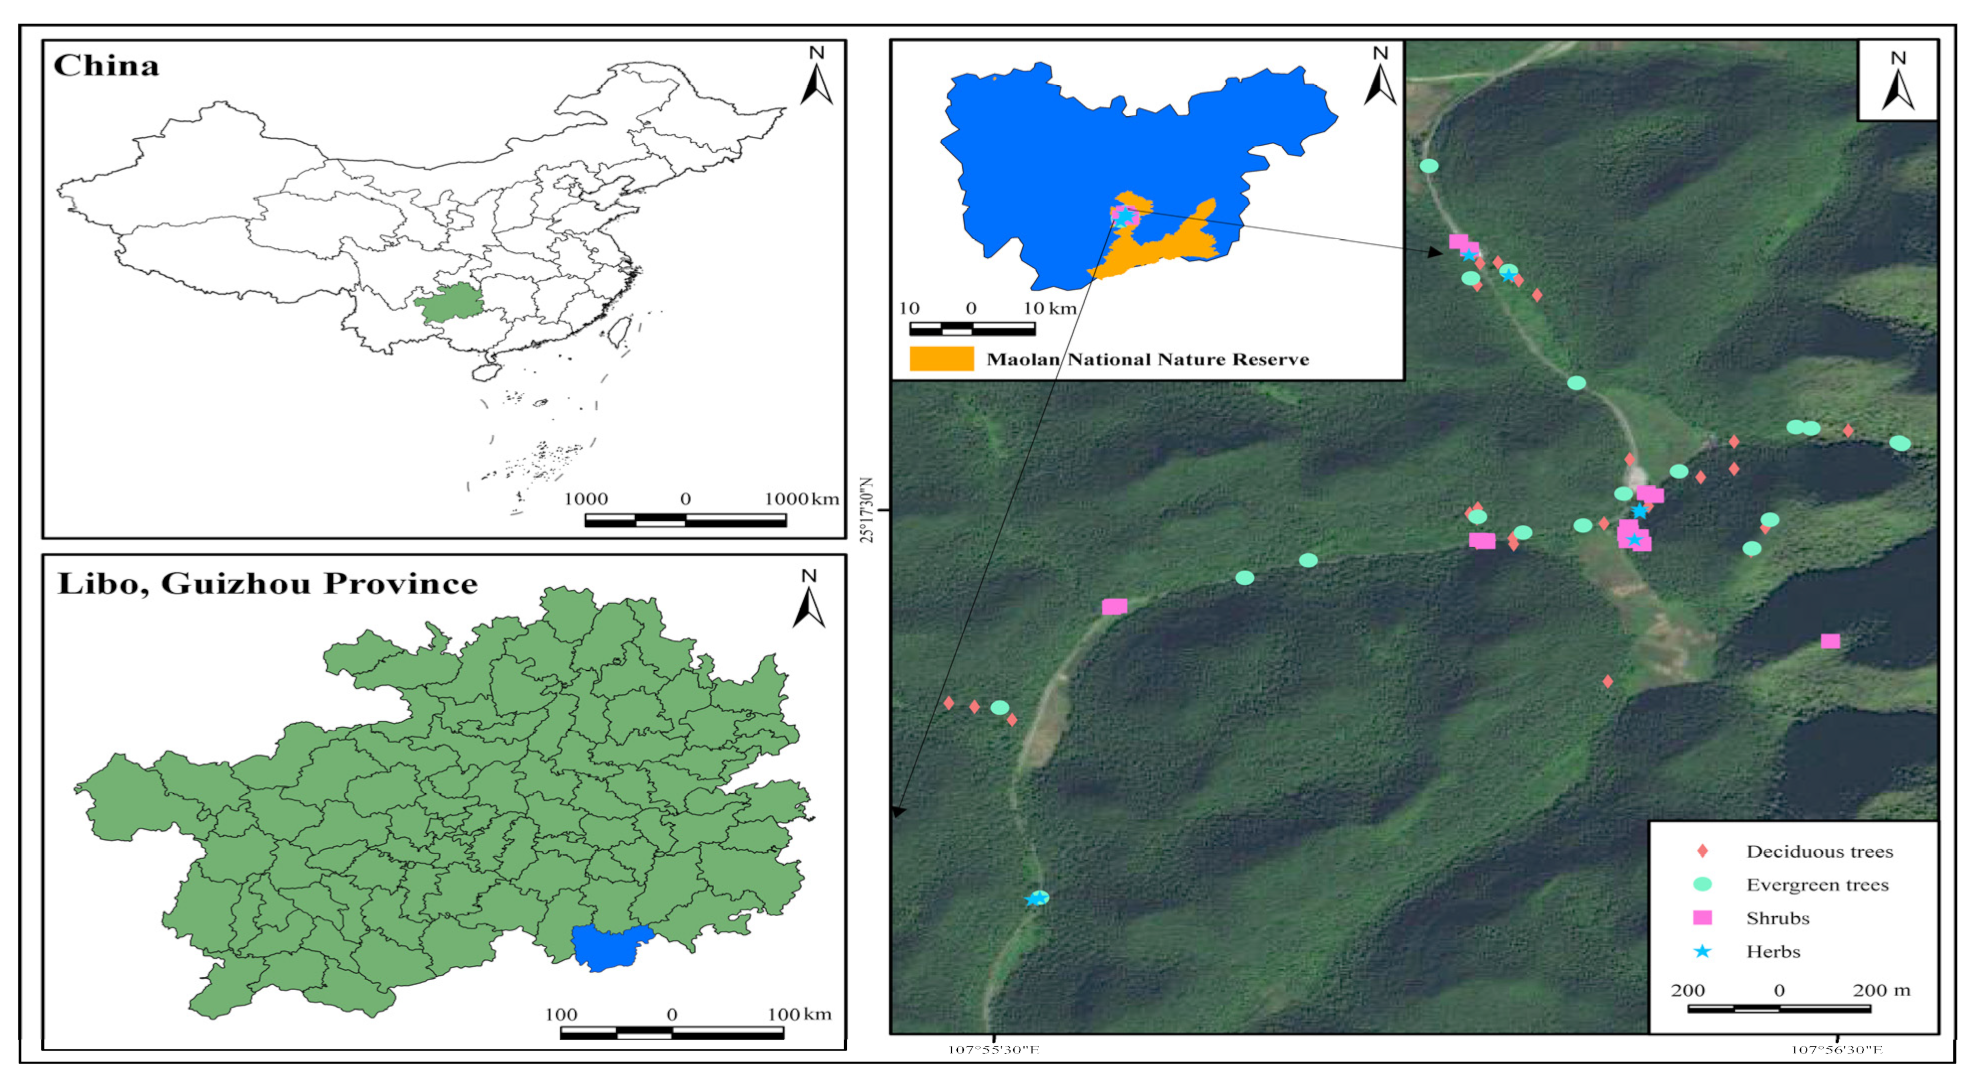
2.1. Study Region

The study region is situated in Guizhou Libo Karst Forest Ecosystem Observation and Research Station (107°52′10″ to 108°05′40″ E; 25°09′20″ to 25°20′50″ N) in Maolan National Nature Reserve in Guizhou province, which encompasses the largest expanse of primary forest in karst regions (Figure 1). The topography features higher elevations in the northwest and lower elevations in the southeast, with the highest point reaching 1078.6 m and the lowest point at 430.0 m; the average altitude ranges from 550 to 850 m. The region experiences a subtropical monsoon humid climate, with an annual average temperature of 18.3 °C. The average temperature in July is 23.5 °C; in January, it reaches 5.2 °C. The annual average humidity is 83.0%, and the annual average precipitation is 1752.5 mm. There are 1272.8 annual sunshine hours, with a frost-free period spanning 315 days; the total solar radiation for the year is 63,289.80 kW·m−2, and the accumulated temperature (≥10 °C) is 4598.6 °C. In this study, the soil considered is mainly black lime soil, which has good fertility and is abundant in organic matter and other essential nutrients [22].

2.2. Experimental Design

2.2.1. Microhabitat Type Classification

According to the soil distribution and the exposed rock region, the microhabitats of the region are divided into stone surfaces, stone gullies, and soil surfaces [5].
  • Stone surface: The exposed rate of bedrock is more than 50%. The groove depth is less than 30 cm when irregular bare rocks such as shallow small gullies, shallow stone pits, small grooves, and narrow stone crevices are formed. These are usually soil-less or are only covered by less than 1 m2 of soil; soil thickness is less than 20 cm in stone surfaces. Although the ventilation conditions are favorable, the rapid water loss, weak water and fertilizer retention capacity, and susceptibility to temporary drought create a harsh environment. The soil water holdup is 45.06% [5]. The soil pH is 7.15, the contents of K, N, C, P of soil were 13.15 g·kg−1, 14.55 g·kg−1, 171.19 g·kg−1, and 1.15 g·kg−1, respectively.
  • Stone gully: Under conditions in which the bare rock rate surpasses 50%, the groove depth is generally greater than 30 cm, with the soil coverage region being confined to below 1 m2. The soil thickness exceeds 20 cm when the groove depth is below 30 cm, or the soil layer is thicker than 20 cm when the groove depth is under 30 cm. Alternatively, the area is predominantly soil-covered with a groove depth exceeding 30 cm, provided the bare rock rate is below 50%. The soil layer is thicker, with improved water and fertilizer retention capabilities, making it less prone to short-term drought, subsequently resulting in relatively favorable conditions. The soil water holdup is 54.97% [5]. The soil pH is 7.04, and the contents of K, N, C, P of soil are 14.62 g·kg−1, 11.59 g·kg−1, 122.70 g·kg−1, and 0.97g·kg−1, respectively.
  • Soil surface: The contiguous soil coverage area exceeds 1 m2. For areas smaller than 1 m2, the bare rock rate is less than 50%, and the groove depth is under 30 cm. The soil layer is thicker, with enhanced water and fertilizer retention capacity, better ventilation conditions, and slower water loss, making the soil conditions relatively optimal, though short-term drought remains a possibility. The soil water holdup is 49.11% [5]. The soil pH is 6.56, and the contents of K, N, C, P of soil are 15.61g·kg−1, 7.34 g·kg−1, 79.79 g·kg−1, and 0.85 g·kg−1, respectively.

2.2.2. Microtopography Classification

Based on the specific microtopographic features of the study region, the slope positions were divided into four grades, the slope degrees were divided into five grades, and the slope aspects were divided into five grades (Table 1) [23].

2.2.3. Sampling Methods

In 2020, based on the investigation of the original fixed sample plots in the study region, the important values of species were calculated, and 24 dominant plants were selected (Table S1), including 8 evergreen trees (Symplocos anomala Brand, Lindera pulcherrima var. hemsleyana, Pittosporum brevicalyx, Beilschmiedia kweichowensis, Dendrobenthamia angustata, Cyclobalanopsis glauca, Acer wangchii, and Lindera communis), 6 deciduous trees (Swida wilsoniana, Platycarya strobilacea, Zenia insignis, Eurycorymbus cavaleriei, Sapium rotundifolium, and Handeliodendron bodinieri), 7 shrubs (Chimonobambusa angustifolia, Murraya exotica, Brassaiopsis glomerulata, Nandina domestica, Indocalamus tessellatus, Mahonia cardiophylla, and Miliusa sinensis), and 3 herbs (Pilea cavaleriei, Strobilanthes maolanensis, and Cyperus rotundus). The 24 dominant plants were distributed in each microhabitat, with no less than three individuals per species; in total, 75 species were sampled, and their diameter at breast height/ground diameter (cm) and height (m) were recorded. The slope aspect, slope degree, slope position, microhabitat type, elevation (m), latitude, and longitude were also recorded.

2.2.4. Measurement of Plant Photosynthetic Parameters

From July to September, under sunny weather conditions, photosynthetic physiological parameters were measured using an LI-6400 portable photosynthesis system (LI-COR, Inc., Lincoln, NE, USA).
The measurements were conducted using natural leaves, an open gas circuit, an air flow rate of 0.5 L·min−1, and a measurement period from 9:00 to 11:00. Before measuring, the plants were exposed to red–blue light at an intensity of 1200 μmol·m−2·s−1 for approximately 20 min.
Because mature leaves have a complete chloroplast and photosynthetic structure, they can better reflect the overall photosynthetic capacity of plants. In the experiment, healthy and mature leaves from the middle and upper sections of the plant were selected.
During the measurement process, the light intensity in the leaf chamber remained at 1200 μmol·m−2·s−1, with a CO2 concentration of 400 ± 10 μmol·mol−1 and a leaf chamber temperature of 26 ± 2 °C. The natural angle and direction of leaves were not changed during the experiment. Each plant was measured every hour, with one leaf being measured at a time; each measurement was repeated three times to obtain average values. The parameters included the intercellular CO2 concentration (Ci), net photosynthetic rate (Pn), stomatal conductance (Gs), and transpiration rate (Tr), along with the recording of leaf temperature (Tl), photosynthetically active radiation (PAR), leaf relative humidity (RH), air temperature (Ta), and atmospheric CO2 concentration (Ca).
For some tall tree species, the parameters were measured using the in vitro determination method [24], which involved rapidly immersing a detached branch in water, removing approximately 3 cm of the tough bark at the incision site, and removing the remaining leaves before conducting the relevant photosynthetic parameter measurements.

2.2.5. Calculation Method for Photosynthetic Parameters [25]

Water use efficiency (WUE), carboxylation efficiency (CE), light use efficiency (LUE) calculated using the following formulas:
Water use efficiency (WUE) = Pn/Tr
Carboxylation efficiency (CE) =Pn/Ci
Light use efficiency (LUE) = Pn/PAR

2.2.6. Data Processing and Analysis

SPSS 18.0 software (IBM, Chicago, IL, USA) was used to process the basic descriptive statistics of plants’ photosynthetic characteristics. The data were plotted and both principal component analysis (PCA) and Pearson’s correlation test were carried out using Origin 2021 (OriginLab, Northampton, MA, USA). A one-way ANOVA was used for significance analysis. When conducting correlation analysis, the one-way ANOVA, and t-tests, the data were assessed to ensure they met the assumptions of normal distribution and ANOVA requirements; all types of data were converted into natural logarithm form, i.e., ln (x + 1). When performing multiple comparisons, Levene’s test was initially employed to assess the homogeneity of variance. Based on the test results, the Tukey test was used for multiple comparisons when the data exhibited homogeneity of variance in the ANOVA. Conversely, the Tamhane’s T2 method was applied for multiple comparisons when the data did not meet the assumption of homogeneity of variance.
PCA was performed using Origin 2021. Evergreen trees, deciduous trees, shrubs, and herbs were assigned values of 1~4, respectively, to explore the relationship between microhabitat and photosynthetic characteristics. Additionally, the relationship between topographic factors and photosynthetic characteristics was investigated. Among them, depression, downslope, midslope, and upslope were assigned values of 1~4, respectively. Slope degrees of ≤5°, 5~15°, 15~25°, 25~35°, and ≥35° were assigned values of 1~5, respectively. Shady slopes, semi-shady slopes, semi-sunny slopes, sunny slopes, and flat land were assigned values of 1~5, respectively.

3. Results

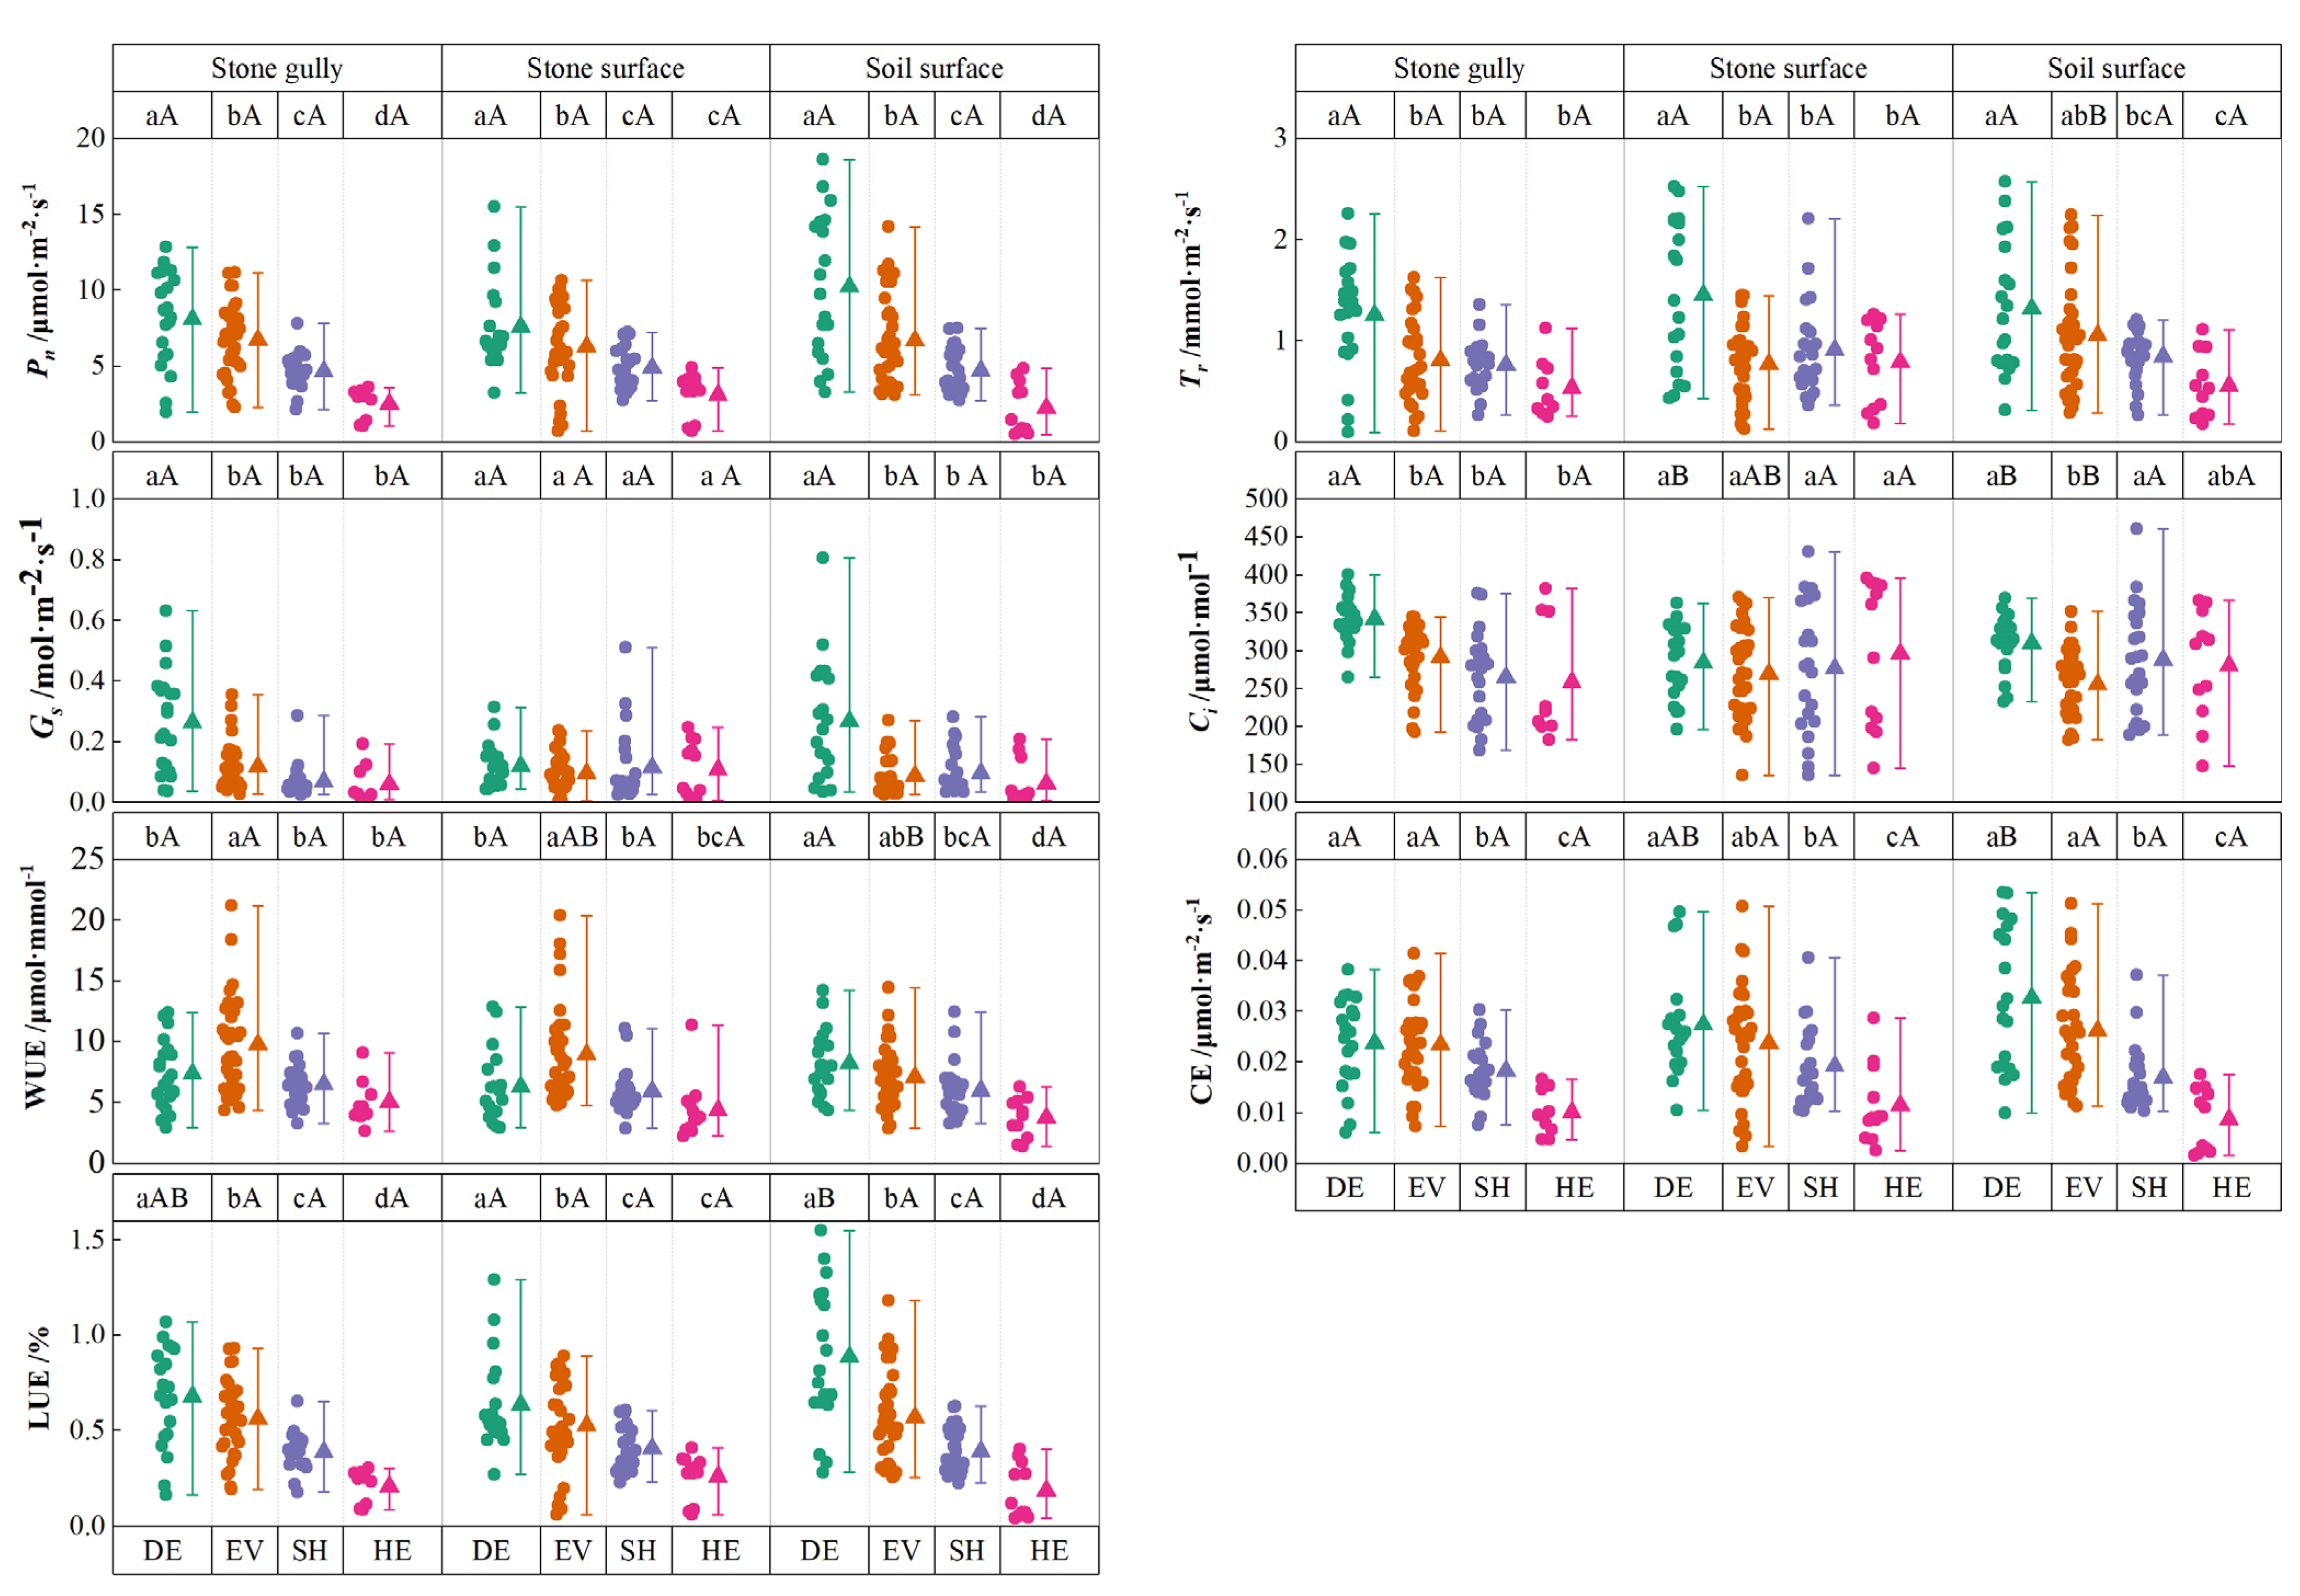
3.1. Plant Photosynthetic Characteristics in Various Microhabitats

The results demonstrated that the plants’ photosynthetic characteristics exhibited remarkable variations across various microhabitats (Table 2). In particular, the WUE value indicated remarkable variations across various microhabitats (p < 0.05), whereby stone gully > soil surface > stone surface. The other photosynthetic parameters did not exhibit remarkable variations among the three microhabitats (p > 0.05). The results indicated that plants could maintain a higher photosynthetic rate with less water consumption in stone gully.
There are variations in the photosynthetic characteristics of various flora in the same microhabitat (Figure 2). For soil surfaces, the values for the Pn, WUE, Ci, Tr, Gs, CE, and LUE of deciduous trees exhibited remarkably higher values compared to the other types of plant life (p < 0.05). Similarly, in both stone surfaces and stone gullies, deciduous trees also had higher values in almost all parameters compared to the other types of plant life; the WUE of evergreen trees was, as expected, much greater than that of other types of plant life (p < 0.05). This suggested that the high photosynthetic characteristics of deciduous trees facilitated the accumulation of more organic matter, enhanced light utilization efficiency, and promoted better growth. In contrast, evergreen trees exhibited high water use efficiency and strong drought resistance.
Most of the photosynthetic parameters of deciduous tree species were not remarkably varied across the three habitats (p > 0.05). Comparatively speaking, deciduous tree species had the highest values of Ci and CE in stone gullies, whereas the LUE value was the highest in the soil surface (p < 0.05). The evergreen tree species indicated better photosynthetic characteristics in stone gullies, with the highest values for WUE and Ci; however, the Tr was the highest for plants on soil surfaces (p < 0.05). The variations in the other parameters were not significant between the various habitats (p > 0.05). There was no statistically significant difference in the photosynthetic characteristics of shrubs and herbs in the three microhabitats (p > 0.05). This indicated that evergreen trees and deciduous trees exhibited distinct responses to different microhabitats, whereas shrubs and herbs indicated no significant differences across the three microhabitats, likely due to the genetic influence on plant adaptation.

3.2. Plant Photosynthetic Characteristics in Various Microtopographies

3.2.1. Plant Photosynthetic Characteristics in Various Slope Aspects

There were variations in plant photosynthetic characteristics in various slope aspects (Figure 3). Except for WUE, the photosynthetic parameters in various slope aspects were remarkably varied (p < 0.05). The Pn, Tr, CE, and LUE values for plants growing on flat land were much higher than for plants growing on semi-shady slopes. The Gs value of plants from shady slopes was markedly higher than that of plants from semi-sunny slopes. The Ci value of shady-slope plants was considerably larger than that of sunny-slope plants.

3.2.2. Plant Photosynthetic Characteristics in Various Slope Positions

There were variations in the photosynthetic characteristics of plants across various slope positions (Figure 4). Except for the WUE, the photosynthetic parameters in various slope positions were remarkably varied (p < 0.05). The Pn, Gs, CE, and LUE values for plants in depressions were greater than those for plants on upslopes. The Tr was higher in plants in depressions than those on upslopes. The Ci was higher in plants in depressions than those in midslope positions.

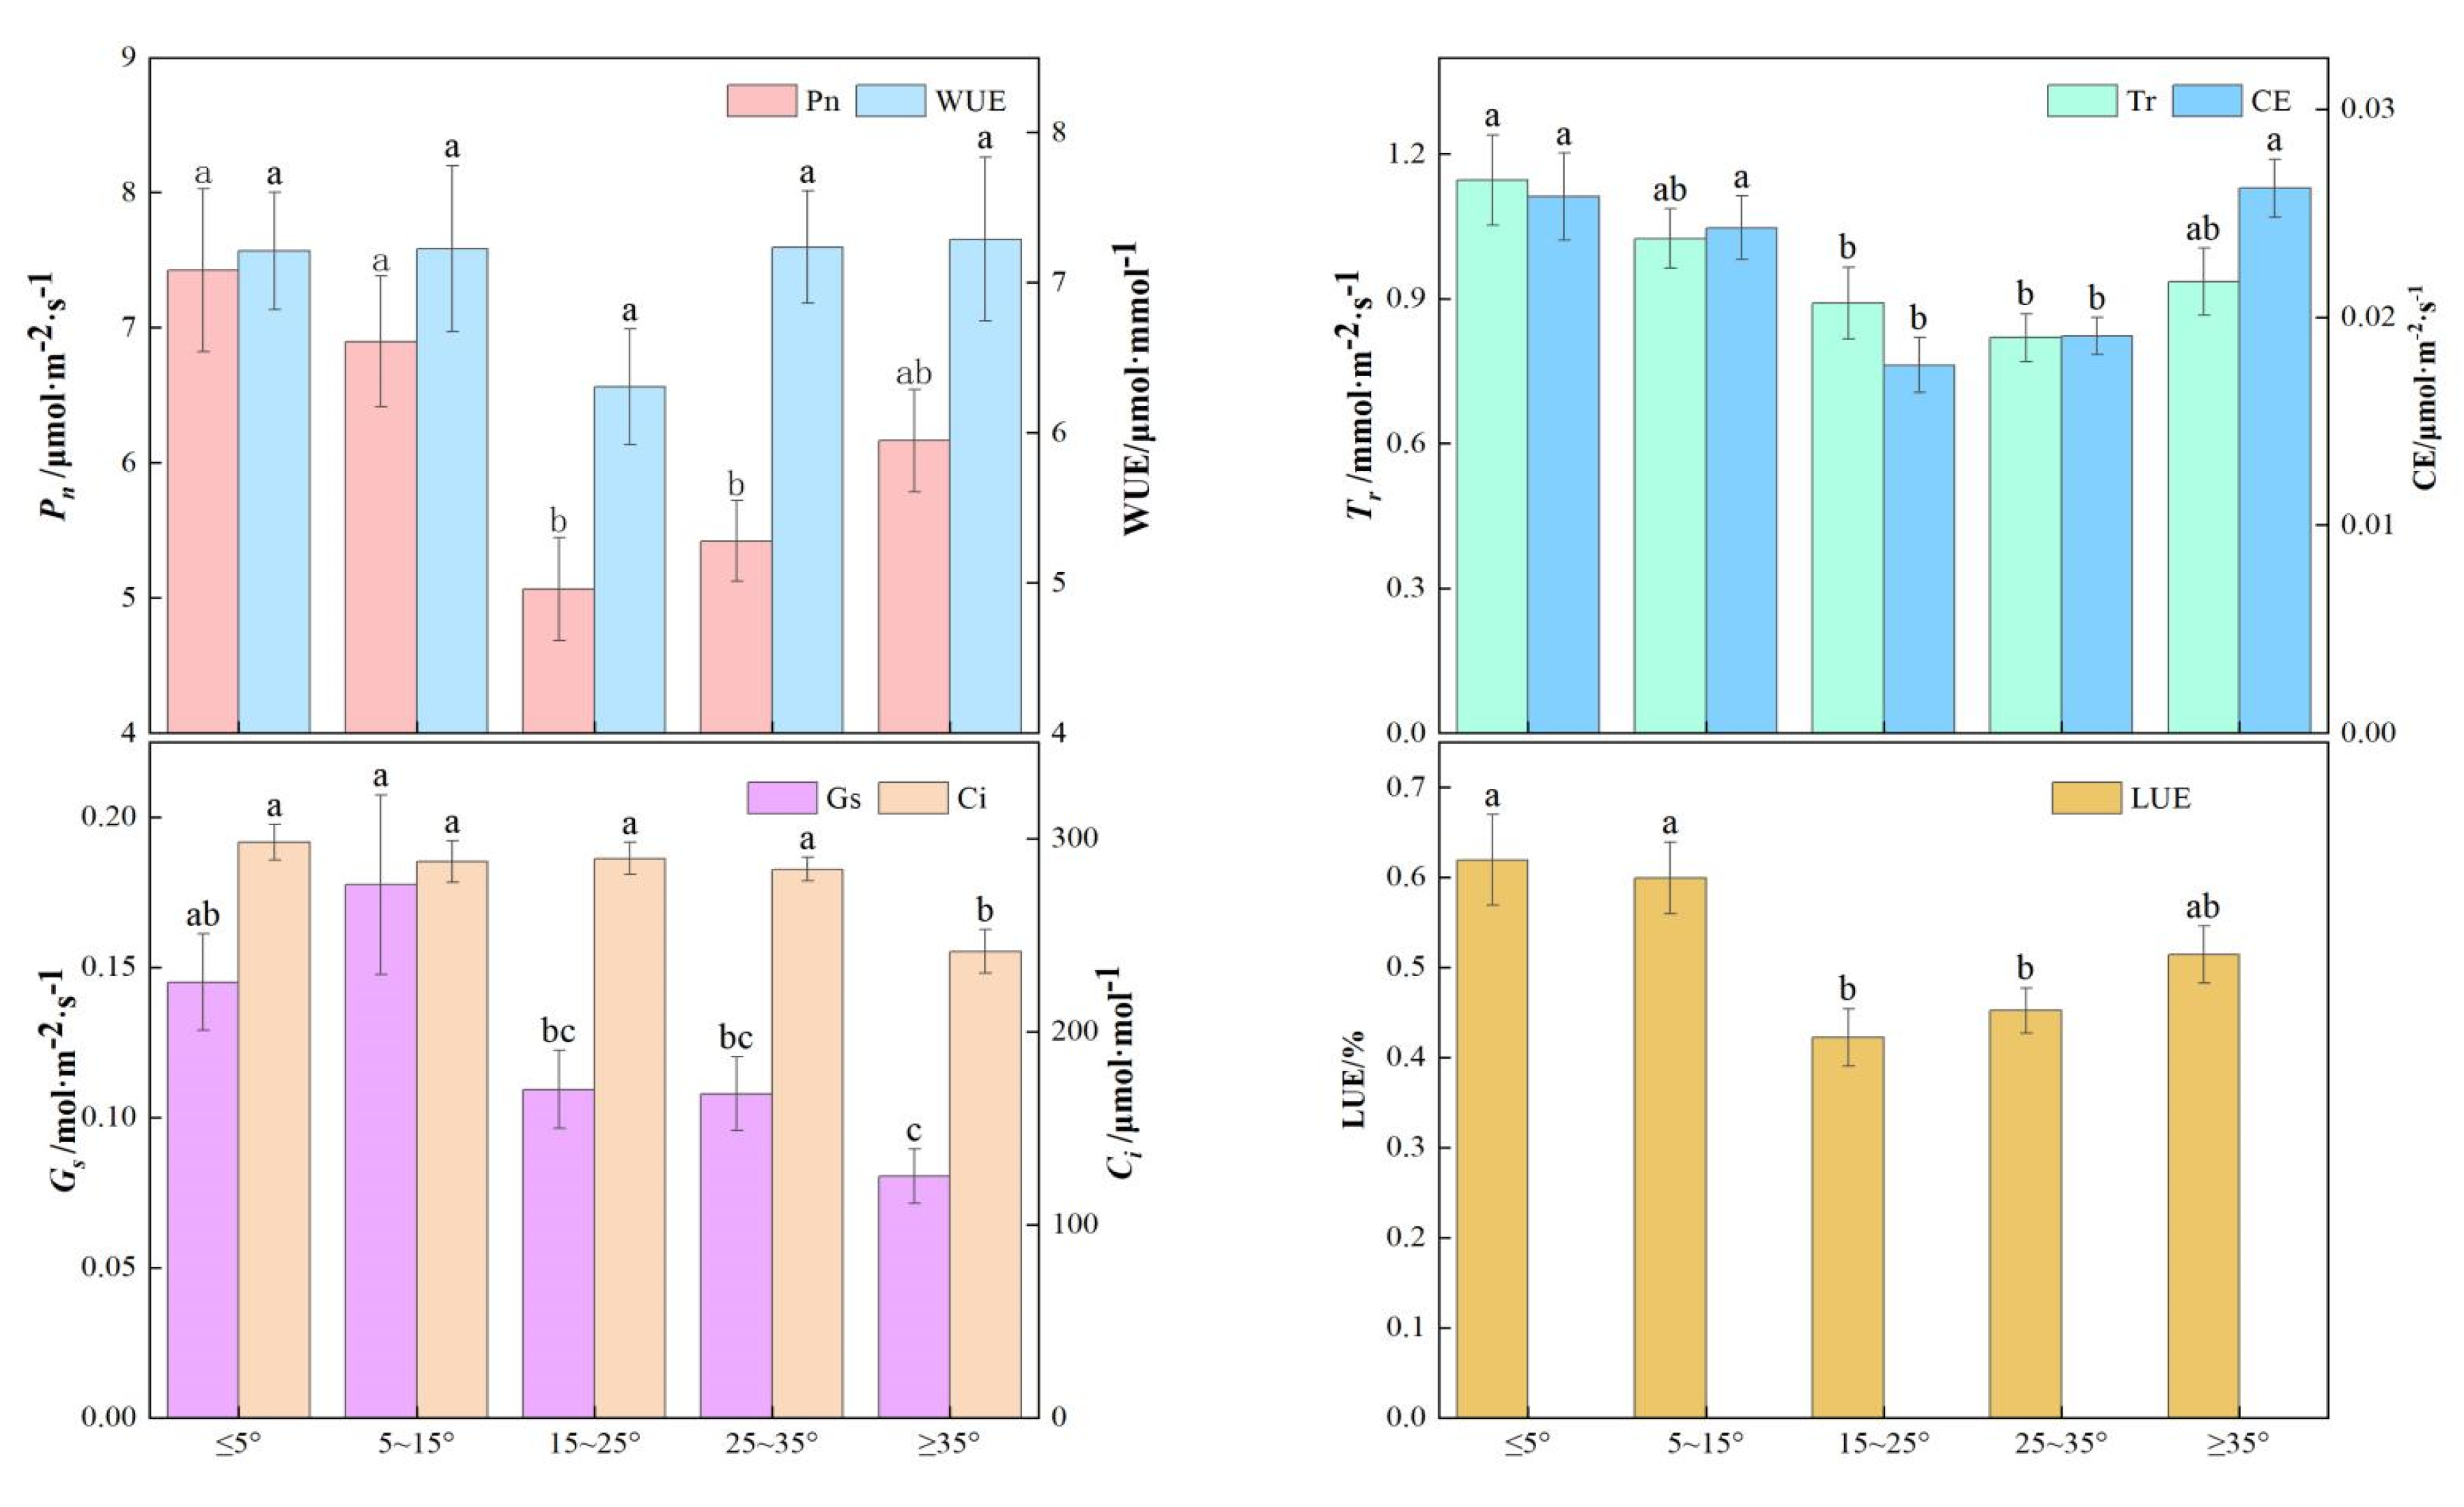
3.2.3. Plant Photosynthetic Characteristics in Various Slope Degrees

There are variations in the photosynthetic characteristics of plants based on the steepness of the slope they are growing on (Figure 5). Except for WUE, the photosynthetic parameters were remarkably varied depending on the slope steepness (p < 0.05). The Pn, CE, and LUE values were larger for plants growing on slopes ≤5° than those growing on slopes of 15~25°. The Tr was higher in plants from slopes ≤5° than those from slopes of 25~35°. The Ci was higher in plants from slopes of ≤5° than those from slopes of ≥35°. The Gs was higher in plants from slopes of 5~15° than those from slopes of ≥35°.

3.3. Relationship Between Plant Photosynthetic Characteristics and Microhabitat

The PCA biplot illustrates the relationship between photosynthetic characteristics and microhabitats (Figure 6A–C). The results indicated that the various types of plant were distributed differently in microhabitats. For stone surfaces, the rates of the contribution of PC1 and PC2 to the total variance were 51.7% and 29.4%, respectively, and the cumulative rate of contribution was 81.1%. Evergreen trees were mainly located in the negative region of PC2, with higher values for the Pn, WUE, CE, and LUE. Deciduous trees were mainly located in the positive region of PC1, with higher values for the Pn, Tr, Ci, Gs, WUE, CE, and LUE. For stone gullies, the rates of contribution of PC1 and PC2 to the total variance were 60.1% and 20.1%, respectively, and the cumulative rate of contribution was 80.1%. Evergreen trees and deciduous trees were mainly located in the positive region of PC1, with higher values for the Pn, Tr, Ci, Gs, WUE, CE, and LUE. For soil surfaces, the rates of contribution of PC1 and PC2 to the total variance were 62.3% and 19.6%, respectively, and the cumulative rate of contribution was 81.9%. Evergreen trees were mainly located in the negative region of PC2, with higher values for the Pn, WUE, CE, and LUE. Deciduous trees were mainly located in the positive region of PC1, with higher values for the Pn, Tr, Ci, Gs, WUE, CE, and LUE. This indicated that evergreen and deciduous trees exhibited higher photosynthetic efficiency and drought resistance across the three microhabitats, enabling them to withstand adverse external conditions and adapt effectively to karst habitats. Most of the herbs and shrubs in the three microhabitats were located in the negative region of the PC1, indicating that they had a weak photosynthetic capacity in the three microhabitats.

3.4. Relationship Between Plant Photosynthetic Characteristics and Microtopographies

PCA was conducted between seven photosynthetic factors and three topographic factors (Figure 6D). The results indicated that the rates of contribution of PC1 and PC2 to the total variance were as follows. PC1 accounted for 42.8%, while PC2 contributed 16.6%, leading to a cumulative rate of contribution of 59.4%. The Pn, Tr, Ci, Gs, WUE, CE, and LUE values decreased as the slope degree increased and the plant’s position on the slope rose. This shows that the higher the slope degree and slope position, the lower the plant photosynthetic rate and the slower the growth. However, the Pn, Tr, Ci, Gs, WUE, CE, and LUE values increased when the slope faced the sun. Moreover, the aspect had the greatest influence on Ci, indicating that plants exhibited an elevated photosynthetic rate accompanied by notably quicker growth.

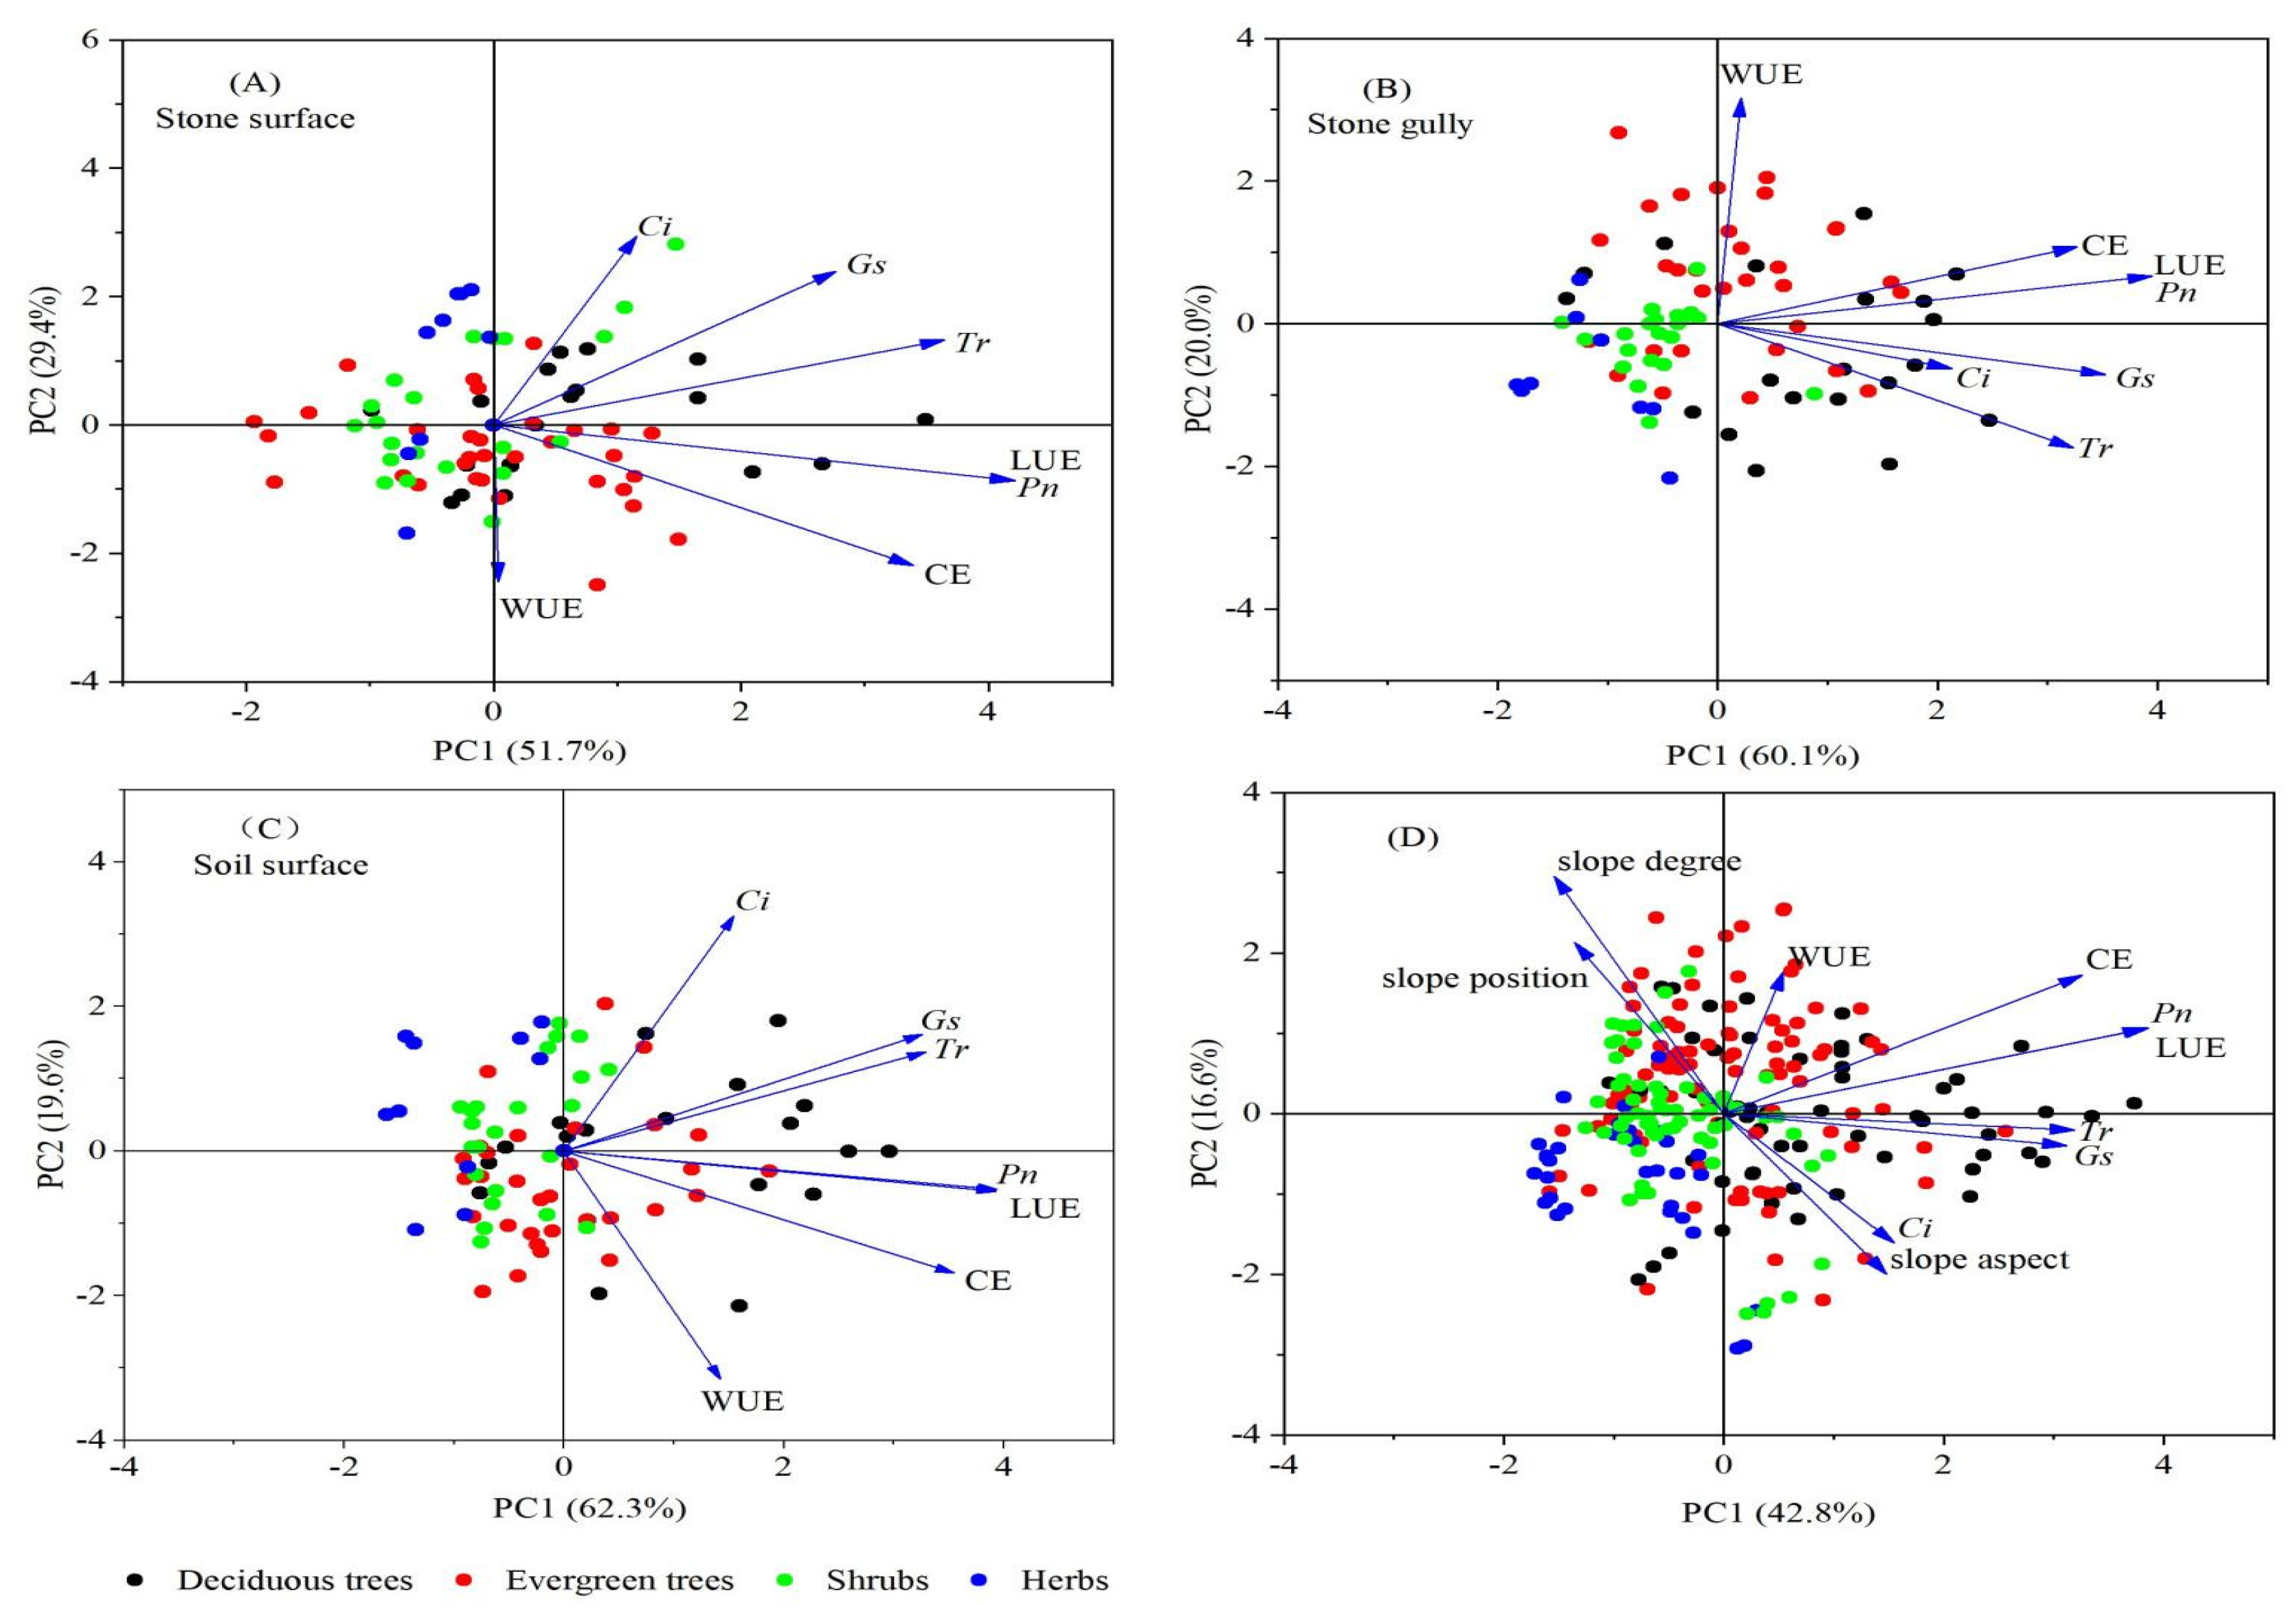
3.5. PCA of Plant Photosynthetic Characteristics

PCA was performed on seven photosynthetic characteristics parameters of 24 plant species in the karst microhabitat (Table 3). The analysis indicated that the rates of contribution of PC1 and PC2 to the total variance were as follows: PC1 accounted for 57.59%, while PC2 contributed 22.06%, leading to a cumulative rate of contribution of 79.65%. The coefficients for x1 and x7 in PC1 were the largest, at 0.49, indicating that Pn and LUE had a higher weight. For PC2, the coefficient of x5 exhibited the largest absolute value, which was 0.57, indicating that WUE has a higher load. This indicated that the main parameters of plant photosynthetic characteristics in karst regions were Pn and LUE, followed by WUE.

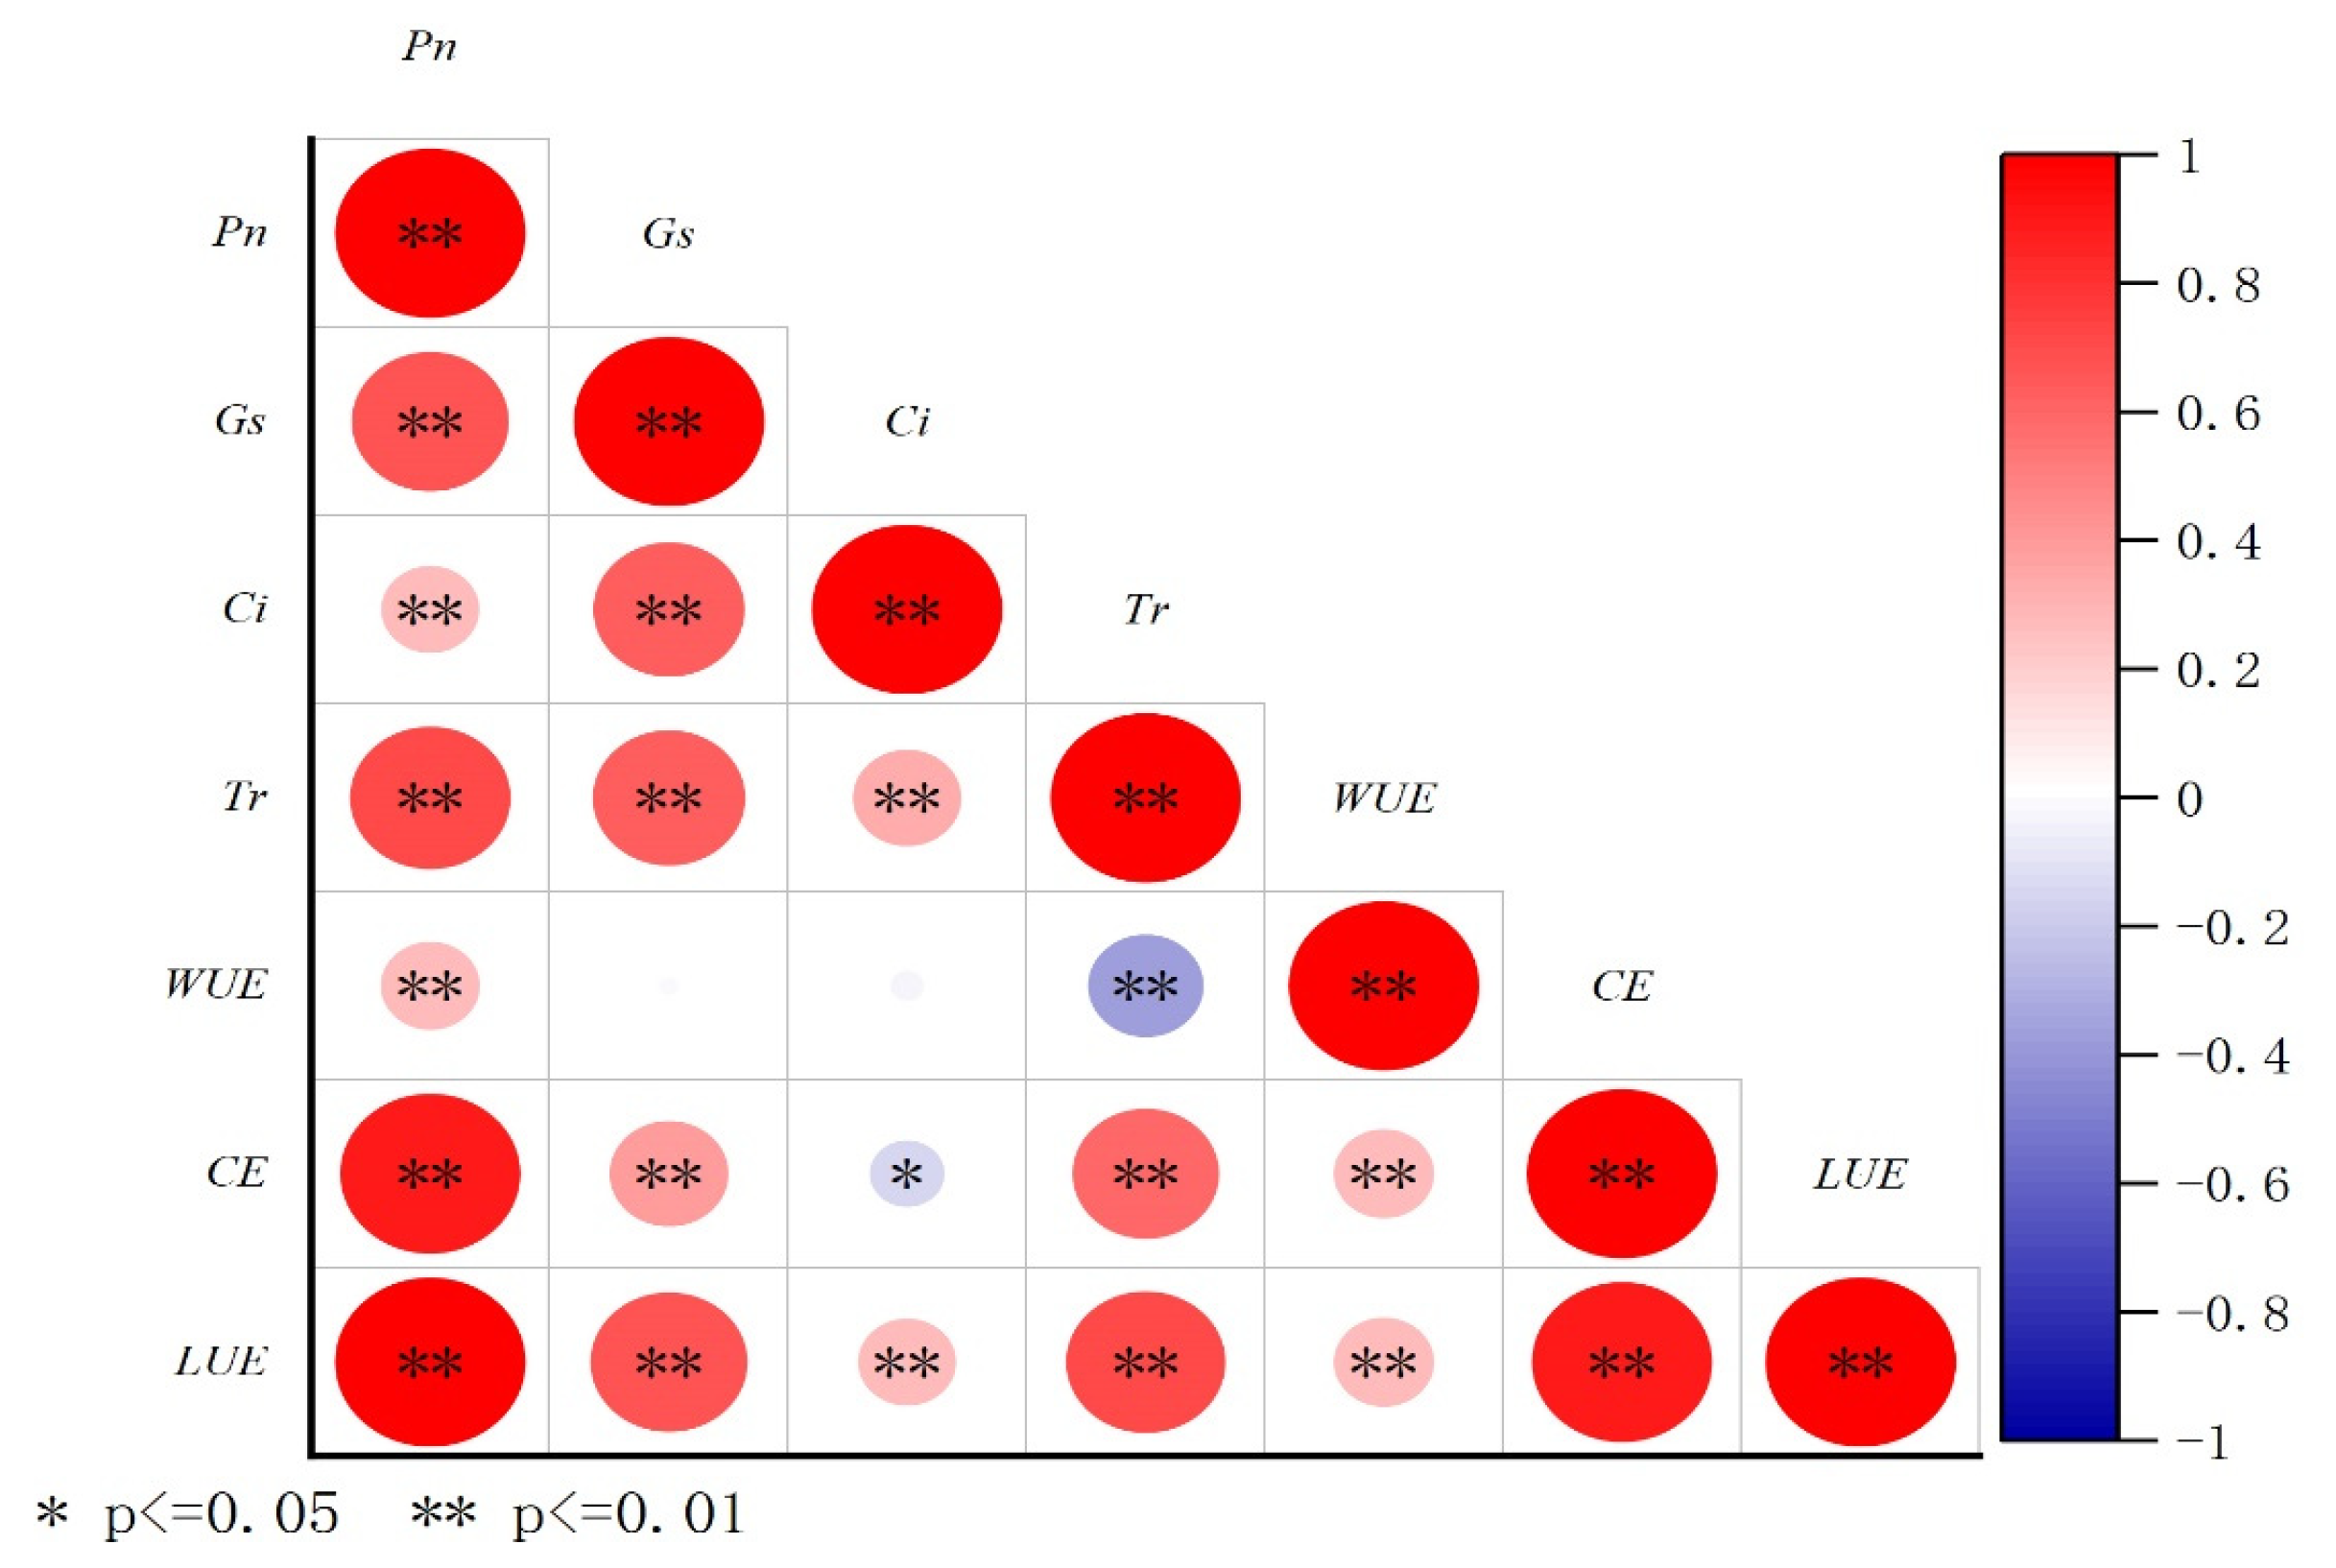
3.6. The Correlation of Plant Photosynthetic Characteristics

The Pearson correlation analysis results (Figure 7) indicated that Pn and LUE displayed a striking positive correlation with Tr, Ci, Gs, CE, and WUE (p < 0.01), suggesting that plants with a higher photosynthetic capacity also developed more effective water and light utilization strategies. The Tr value indicated a striking positive correlation with the Ci, Gs, CE, and LUE (p < 0.01), as well as a striking negative correlation with WUE (p < 0.01). The WUE value indicated a striking positive correlation with CE and LUE (p < 0.01); this indicates that Pn and Tr are directly affected by the opening and closing of plant stomata. In karst regions, the WUE decreased as the plant transpiration rate increased.

4. Discussion

4.1. Response of Plant Photosynthetic Characteristics to Microhabitat

In this study, the Pn, Tr, Gs, and LUE values of deciduous trees were remarkably higher compared to those of other plants in the three microhabitats (p < 0.05). The Pn value of deciduous trees was the highest in the three microhabitats. This indicated that deciduous trees had a stronger photosynthetic capacity in the karst environment. These findings suggested that deciduous trees possess a more efficient photosynthetic system in karst environments, likely due to their ability to optimize light capture and carbon assimilation under limited-resource conditions [26]. LUE reflects the efficiency of plants in utilizing light intensity [27]. The LUE value of deciduous trees growing in soil surfaces was remarkably higher than that from the same tress growing in stone gullies or stone surfaces (p < 0.05) and also greater than the light energy utilization efficiency of deciduous trees such as Sapindus mukorossi Gaertn. and Liriodendron chinense (Hemsl.) Sarg. in the karst regions [28], indicating that deciduous trees can efficiently utilize light and heat resources to produce more organic matter in the soil surface, which is also conducive to improving ecological benefits. This may be due to the thick soil layer of the soil surface, as well as the fact that the soil is more continuous and does not easily lose water; moreover, the ventilation conditions are sufficient and more conducive to the growth of deciduous trees. These findings suggest that the deciduous trees possess a more efficient photosynthetic system in karst environments, likely due to their ability to optimize light capture and carbon assimilation under limited-resource conditions.
In karst regions, 75%~85% of the rainfall is concentrated in the rainy season; the soil layer is shallow and discontinuous with a low water-holding capacity, often subjecting plants to water stress [14]; and the WUE of plants becomes a limiting factor. WUE is an important factor that reflects the relationship between photosynthetic carbon assimilation and the water use of plants. It serves as a comprehensive physiological and ecological indicator for assessing a plant’s adaptability to the environment [29]. Higher WUE values indicate that a plant can synthesize more assimilates with less water, indicating stronger drought adaptation and resistance [30]. This study indicated that there were remarkable variations in the WUE (p < 0.05) of four types of plant life in three microhabitats, showing that stone gullies > soil surfaces > stone surfaces. This result varies from that of some studies, which suggest that WUE will gradually increase with the deterioration of ecological conditions [31]. The same types of plants were selected in the three microhabitats in this experiment. In stone gullies, plants need to use less water to fix CO2, the photosynthetic assimilation ability of plants is greater, the production capacity is higher, and the plants grow rapidly. The bedrock protrusions on both sides of the stone gully and the gully-type structure in the middle play a role in the accumulation of litter [32]. Stone gullies can store more water and nutrients when encountering rainwater erosion. This results in the soil moisture content and temperature being relatively high and not easily dissipated after heating [33]. The fluctuation in hydrothermal conditions is relatively stable, which makes stone gullies suitable for plant growth [13]. Temporary arid environments can easily form on stone surfaces and cause plants to be subjected to drought stress; the transpiration rate of plants is high, so the water conservancy efficiency is low [33]. In stone gully and stone surface environments, the WUE of evergreen trees was remarkably superior to that of other plant types (p < 0.05), and the Pn was higher, indicating that evergreen trees had a stronger adaptability to drought environments.
CO2 is one of the most important molecules in photosynthetic reactions; therefore, the level of Ci directly affects the photosynthetic capacity [34]. The Ci was affected by leaf photosynthetic consumption, the external CO2 concentration, and stomatal conductance [35]. In this study, the Ci values of deciduous trees and evergreen trees growing in stone gullies were remarkably higher than those the same types of trees growing on stone or soil surfaces (p < 0.05). The CE reflects the Rubisco enzyme activity and dry matter accumulation in the photosynthesis of plant mesophyll cells [21], as well as the assimilation of CO2 into the intercellular space by leaves. The higher the CE value, the more sufficient the utilization of CO2 during photosynthesis [36]. The CE values of deciduous trees growing in stone gullies or stone surfaces were much lower than those of deciduous trees growing in soil surfaces (p < 0.05). The CE value was largest for deciduous trees grown in soil surfaces. In soil surfaces, deciduous trees can efficiently utilize CO2 from the atmosphere in the intercellular space, as well as using the CO2 produced by their respiration under the conditions of limited stomatal conductance and a limited inorganic carbon source, indicating that deciduous trees have a higher electron transfer efficiency in the photosystem of soil surfaces. This shows that the plant photosynthetic characteristics in various microhabitats reflect a plant’s adaptation to specific environmental photosynthetic physiology in karst regions.
The results also indicated that the other photosynthetic parameters of the 24 plants did not exhibit remarkable variations among the three microhabitats (p > 0.05), with WUE being an exception. Because the 24 plants used were based on the previous sample survey, through the calculation of important values, the dominant tree species in the region could be identified. The results indicated that the 24 plants were not sensitive to the changes in various microhabitats and were also adapted to the geological conditions in karst regions.

4.2. Response of Plant Physiological Characteristics to Microtopography

In this study, there were remarkable variations in the Pn, Tr, Ci, Gs, CE, and LUE values of plants in relation to slope positions, slope degrees, and slope aspects (p < 0.05). According to PCA, the slope degree had the most remarkable effect on plant photosynthetic characteristics, followed by slope aspect and slope position.
Geographical factors indirectly affect plant photosynthetic characteristics by affecting the spatial arrangement of various factors such as water, light, soil, and temperature [37]. In this study, the values of photosynthetic parameters decreased as the slope degree increased and the slope position rose, indicating that the higher the slope degree and slope position, the lower the photosynthetic parameters of plants and the slower the growth. In this study, the Pn, CE, and LUE values of plants were the highest on flat land (p < 0.05). Because the soil drought stress increased as slope gradient increased [38], in order to protect the plant’s water deficit, stomatal opening was stopped or reduced [39] so that the values of Gs and Ci were lower, resulting in the other photosynthetic parameters also being lower.
In this study, the Pn, Gs, CE, and LUE values were largest in plants growing in depressions and smallest in plants growing on upslopes (p < 0.05). Plants in depression regions exhibited the highest Pn, Gs, CE, and LUE values, likely due to greater soil moisture availability and lower evaporative stress. Conversely, plants in sloped regions faced significant water limitations, resulting in reduced stomatal conductance and lower photosynthetic rates.
In this study, the slope aspect was significantly positively correlated with the Ci of plants; the Ci increased when the slope faced the sun. The photosynthetic parameters of plants growing on flat land were the highest in various aspects (p < 0.05). Plants on flat land had a strong ability to assimilate CO2 into the intercellular space and had a high utilization rate of CO2. They had a strong ability to use light, which increased the photosynthetic rate of the plants. This may be because soil moisture conditions in flat land are better, and plants can obtain more photosynthetically active radiation [40].

4.3. Strategies of Plants for Adapting to Microhabitats

Through PCA, it was found that the main indicators of the photosynthetic characteristics of plants were Pn, LUE, and WUE. Upon correlation analysis, the Pn and LUE values displayed a striking positive correlation with the Tr, Ci, Gs, CE, and WUE (p < 0.01), and the WUE displayed a striking negative correlation with the Tr (p < 0.01), indicating that the increase in plant WUE was accompanied by a decrease in transpiration in karst regions, potentially representative of the “throttling” strategy of adaptation to drought stress [31]. The results were consistent with the strategies of 50 plants adapting to drought in the karst hills of Guilin [41]. One part of the assimilation products produced by photosynthesis is used to accumulate dry matter, and the other part is used to invest in the growth of leaf tissue hardness and the improvement of WUE in order to resist arid environments [7]. The variations in the photosynthetic physiological parameters of various plants show the possible variations in resource utilization among various species, which will help plants to make full use of environmental resources and improve the stability of the whole system [42].
The photosynthetic characteristics of different plants in various microhabitats are varied and can reflect the adaptability of plants to the habitats. Plants may indicate weak photosynthetic characteristics and drought tolerance and can adopt conservative survival strategies to adapt to the environment in karst mountainous and hilly regions of Guilin in Guangxi province, China [41]. In this study, compared with deciduous trees, evergreen trees had lower Pn and LUE values, weaker photosynthetic productivity, and weaker photosynthetic characteristics in the three microhabitats. To a certain extent, this reflects the fact that evergreen trees grow slowly and adopt conservative strategies to obtain scarce resources [43]. However, the water use efficiency of evergreen trees is better, and they have stronger drought resistance. Deciduous trees have higher Pn and LUE values. On the one hand, this is closely related to their higher stomatal conductance, which can increase the intercellular carbon dioxide concentration and thus increase Pn and LUE [44]. On the other hand, compared with evergreen trees, deciduous tree species have a smaller specific leaf weight, which means that the leaves are thinner and the leaf area is larger, allowing more light energy to be captured and making the photosynthetic rate per unit leaf weight higher. These characteristics show that deciduous tree species can grow rapidly, which is conducive to their competitive advantage in a fertile soil environment [45]. Therefore, deciduous trees adopt an ecological strategy of high growth rates [46] to provide photosynthetic assimilation products for their upward growth, and they adapt to the environment through defoliation. This is consistent with the results of ecological strategy research on deciduous and evergreen tree species in the strong and moderate rocky desertification areas of Bijie, Guizhou province, China [31].
Based on the photosynthetic characteristics of various plant life forms, evergreen trees demonstrate better water use efficiency, can grow in poor soil conditions, can resist adverse external environments, and have strong adaptability to karst habitats. They can be considered a preferable tree species for ecological restoration efforts. Deciduous trees adapt to karst habitats by displaying a high photosynthetic capacity, growing rapidly, covering the surface quickly, reducing soil erosion, decomposing litter quickly, and promoting soil nutrient cycling. Deciduous trees can be important in the process of plant restoration and reconstruction in karst habitats. In comparison, although shrubs and herbs have lower photosynthetic capacity, they also have a lower transpiration rate, which can more effectively save soil water use and better adapt to the seasonal drought environment in karst regions. In the process of habitat plant restoration and reconstruction, various types of plants form a multi-level structure, make full use of light energy, reduce competition, and improve ecosystem stability.

5. Conclusions

In summary, this study analyzed variations in the photosynthetic characteristics of 24 typical plants in various microhabitats and microtopographies in karst regions. The results indicated that Pn, LUE, and WUE were the main photosynthetic parameters used to reflect a plant’s adaptation to karst habitats. In stone gullies, the water use efficiency of plants was remarkably superior to that of plants on stone surfaces and soil surfaces, indicating that the drought resistance, resource acquisition, and maintenance ability of plants were stronger. There was a certain coupling relationship between topographic factors and plant photosynthetic characteristics. The photosynthetic parameters of plants decreased as the slope steepness increased and the slope position rose; they also increased when the slope faced the sun, indicating that topography significantly affects the photosynthetic characteristics of plants through the changing light, temperature, water, and soil conditions in karst regions, which can help us to understand the ecological adaptability of plants. Evergreen trees had a higher photosynthetic capacity and water use efficiency and were mainly characterized by conservative strategies. Deciduous trees had a high photosynthetic capacity, which was mainly manifested in the ecological strategy of having a high growth rate. This study provides a theoretical foundation for the subsequent restoration and reconstruction of karst habitat vegetation.
This study has made progress in exploring the photosynthetic characteristics and influencing factors of various plants at the microtopograph and microhabitat scale in karst regions, though certain limitations remain. First, in terms of species selection, the research objects of this study were 24 dominant plants in karst habitats. The research results were representative to some extent, but whether they are more broadly universal needs to be verified by the inclusion of more plants. Second, in the analysis of plant adaptation strategies, we mainly analyzed the various adaptation strategies adopted by various plant life forms from the perspective of photosynthetic characteristics, and we further studied the leaf structure traits and community environments of plants. Third, in the determination of plant photosynthetic characteristics, the observations used in this study were of instantaneous photosynthetic characteristics occurring at the beginning of the growing season. The experimental timescale was short, and there were some shortcomings. In the future, long-term positioning observations will be needed, and the experimental timescale should be extended in order to better promote the sustainable development of karst ecosystems.

Supplementary Materials

The following supporting information can be downloaded at: https://www.mdpi.com/article/10.3390/f16030532/s1, Table S1: Plant basic information.

Author Contributions

Data curation: X.J. and W.Z.; formal analysis: X.J.; funding acquisition: P.W.; investigation: P.W., H.Z., W.Z., T.Z., Y.C. and Y.H.; project administration: P.W. and F.H.; writing—original draft: X.J.; writing—review and editing: X.J. and P.W. All authors have read and agreed to the published version of the manuscript.

Funding

This research was funded by the National Natural Science Foundation of China (grant numbers 32460275 and 32060244) and the Science and Technology Planning Project of Guizhou Province (grant number QKHFQ [2023]009).

Data Availability Statement

Data are contained within the article and Supplementary Materials.

Acknowledgments

We would like to extend our sincere gratitude to the Maolan National Nature Reserve Administration for their invaluable assistance and support during the fieldwork. Their cooperation and resources were instrumental in the successful completion of this research.

Conflicts of Interest

The authors declare no conflicts of interest.

References

  1. Jiang, Z.; Lian, Y.; Qin, X. Rocky desertification in Southwest China: Impacts, causes, and restoration. Earth Sci. Rev. 2014, 132, 1–12. [Google Scholar] [CrossRef]
  2. Wang, M.; Kuang, S.; Wang, W. Study on Geoscience Model of Karst Rocky Desertification Control; Geological Publishing House: Beijing, China, 2010. [Google Scholar]
  3. Long, J.; Wu, Q.; Li, J.; Liao, H.; Liu, L.; Huang, B.; Zhang, J. Effects of different microhabitat types on rock dissolution in Maolan karst forest, Southwest China. Acta Pedol. Sin. 2021, 58, 151–161. [Google Scholar]
  4. Chen, F.; Liu, F.; Bai, X.; Wu, L.; Chen, Z.; Wang, J. Spatial heterogeneity and ecological stoichiometry characteristics of soil carbon, nitrogen and phosphorus under different micro-geomorphology in karst mountains. Acta Ecol. Sin. 2022, 42, 10201–10213. [Google Scholar]
  5. An, M.T. Studies on Maintenance Mechanism of Plant Species Diversity and Soil Moisture and Nutrient Pattern in Karst Forest. Ph.D. Thesis, Guizhou University, Guiyang, China, 2019. [Google Scholar]
  6. Wu, P.; Zhou, H.; Cui, Y.; Zhao, W.; Hou, Y.; Tan, C.; Yang, G.; Ding, F. Stoichiometric characteristics of leaf, litter and soil during vegetation succession in Maolan national nature reserve, Guizhou, China. Sustainability 2022, 14, 16517. [Google Scholar] [CrossRef]
  7. Flexas, J.; Carriquí, M. Photosynthesis and photosynthetic efficiencies along the terrestrial plant’s phylogeny: Lessons for improving crop photosynthesis. Plant J. Cell Mol. Biol. 2020, 101, 964–978. [Google Scholar] [CrossRef] [PubMed]
  8. Xing, H.; Wu, J.; Chen, J.; Shi, Z. Research progress on limiting factors of plant photosynthesis and vegetation productivity. Acta Ecol. Sin. 2023, 43, 5186–5199. [Google Scholar]
  9. Yu, G.; Wang, S.; Rong, L. Microclimate characteristics of different microhabitats in successional stages of Maolan karst forest. Earth Environ. 2011, 39, 469–477. [Google Scholar]
  10. Jin, T.; Fu, B.; Liu, G.; Hu, C.; Su, C.; Liu, Y. Diurnal changes of photosynthetic characteristics of Hippophae rhamnoides and the relevant environment factors at different slope locations. Acta Ecol. Sin. 2011, 31, 1783–1793. [Google Scholar]
  11. Pu, Y.; Liu, J.; Yang, Y. Study on the effect of different site conditions on the growth of Taxus chinensis seedlings. Hortic. Seed 2024, 44, 4–6. [Google Scholar]
  12. Zhu, S.; Xu, W.; Liu, G.; Zhao, J.; Chen, Y. Effect of slope gradient on physiological characteristic of Medicago sativa and Cynodon dactylon. Res. Soil Water Conserv. 2012, 19, 218–221. [Google Scholar]
  13. Zhou, T.; Cui, Y.; Ye, Y.; Zhao, W.; Hou, Y.; Wu, P.; Ding, F. Leaf functional traits of typical karst forest plants under different niches. J. Cent. South Univ. For. Technol. 2022, 42, 129–140. [Google Scholar]
  14. Zhu, S.Q. Study on Karst Forest Ecosystem III; Guizhou Science and Technology Press: Guiyang, China, 2014; p. 72. [Google Scholar]
  15. Liao, W.; Wei, Y.; Huang, S.; Wei, Z.; Hu, X. Association analysis of the spatial and temporal changes in vegetation photosynthesis levels with land cover changes in China based on solar-induced fluorescence. Sustainability 2024, 16, 5107. [Google Scholar] [CrossRef]
  16. Coşkun, Ö.F.; Toprak, S.; Mavi, K. Some seed properties and molecular analysis with inter-primary binding site (iPBS) etrotranposons markers of edible-seeded watermelon genotypes. Genet. Resour. Crop Ev. 2024, 71, 3151–3162. [Google Scholar] [CrossRef]
  17. Coskun, O.F.; Gulsen, O. Determination of markers associated with important agronomic traits of Watermelon (Citrullus lanatus L.). J. Agric. Sci. Tech. 2024, 26, 1359–1371. [Google Scholar] [CrossRef]
  18. Wang, Y.; Huang, Z.; Li, S.; Yang, Q.; Cheng, X. Growth and photosynthetic characteristics of Bombax ceiba seedlings in different habitats. J. Northeast. For. Univ. 2023, 51, 6–10. [Google Scholar]
  19. Jiang, X.; Su, C.; Wu, S.; Zhang, X. Photosynthetic and physiological characteristics of Cladrastis platycarpa (Maxim.) Makino in spring in dolomite rocky hills of karst region. Guangdong Agric. Sci. 2017, 44, 41–47. [Google Scholar]
  20. Liu, H.; Yu, Y.; Xiong, K.; Zhang, S.; Yang, S. Response characteristics of photosynthesis to light intensity of three non-wood forests tree species in karst habitat. J. South. Agric. 2021, 52, 2507–2515. [Google Scholar]
  21. Xing, D.; Wu, Y.; Fu, W.; Hang, H.; Zhao, Y.; Wu, Y. Photosynthetic physiological response of three plant species to different slope environments in karst forest of Guizhou, China. Guihaia 2016, 36, 1147–1155. [Google Scholar]
  22. Zhang, Z.; Hu, B.; Hu, G. Spatial heterogeneity of soil chemical properties in a subtropical karst forest, Southwest China. Sci. World J. 2014, 2014, 473651. [Google Scholar] [CrossRef]
  23. Wen, P.; Jin, G. Effects of topography on species diversity in a typical mixed broadleaved-Korean pine forest. Acta Ecol. Sin. 2019, 39, 945–956. [Google Scholar] [CrossRef]
  24. Tang, Y.; Wang, C. A feasible method for measuring photosynthesis in vitro for major tree species in northeastern China. Chin. J. Plant Ecol. 2011, 35, 452–462. [Google Scholar] [CrossRef]
  25. Huang, B.; Zhu, J.; He, C.; Li, W.; Chen, Z.; Fan, Y.; Hong, T. Effects of tides on leaf phenotypic modeling and leaf economics spectrum of Kandelia obovata. Sci. Silvae Sin. 2021, 57, 63–72. [Google Scholar]
  26. Liu, W.; Li, D.; Ji, Q.; Chen, H.; Lai, S.; Geng, S.; Yun, X.; Chen, Q. Leaf nitrogen allocation of evergreen and deciduous broad-leaved tree species and their relationships with photosynthetic capacity in the two babitats. Ecol. Sci. 2015, 34, 1–8. [Google Scholar]
  27. Soudani, K.; Hmimina, G.; Dufrêne, E.; Berveiller, D.; Delpierre, N.; Ourcival, J.M.; Rambal, S.; Joffre, R. Relationships between photochemical reflectance index and light-use efficiency in deciduous and evergreen broadleaf forests. Remote Sens. Environ. 2014, 144, 73–84. [Google Scholar] [CrossRef]
  28. Wei, Y.; Hu, G.; Yang, P.; Zhao, J. Photosynthetic characteristics and ecological adaptability of different landscape tree species in Karst mountainous area. Guizhou Agric. Sci. 2013, 41, 65–68. [Google Scholar]
  29. Ma, F.; Li, M.; Rong, Y.; Jiang, J.; Dong, S.; Jun, T. A Study of effect of water deficit of three period during cotton anthesis on canopy apparent photosynthesis and WUE. Sci. Agric. Sin. 2002, 35, 1467–1472. [Google Scholar]
  30. Wang, Y.; Wu, S. Effects of different cultivation methods on the photosynthetic characteristics and water-utilizing efficiency of Populus euphratica. J. Gansu Agric. Univ. 2023, 58, 156–164. [Google Scholar]
  31. Zhang, S.; Xiong, K.; Zhang, Y.; Ji, C.; Ma, X.; Lai, J.; Min, X. Leaf functional traits characteristics of dominant species and influencing factors in succession of the typical rocky desertification ecosystems. Ecol. Environ. Sci. 2019, 28, 2165–2175. [Google Scholar]
  32. Yuan, C.; Wang, H.; Dai, X.; Chen, M.; Luo, J.; Yang, R.; Ding, F. Effect of karst microhabitats on the structure and function of the rhizosphere soil microbial community of Rhododendron pudingense. Sustainability 2023, 15, 7104. [Google Scholar] [CrossRef]
  33. Yan, L.B. Response Mechanism of Soil Microbial Community and Plant Functional Traits to Ecological Factors of Water and Heat in Karst Micro-Habitats. Ph.D. Thesis, Guizhou University, Guiyang, China, 2020. [Google Scholar]
  34. Qiao, S.; Ma, C.; Li, H.; Zhang, Y.; Zhang, M.; Zhao, W.; Liu, B. Responses of growth and photosynthesis to alkaline stress in three willow species. Sci. Rep. 2024, 14, 14672. [Google Scholar] [CrossRef]
  35. Chen, G.; Chen, J.; Xu, D. Thinking about the relationship between net photosynthetic rate and intercellular CO2 concentration. Plant Physiol. Commun. 2010, 46, 64–66. [Google Scholar]
  36. Falcioni, R.; Moriwaki, T.; Rodrigues, M.; de Oliveira, K.M.; Furlanetto, R.H.; Dos Reis, A.S.; Dos Santos, G.L.A.A.; Mendonça, W.A.; Crusiol, L.G.T.; Gonçalves, J.V.F.; et al. Nutrient deficiency lowers photochemical and carboxylation efficiency in tobacco. Theor. Exp. Plant Physiol. 2023, 35, 81–97. [Google Scholar] [CrossRef]
  37. Zhao, S.; Han, L.; Zhang, Y.; Zhang, C.; Xiao, K. Study on photosynthetic characteristics and its influencing factors of Lespedeza bicolor Turcz. under different slope situation. Acta Bot. Boreal. Occident. Sin. 2008, 28, 342–347. [Google Scholar]
  38. Zhang, Z.; Cai, Y.; Zhao, L.; Zu, Y.; Lin, S.; He, K. Effects of stand structure and environmental factors on understory herbaceous plant diversity in eastern Oilian Mountains. Acta Ecol. Sin. 2024, 44, 2089–2099. [Google Scholar]
  39. Choudhury, B.U.; Fiyaz, A.R.; Mohapatra, K.P.; Ngachan, S. Impact of land uses, agrophysical variables and altitudinal gradient on soil organic carbon concentration of North-eastern Himalayan region of India. Land Degrad. Dev. 2016, 27, 1163–1174. [Google Scholar] [CrossRef]
  40. Carletti, P.; Vendramin, E.; Pizzeghello, D.; Concheri, G.; Zanella, A.; Nardi, S.; Squartini, A. Soil humic compounds and microbial communities in six spruce forests as function of parent material, slope aspect and stand age. Plant Soil 2009, 315, 47–65. [Google Scholar] [CrossRef]
  41. Li, Y.; Huang, J.; Ma, J.; Mo, Y. The leaf photosynthetic characteristics of 50 common plants on karst rocky mountain in Guilin. Acta Ecol. Sin. 2020, 40, 8649–8659. [Google Scholar]
  42. Pang, S.; Ou, Z.; Hui, S.; He, F.; Lu, G. Leaf function trait variation and adaptive strategies of dominant woody economic plants in karst area of Southwest Guangxi. Guihaia 2021, 41, 707–714. [Google Scholar]
  43. Poorter, L.; Kitajima, K. Carbohydrate storage and light requirements of tropical moist and dry forest tree species. Ecology 2007, 88, 1000–1011. [Google Scholar] [CrossRef]
  44. Hikosaka, K. Interspecific difference in the photosynthesis-nitrogen relationship: Patterns, physiological causes, and ecological importance. J. Plant Res. 2004, 117, 481–494. [Google Scholar] [CrossRef]
  45. Bai, K.; Jiang, D.; Wan, X. Photosynthesis-nitrogen relationship in evergreen and deciduous tree species at different altitudes on Mao’er Mountain, Guangxi. Acta Ecol. Sin. 2013, 16, 4930–4938. [Google Scholar]
  46. Grime, J.P. Evidence for the existence of three primary strategies in plants and its relevance to ecological and evolutionary theory. Am. Nat. 1977, 111, 1169–1194. [Google Scholar] [CrossRef]
Figure 1. Sampling sites and plant distribution in the karstic Maolan region.
Forests 16 00532 g001
Figure 2. Photosynthetic characteristics of various plant life forms in three microhabitats. Capital letters indicate significant variations among the same plant life forms in various microhabitats (p < 0.05). Lowercase letters indicate significant variations among various plant life form in the same microhabitat (p < 0.05). “▲” indicates the average value of each indicator. The letters DE, EV, SH, and HE indicate deciduous trees, evergreen trees, shrubs, and herbs, respectively. Different color dots represent the photosynthetic characteristics of different life forms of plants. Green represents deciduous trees, orange represents evergreen trees, purple represents shrubs, and purplish red represents herbs.
Forests 16 00532 g002
Figure 3. Plant photosynthetic characteristics versus slope aspect. Various lowercase letters indicate that the photosynthetic characteristics were remarkably varied among the different slope aspects (p < 0.05).
Forests 16 00532 g003
Figure 4. Plant photosynthetic characteristics versus slope position. Various lowercase letters indicate that the photosynthetic characteristics were remarkably varied among the different slope positions (p < 0.05).
Forests 16 00532 g004
Figure 5. Plant photosynthetic characteristics versus slope steepness. Lowercase letters indicate that the photosynthetic characteristics were remarkably varied in relation to the slope degree (p < 0.05).
Forests 16 00532 g005
Figure 6. Biplot of PCA between photosynthetic characteristics and microhabitats (AC), as well as microtopographies (D).
Forests 16 00532 g006
Figure 7. The correlation of plant photosynthetic characteristics. The scale on the right indicates the magnitude of the correlation coefficient, with red signifying a positive correlation and blue denoting a negative correlation. The size of the circle is proportional to the strength of the correlation, with larger circles representing stronger correlations.
Forests 16 00532 g007
Table 1. Microtopography classification types.
MicrotopographyDivision Basis
Slope positionsupslope, midslope, downslope, and depression
Slope degreesslope ≤ 5°, slope 5°~15°, slope 15°~25°, slope 25°~35°, slope ≥ 35°
Slope aspectsshady slope (337.5°~22.5°, 22.5°~67.5°)
semi-shady slope (67.5°~112.5°, 292.5°~337.5°)
flat land (slope degrees ≤ 5°)
semi-sunny slope (112.5°~157.5°, 247.5°~292.5°)
sunny slope (157.5°~247.5°)
Table 2. Changes in photosynthetic characteristics in three microhabitats.
TypesPn
(μmol·m−2·s−1)
WUE
(μmol·mmol−1)
Ci
(μmol·mol−1)
Tr
(mmol·m−2·s−1)
Gs
(mol·m−2·s−1)
CE
(μmol·m−2·s−1)
LUE
(%)
Stone gully6.11 ± 0.31 a7.66 ± 0.35 a294.07 ± 6.36 a0.89 ± 0.05 a0.136 ± 0.014 a0.021 ± 0.001 a0.51 ± 0.03 a
Stone surface5.73 ± 0.30 a6.14 ± 0.35 b277.60 ± 7.69 a1.02 ± 0.06 a0.106 ± 0.009 a0.022 ± 0.001 a0.48 ± 0.02 a
Soil surface6.36 ± 0.43 a6.62 ± 0.30 b279.95 ± 6.34 a0.99 ± 0.06 a0.127 ± 0.015 a0.023 ± 0.001 a0.54 ± 0.04 a
F0.8216.6281.6741.5111.4020.7321.158
p0.4410.0020.1900.2230.2480.4820.316
Note: Pn, WUE, Ci, Tr, Gs, CE, and LUE indicate the net photosynthetic rate, water use efficiency, intercellular CO2 concentration, transpiration rate, stomatal conductance, carboxylation efficiency, and light use efficiency, respectively. The data are presented as mean ± standard error. p indicates the significance of the difference. Various lowercase letters indicate that the photosynthetic characteristics were remarkably varied in the various karst microhabitats (p < 0.05).
Table 3. PCA of plant photosynthetic characteristics.
ComponentEigenvectorEigenvalueCumulative/
%
x1 (Pn)x2 (Gs)x3 (Ci)x4 (Tr)x5 (WUE)x6 (CE)x7 (LUE)
y10.490.390.190.400.070.410.494.0357.59%
y20.15−0.33−0.54−0.280.570.380.151.5422.06%
Disclaimer/Publisher’s Note: The statements, opinions and data contained in all publications are solely those of the individual author(s) and contributor(s) and not of MDPI and/or the editor(s). MDPI and/or the editor(s) disclaim responsibility for any injury to people or property resulting from any ideas, methods, instructions or products referred to in the content.

