Article

Multi-Criteria Plant Clustering for Carbon-Centric Urban Forestry: Enhancing Sequestration Potential Through Adaptive Species Selection in the Zhengzhou Metropolitan Area, China

1
College of Landscape Architecture and Art, Henan Agricultural University, Zhengzhou 450002, China
2
Department of Art and Design, Zhengzhou Business University, Gongyi 451200, China
3
Henan Remote Sensing Institute, Zhengzhou 450002, China
4
MOE Key Laboratory of Tibetan Plateau Land Surface Processes and Ecological Conservation, and School of the Geographical Science, Qinghai Normal University, Xining 810016, China
*
Author to whom correspondence should be addressed.
These authors contributed equally to this work.
Forests 2025, 16(3), 536; https://doi.org/10.3390/f16030536
Submission received: 17 February 2025 / Revised: 11 March 2025 / Accepted: 17 March 2025 / Published: 19 March 2025
(This article belongs to the Section Urban Forestry)

Abstract

:
As global climate change and urban issues worsen, increasing carbon offsets is crucial, with urban plants playing a key role. However, research on assessing plant carbon sequestration (CSE) capacity at the regional scale, selecting urban plants, and optimizing CSE capacity-based scenarios is still limited. A total of 272 plant species were surveyed in the nine cities of the Zhengzhou Metropolitan Area (ZMA). The i-Tree and biomass models estimated the average carbon storage (CS) density at 9.32 kg C m−2 and the CSE density at 0.55 kg C y−2 m−2 in the ZMA. The highest CS density (13.58 kg C m−2) was observed in Pingdingshan, while the lowest CSE density (0.36 kg C y−1 m−2) was observed in Xuchang. Hierarchical and cluster analyses identified plant species with balanced CSE capacity, adaptability, and ornamental value, such as Populus tomentosa Carr. and Salix babylonica L., as well as shrubs like Abelia biflora Turcz and Kerria japonica (L.) DC. Vegetation regeneration modeling indicated that CS could increase by 37%–41% along roads, 28%–43% in amenity areas, and 17%–30% near waterfronts over the next 50 years. These findings serve as a reference for urban regeneration and planning aimed at enhancing the carbon reduction potential of urban green spaces (UGS).

1. Introduction

Global warming is one of the most urgent environmental challenges today, primarily driven by carbon emissions. Cities, home to 57% of the global population [1], are responsible for 71%–76% of global greenhouse gas emissions [2]. Rapid urbanization has put immense pressure on ecosystems, leading to challenges such as the urban heat island effect, air pollution, and water contamination [3]. As the world looks for solutions to address global warming, the role of nature-based solutions is receiving more attention. UGS, essential to urban ecosystems, enhance environmental quality, regulate the climate, purify air, and play a key role in CSE and CS [4]. For instance, a U.S. study found that UGS, covering less than 3% of the land area, account for 14% of total CSE in all land-based forests [5]. Research also shows that each urban tree absorbs about 18 kg of carbon annually, contributing 22% of total urban CS [6]. Therefore, the CSE role of UGS is crucial for mitigating climate change and achieving sustainable, low-carbon urban development.
In recent years, there has been increasing interest in the role of UGS in CS and CES. Studies show significant differences in the contributions of different types of urban trees to CS and CSE [7,8]. A bibliometric analysis of 145 studies from 2007 to 2022 by Zhao et al. [9] identified species selection and plant community characteristics as the two most critical factors in CSE research of UGS, accounting for 62.1% and 13.1%, respectively. However, much of the current research focuses on the CSE capacity of specific plant species or certain types of green spaces, such as parks and open areas [10]. Additionally, most studies are conducted at global or national scales, with limited exploration of CSE capacity at urban or regional levels, particularly in metropolitan areas and urban clusters. Existing research often overlooks the dynamic nature of ecosystem services, influenced by factors such as species composition, land use, and climate. Therefore, there is an urgent need to expand research on the CSE capacity of UGS to the regional scale, incorporating multiple indicators for a more comprehensive analysis.
While urban trees play a critical role in carbon reduction, they face significant challenges in complex urban environments. High temperatures, limited water availability, and nutrient-poor soils often hinder their adaptability and survival [11]. Studies show that about 25% of urban trees die within 1–5 years of planting, and nearly 50% do not survive beyond 36–40 years [12]. Besides adaptability, aesthetic value is a key consideration in urban landscape design. Trees with high ornamental value not only enhance urban aesthetics but also improve mental health, mitigate urban heat island effects, reduce heat-related illnesses, and promote public health [13]. However, tree species with high CSE capacity are typically large deciduous trees, which often lack the visual appeal needed for diverse urban landscapes [14]. Research further reveals that dominant urban tree species often conflict with those optimal for CS, highlighting a misalignment between ecological and design priorities. The lack of a comprehensive framework balancing CSE capacity, ecological adaptability, and aesthetic value has limited the potential of UGS to effectively address climate change and has hindered sustainable urban development strategies. Therefore, in the context of global warming, there is an urgent need to develop an integrated framework that harmonizes these competing priorities, maximizing the carbon reduction benefits of UGS, advancing global carbon neutrality goals, and enhancing public well-being.
The ZMA is located in Henan Province, a populous province with significant ecological value and substantial carbon emissions. The ZMA is a key area for ecological conservation and high-quality development within the Yellow River Basin, as well as for implementing the central region’s rise strategy [15]. However, intensified land-use development in the ZMA has led to a 2.5% annual decrease in ecological space between 2000 and 2022 [16]. Increasingly dense urban populations and escalating urban and local ecological issues are posing significant threats to the high-quality development of ZMA [17]. In response to these challenges, this study focuses on the ZMA region in Henan Province. Using multi-source data, it aims to develop a standardized plant selection framework that balances urban landscape aesthetics and resilience while optimizing urban trees’ CSE capacity. The study aims to provide data support and scientific evidence to achieve urban carbon neutrality goals. The objectives of this study are as follows: (1) assessing the current state of urban plant resources and their CSE capacity in the ZMA region through field surveys and model calculations; (2) identifying high- CSE capacity plant species suitable for the Central Plains region, which also possess aesthetic value and adaptability, through cluster analysis; and (3) predicting the CSE potential of planting designs under different scenarios using simulation modeling.

2. Materials and Methods
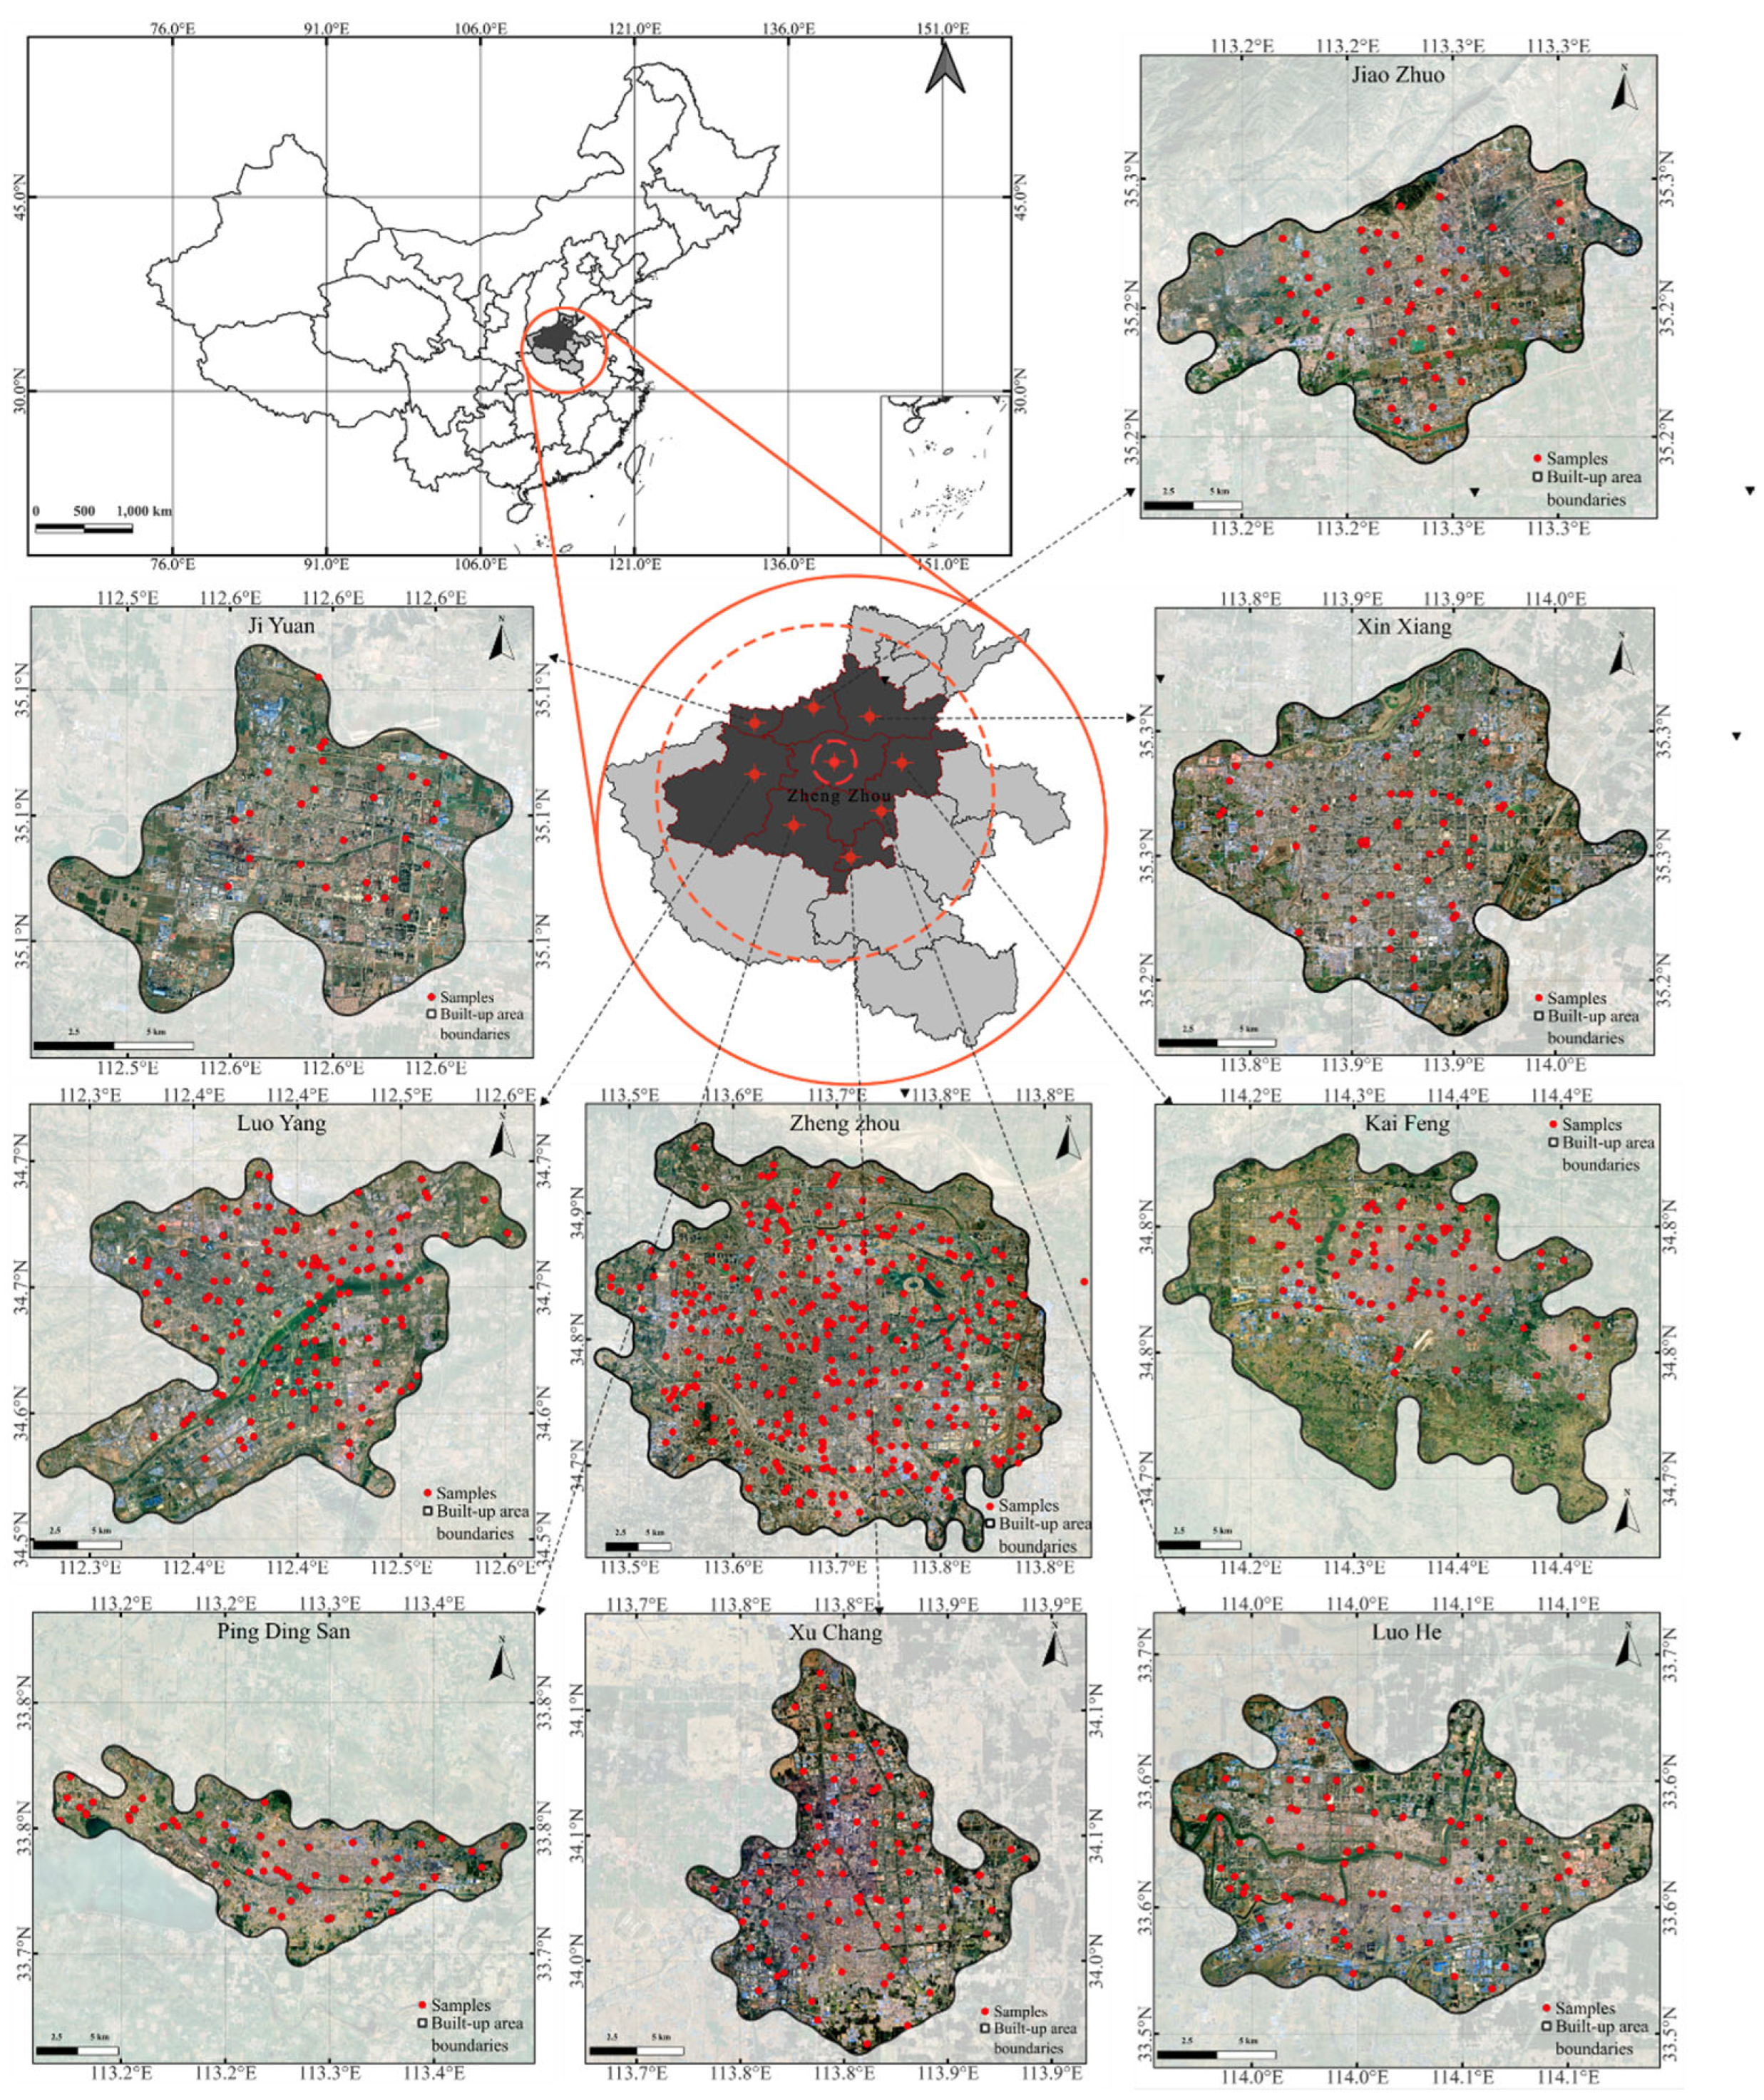
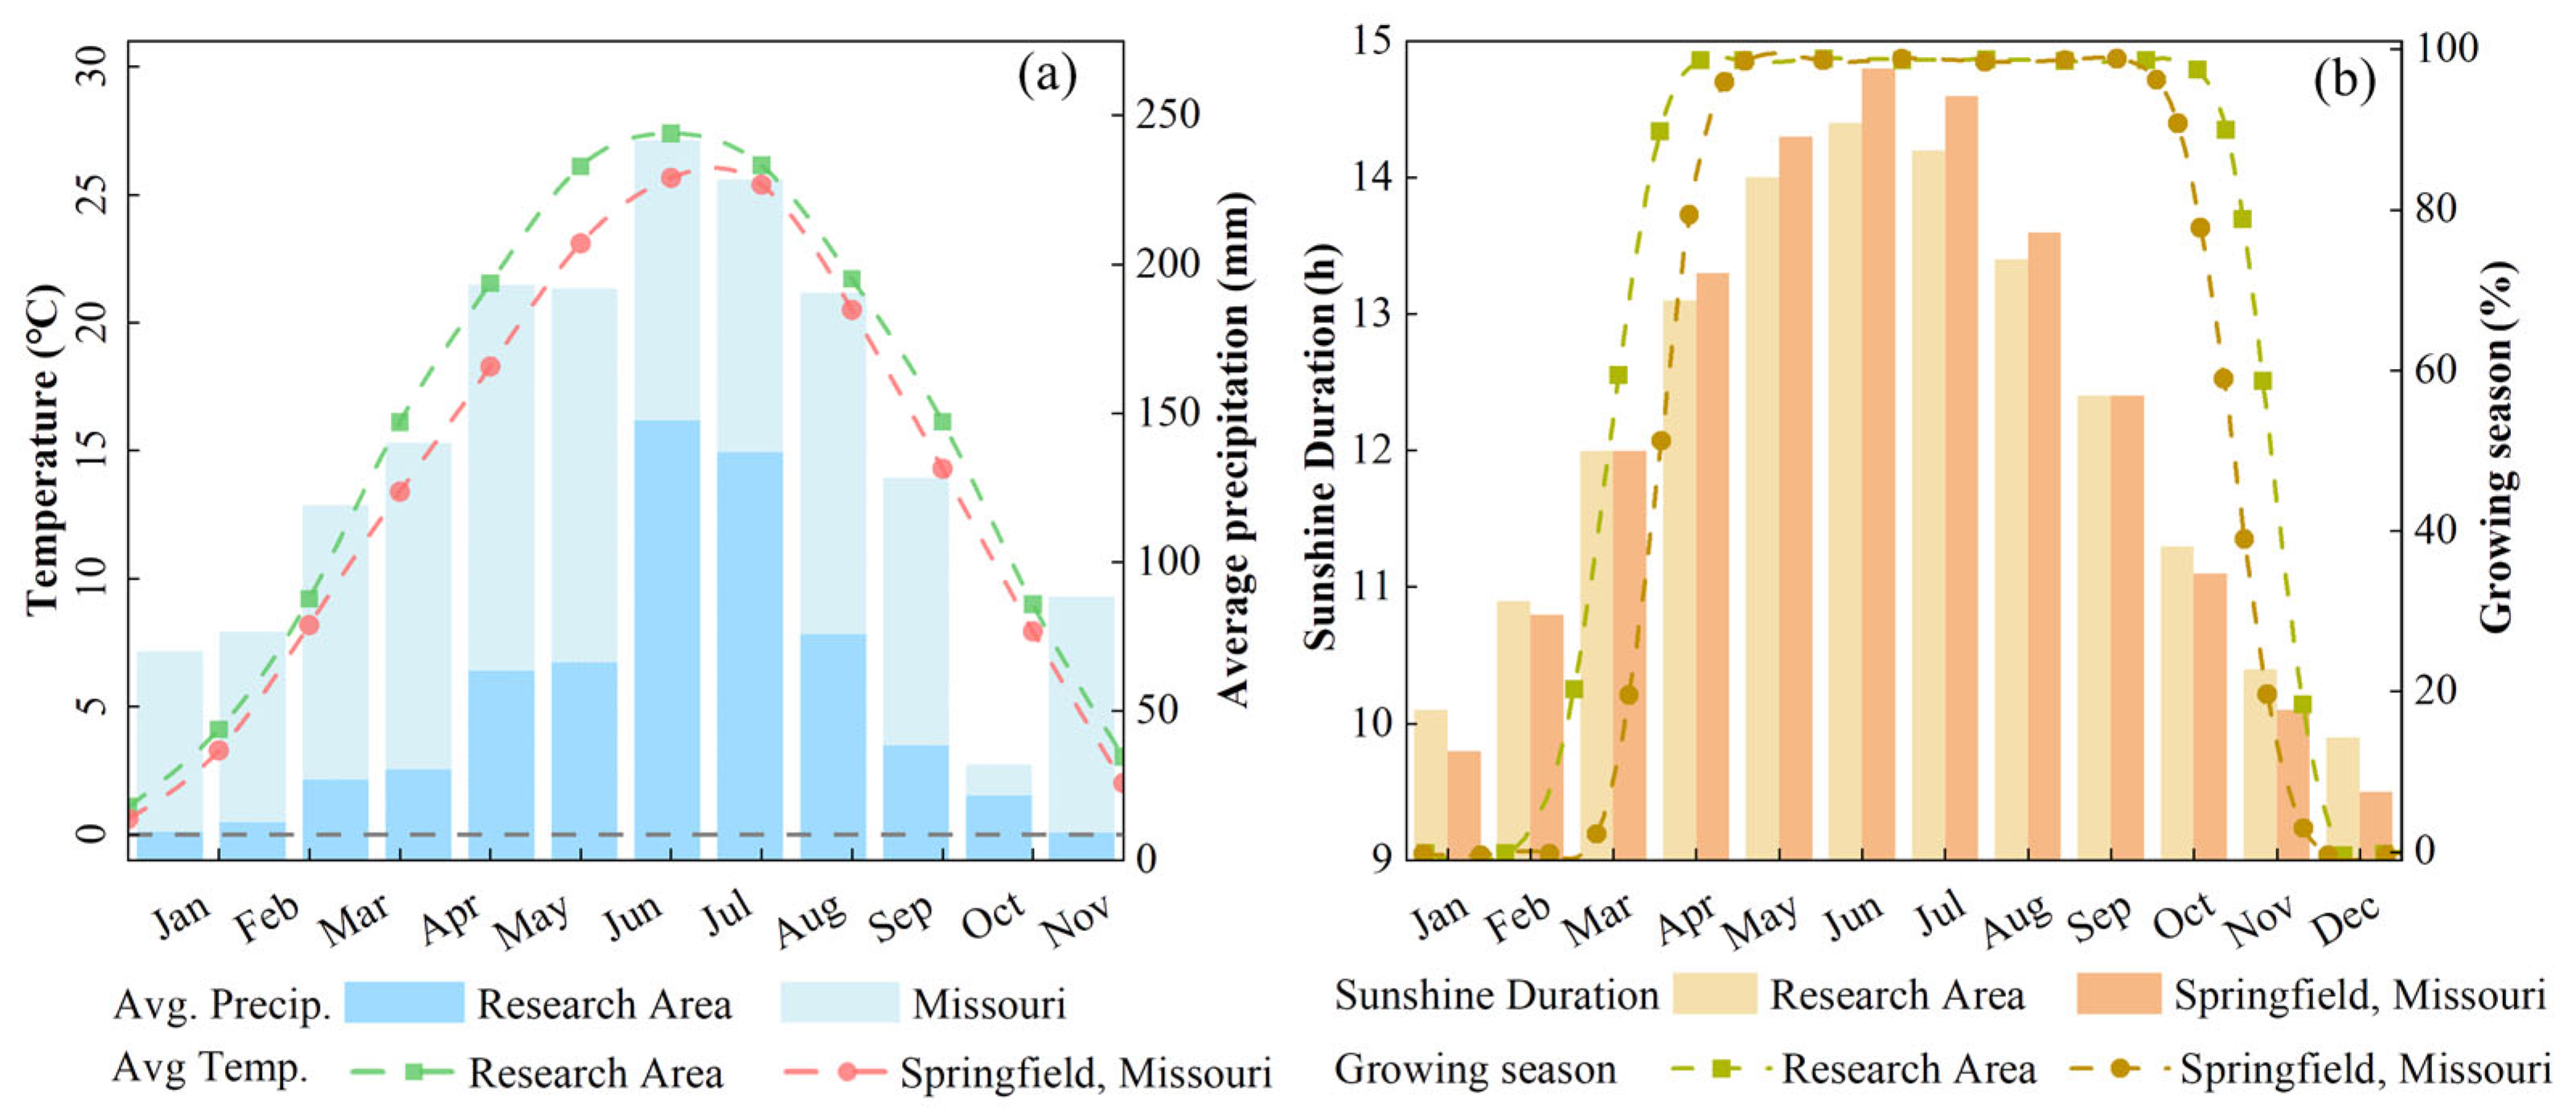
2.1. Study Area

The ZMA is located at 33°85′ N–35°20′ N, 112°79′ E–114°82′ E (Figure 1). The region, located in central China within the middle and lower reaches of the Yellow River, belongs to the north temperate monsoon climate, characterized by four distinct seasons, average annual precipitation of 700–900 mm, rich flora, and substantial ecological potential. Centered on Zhengzhou City, the ZMA fosters integrated linkage and synergistic development with surrounding cities, encompassing nine cities, including Zhengzhou, Luoyang, Kaifeng, Pingdingshan, and Xinxiang. It covers an administrative area of approximately 31,100 km2, accounting for 18% of the total area of Henan Province, supporting nearly 20% of its population and generating over 30% of its GDP. This study focuses on UGS in the built-up areas of these nine cities, with a total area of approximately 2066 km2, or 5.5% of the total area of the metropolitan area [16,18].

2.2. Data Collection

We firstly divide the types of UGS into five types according to their functions and characteristics, which are park green space (PGS), protective green space (PAGS), attached green spaces (AGS), square green space (SGS), and regional green space (RGS). Among them, PGS refers to the open green space in the city or region, which is used for leisure, recreation, fitness, viewing and ecological protection, and mainly includes city parks. PAGS refers to the green space that aims to protect the ecological environment, reduce environmental pollution, and improve ecological stability, such as the green space along urban highways, railways, and arterial roads. AGS refers to the green areas attached to specific urban construction sites (such as residential areas, schools, hospitals, enterprises, institutions, etc.), which mainly serve the functional needs of the sites to which they are attached, and have the functions of ecological regulation, landscaping, and recreation. SGS refers to large open green spaces or public areas in the city, which are used by the public to provide space for recreation, socializing and activities. RGS refers to the large-scale ecological space outside the urban planning area, located in the junction between the city and nature, usually dominated by natural ecosystems, with ecological protection, disaster buffer, agricultural production, and recreational functions. It mainly includes natural reserves (primary forests, wetlands), productive green spaces (farmland, economic forests, nurseries), etc. This study mainly deals with productive green space. Afterwards, the urban construction area was divided into a 1 km × 1 km grid, combining remote sensing imagery and Google Maps to select 1–3 sample points with a size of 20 m × 20 m for each grid based on the distribution of green space types within the grid (Table 1). During the survey, latitude and longitude coordinates, along with plant species information, were recorded for each sample site. Tree measurements included diameter at breast height, height below branches, total tree height, and crown spread, while clumping shrubs were measured for basal diameter, individual height, width, and planting area, and stylized shrubs for basal diameter, height, width, and number of individuals. If pre-selected sample points were inaccessible (such as government institutions, schools, etc.), visual measurements could be used, but no more than ten visual points were allowed per city.

2.3. Methods

2.3.1. Calculation of CSE Capacity of Trees

Developed by the USDA Forest Service, the i-Tree Eco model is a widely recognized tool for quantifying ecosystem services provided by UGS. Initially derived from the Urban Forest Effects model and released in 2012, it has emerged as a robust framework for evaluating UGS benefits. The model integrates field-collected data from standardized sample plots with localized air pollution and meteorological datasets to assess ecosystem benefits, particularly CS and CES [19]. Its species-specific allometric equations demonstrate superior accuracy compared to remote sensing or radar-based approaches, significantly enhancing measurement reliability [20]. In this study, (CSE) capacity served as the primary metric for evaluating tree-level CSE capacity. For species lacking dedicated allometric equations, equations from phylogenetically related species within the same genus or family were applied. The formula was as follows:
C = a D b
where C represents the CSE and CS of the tree, D is the tree’s diameter at breast height, and a and b are species-specific coefficients.

2.3.2. Calculation of CSE Capacity of Shrubs

The CSE capacity of shrubs is expressed as the average annual CSE per unit area. Directly measurement of the photosynthetic rate in shrubs is impractical for large-scale assessments of CSE across multiple species. Thus, a simplified estimation method is employed. First, the aboveground biomass of shrubs is calculated using a model and then converted to CS using a 2:1 ratio. Finally, a simplified estimate assumes that the ratio of CS to CSE for shrubs is equivalent to that of trees within the same family. The formula for estimating shrub CSE is as follows:
S C S f i = T C S f × S i T C f × B M f i × M i × 2
where SCSfi and BMfi represent the per-unit-area CSE and biomass of the i-th shrub species in family, and TCf and TSCf denote the average CS and CSE of trees in family f, separately. Si is the number of individual shrubs of species i, and Mi is the planting area of the i-th shrub species.
Extensive research on aboveground biomass calculation models for shrubs has been conducted both domestically and internationally. This study adopts models developed by Conti et al. [21] based on a shrub database and categorized by shrub morphology. The specific model is as follows:
B M = e 0.370 + 1.903 ln C + 0.652 ln H × 1.403 g 0 e 2.474 ln D 2.757 × 1.0787 0 < g 10 e 2.281 + 1.525 ln D + 0.831 ln C + 0.523 ln H 10 < g 130
where g is the branch point height (cm), D is the basal diameter of the shrub (cm), C is the average crown diameter of the shrub (m), and H is the height of the shrub (cm).

2.3.3. Analysis of Differences in CSE Capacity Between Cities and Green Spaces

In this study, differences in CSE capacity between different cities and different green space types were analyzed using one-way analysis of variance (ANOVA). In order to reduce the differences caused by the sample sizes of different cities, this study chose mean CS density and mean CSE density as dependent variables, and city and green space type as independent variables. In this case, CS density and CSE density were calculated by dividing the sum of CS and CSE within each sample site by the area, respectively, and then calculating the average value for each city, representing the average level of CS or CSE density in UGS. Differences were considered significant if the p-value obtained through one-way ANOVA was less than 0.05; conversely, differences were considered non-significant. This approach helps to quantify the differences in carbon sink capacity between different cities and green spaces, thus, providing a scientific basis for subsequent optimization of green infrastructure.

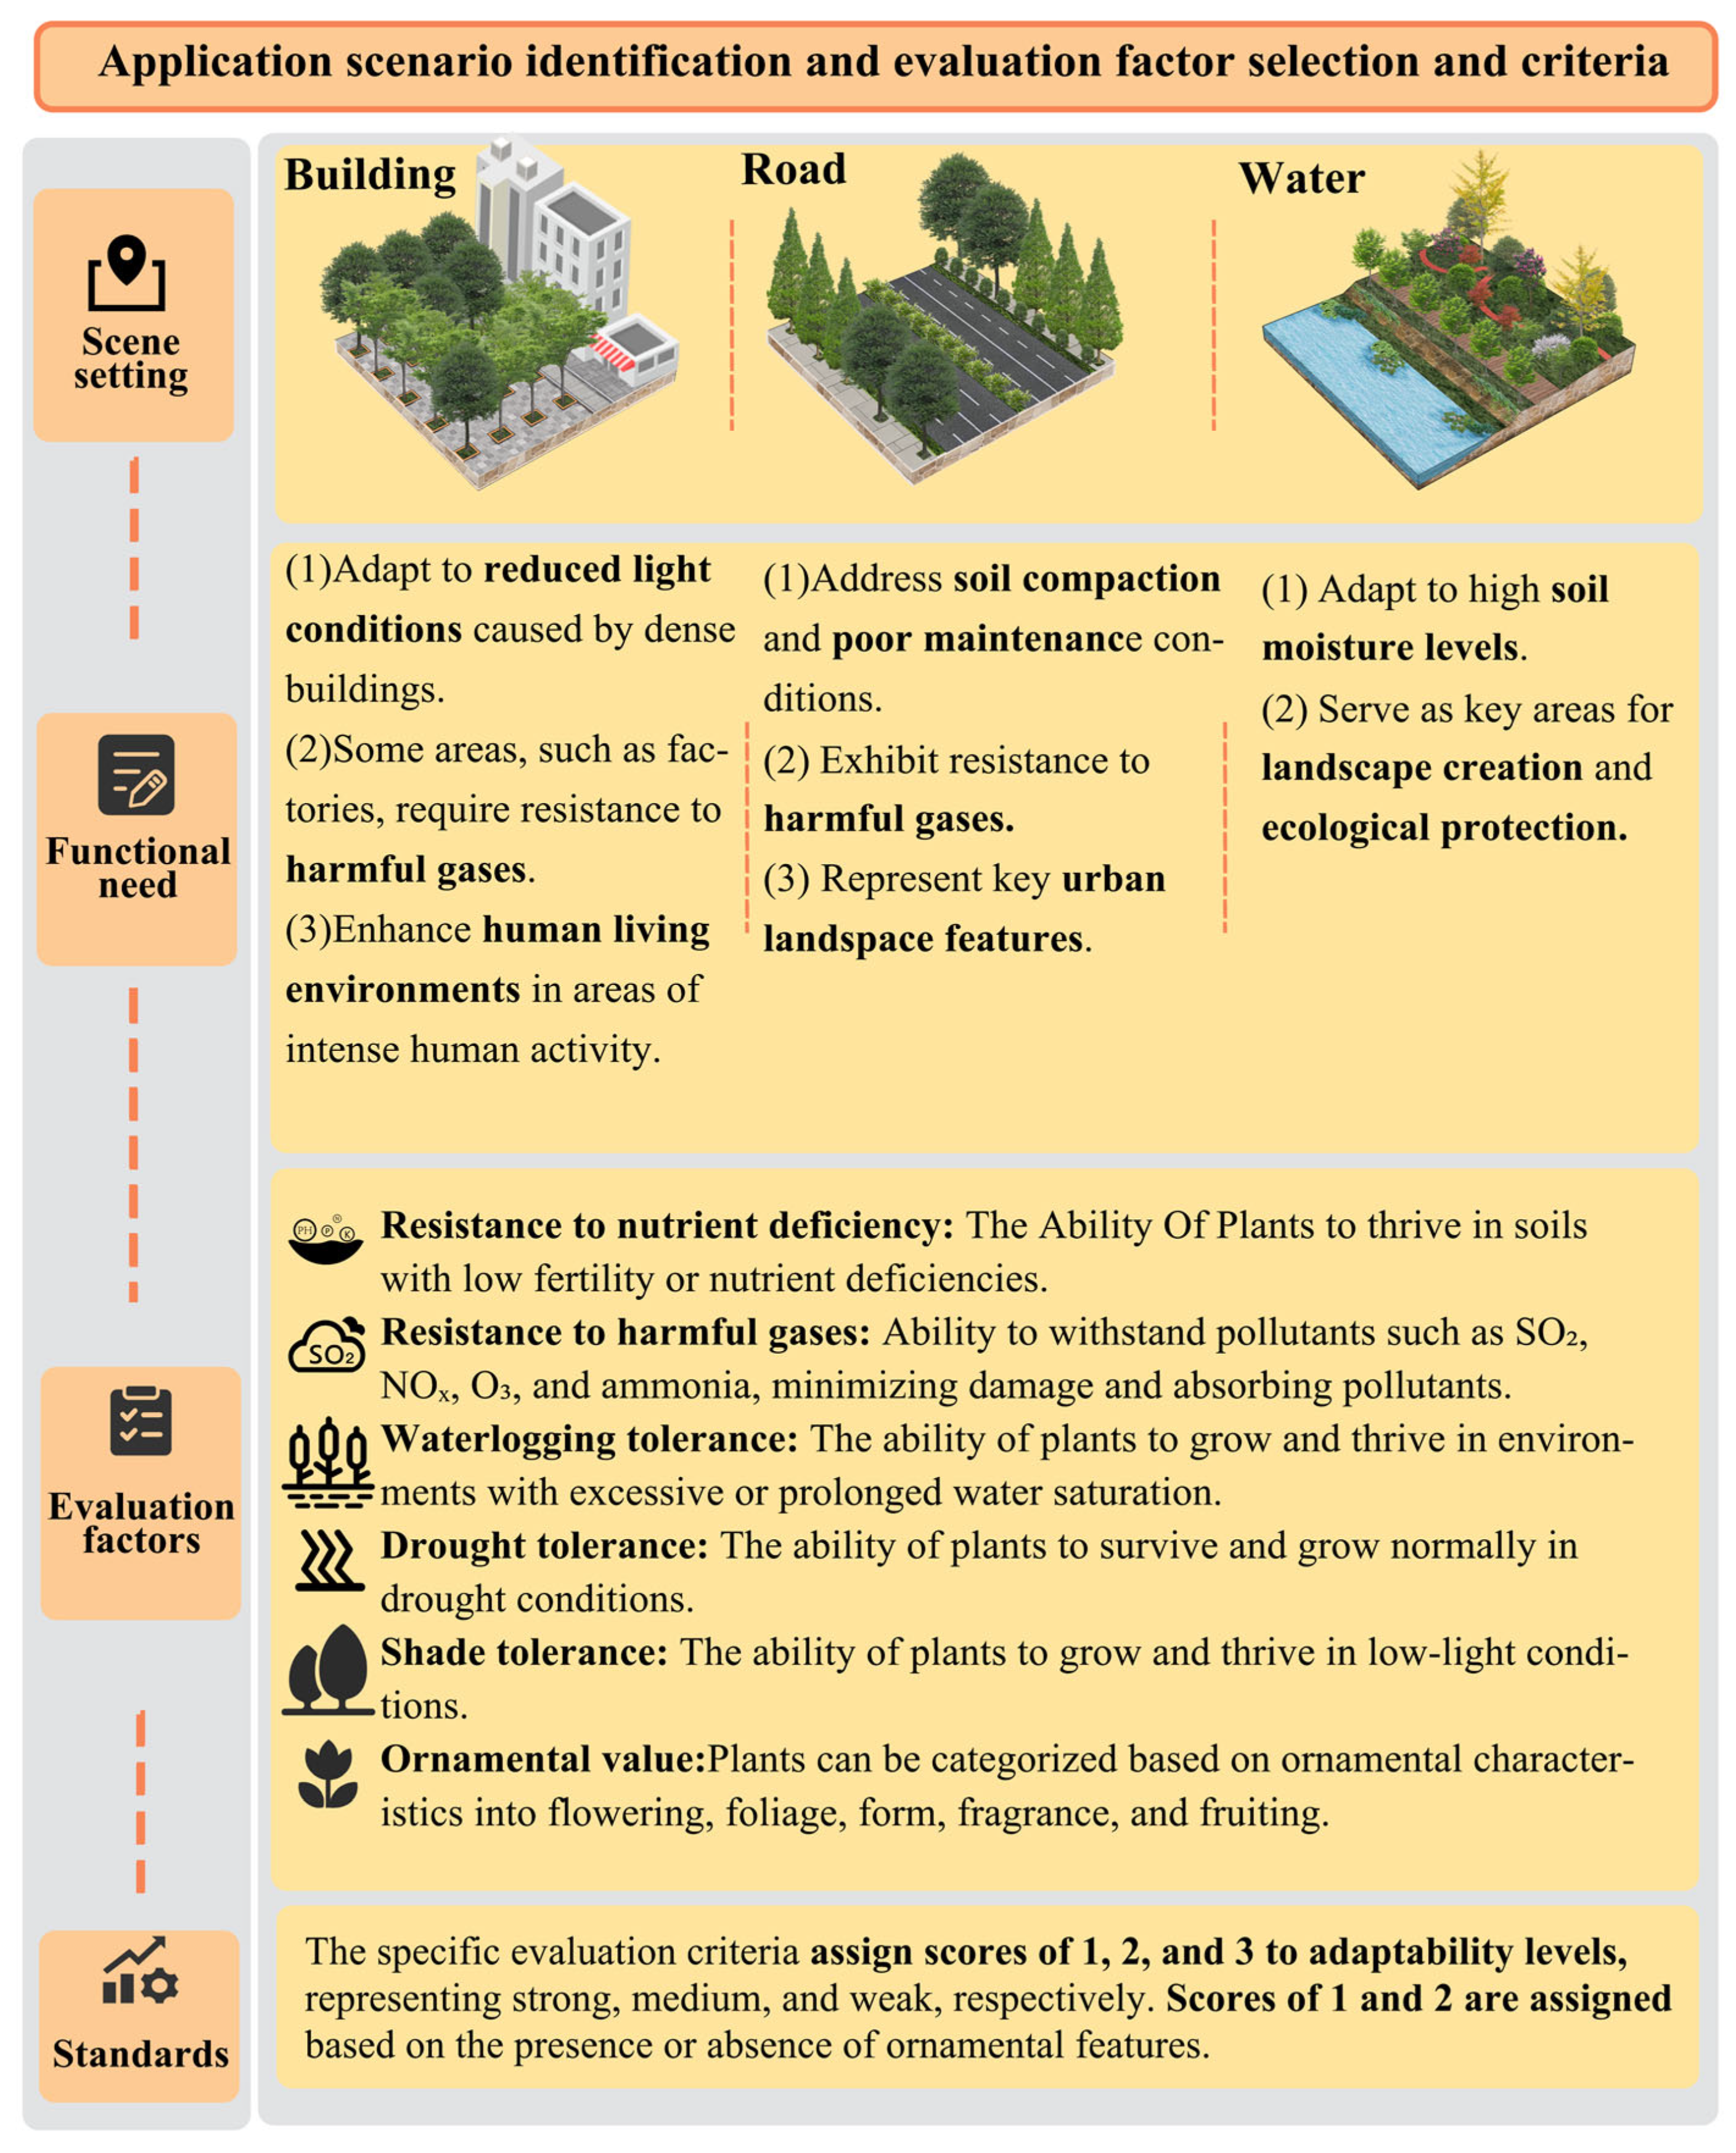
2.3.4. Extraction of Evaluation Criteria Based on Plant Application Scenarios

We selected three plant application scenarios—building, road, and water—from the three most commonly occurring UGS types: ASG, PASG, and PGS (Table 1). The “building” scenario refers to plant applications in built-up areas or near buildings in urban settings, corresponding to ASG. The “road” scenario represents green spaces located near roads in cities, corresponding to PASG. The “water” scenario pertains to plant applications near waterfronts in urban areas, representing PGS. Since landscape elements other than plants vary significantly across these scenarios, we deemed it more comprehensive to base the plant adaptation analysis on the functional needs specific to each scenario. Trees were categorized into five ornamental types—flowering, foliage, fruiting, shape, and scent-based on structural characteristics (roots, stems, leaves, flowers, fruits, seeds) and their exhibited ornamental effects (Figure 2). The adaptability and ornamental value of trees were evaluated using relevant domestic and international literature, including Flora of China, Flora of Henan [22,23]. If specific adaptability data were unavailable for a plant, data for other plants within the same family or genus were substituted.

2.3.5. Clustering Analysis

The Analytical Hierarchy Process is a multi-objective decision-making technique that combines qualitative and quantitative approaches to simplify complex decisions [24]. It achieves this by organizing problems into hierarchical structures and performing pairwise comparisons. Evaluation models for plants CSE capacity, adaptability, and ornamental value were developed to derive evaluation indices (Tables S1 and S2). The evaluation indices were normalized to a scale of 0–100. Finally, 148 trees and 123 shrubs were analyzed using SPSS software (IBM SPSS Statistics 27.0.1) and the k-means clustering method. Species names were used as the case basis, while adaptability, ornamental value, and CSE capacity served as the variables. The analysis aimed to minimize the total squared errors between clusters. The formula for the total sum-of-squares error is shown below:
J = k = 1 K i = 1 n k x i c k 2
where J is the total sum of squared errors, K is the number of clusters, nk is the number of data points in cluster k. xi is the first data point in the cluster; ck is the centroid of the cluster.
To minimize the total sum of squared errors, the principle of gradual convergence of the sum of squares within the clusters according to the elbow rule SEE(K) is combined with the profile coefficients close to 1 to validate the reasonableness of the clustering results further. Finally, the k-value is determined based on the clustering cloth as follows:
Cluster sum of squares formula:
S E E K = i = 1 N j = 1 K I x i C j · x i μ j 2
where N is the number of samples. K is the number of clusters,   x i is the i-th data point, μ j is the center of mass of the j-tph cluster, I x i C j is the indicator function, which indicates whether data point xi belongs to cluster Cj.
Contour coefficient calculation formula:
s i = b i a i max a i , b i
where a(i) is the average distance of data point i from other points within the same cluster. b(i) is the average distance of data point i from the nearest cluster. s(i) values close to 1 indicate good clustering; s(i) values close to 0 indicate overlap between clusters; s(i) A negative value indicates that a data point has been incorrectly assigned to a cluster.

2.3.6. Simulation of CSE Capacity Enhancement Based on Tree Regeneration

To validate and demonstrate the plant evaluation results, scenario simulation methods were employed. Dominant species from the sample trees were selected as the reference group, while trees with balanced performance in CSE capacity, adaptability, and ornamental value, based on clustering results, served as the control group. Scenarios were simulated for three application environments using i-Tree Design and CS modeling, comparing CSE and CS per and post optimization under consistent evaluation criteria. The i-Tree Design evaluates the carbon ecosystem services of individual trees or tree groups by inputting parameters such as species, location, and size. The tool integrates Google Maps to simulate UGS types over a 50-year lifecycle [25], tracking changes in CS and ecosystem services over time, helping urban planners optimize tree planting for ecological and aesthetic benefits. Currently, the tool supports only regions such as the United States, Canada, Mexico, Colombia, New Delhi, South Korea, and New Zealand, and cannot directly use climate and land use data from Zhengzhou for predictions. We used the climate comparison function in the Weather Spark website and found that the climate data for Zhengzhou is similar to that of Missouri in the United States (Figure 3). Therefore, data from Missouri was used as a proxy for estimation in the i-Tree Design tool. Weather Spark, based on historical hourly weather reports from 1980 to 2016, was used [26]. Using the i-Tree Design tool in combination with Google Maps, three actual sample plots, each approximately 1000 m2 in size, were selected based on the three set scenarios: ROAD, BUILDING, and WATER (Figures S1–S3). The site design was developed by first using the dominant tree species found in the ZMA urban green space (as identified in this study) as the control group, before optimization. The experimental group, post-optimization, consisted of plants with a balanced distribution of the three key abilities, as determined from the clustering results (Tables S3 and S4). To evaluate the changes in CS and CSE over a 50-year period, the i-Tree Design tool was applied. However, since i-Tree Design only calculates CS and CES for trees and not shrubs, further calculations will be required to assess the CS and CSE changes for the entire scene.
In Section 2.3.2 of this study, we calculated the average annual CES per unit area for different shrubs. However, most shrubs in UGS are cultivated as hedges and undergo substantial annual pruning, limiting their potential for CS accumulation. Conversely, some shrubs do not require pruning. Therefore, the shrub CS calculation model must account for these two distinct categories of shrubs based on their respective applications. By integrating data from trees and these two categories of shrubs, the plant community CS prediction model is as follows:
C = C n + 0.5 × i 1 S C S i × M i + l 1 S C S l × M l × n
where Cn is the CS of the tree community in year n, as calculated by the i-Tree tool. SCSi and Mi represent the average annual CSE of the i-th shrub species that requires pruning and its planted area. SCSl and Ml are the average annual CSE per unit area and planted area of the l-th shrub species that does not require pruning.

3. Results

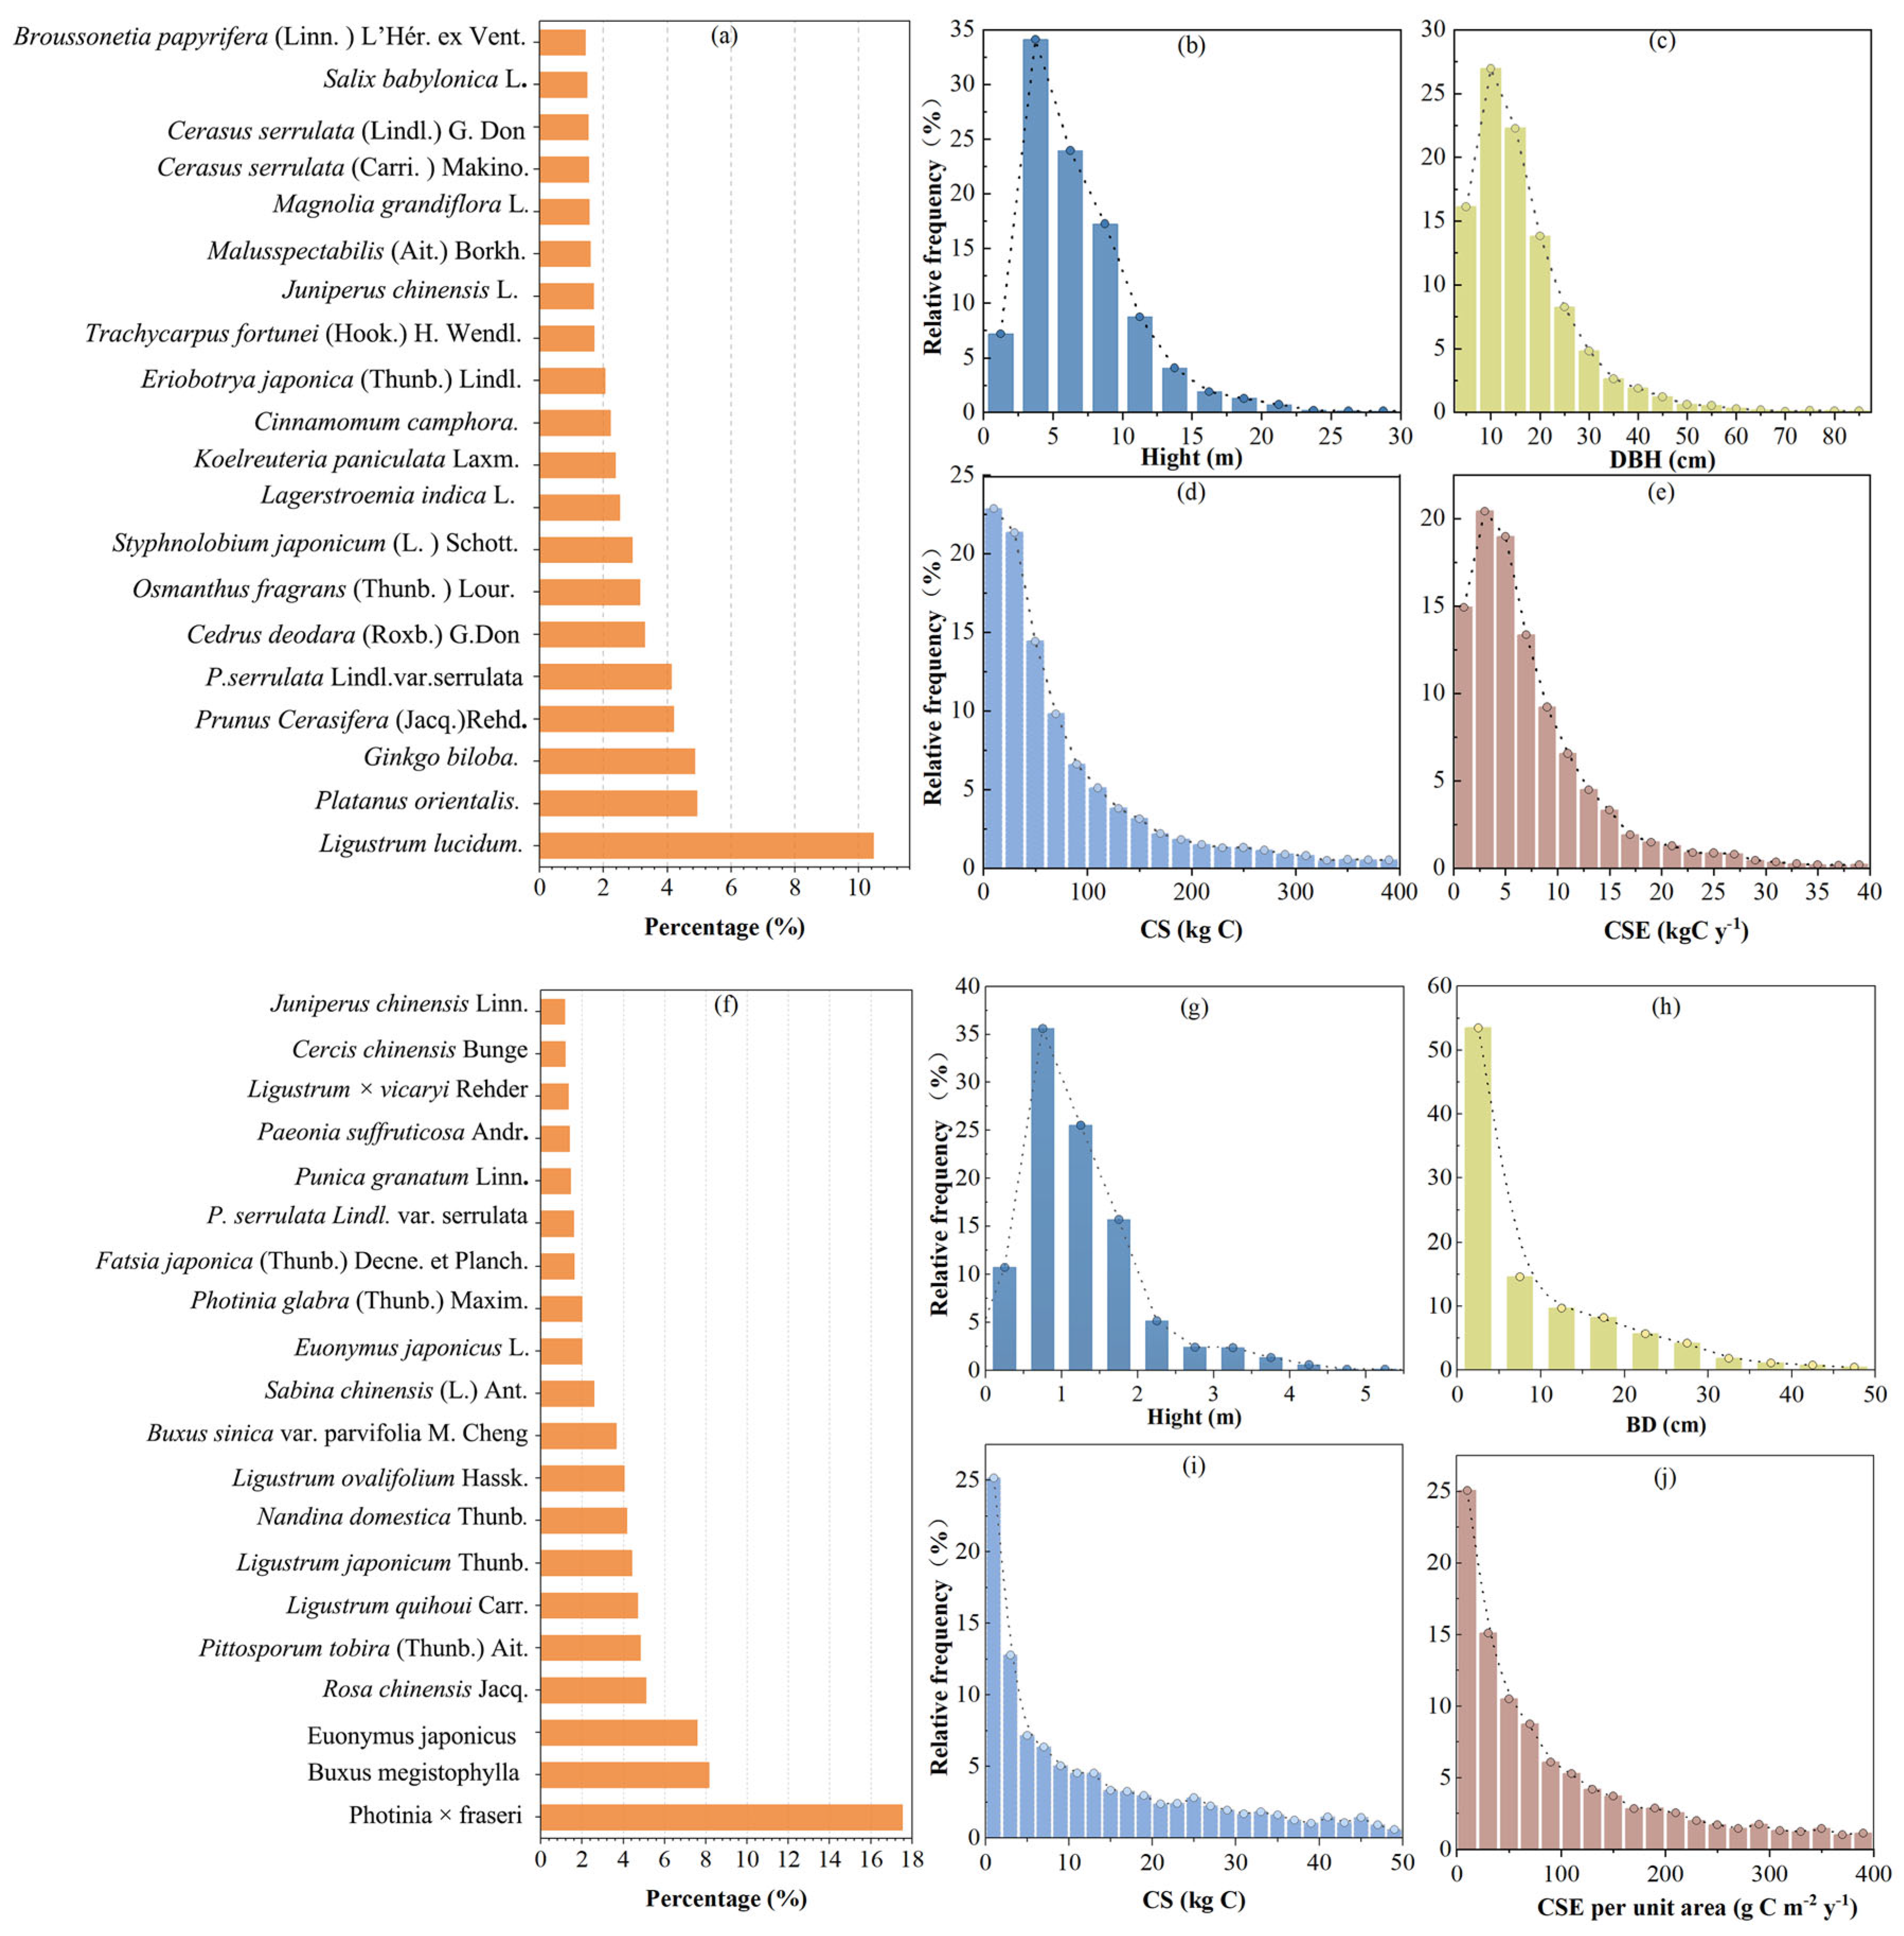
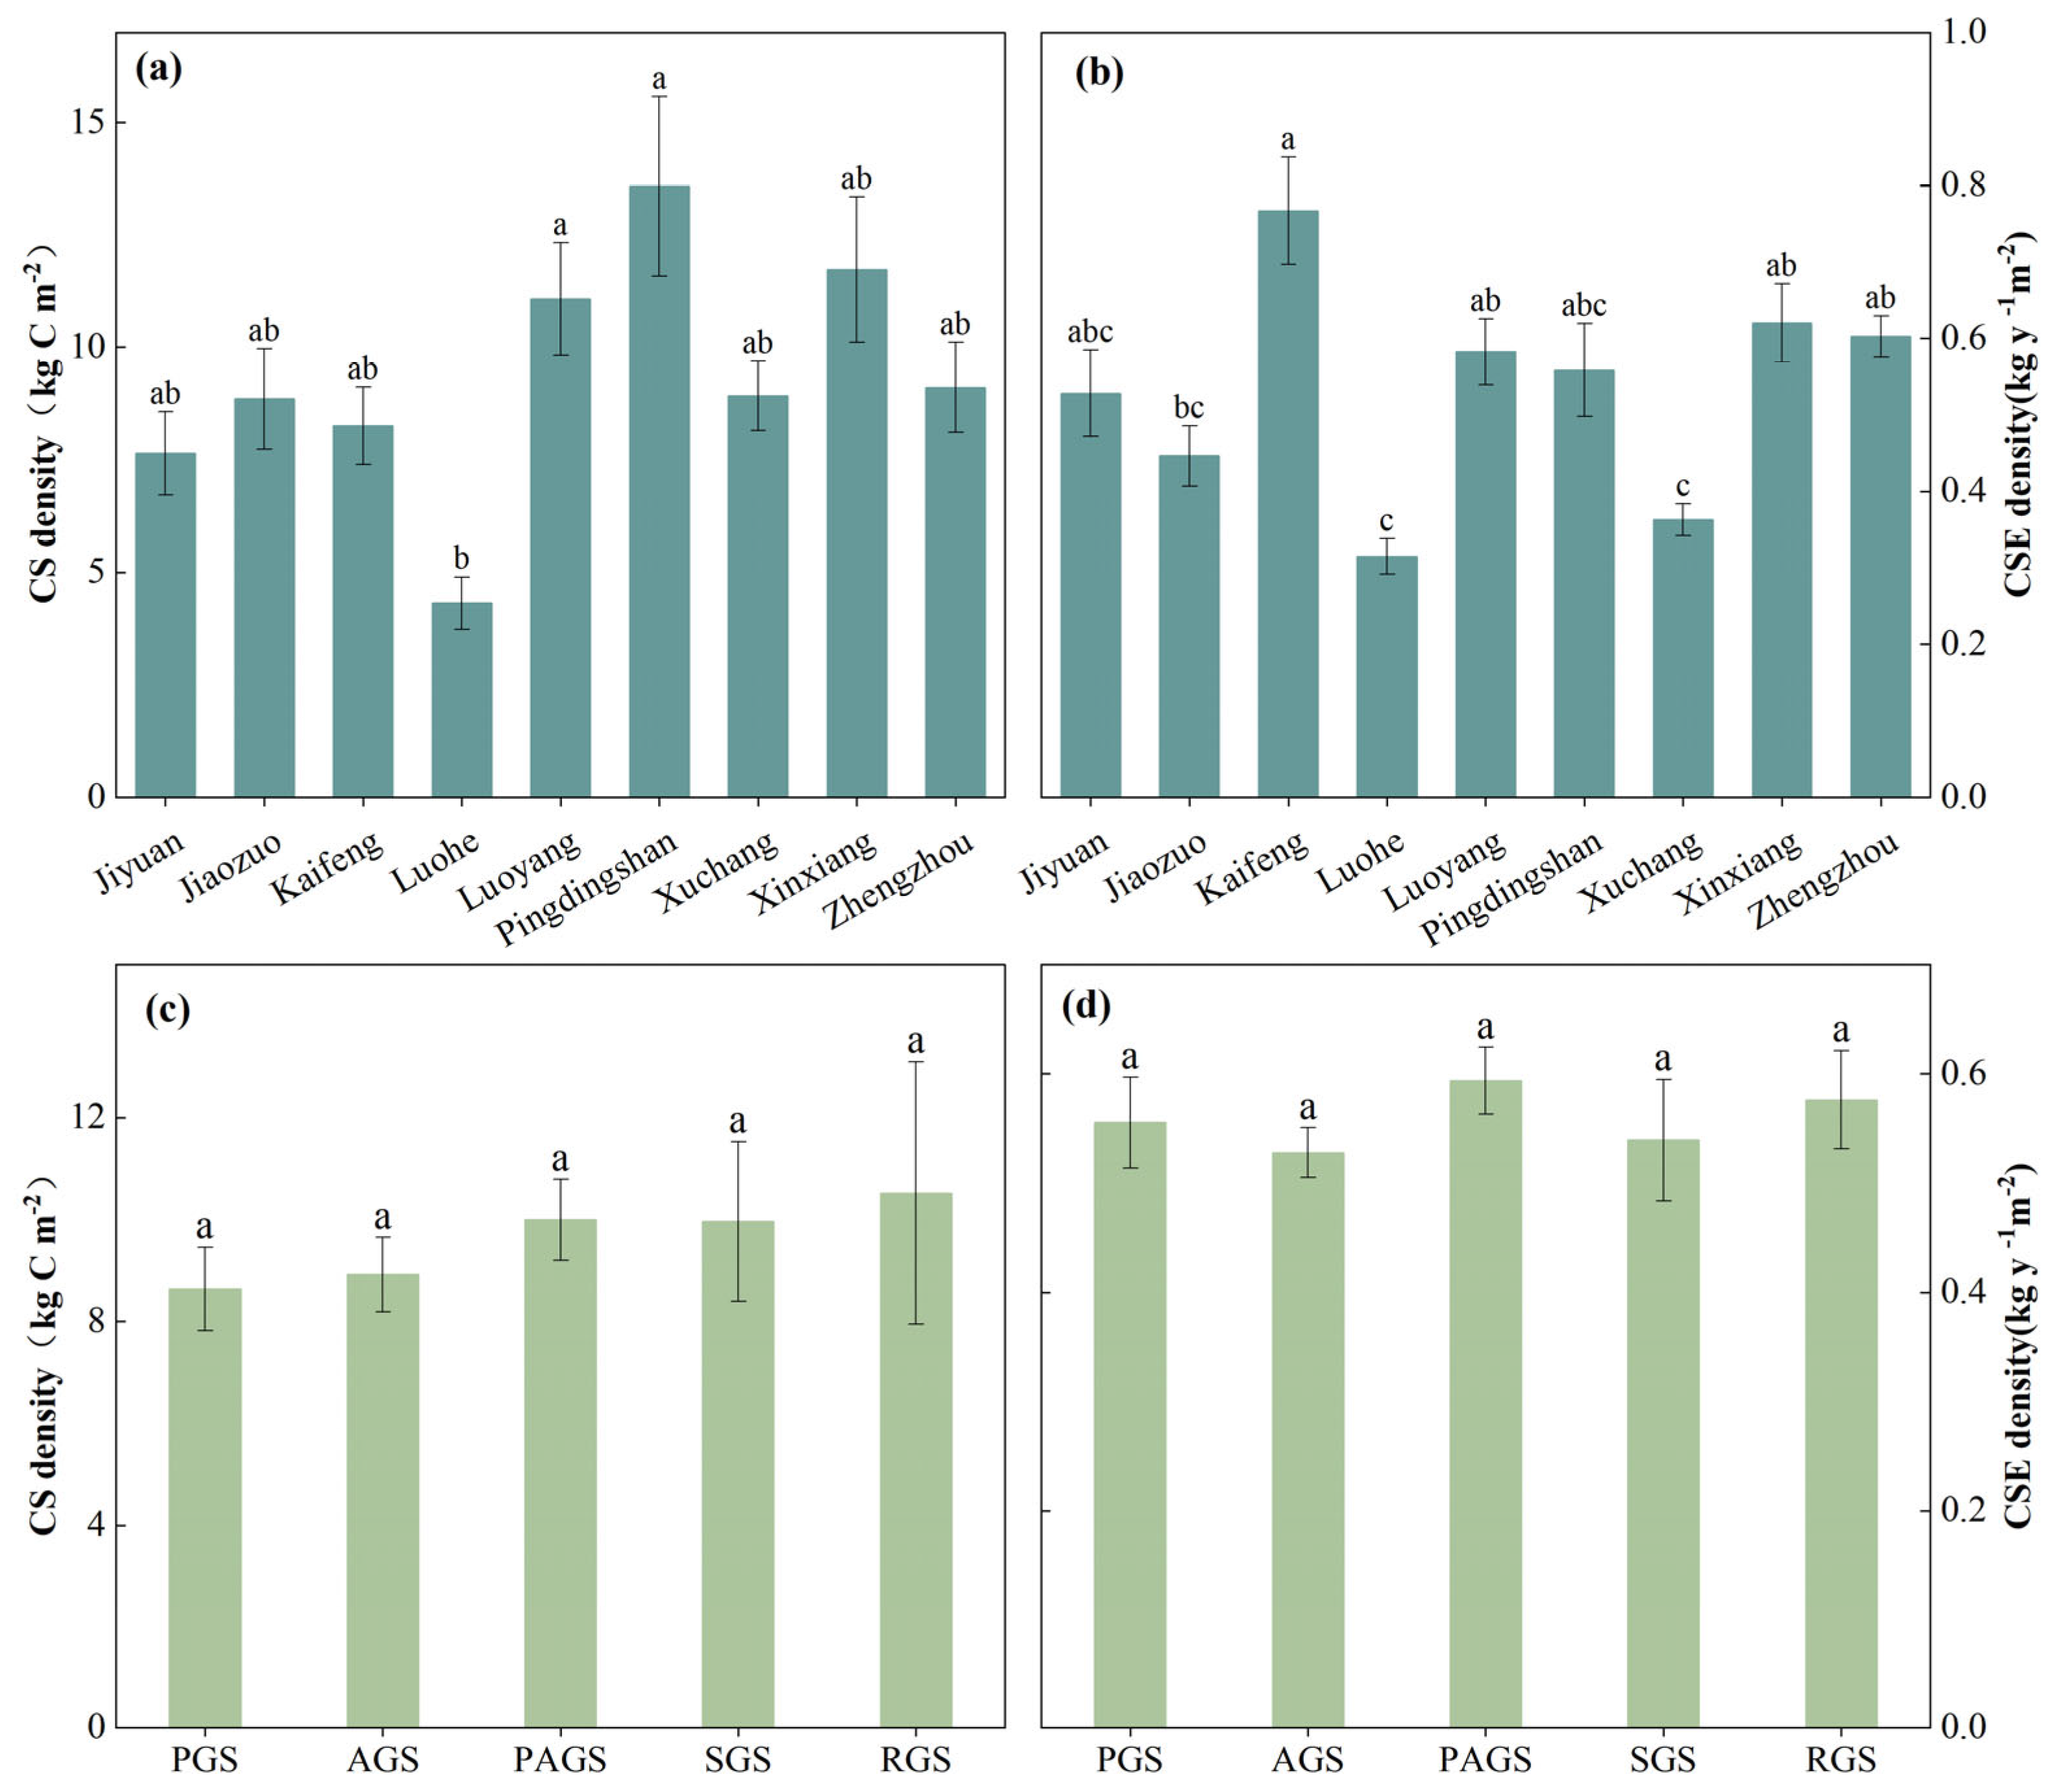
3.1. Overview of Urban Trees and Their CSE Capacity

A total of 272 plant species, representing 93 families and 173 genera, were surveyed. The sample included 147 tree species from 49 families and 95 genera, and 123 shrub species from 44 families and 78 genera. The dominant trees included Ligustrum lucidum Ait., Platanus orientalis L., and Ginkgo biloba L. (Figure 4a), while the dominant shrubs included Photinia × fraseri Dress, Buxus megistophylla Levl., and Euonymus japonicus Thunb. (Figure 4f). Notably, 71 exotic species were identified, including 34 trees such as Cinnamomum camphora (L.) Presl, Prunus cerasifera Ehrh., and Cotinus coggygria Scop, and 37 shrubs including Photinia × fraseri, Buxus megistophylla, and Ligustrum ovalifolium among others.
The trees in the study area were predominantly young, with significant CSE potential (Figure 4). The majority were medium-sized, with heights ranging from 4.5 m to 13.5 m (93.6%) and diameters at breast height between 7.5 cm and 27.5 cm (64%) (Figure 4b,c). The average CS of these trees was 130.7 kg, with an annual CSE efficiency of 7.50 kg C y−1. Of the trees with CS below 90 kg, 75.05% fall into this category. While 76.9% of trees with CSE efficiency below 10 kg C y−1 fall into the same category (Figure 4d,e). The shrubs in the study area are mainly clumping types, with heights under 1 m and basal diameters less than 5 cm (Figure 4g,h). These shrubs are commonly used as hedges. They account for 87.67% of the total samples and 77.74% of the total planting area. Most shrubs have a CS of less than 20 kg (77.56%), with 71.84% showing an average annual CSE of 0.2 kg C m−2 y−1 per unit area (Figure 4i,j).
The CSE capacity of urban trees varies significantly across cities. Pingdingshan has the highest CS density at 13.58 kg C m−2, while Luohe has the lowest at 4.31 kg C m−2. Zhengzhou, with the largest built-up area, has a CS density of 9.10 kg C m−2. The highest CSE density is found in Kaifeng, at 0.76 kg C m−2 y−1, while the lowest is in Xuchang, at 0.36 kg C m−2 y−1 (Figure 5a,b). However, the discrepancies in CS and CES across different types of green spaces are relatively small. RGS had the highest CS density, averaging 10.51 kg C m−2, while PAGS had the lowest, averaging 8.63 kg C m−2. In terms of CSE density, PGS had the highest average at 0.59 kg C m−2 y−1, while AGS had the lowest, at 0.52 kg C m−2 y−1 (Figure 5c,d).

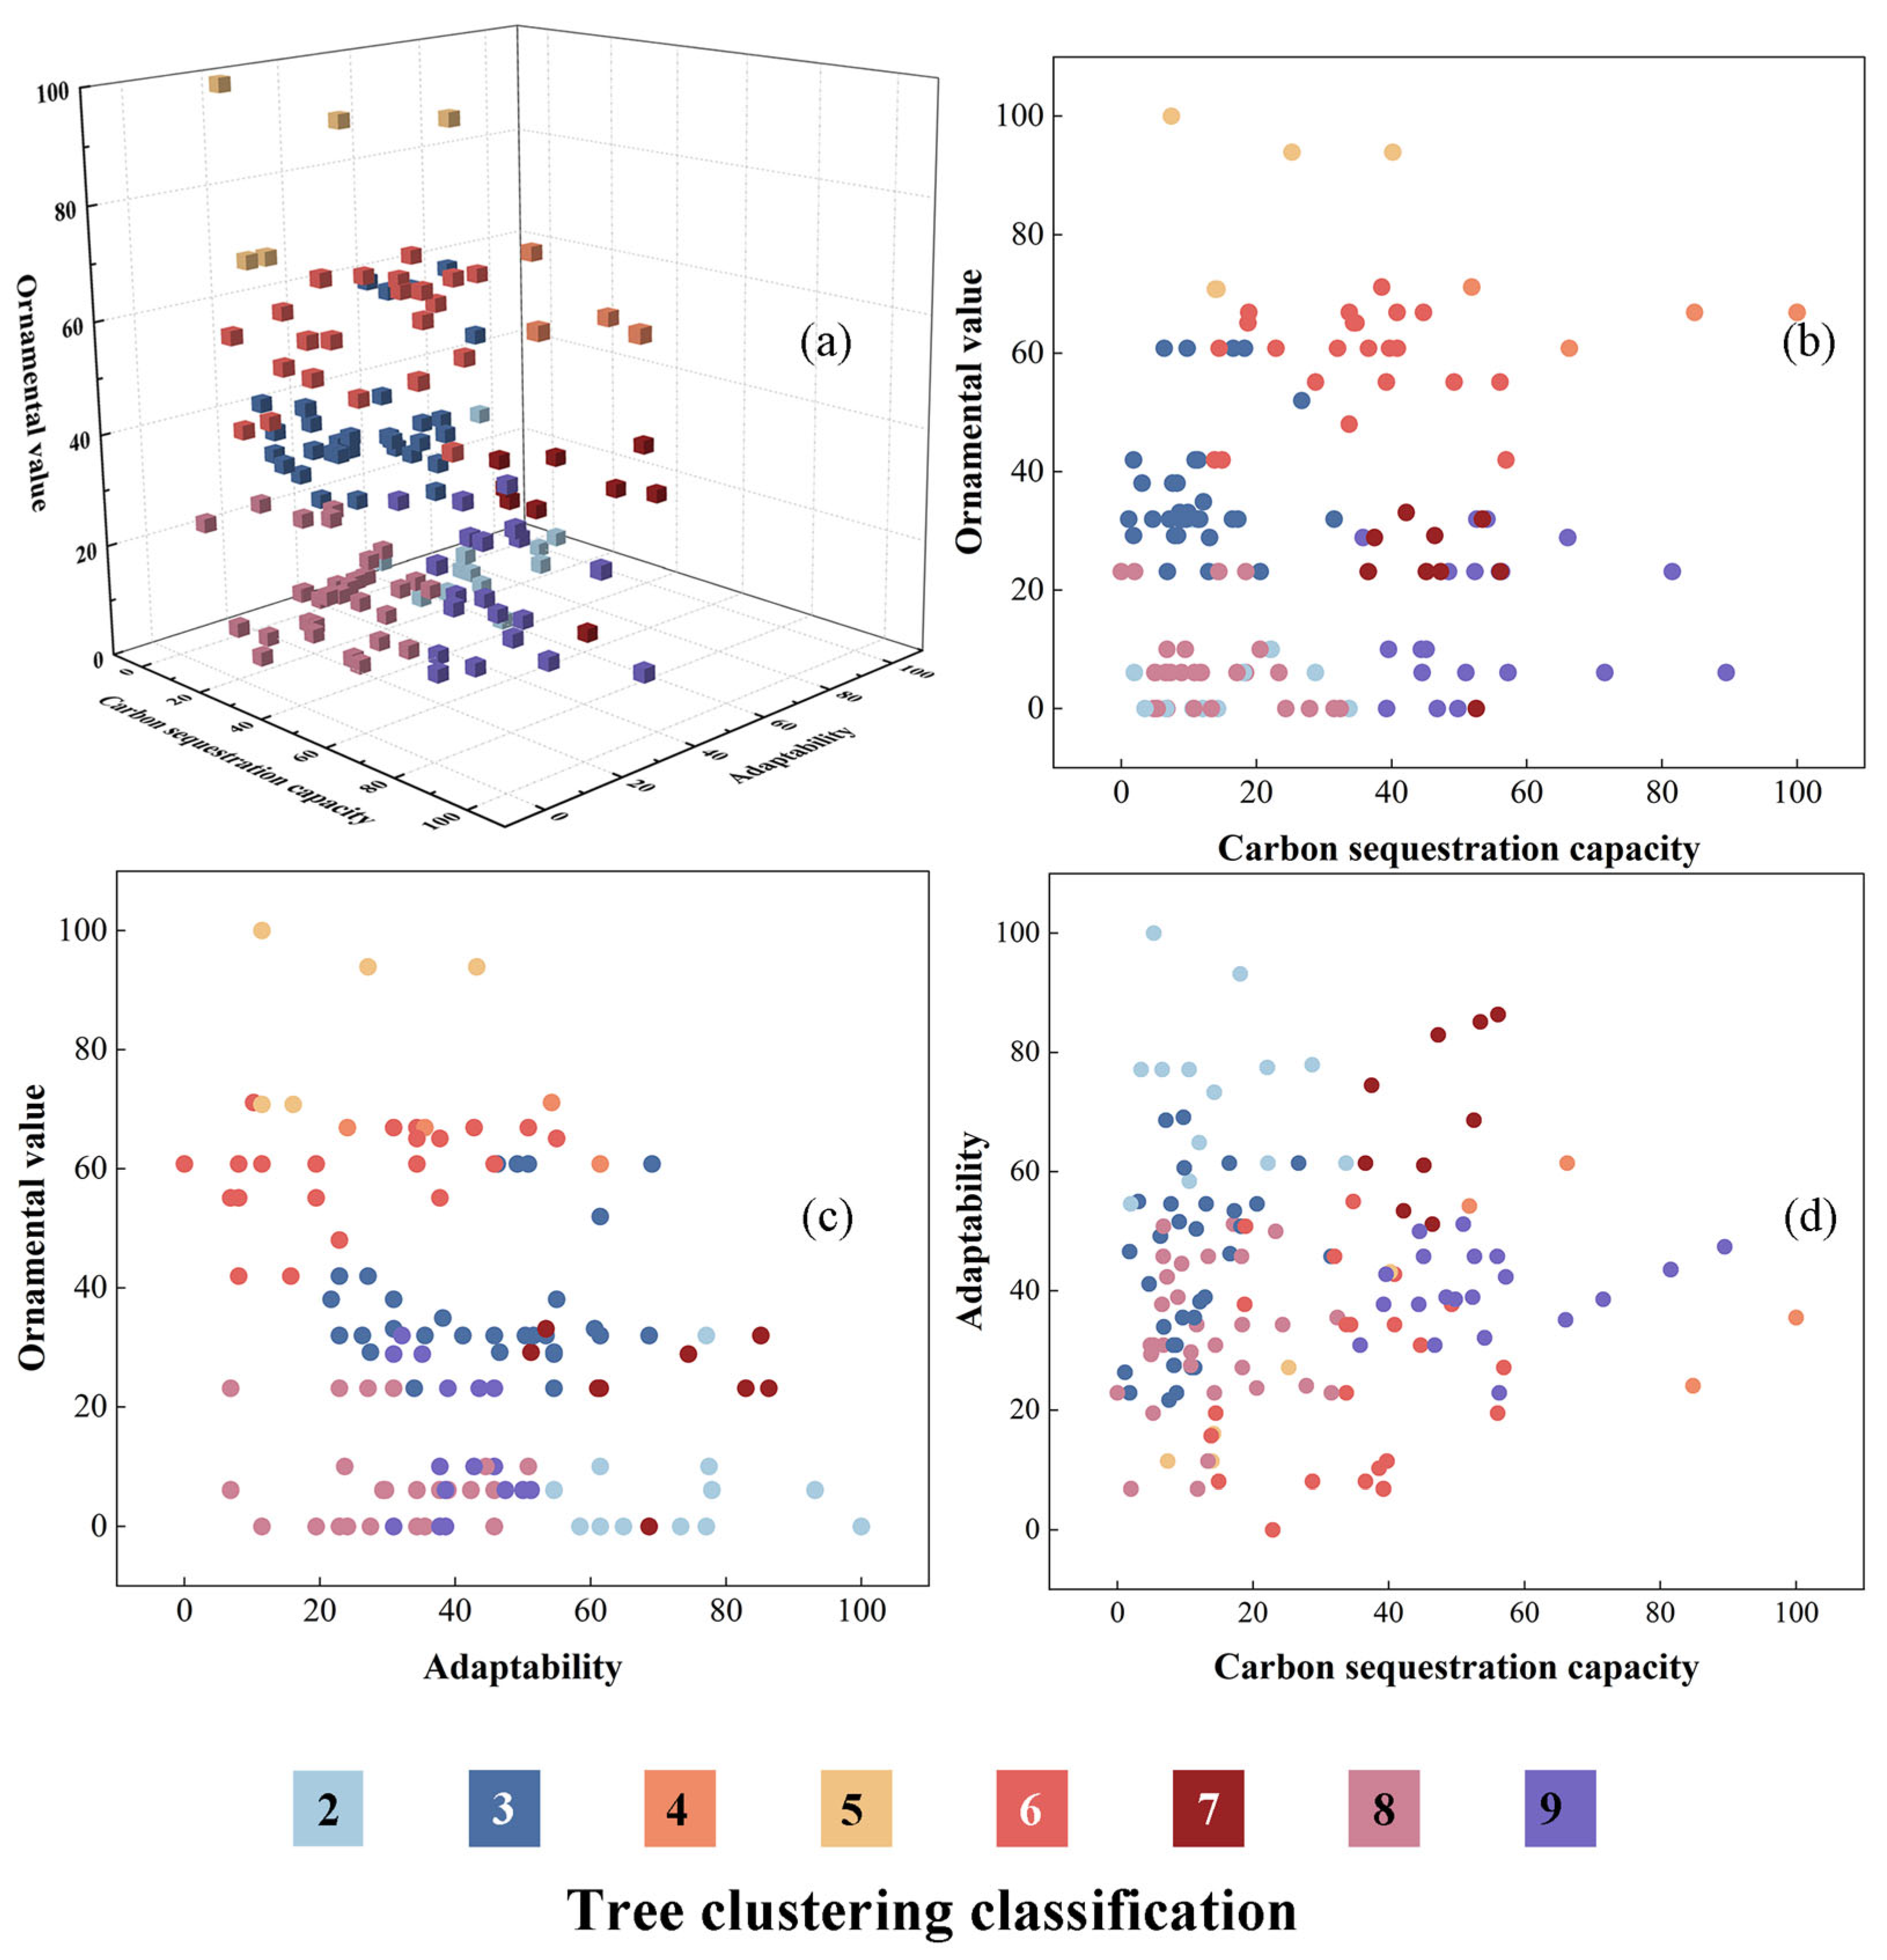
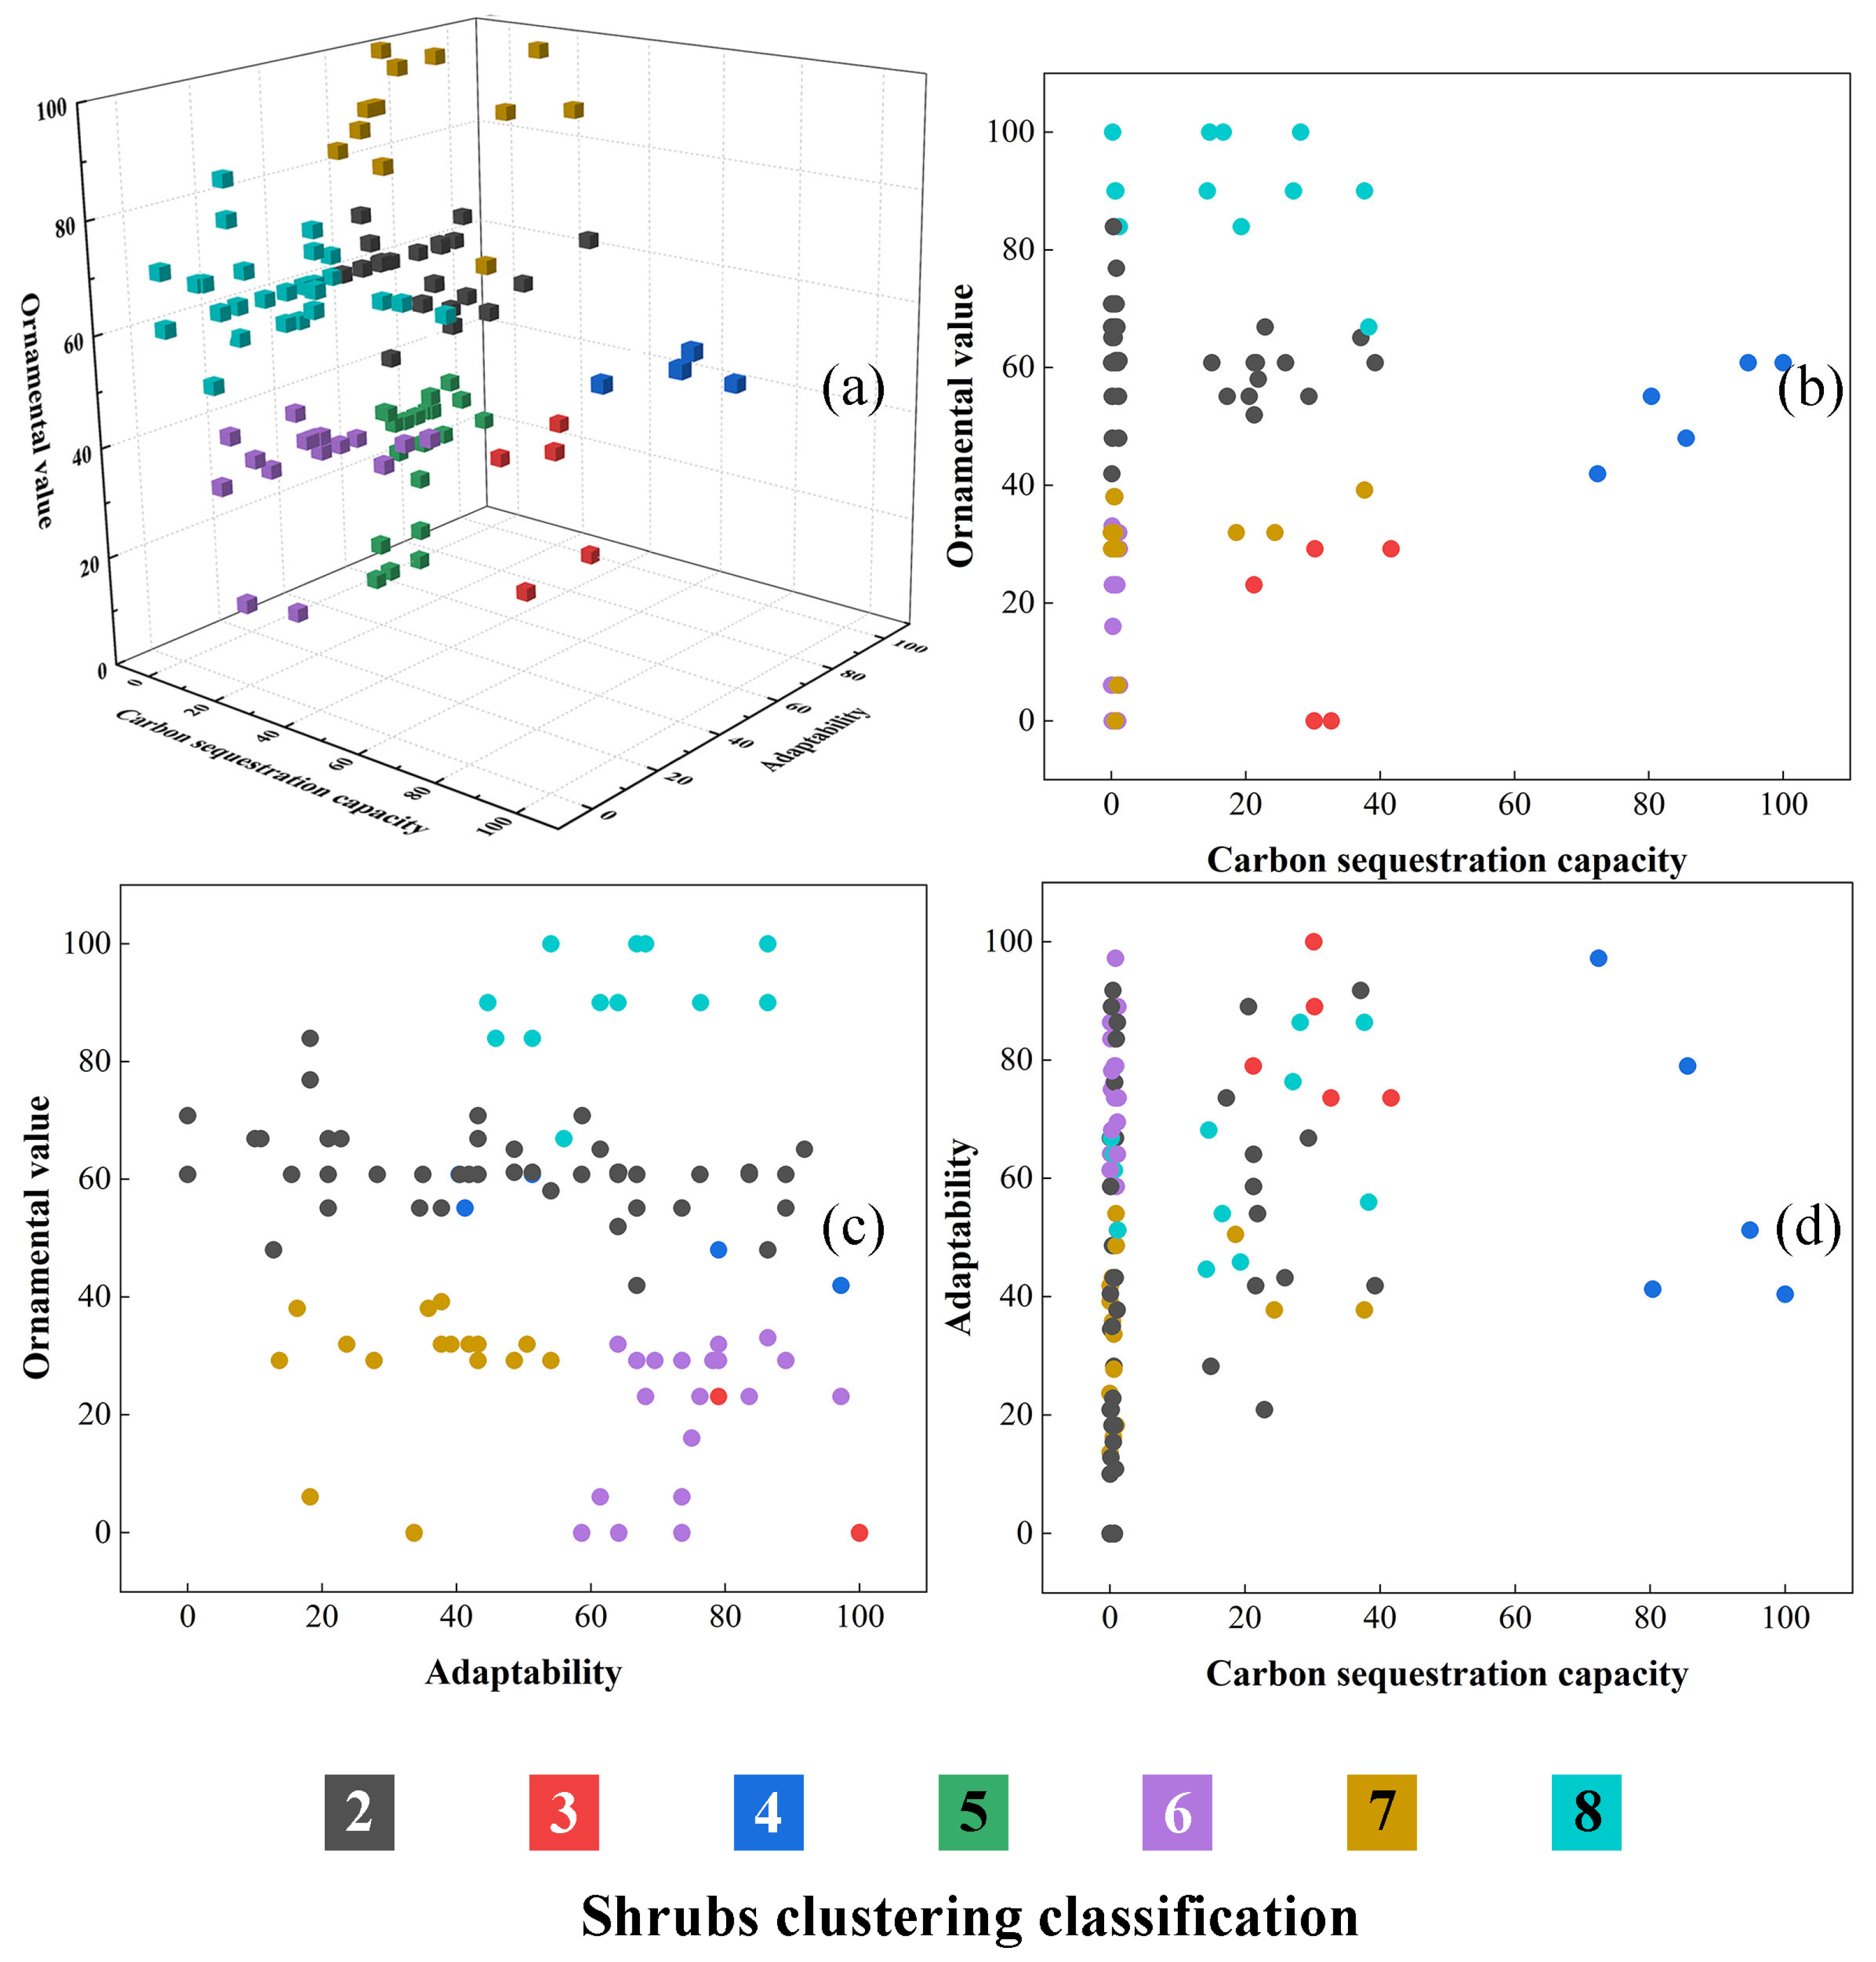
3.2. Clustering Results of Trees and Shrubs

Cluster analysis showed that trees and shrubs could be divided into nine and eight clusters, respectively (Figure 6 and Figure 7). Significant differences in CSE capacity and ornamental value exist among the clusters. Specifically (Figure 6), Cluster 1 contains trees with the highest CSE capacity, including Populus tomentosa, Bischofia polycarpa (Levl.), Ulmus pumila Linn., and Sapindus mukorossi Gaertn. These trees perform well in urban environments, though their ornamental value is limited due to their tall, deciduous nature. Cluster 9 contains trees like Salix babylonica, Heteropanax fragrans (Roxb.) Seem., and Melia azedarach Linn., which exhibit high CSE capacity, adaptability, and medium ornamental value. Trees in Cluster 6, including Michelia alba DC., Liriodendron chinense (Hemsl.) Sarg., Syringa oblata Lindl., and Magnolia denudata Desr., demonstrate high CSE capacity and ornamental value but have relatively poor adaptability (Table S3).
In the shrub clustering analysis (Figure 7), Cluster 1 exhibits the highest CSE capacity but only moderate adaptability and ornamental value. Representative species in this cluster include Punica granatum, Amygdalus triloba Bunge, Berberis thunbergii Pers., and Syringa vulgaris L. Shrubs in Cluster 8 include Euonymus japonicus, Abelia biflora, Kerria japonica., and Eriobotrya japonica. These species demonstrate high CSE capacity, adaptability to urban environments, and notable ornamental value. In contrast, shrubs in Clusters 5 and 7 such as Buxus megistophylla, Rosa chinensis, Rosa roxburghii Tratt. and Ligustrum quihoui, have considerable ornamental value but relatively low CSE capacity. Shrubs in Clusters 2 and 3, including Illicium verum L., Pyracantha fortuneana (Maxim.) Li, Vitex negundo L. and Hypericum patulum Thunb ex-Murray, show no notable CSE capacity or ornamental value. However, they demonstrate a strong capacity for adaptability (Table S4).

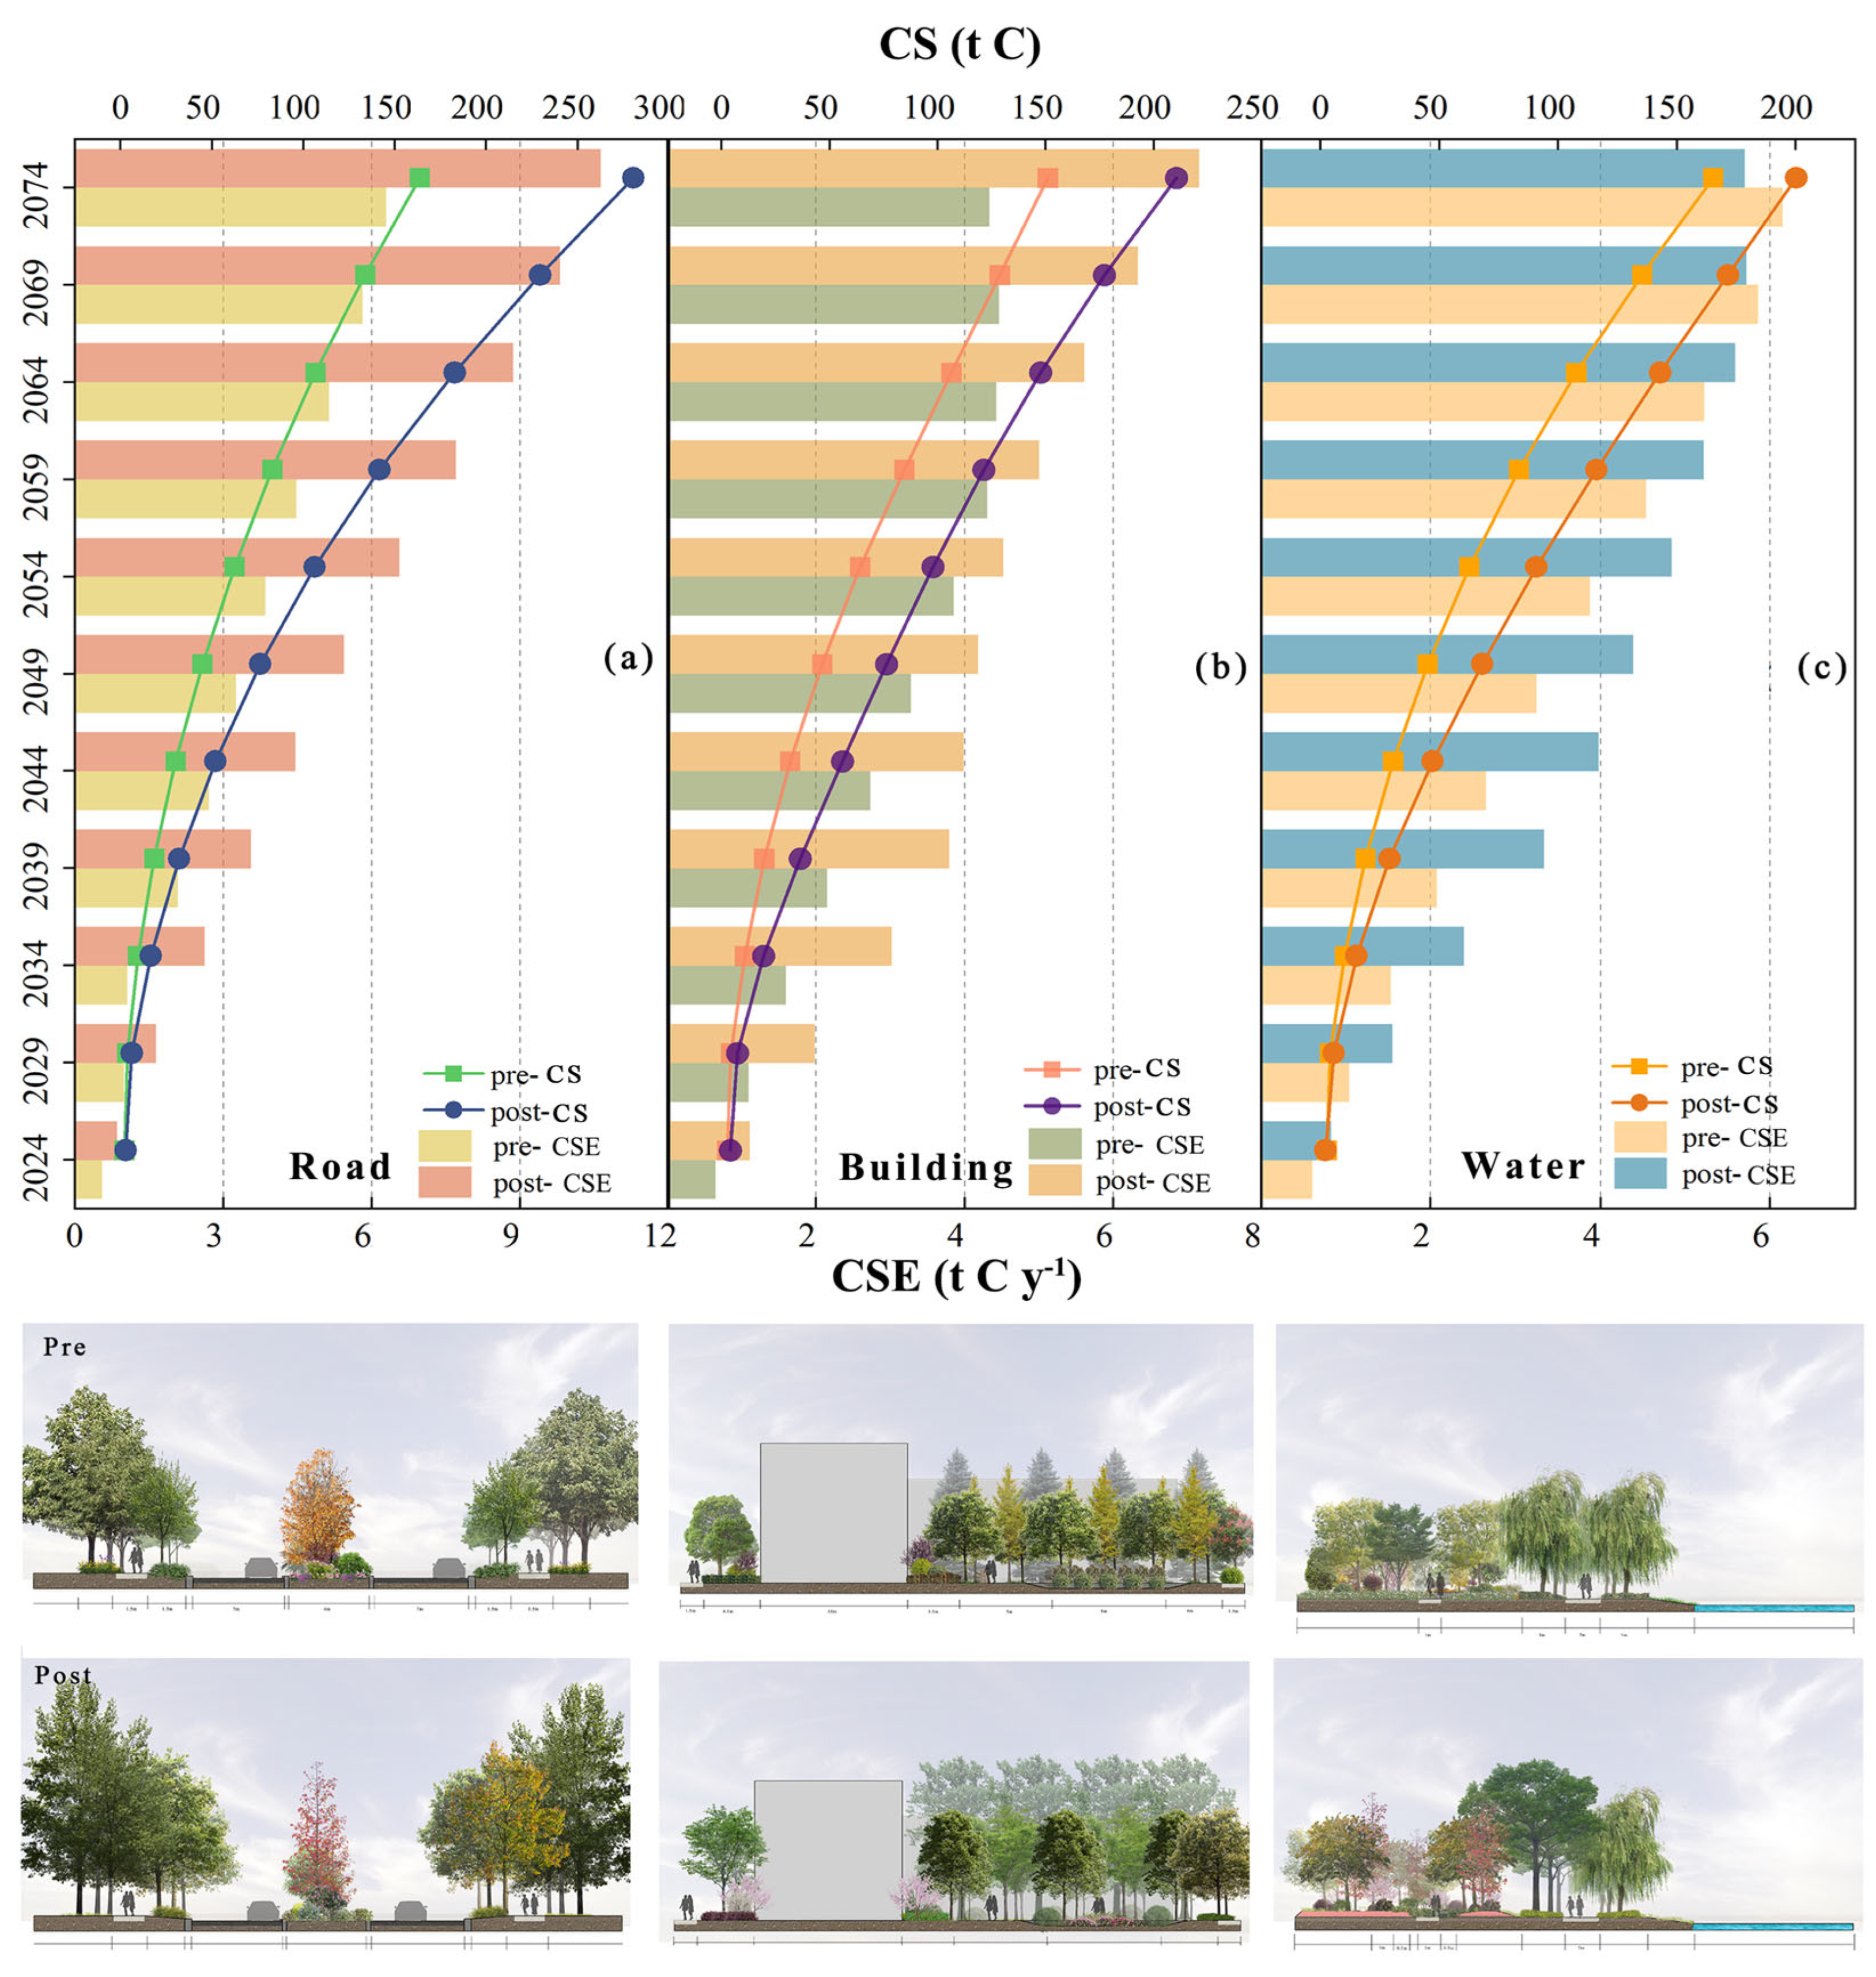
3.3. Impact of Trees Renewal on Enhancing CES Capacity

After renewing the tree and shrub species, both CSE and CS in UGS increased. By the 50th year, the CSE of road scene increased from 6.27 t C y−1 to 10.61 t C y−1, representing a 43.0% growth (Figure 8a). Similarly, the CS of building scene rose from 4.33 t C to 7.15 t C, indicating a 39.4% growth (Figure 8b). While the CSE of water scene declined from 6.14 t C y−1 to 5.69 t C y−1 (a 7.3% reduction), their CS increased from 165.29 t C to 200.19 t C, representing a 17.4% increase (Figure 8c). The growth rates increased rapidly during the initial planting years and gradually stabilized, with average growth rates from 40.5% to 31.5%. Detailed plant information before and after optimization is provided in Figures S1–S6 and Tables S5–S7.

4. Discussion

4.1. Regional Disparities and Comparative Analysis of CSE Capacity in UGS of the ZMA

Our results show that the average CS density of UGS in the ZMA is 9.32 kg C m−2, with an average CSE density of 0.55 kg C m−2 y−1. These values are comparable to those reported in Spain [27], significantly higher than those previously documented in Henan Province, China, and above the 2010 national average for UGS across major cities in China [28]. However, they remain notably lower than those observed in most cities in the United States [29,30,31] (Table 2), This contrast underscores the substantial progress that the ZMA has made in green space development and ecological improvements over the past decade, while also highlighting the untapped potential for further enhancing its CSE capacity. Unlike previous localized studies on Zhengzhou’s UGS, this research adopts a metropolitan perspective, covering nine cities to systematically analyze regional CS and CES. These findings provide a more comprehensive scientific foundation for future ecological planning.
A detailed analysis of CS and CES across the nine cities in the ZMA reveals significant spatial disparities. Pingdingshan ranks first in CS density, while Zhengzhou, the most economically developed city in the metropolitan area, ranks only fourth. This disparity can primarily be attributed to differences in natural conditions. Pingdingshan, located in the Huaibei Plain climate zone, benefits from an annual average temperature of 15 °C and precipitation of 1000 mm [33], creating an ideal environment for plant growth and significantly enhancing its CSE capacity. Moreover, historically, the city’s economic landscape was predominantly shaped by the coal and steel industries, which led to significant levels of air pollution. In recent years, government-led environmental strategies have driven a significant expansion of eco-tourism in Pingdingshan, fostering both economic revitalization and ecological restoration [34]. In contrast, Zhengzhou faces prolonged cold seasons and extreme summer temperatures (42–43.6 °C), creating suboptimal conditions for plant growth. Furthermore, rapid urbanization in Zhengzhou intensifies the urban heat island effect [35]. The proliferation of impervious surfaces coupled with soil compaction further degrades ecological functions and diminishes the CSE capacity of urban green spaces. Divergent green space coverage and management approaches between cities emerge as critical determinants. Pingdingshan exhibits higher green space coverage with diverse vegetation, whereas Zhengzhou’s urban green spaces face intensified urbanization pressures, where development priorities often prioritize economic growth over ecological considerations.
The analysis identifies multiscale drivers of CSE capacity in UGS, operating across macro and micro levels. At the macro scale, regional climate patterns, urbanization intensity, and green space spatial distribution constitute primary determinants of sequestration potential [36,37]. At the micro scale, vegetation community structure and species composition critically govern CES capacity. Future CSE optimization requires integrated multiscale strategies spanning macro and micro dimensions. At the regional level, ecological collaboration among cities within the metropolitan area should be strengthened. Building green space networks can optimize overall ecosystem functionality [38]. Simultaneously, promoting technology sharing and joint governance can reduce disparities in CES capacity among cities. At the micro level, efforts should focus on improving the ecological quality of green spaces. Specific measures include introducing high-efficiency carbon-sequestering plants adapted to local climates, optimizing vegetation arrangements, and enhancing soil conditions (e.g., reducing compaction and increasing nutrient content) to boost CES capacity. Additionally, future studies should adopt more refined evaluation methods to explore the specific contributions of different green space types to CES. This can provide scientific guidance for UGS development and achieving carbon neutrality goals. Implementing these strategies would enable the Central Plains Urban Agglomeration to maximize its green space CSE potential, thereby advancing climate resilience and accelerating regional carbon neutrality.

4.2. Selection of UGS Plant Species Based on CSE Capacity

This study employs functional trait cluster analysis to develop a plant selection framework integrating CSE, ecological adaptability, and aesthetic value, thereby providing a scientific basis for UGS planning. This approach diverges from the conventional “right tree for the right place” paradigm [39] by prioritizing multifunctional plant traits to address the complex demands of contemporary UGS.
Cluster 1 trees exhibit high CSE potential and adaptability despite limited aesthetic value, positioning them as optimal candidates for functional landscapes such as street tree plantings and protective forests. As large, long-lived deciduous broadleaves, these species thrive in settings prioritizing ecological function over aesthetics, including roadside buffers and urban windbreaks. Planting these species in concentrated areas can quickly boost the city’s overall CSE capacity and strengthen ecological stability. Additionally, Cluster 1 shrubs have moderate aesthetic value, but their high adaptability and CSE potential make them valuable for protective forests and ecological restoration [40].
In contrast, Cluster 9 trees are more balanced, making them ideal as cornerstone species for large UGS. Planting these species provides both CSE and aesthetic benefits, in line with the current UGS development concept of “ecological and aesthetic optimization” [41]. Cluster 8 shrubs excel in adaptability and aesthetics, making them perfect for road hedges and understory plantings. By integrating with trees and herbaceous plants to create multi-layered landscapes, they further enhance the overall CSE function of UGS and improve their overall benefits [42]. Cluster 6 trees show excellent aesthetic and CSE properties, but their lower adaptability and higher maintenance costs limit their broader use. These species are better suited to locations with higher landscape demands, such as parks or specialty ornamental gardens [43]. Similarly, Category 2 and 3 shrubs have moderate CSE abilities, but their strong adaptability makes them valuable for use in extreme environments like brownfield restoration [44]. This supports Song et al. (2019) [45] who put an emphasis on superior nature-based solutions in environmental restoration.
Although the high-CSE species identified in this study offer substantial ecological benefits, their actual application remains limited. For example, species like Ligustrum lucidum, Platanus orientalis, Photinia × fraseri, and Buxus megistophylla. are planted far less frequently in UGS than low-carbon species such as Bischofia polycarpa Airy Shaw, Populus tomentosa, and shrub Forsythia suspensa (Thunb.) Vahl, which are easier to Lagerstroemia indica maintain. This reflects the trade-off between functionality and cost in urban greening [46,47]. Additionally, the high-CSE species identified in this study differ notably from those recommended by local governments (e.g., Cedrus deodara, Pinus tabuliformis Carrière, and Melia azedarach). Government-recommended species often prioritize landscape features like crown spread, overlooking their long-term CSE potential. Cheng et al. [15] highlights that the CSE capacity of certain high-crown species decreases significantly as they mature. This discrepancy underscores the need for data-informed multifunctional optimization in urban greening strategies to align ecological and aesthetic objectives [48].

4.3. Optimizing CSE Capacity Through Plants Selection

This study demonstrates that plant regeneration significantly enhances CES capacity in UGS, with CS increasing by 23.2%–42.0% and CES rates by 31.5%–40.1%. In Chinese urban ecosystems, plant regeneration elevates CS by 0.43–0.79 Mg C and annual CES by 5.89–7.48 Mg C yr−1 [28]. Applying Churkina [6] methodology, strategic plant species selection could augment global CS by 0.12–1.80 Pg C, offsetting 4.2%–25.4% of fossil fuel-derived CO2 emissions. These findings underscore plant regeneration’s potential as a climate mitigation strategy aligned with dual carbon neutrality goals.
However, riparian green spaces exhibited constrained CSE improvements post-optimization, with some cases showing diminished capacity relative to baseline conditions. This discrepancy with Jiang et al. (2023) [49] conclusions likely arises from temporal scaling limitations in carbon assessment protocols, which inadequately resolve riparian ecosystems’ longitudinal sequestration dynamics. Key drivers include plant–soil feedback mechanisms, carbon pool turnover rates, and ecosystem resilience thresholds [50]. Therefore, long-term monitoring and comprehensive assessment of the CSE capacity of riparian green spaces are recommended.
Our model predictions show that plant regeneration can bring a huge carbon sink potential to urban green spaces and also indicate the main position of plants in carbon sinks in urban green spaces. Therefore, we should pay more attention to the growth characteristics of plants in urban green spaces in the future. The change in carbon sequestration capacity of plants is similar to the S-curve of plant growth, which is characterized by rapid accumulation in the early stages and then tends to stabilize [51]. During the early stages, rapid plant growth significantly enhances CES capacity, but as nutrients are consumed and plant biomass increases, carbon respiration begins to offset carbon fixation via photosynthesis [52]. Sustained CES capacity requires adaptive management strategies including density optimization, photoperiod-enhancing pruning [53], precision nutrient delivery, and aerostructure amelioration [54].
Thoughtful planning of green space landscapes and vegetation communities is an effective way to enhance CSE capacity. Research has shown that increasing the aggregation of green spaces, reducing edge fragmentation [55,56], expanding patch sizes, and enhancing connectivity [57] significantly improves CES capacity. Moreover, multi-layered vegetation (such as trees, shrubs, and grass) helps optimize light absorption and enhance overall CS [58]. Heterogeneous green spaces store approximately 30% more carbon than homogeneous ones [59]. Notably, a three-layered vegetation structure not only enhances CSE potential but also improves ecological stability and climate regulation in green spaces [60]. In conclusion, future UGS development should adopt plant regeneration as the driving engine to establish a carbon sink enhancement system characterized by “structural optimization and precision management”, thereby advancing cities’ transition from passive emission reduction to active carbon sequestration.

5. Conclusions

This study addresses global climate change and supports the achievement of dual-carbon target by integrating three key factors: plant CSE capacity, adaptability, and ornamental value. Through field surveys, the i-Tree model, cluster analysis and scenario simulations, we quantified the CSE capacity of urban plants in the ZMA, identifying plants species that fulfill both CSE capacity and functional requirements for green spaces. This approach provides valuable, scientifically grounded insights for urban planning and renewal, unlocking the full ecological potential of UGS. The study revealed that green spaces in the built-up areas of major cities in the ZMA are predominantly composed of native species and young trees, offering significant potential for further carbon sequestration. The CS and CES density in the study area are 9.32 kg C m−2 and 0.55 kg C m−2 y−1, respectively, representing a notable improvement over previous studies, and reflecting advancements of ecological civilization. While there are considerable variations in CSE density across cities, differences among green space types are minimal. As urbanization progresses and knowledge-sharing in UGS construction techniques improves, these intercity discrepancies are expected to decrease. However, the current use of high-carbon-sequestering plants in UGS remains limited, presenting an opportunity for optimization. Additionally, our research explored the CS potential from plant renewal, estimating increases in CSE capacity ranging from 31.5%–40.1%. On a global scale, this could offset approximately 4.2%–25.4% of CO2 emissions from fossil fuel combustion. This study highlights the CSE potential of UGS by plant regeneration and provides guidance for low-carbon urban development. As climate change intensifies, the role of UGS in CSE will become increasingly crucial for environmental management. Governments and urban planners should prioritize plant selection and optimize green space structures to enhance ecological benefits. Through effective vegetation management and planning, we can create more resilient urban ecosystems, significantly contributing to the fight against climate change.

Supplementary Materials

The following supporting information can be downloaded at: https://www.mdpi.com/article/10.3390/f16030536/s1, Figure S1. Scene road’s actual sample plots; Figure S2. Scene building’s actual sample plots; Figure S3. Scene water’s actual sample plots; Figure S4. Design drawings before and after along roads optimization; Figure S5. Design drawings before and after building optimization; Figure S6. Design drawings before and after water optimization; Note: The top is the pre-optimisation plan and elevation, the bottom is the post-optimisation plan and elevation; Table S1. Tree evaluation Index; Table S2. Shrub evaluation index; Table S3. Tree clustering information; Table S4. Shrub clustering information; Table S5. Planting information before and after scene road optimization; Table S6. Planting information before and after scene building optimization; Table S7. Information on plant growing before and after scenario water optimization.

Author Contributions

Conceptualization, P.S. and S.G.; Methodology, M.Z.; Software; Formal analysis, L.Z.; Investigation, L.Z., Z.Y., M.Z. and H.Z.; Resources, L.Z., Z.Y. and A.L.; Data curation, M.W.; Writing—original draft, Q.R.; Writing—review and editing, A.L., R.S., P.S. and S.G.; Visualization; Supervision, M.W.; Project administration, Z.Y.; Funding acquisition, P.S. and S.G. All authors have read and agreed to the published version of the manuscript.

Funding

This study was funded by the National Natural Science Foundation of China, grant number 32460421, and the Key Technology R&D Program of Henan Province, grant number 242102320320 and 242102320330.

Data Availability Statement

The data presented in this study are available on request from the corresponding authors.

Conflicts of Interest

The authors declare no conflicts of interest.

Abbreviations

CScarbon storage (kg C)
CSEcarbon sequestration (kg C y−1)
CSE capacitycarbon sequestration capacity is an aggregate of carbon stocks and sequestration, representing no specific unit of their ability to fix carbon.
CS densitycarbon storage density (kg C m−2)
CSE densitycarbon sequestration density (kg C y−1 m−2)
CSE per unit areacarbon sequestration per unit area (g C y−1 m−2)

References

  1. World Development Indicators | Data Catalog. Available online: https://datacatalog.worldbank.org/search/dataset/0037712/World-Development-Indicators (accessed on 13 January 2025).
  2. Zhang, C. A Novel Analysis of Consumption-Based Carbon Footprints in China: Unpacking the Effects of Urban Settlement and Rural-to-Urban Migration. Glob. Environ. Change 2016, 39, 285–293. [Google Scholar] [CrossRef]
  3. Feng, R.; Liu, S.; Wang, F.; Wang, K.; Gao, P.; Xu, L. Quantifying the Environmental Synergistic Effect of Cooling-Air Purification-Carbon Sequestration from Urban Forest in China. J. Clean. Prod. 2024, 448, 141514. [Google Scholar] [CrossRef]
  4. Goodwin, S.; Olazabal, M.; Castro, A.J.; Pascual, U. Global Mapping of Urban Nature-Based Solutions for Climate Change Adaptation. Nat. Sustain. 2023, 6, 458–469. [Google Scholar] [CrossRef]
  5. Heath, L.S.; Smith, J.E.; Skog, K.E.; Nowak, D.J.; Woodall, C.W. Managed Forest Carbon Estimates for the US Greenhouse Gas Inventory, 1990–2008. J. For. 2011, 109, 167–173. [Google Scholar]
  6. Churkina, G. The Role of Urbanization in the Global Carbon Cycle. Front. Ecol. Evol. 2016, 3, 144. [Google Scholar] [CrossRef]
  7. Jia, X.; Han, H.; Feng, Y.; Song, P.; He, R.; Liu, Y.; Wang, P.; Zhang, K.; Du, C.; Ge, S.; et al. Scale-Dependent and Driving Relationships between Spatial Features and Carbon Storage and Sequestration in an Urban Park of Zhengzhou, China. Sci. Total Environ. 2023, 894, 164916. [Google Scholar] [CrossRef]
  8. Shafique, M.; Xue, X.; Luo, X. An Overview of Carbon Sequestration of Green Roofs in Urban Areas. Urban For. Urban Green. 2020, 47, 126515. [Google Scholar] [CrossRef]
  9. Zhao, D.; Cai, J.; Xu, Y.; Liu, Y.; Yao, M. Carbon Sinks in Urban Public Green Spaces under Carbon Neutrality: A Bibliometric Analysis and Systematic Literature Review. Urban For. Urban Green. 2023, 86, 128037. [Google Scholar] [CrossRef]
  10. Le Noë, J.; Matej, S.; Magerl, A.; Bhan, M.; Erb, K.-H.; Gingrich, S. Modeling and Empirical Validation of Long-Term Carbon Sequestration in Forests (France, 1850–2015). Glob. Change Biol. 2020, 26, 2421–2434. [Google Scholar] [CrossRef]
  11. Dahlhausen, J.; Rötzer, T.; Biber, P.; Uhl, E.; Pretzsch, H. Urban Climate Modifies Tree Growth in Berlin. Int. J. Biometeorol. 2018, 62, 795–808. [Google Scholar] [CrossRef]
  12. McPherson, E.G.; Simpson, J.R. Carbon Dioxide Reduction through Urban Forestry: Guidelines for Professional and Volunteer Tree Planters; Gen. Tech. Rep. PSW-GTR-171; U.S. Department of Agriculture, Forest Service, Pacific Southwest Research Station: Albany, CA, USA, 2022; 237p. [Google Scholar] [CrossRef]
  13. Moss, J.L.; Doick, K.J.; Smith, S.T.; Shahrestani, M. Influence of evaporative cooling by urban forests on cooling demand in cities. Urban For. Urban Green. 2019, 37, 65–73. [Google Scholar] [CrossRef]
  14. Nowak, D.J.; Hirabayashi, S.; Doyle, M.; McGovern, M.; Pasher, J. Air Pollution Removal by Urban Forests in Canada and Its Effect on Air Quality and Human Health. Urban For. Urban Green. 2018, 29, 40–48. [Google Scholar] [CrossRef]
  15. Chen, W.; Wang, G.; Zeng, J. Impact of Urban Expansion on Ecosystem Services in Different Urban Agglomerations in China. Int. J. Environ. Sci. Technol. 2023, 20, 12625–12644. [Google Scholar] [CrossRef]
  16. Liu, Q.; Qiao, J.; Li, M.; Dun, Y.; Zhu, X.; Ji, X. Spatiotemporal Evolution of Ecological Environmental Quality and Its Dynamic Relationships with Landscape Pattern in the Zhengzhou Metropolitan Area: A Perspective Based on Nonlinear Effects and Spatiotemporal Heterogeneity. J. Clean. Prod. 2024, 480, 144102. [Google Scholar] [CrossRef]
  17. Li, Y.; Qiao, X.; Wang, Y.; Liu, L. Spatiotemporal Patterns and Influencing Factors of Remotely Sensed Regional Heat Islands from 2001 to 2020 in Zhengzhou Metropolitan Area. Ecol. Indic. 2023, 155, 111026. [Google Scholar] [CrossRef]
  18. Qiao, X.; Li, Y.; Wang, Y.; Liu, L.; Zhao, S. The Influence of Climate and Human Factors on a Regional Heat Island in the Zhengzhou Metropolitan Area, China. Environ. Res. 2024, 249, 118331. [Google Scholar] [CrossRef]
  19. Alonzo, M.; McFadden, J.P.; Nowak, D.J.; Roberts, D.A. Mapping Urban Forest Structure and Function Using Hyperspectral Imagery and Lidar Data. Urban For. Urban Green. 2016, 17, 135–147. [Google Scholar] [CrossRef]
  20. Sun, W.; Liu, X. Review on Carbon Storage Estimation of Forest Ecosystem and Applications in China. For. Ecosyst. 2019, 7, 4. [Google Scholar] [CrossRef]
  21. Conti, G.; Gorné, L.D.; Zeballos, S.R.; Lipoma, M.L.; Gatica, G.; Kowaljow, E.; Whitworth-Hulse, J.I.; Cuchietti, A.; Poca, M.; Pestoni, S.; et al. Developing Allometric Models to Predict the Individual Aboveground Biomass of Shrubs Worldwide. Glob. Ecol. Biogeogr. 2019, 28, 961–975. [Google Scholar] [CrossRef]
  22. Flora of China. Available online: https://www.iplant.cn/frps2019/zongl (accessed on 2 March 2025).
  23. Flora of Henan. Available online: https://cfh.ac.cn/BioBook/HNFlora/1/1.html (accessed on 2 March 2025).
  24. Saaty, R.W. The Analytic Hierarchy Process—What It Is and How It Is Used. Math. Model. 1987, 9, 161–176. [Google Scholar] [CrossRef]
  25. Roman, L.A.; Battles, J.J.; McBride, J.R. The Balance of Planting and Mortality in a Street Tree Population. Urban Ecosyst. 2014, 17, 387–404. [Google Scholar] [CrossRef]
  26. Weather Spark. Available online: https://worldweather.wmo.int/zh/apps.html (accessed on 4 March 2025).
  27. McPherson, E.G.; Xiao, Q.; Aguaron, E. A New Approach to Quantify and Map Carbon Stored, Sequestered and Emissions Avoided by Urban Forests. Landsc. Urban Plan. 2013, 120, 70–84. [Google Scholar] [CrossRef]
  28. Chen, W.Y. The Role of Urban Green Infrastructure in Offsetting Carbon Emissions in 35 Major Chinese Cities: A Nationwide Estimate. Cities 2015, 44, 112–120. [Google Scholar] [CrossRef]
  29. Currie, W.S.; Kiger, S.; Nassauer, J.I.; Hutchins, M.; Marshall, L.L.; Brown, D.G.; Riolo, R.L.; Robinson, D.T.; Hart, S.K. Multi-Scale Heterogeneity in Vegetation and Soil Carbon in Exurban Residential Land of Southeastern Michigan, USA. Ecol. Appl. 2016, 26, 1421–1436. [Google Scholar] [CrossRef]
  30. Nowak, D.J.; Greenfield, E.J.; Hoehn, R.E.; Lapoint, E. Carbon Storage and Sequestration by Trees in Urban and Community Areas of the United States. Environ. Pollut. 2013, 178, 229–236. [Google Scholar] [CrossRef]
  31. Timilsina, N.; Staudhammer, C.L.; Escobedo, F.J.; Lawrence, A. Tree Biomass, Wood Waste Yield, and Carbon Storage Changes in an Urban Forest. Landsc. Urban Plan. 2014, 127, 18–27. [Google Scholar] [CrossRef]
  32. Fan, L.; Cai, T.; Wen, Q.; Han, J.; Wang, S.; Wang, J.; Yin, C. Scenario Simulation of Land Use Change and Carbon Storage Response in Henan Province, China: 1990–2050. Ecol. Indic. 2023, 154, 110660. [Google Scholar] [CrossRef]
  33. Song, X.; Yang, S.; Shao, L.; Fan, J.; Liu, Y. PM10 Mass Concentration, Chemical Composition, and Sources in the Typical Coal-Dominated Industrial City of Pingdingshan, China. Sci. Total Environ. 2016, 571, 1155–1163. [Google Scholar] [CrossRef]
  34. Zhao, Y.; Jiao, L. Resources Development and Tourism Environmental Carrying Capacity of Ecotourism Industry in Pingdingshan City, China. Ecol. Process. 2019, 8, 7. [Google Scholar] [CrossRef]
  35. Min, M.; Zhao, H.; Chen, M. Spatio-Temporal Evolution Analysis of the Urban Heat Island: A Case Study of Zhengzhou City, China. Sustainability 2018, 10, 1992. [Google Scholar] [CrossRef]
  36. Besnard, S.; Santoro, M.; Cartus, O.; Fan, N.; Linscheid, N.; Nair, R.; Weber, U.; Koirala, S. Global Sensitivities of Forest Carbon Changes to Environmental Conditions. Glob. Change Biol. 2021, 27, 6467–6483. [Google Scholar] [CrossRef] [PubMed]
  37. Sun, Y.; Xie, S.; Zhao, S. Valuing Urban Green Spaces in Mitigating Climate Change: A City-wide Estimate of Aboveground Carbon Stored in Urban Green Spaces of China’s Capital. Glob. Change Biol. 2019, 25, 1717–1732. [Google Scholar] [CrossRef] [PubMed]
  38. Wang, F.; Guo, H.; Zhang, Q.; Yu, Q.; Xu, C.; Qiu, S. Optimizing Ecological Spatial Network Topology for Enhanced Carbon Sequestration in the Ecologically Sensitive Middle Reaches of the Yellow River, China. Remote Sens. 2023, 15, 2308. [Google Scholar] [CrossRef]
  39. Chen, Y.; Wu, B.; Dong, C.; Qi, Y. Using Machine Learning to Assess Site Suitability for Afforestation with Particular Species. Forests 2019, 10, 739. [Google Scholar] [CrossRef]
  40. Coelho, M.C.M.; Gabriel, R.; Ah-Peng, C. Characterizing and Quantifying Water Content in 14 Species of Bryophytes Present in Azorean Native Vegetation. Diversity 2023, 15, 295. [Google Scholar] [CrossRef]
  41. Asplund, M.E.; Dahl, M.; Ismail, R.; Arias-Ortiz, A.; Deyanova, D.; Franco, J.N.; Hammar, L.M.; Hoamby, A.I.; Linderholm, H.W.; Lyimo, L.D.; et al. Dynamics and Fate of Blue Carbon in a Mangrove–Seagrass Seascape: Influence of Landscape Configuration and Land-Use Change. Landsc. Ecol. 2021, 36, 1489–1509. [Google Scholar] [CrossRef]
  42. Dong, H.; Chen, Y.; Huang, X.; Cheng, S. Multi-Scenario Simulation of Spatial Structure and Carbon Sequestration Evaluation in Residential Green Space. Ecol. Indic. 2023, 154, 110902. [Google Scholar] [CrossRef]
  43. Liu, Y.; Yang, Q.; Duan, L. Adjusting the Structure Combinations of Plant Communities in Urban Greenspace Reduced the Maintenance Energy Consumption and GHG Emissions. J. Environ. Eng. Landsc. Manag. 2018, 26, 261–274. [Google Scholar] [CrossRef]
  44. Hou, D.; Al-Tabbaa, A.; O’Connor, D.; Hu, Q.; Zhu, Y.-G.; Wang, L.; Kirkwood, N.; Ok, Y.S.; Tsang, D.C.W.; Bolan, N.S.; et al. Sustainable Remediation and Redevelopment of Brownfield Sites. Nat. Rev. Earth Environ. 2023, 4, 271–286. [Google Scholar] [CrossRef]
  45. Song, Y.; Kirkwood, N.; Maksimovic, C.; Zhen, X.; O’Connor, D.; Jin, Y.; Hou, D. Nature Based Solutions for Contaminated Land Remediation and Brownfield Redevelopment in Cities: A Review. Sci. Total Environ. 2019, 663, 568–579. [Google Scholar] [CrossRef]
  46. Karimi, J.D.; Corstanje, R.; Harris, J.A. Bundling Ecosystem Services at a High Resolution in the UK: Trade-Offs and Synergies in Urban Landscapes. Landsc. Ecol. 2021, 36, 1817–1835. [Google Scholar] [CrossRef]
  47. Kronenberg, J.; Andersson, E.; Barton, D.N.; Borgström, S.; Langemeyer, J.; Björklund, T.; Haase, D.; Kennedy, C.; Koprowska, K.; Łaszkiewicz, E.; et al. The Thorny Path toward Greening: Unintended Consequences, Trade-Offs, and Constraints in Green and Blue Infrastructure Planning, Implementation, and Management. Ecol. Soc. 2021, 26, art36. [Google Scholar] [CrossRef]
  48. Barbierato, E.; Bernetti, I.; Capecchi, I.; Saragosa, C. Integrating Remote Sensing and Street View Images to Quantify Urban Forest Ecosystem Services. Remote Sens. 2020, 12, 329. [Google Scholar] [CrossRef]
  49. Jiang, Y.; Sun, Y.; Liu, Y.; Li, X. Exploring the Correlation between Waterbodies, Green Space Morphology, and Carbon Dioxide Concentration Distributions in an Urban Waterfront Green Space: A Simulation Study Based on the Carbon Cycle. Sustain. Cities Soc. 2023, 98, 104831. [Google Scholar] [CrossRef]
  50. Dong, L.; Wang, Y.; Ai, L.; Cheng, X.; Luo, Y. A review of research methods for accounting urban green space carbon sinks and exploration of new approaches. Front. Environ. Sci. 2024, 12, 1350185. [Google Scholar] [CrossRef]
  51. Chen, D.; Neumann, K.; Friedel, S.; Kilian, B.; Chen, M.; Altmann, T.; Klukas, C. Dissecting the Phenotypic Components of Crop Plant Growth and Drought Responses Based on High-Throughput Image Analysis. Plant Cell 2014, 26, 4636–4655. [Google Scholar] [CrossRef]
  52. Dybala, K.E.; Steger, K.; Walsh, R.; Gardali, T.; Seavy, N.E. Optimizing carbon storage and biodiversity co-benefits in reforested riparian zones. J. Appl. Ecol. 2018, 56, 343–353. [Google Scholar] [CrossRef]
  53. Calvo, L.; Huerta, S.; Marcos, E.; Calvo-Fernández, J.; Taboada, Á. The role of prescribed fire in the provision of regulating ecosystem services of Spanish heathlands. Ecol. Quest. 2015, 21, 71–73. [Google Scholar] [CrossRef]
  54. Zhang, J.; Li, S.; Sun, X.; Tong, J.; Fu, Z.F.; Li, J. Sustainability of Urban Soil Management: Analysis of Soil Physicochemical Properties and Bacterial Community Structure under Different Green Space Types. Sustainability 2019, 11, 1395. [Google Scholar] [CrossRef]
  55. Han, J.; Dong, Y.; Ren, Z.; Wang, C.; Jia, G.; Zhang, P.; Guo, Y. Remarkable Effects of Urbanization on Forest Landscape Multifunctionality in Urban Peripheries: Evidence from Liaoyuan City in Northeast China. Forests 2021, 12, 1779. [Google Scholar] [CrossRef]
  56. Yu, Z.; Yang, G.; Zuo, S.; Jørgensen, G.; Koga, M.; Vejre, H. Critical review on the cooling effect of urban blue-green space: A threshold-size perspective. Urban For. Urban Green. 2020, 49, 126630. [Google Scholar] [CrossRef]
  57. Gao, Z.; Song, K.; Pan, Y.; Malkinson, D.; Zhang, X.; Jia, B.; Tiyuan, X.; Guo, X.; Liang, H.; Huang, S.; et al. Drivers of spontaneous plant richness patterns in urban green space within a biodiversity hotspot. Urban For. Urban Green. 2021, 61, 127098. [Google Scholar] [CrossRef]
  58. Tong, S.; Wang, W.; Chen, J.; Xu, C.-Y.; Sato, H.; Wang, G. Impact of changes in climate and CO2 on the carbon storage potential of vegetation under limited water availability using SEIB-DGVM version 3.02. Geosci. Model Dev. 2022, 15, 7075–7098. [Google Scholar] [CrossRef]
  59. Lv, H.; Wang, W.; He, X.; Wei, C.; Lu, X.; Zhang, B.; Zhou, W. Association of urban forest landscape characteristics with biomass and soil carbon stocks in Harbin City, Northeastern China. PeerJ 2018, 6, e5825. [Google Scholar] [CrossRef]
  60. Huo, Z.; Liu, G.; Yan, N.; Li, H.; Shah, A.M.; Chen, Y.; Zhao, B.; Lu, Z.; Ghisellini, P. Estimating the contribution of community landscape construction to urban carbon neutrality: Methodology and database construction. Environ. Res. Lett. 2023, 18, 104035. [Google Scholar] [CrossRef]
Figure 1. Study Area and Sample Site Distribution.
Forests 16 00536 g001
Figure 2. Application scenario identification and evaluation factor selection and criteria. Note: The image Road, Building and Water is the author’s own drawing, the rest of the icons are from the Internet.
Forests 16 00536 g002
Figure 3. Climate similarity. (a) a comparison of mean monthly precipitation and temperature, (b) a comparison of sunshine duration and growing season.
Forests 16 00536 g003
Figure 4. Landscape Plant Characteristics. (ae) being trees, (fj) being shrubs.
Forests 16 00536 g004
Figure 5. Significant differences in carbon stock density and carbon sequestration density between different cities (a,b) and different green space types (c,d). a–c represent significant differences between different cities or green space types by Fisher’s least significant test (p < 0.05). Error bars are standard errors of the mean.
Forests 16 00536 g005
Figure 6. Tree clustering classification. (a) is the clustered 3D, and (bd) are the projections on the z, y, and x axes, respectively.
Forests 16 00536 g006
Figure 7. Shrubs clustering classification. (a) is the clustered 3D, and (bd) are the projections on the z, y, and x axes, respectively.
Forests 16 00536 g007
Figure 8. Change in CES capacity pre-optimization and post-optimization of the three scenarios. (ac) are road, building, and water scenarios, respectively. The grey squares are a simplification of the building.
Forests 16 00536 g008
Table 1. Type and number of urban sample sites.
CityPGSPAGSAGSSGSRGSTotal
Jiyuan9594330
Jiaozuo149264659
Kaifeng1920444693
Luoyang3529472611148
Luohe14122881274
Pingdingshan35294726858
XuChang20194541098
Xinxiang188267665
Zhengzhou60671663224349
Table 2. Comparison with results of other studies.
CityCS
(kg C m−2)
CSE
(kg C m−2 y−1)
CS
(kg C m−2)
CSE
(kg C m−2 y−1)
Source
ZAM, CN9.320.55Zhengzhou, CN8.600.60This study
Luoyang, CN10.590.58Kaifeng, CN6.810.76This study
Pingdingshan, CN12.940.55Xinxiang, CN11.220.61This study
Luohe, CN4.110.31Xuchang, CN8.560.36This study
Jiaozuo, CN8.390.44Jiyuan, CN6.460.52This study
Henan, CN6.38 China2.10.21[15,32]
Barcelona, Spain1.12 Florida, FL, USA10.70 [27,29]
Michigan, USA14.20 [31]
Hartford, CT, USA10.890.33Lincoln, NE, USA 10.641.74[30]
Moorestown, NJ, USA 9.950.93Morgantown, WV, USA 9.521.16[30]
New York, NY, USA7.331.10Omaha, NE, USA 14.142.29[30]
Roanoke, VA, USA9.201.33San Francisco, CA, USA 9.182.25[30]
Scranton, PA, USA9.241.28 [30]
Disclaimer/Publisher’s Note: The statements, opinions and data contained in all publications are solely those of the individual author(s) and contributor(s) and not of MDPI and/or the editor(s). MDPI and/or the editor(s) disclaim responsibility for any injury to people or property resulting from any ideas, methods, instructions or products referred to in the content.

